
Cohort analysis answers a business question about how a specific group or segment of users has interacted with a product, or is expected to interact with a product, based on their prior behaviors. By obtaining behavioral data and breaking it down into cohorts, it becomes easier to analyze.
Cohorts are groups of users that share specific characteristics and usage patterns over a period of time. These could include things like usage time, features signed up for, or the number of goals completed. Cohorts are useful because they help you segment your user base and collect data about the way they interact with your product throughout their lifecycle.
Businesses should use cohort analysis to understand user behavior and improve customer retention. The data you obtain is a great way to understand what causes new customers to stick around and some of the common reasons why they churn.
- Cohort analysis is an important method for measuring the results of different experiments designed to drive engagement, boost conversions, and prevent customer churn, which leads to stable revenue and sustainable growth.
- Product managers and marketers use cohort analysis to test hypotheses about how customers engage with their products. Then, they put those insights to use to drive revenue, retention, conversions, and other business metrics.
- Cohort analysis should be used to improve customer retention by helping you understand more about the experiences of different user groups or segments.
- Cohort retention analysis helps build a retention process consisting of:
- Setting goals
- Exploring data
- Hypothesizing
- Brainstorming
- Testing
- Analyzing
- Systematizing
- Cohort analysis can be used to parse three types of data—acquisition, behavioral, and predictive. Each can be used to answer different types of business questions.
- The right tool transforms cohort analysis from a labor-intensive, technical, manual process into an automated, real-time, nontechnical process.
- Conducting your own cohort analysis using Amplitude allows you to delve deeper into your customers’ behaviors and make data-driven decisions to enhance the customer experience.
What is cohort analysis?
A cohort is a group or segment of users who share common profile traits, behaviors, or both. For example:
- Users who own iOS devices
- Users who logged in every day last week
- Users who own iOS devices who logged in every day last week
Typically, a product manager or marketer poses a business question, which prompts cohort analysis. Those questions can revolve around product engagement, conversion, or retention.
- Engagement is the term for actions people take within your app. That could be leveling up a character in a game, sharing a workout with the community in a fitness app, or playing a song in a music app.
- Conversion is the ultimate goal. Cohort analysis can be used to judge whether different incentives for conversion, like new features or discounted rates, are effective.
- Retention refers to the people who are coming back to your app time and time again.
Try creating a cohort comparison in Amplitude’s self-service demo or explore cohorts within your own data using our free starter plan.
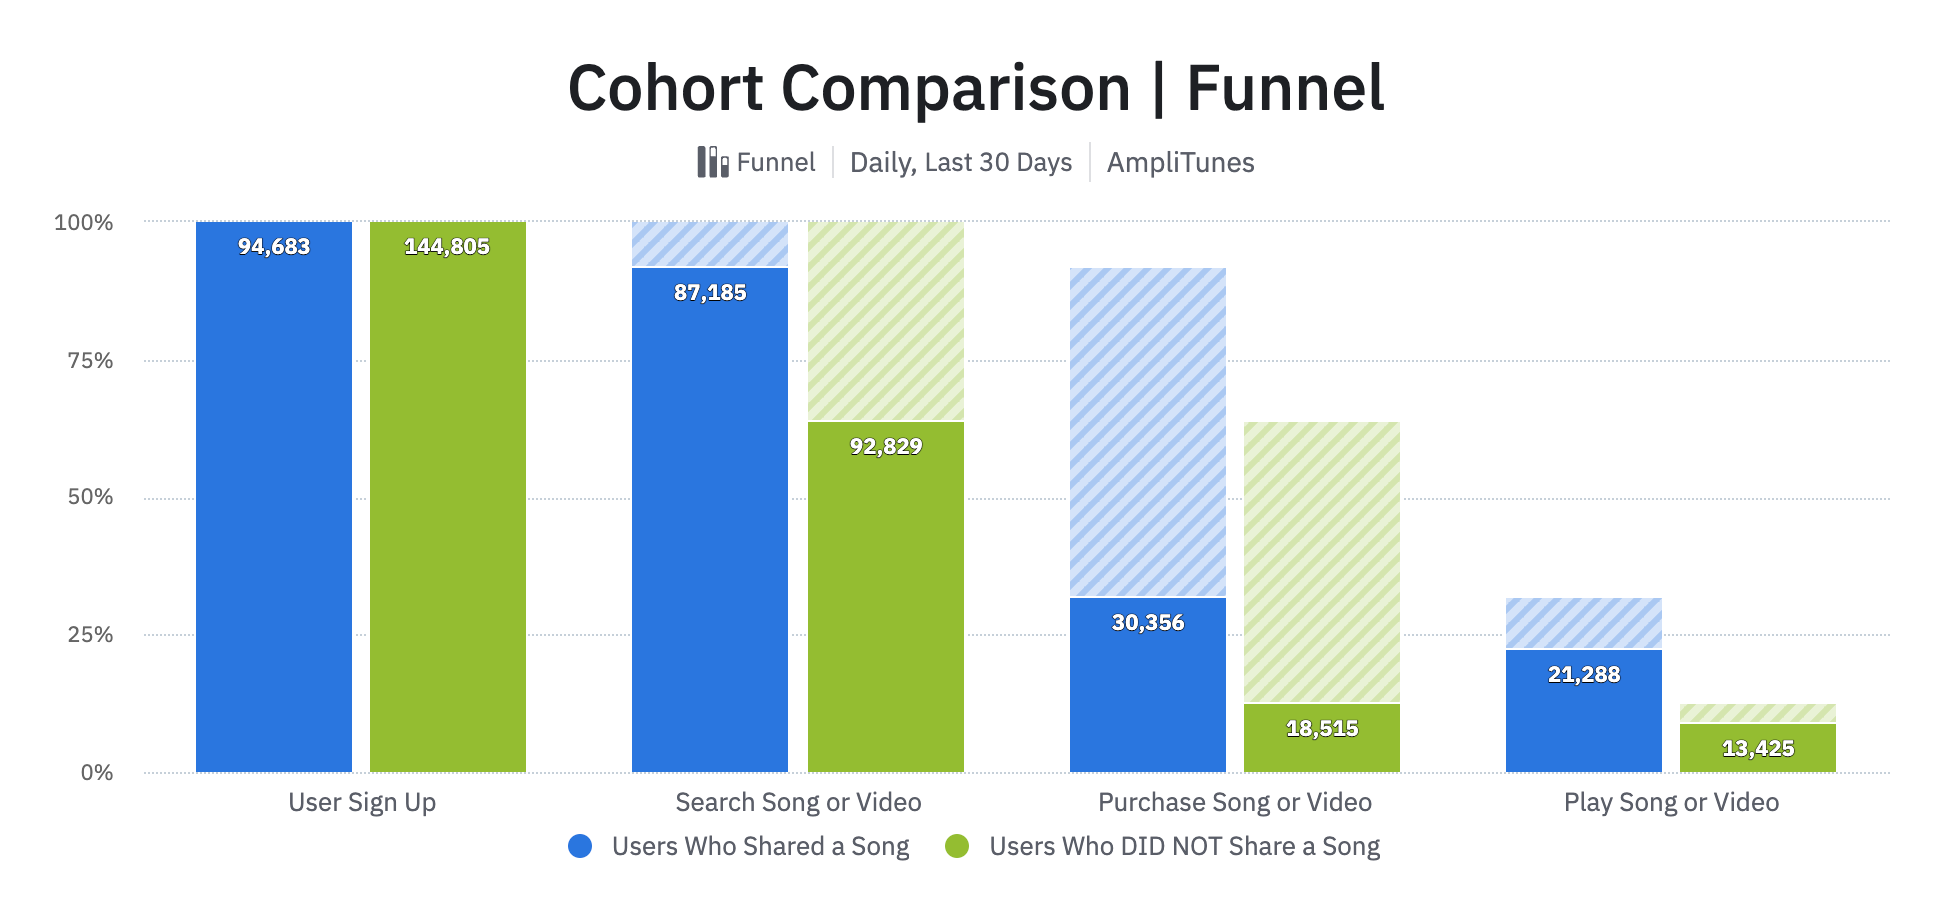
In the example chart above, you can see the user journey for two different cohorts—users who shared a song (green) and those who did not (blue). The cohort of users who shared a song had higher engagement and conversion.
Now let’s take a closer look at how cohort analysis can be used to help product managers reduce customer churn and improve retention rates.
Importance of preventing customer churn
Cohort analysis is critical because metrics like daily or monthly active users (DAU and MAU) are highly distorted by growth. If your app is growing rapidly, new user signups will mask where your existing users are dropping off. It doesn’t matter how productive your acquisition channels are if you lose current customers as fast as, or faster than, you gain new ones.
That’s why conducting a churn rate cohort analysis is one of the most effective ways to improve the health of your business. Customers who make repeat purchases help a business build stable revenue and offset the costs of attracting new customers. According to the Business of Apps, the cost of advertising per install for mobile apps reached $5.28. A longer customer lifecycle pays higher dividends for that investment.
To learn more about calculating customer churn, check out this video where I walk through 6 clicks in Amplitude that show you how to calculate churn rate across industries and quarters. If you want to dive deeper into specific industries like SaaS, read our post on SaaS cohort analysis.
How to build a retention strategy using cohort analysis
The most powerful aspect of cohort analysis is that you’ll not only see customers leave and when, but you can also start to understand why your customers leave your app—so that you can fix it. You can improve your retention rate by implementing the following process:
- Set goals: Establish a goal for the process. Do you want to reduce churn in the short term? Long term? What is your growth target?
- Explore: Examine current data to see where changes can be made to reach your goal.
- Hypothesize: Decide what questions to ask and possible outcomes from experiments.
- Brainstorm: Conceive possible experiments to test hypotheses.
- Test: Run different tests to evaluate hypotheses.
- Analyze: Analyze test data to see whether goals were met.
- Systematize: Make any positive changes a part of the system.
Through this system, you can continually improve your app and increase retention. Rather than looking at an aggregated churn number, you’re targeting a specific behavior and testing to see whether encouraging users to adopt that behavior improves retention.
Using cohort analysis to improve customer retention
A customer cohort analysis report can be used to test a hypothesis about how certain product changes affect key performance indicators for a business.
For example, suppose you are a product manager of a music app like Spotify, and one of your primary goals is to increase user retention.
You may form a hypothesis that users who share a given number of songs with their friends are more likely to become regular, retained users of your app.
To test this hypothesis, first, you select a group or cohort of users based on their acquisition date. Then, you split this acquisition cohort into two subsets. In one cohort subset are the users who used the ‘share song’ feature at least once. The other cohort subset comprises users who did not use the ‘share’ feature.
Finally, run a retention analysis based on the behavioral analytics of these two cohort subsets.
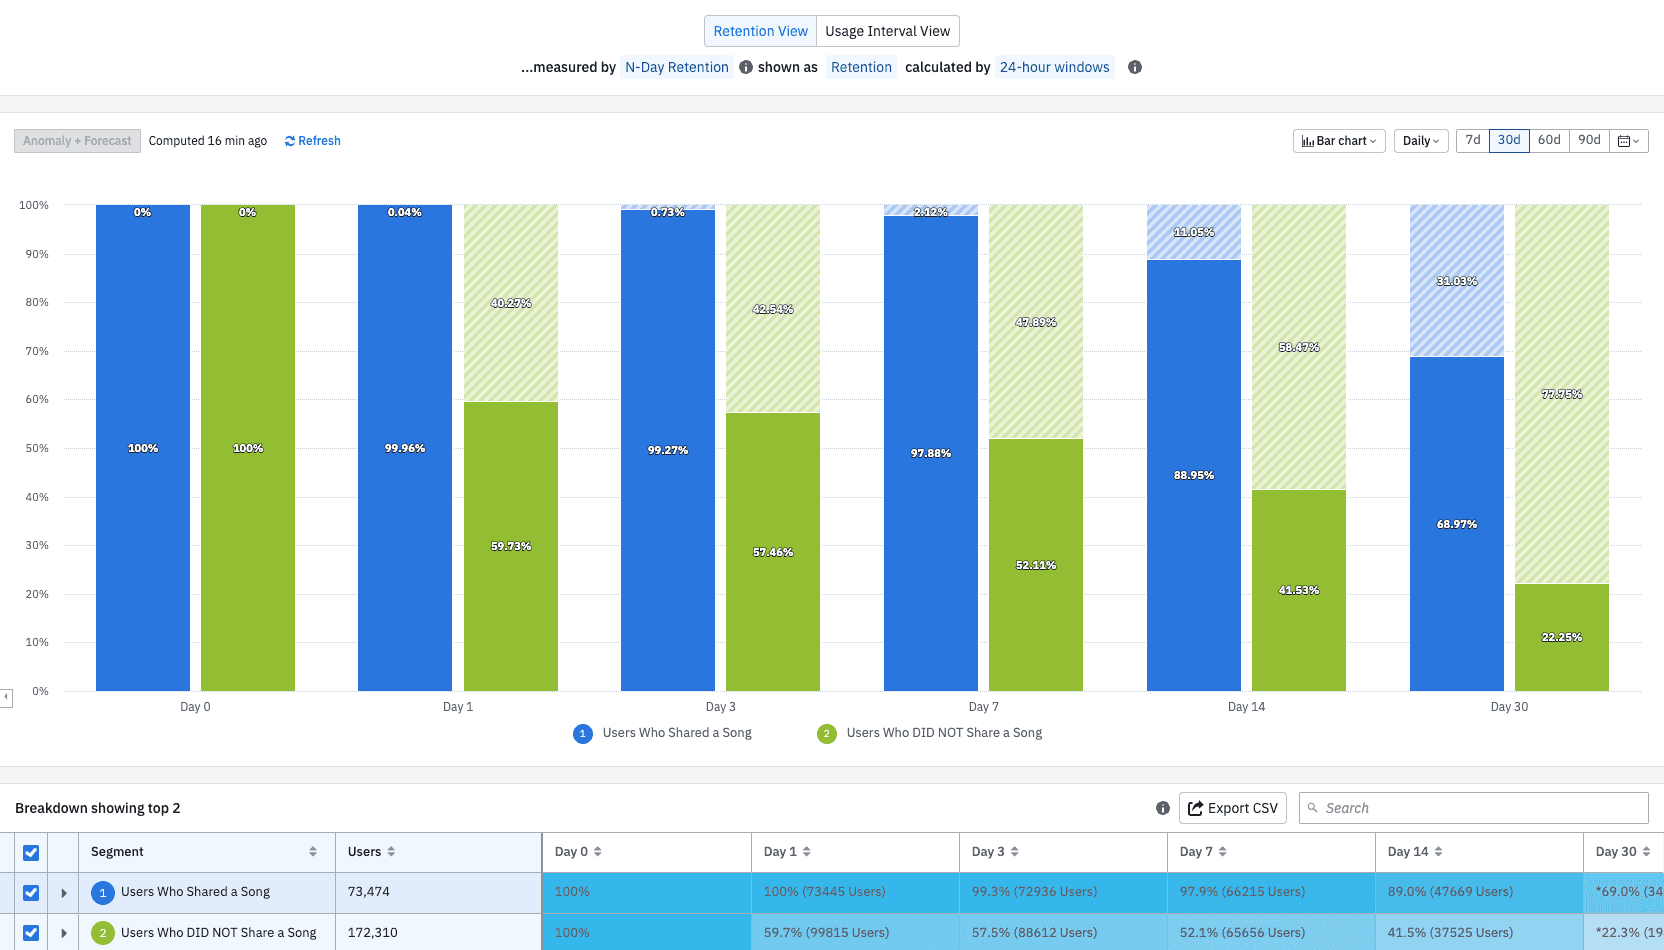
In this case, the cohort analysis chart above shows the N-day retention rates for users who shared a song (blue) compared to those who did not (green). You can see that users who don’t share a song have a churn rate of 77.75% after 30 days. Meanwhile, churn for users who did use the share feature is only 31%.
That’s a significant difference, and that data set now gives you the chance to make a business decision that could lead to more revenue. For example, in the next update, you could tweak your onboarding flow to prompt new users to share a song rather than wait for them to discover that feature on their own.
Types of cohort data
There are three types of cohort data, and they each have different use cases.
Acquisition cohorts
Acquisition cohorts divide users based on when they signed up for your product. A consumer app might group cohorts by the day they sign up, whereas a SaaS tool is more likely to track monthly cohorts.
Acquisition cohorts are used to track new users and see how long they continue to use your app after their initial interaction—the length of your customer’s lifetime. This can be a great way to experiment with your onboarding experience to ensure users see your product’s value clearly and early. The sooner new users have that “aha!” moment, the more likely they are to be retained.
Behavioral cohorts
Behavioral cohorts are a custom segment of your audience based on any combination of past behaviors or user profile properties.
Some examples of user behaviors include sharing a song, signing up for a trial, or making a purchase. User profile properties are things like demographics, what platform a visitor uses, or how someone arrives on your website.
The combination of behaviors and profile properties collectively make up a behavioral cohort. This type of cohort data is a way of looking at actions within a certain time frame to identify similar types of users for analysis. That analysis usually reveals how users engage with your product and how that user engagement affects things like retention, conversion rate, or other key indicators that matter to your business.
Predictive cohorts
Predictive cohorts look at what a user is expected to do in the future.
This type of data is best for determining which users to target with a marketing campaign or deciding how to adjust pricing to increase the chances a user takes an action.
Acquisition cohorts: Finding problem moments in your app
Acquisition cohorts give you information about your customers’ lifecycle—specifically, how long it takes them to churn after their acquisition date. This information can help you identify churn patterns or marketing campaigns with high conversion rates. Say you have a music app that is experiencing a churn problem with users dropping off each day.
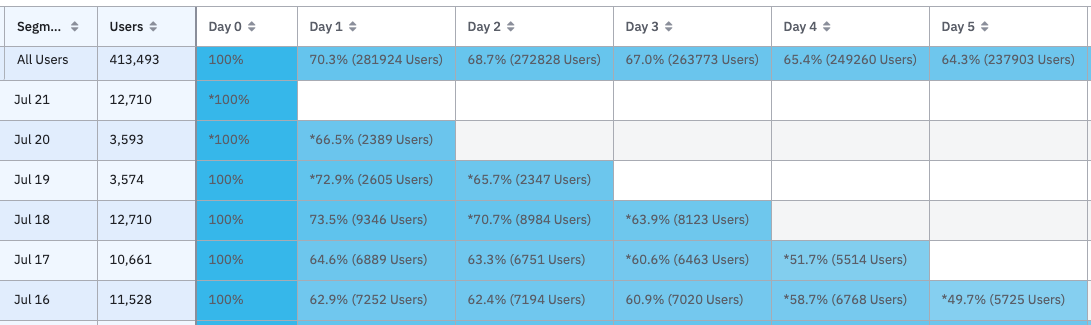
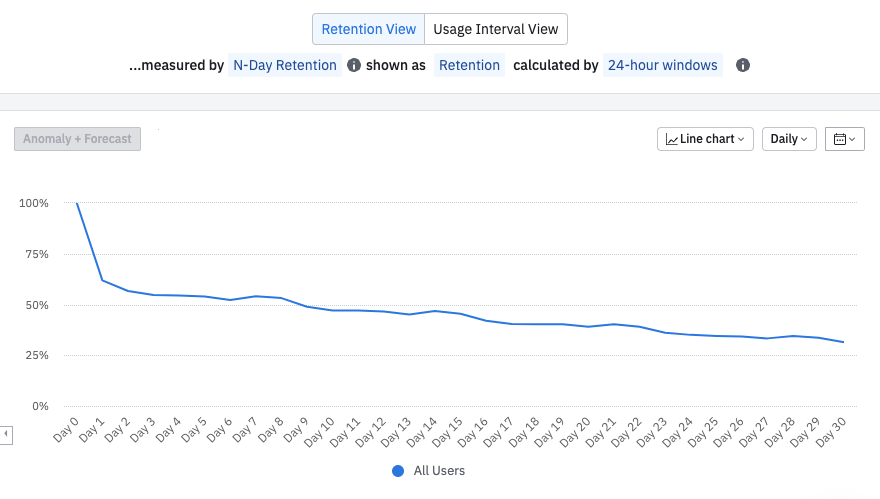
The users in the retention chart above are split into daily cohorts—users who signed up on the same day. You can see that 11,528 users signed up for your music app on July 16, and Day 5 retention was 49.7%. So one in two users who signed up on July 16 were still active users in the app on the fifth day after first using the app.
The best way to visualize this information is to turn it into a retention analysis curve, which shows your retention for these cohorts over time. When you chart your data like this, it becomes easy to see when users are leaving your product.
Learn about the acquisition cohorts in your data by using Amplitude’s free starter plan.
This retention curve immediately tells you something important: about a third of users stop using the app after the first day. After that initial drop, the curve continues to steadily decrease, leaving only a little more than 25% of the original users still active in the app on day 30.
That’s not great (although it is common—some data shows that the average app loses nearly 60% of its users within the first month). Early retention is a significant issue. A curve like this indicates that users aren’t getting the core value out of the app quickly enough, so they are leaving. Now you know that you need to improve the early app experience to get users to your core value as quickly as possible.
Hitting the limits of acquisition cohorts
If your app has the retention curve shown above, you immediately want to figure out what you can do to boost your retention.
Acquisition cohorts alone don’t give any information about how you can improve the user experience to retain your users. You can’t isolate specific behaviors or user properties.
Acquisition cohorts are great for showing you trends and telling you when people are churning, but to understand why they are leaving, you need to turn to another type of cohort: behavioral cohorts.

Try performing a cohort analysis using Amplitude’s free self-service demo.
Behavioral cohorts: Discover which behaviors drive retention
From the moment users sign up with your product, they make hundreds of decisions and exhibit countless little behaviors that lead to their decision to stay or go. By segmenting your users based on these behaviors, you can obtain information about what features in your product drive growth.
When reworking your user onboarding to optimize retention, you’ll have to identify the most effective way to do so. Rather than choosing what to work on based on anecdotes or random choices, behavioral cohorts allow you to decide on an approach systematically and quantitatively. Behavioral cohorts group users based on the specific actions that they have (or haven’t) taken.
Finding the right cohorts
For your music app, you can create different user cohorts from actions like playing a song, searching for an artist, or creating a playlist.
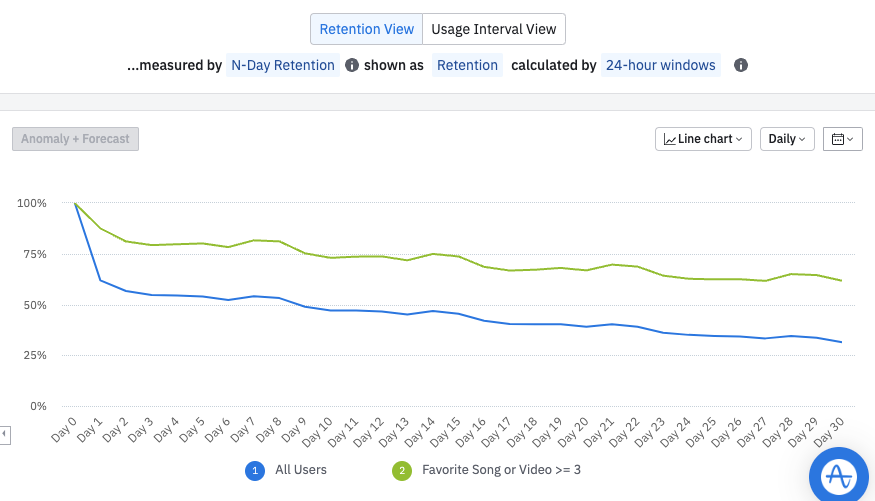
Say you wanted to see the retention of users that favorited songs in the app. You can use behavioral cohorts to look at retention for new users who favorited three or more songs:
Discover behavioral cohorts within your own data by getting started with Amplitude for free.
While almost 40% of all users (blue) churn within one day of using the app, only about 15% of users who favorite three or more songs (green) drop off after day one.
Inverting cohorts
Now that you know how retention changes for users who interact with the favorite feature, you can also look at how it changes for those who do not. Below is the retention for users who did not favorite a song:
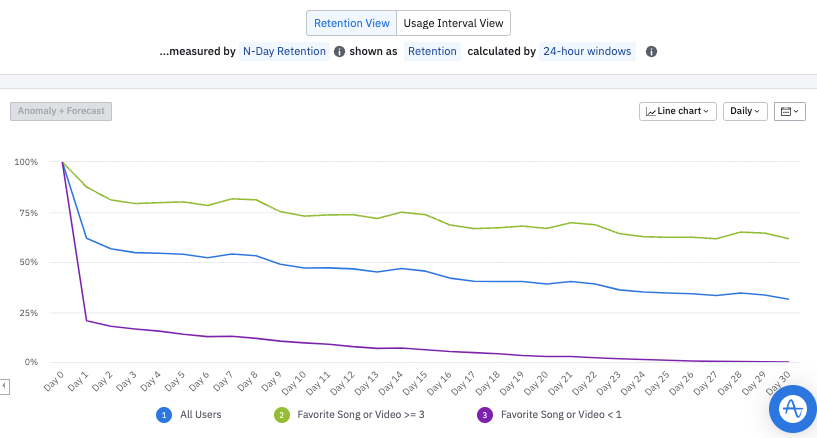
Users who did not favorite a song at all (purple) have worse retention than most—more than 75% of these users churn after the first day.
From this simple visualization, you can see that getting people to favorite songs early in their experience allows them to discover the app’s core value, meaning that they are more likely to continue as users. Now that you have this data, you can put it into action by emphasizing the favorite songs feature during onboarding. That will lead to more users favoriting songs early in their customer journeys and ultimately to better retention rates.
Combining cohorts
You can create behavioral cohorts based on any action that can be performed in your product. This means that you can correlate any number of different user actions with user retention rates.
For example, your music app has a feature that lets people join communities based on their favorite genres. You can extract that data set to see if that helps improve retention or if it is a functionality that makes no difference to their lifetime value.
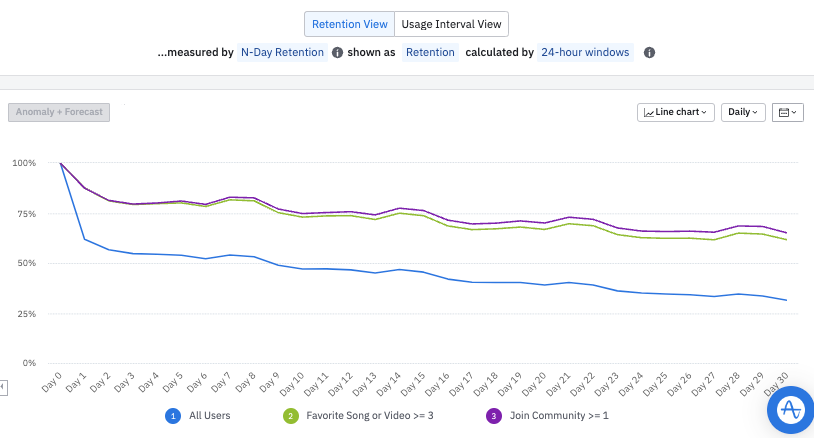
Here you can see that the initial retention for users who join communities (purple) is similar to users who favorite songs (green), but it’s slightly better by the end of Day 30, and much better than all users (blue).
As users get involved with other people and find more music to play, they start to enjoy the app more and continue using it. You would probably hypothesize this in your retention process, but now you have data to back up your hypothesis.
Combining different behavioral cohorts gives you a better understanding of the relationships between the different features of your product and how they are likely to drive retention.
Finding the right combinations
What about users who favorite songs and join communities? Using Amplitude, you can filter your actions to combine these two cohorts:
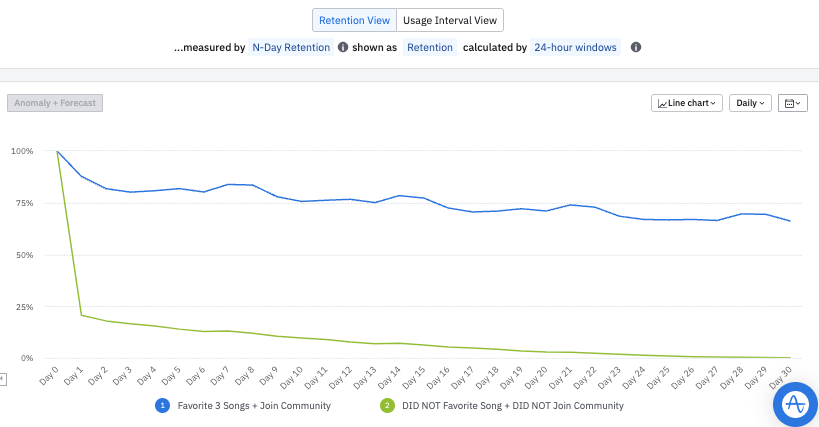
As you can see, users exhibiting both of these behaviors are far more likely to keep using the app in those first few weeks. At the end of the first week, retention is above 75% for the favorite + community cohort (blue), whereas it’s under 25% for users without either of these behaviors (green).
Correlation, not causation
Just because people who favorite songs and join communities churn less doesn’t mean that driving people toward these behaviors will automatically reduce your churn rate. For example, a call-to-action getting them to join 20 communities upon signing up will probably push people away.
That’s because correlation does not imply causation. Favoriting songs and joining communities could be merely correlated with user engagement, not causing it. To determine causation, you might A/B test different onboarding flows that emphasize favoriting songs to see if it increases retention.
Once you have data from behavioral cohorts, you can start to run experiments using an A/B testing tool like Amplitude Experiment to test behaviors that may be related to retention. You can see what works and what doesn’t and systematically increase your retention.
Predictive cohorts: Increase your marketing ROI
You can use predictive cohorts to determine how likely a user is to purchase a song in the future based on their behavioral cohort.
One way to answer this business question is to take a cohort of new users who shared a song over a period of time, let’s say in the last 14 days, and run a prediction analysis. This type of analysis works best if you have a cohort size of more than 100,000 users because you need enough data for the machine learning model to make a prediction. After about 30 to 60 minutes, the model will rank specific cohorts based on who is most likely to take a given action, such as purchasing a song.
Again, you now have data in a simple cohort chart to inform an effective business decision. For example, you could focus on the top 5% of users who are most likely to buy a song. Select that cohort, put those users into a third-party tool, and target them for a marketing campaign. This could be a push notification, an email, or an SMS alert to encourage them to take an action. In this case, making a purchase.
At the same time, you could look at the 20% of users the predictive analysis determined were least likely to take your preferred action and choose not to target any marketing dollars their way since it’s unlikely to yield any results. Alternatively, you might conclude that the group of users simply needs a different, or greater, incentive. Maybe sending a 50% discount coupon their way will prove to be an offer so good they can’t refuse it.
Either way, you can measure the reaction of these cohorts to your new direction and keep adjusting your marketing investments based on your analysis.
Tools for cohort analysis
Modern markets move fast, and businesses that can’t make fast decisions based on accurate data stand to lose revenue. Without the right analytics tools, nontechnical teams needing data to make better business decisions must rely on data analysts and data engineers.
That can mean submitting a ticket with the data team and waiting days or even weeks for time-starved analysts to deliver spreadsheets. Then, it requires someone on your team having enough time to comb through that data and look for insights.
Amplitude: How the right cohort analysis tool speeds up business decisions
With Amplitude, product managers and marketers can answer their own questions by performing a self-service cohort analysis in any of three ways.
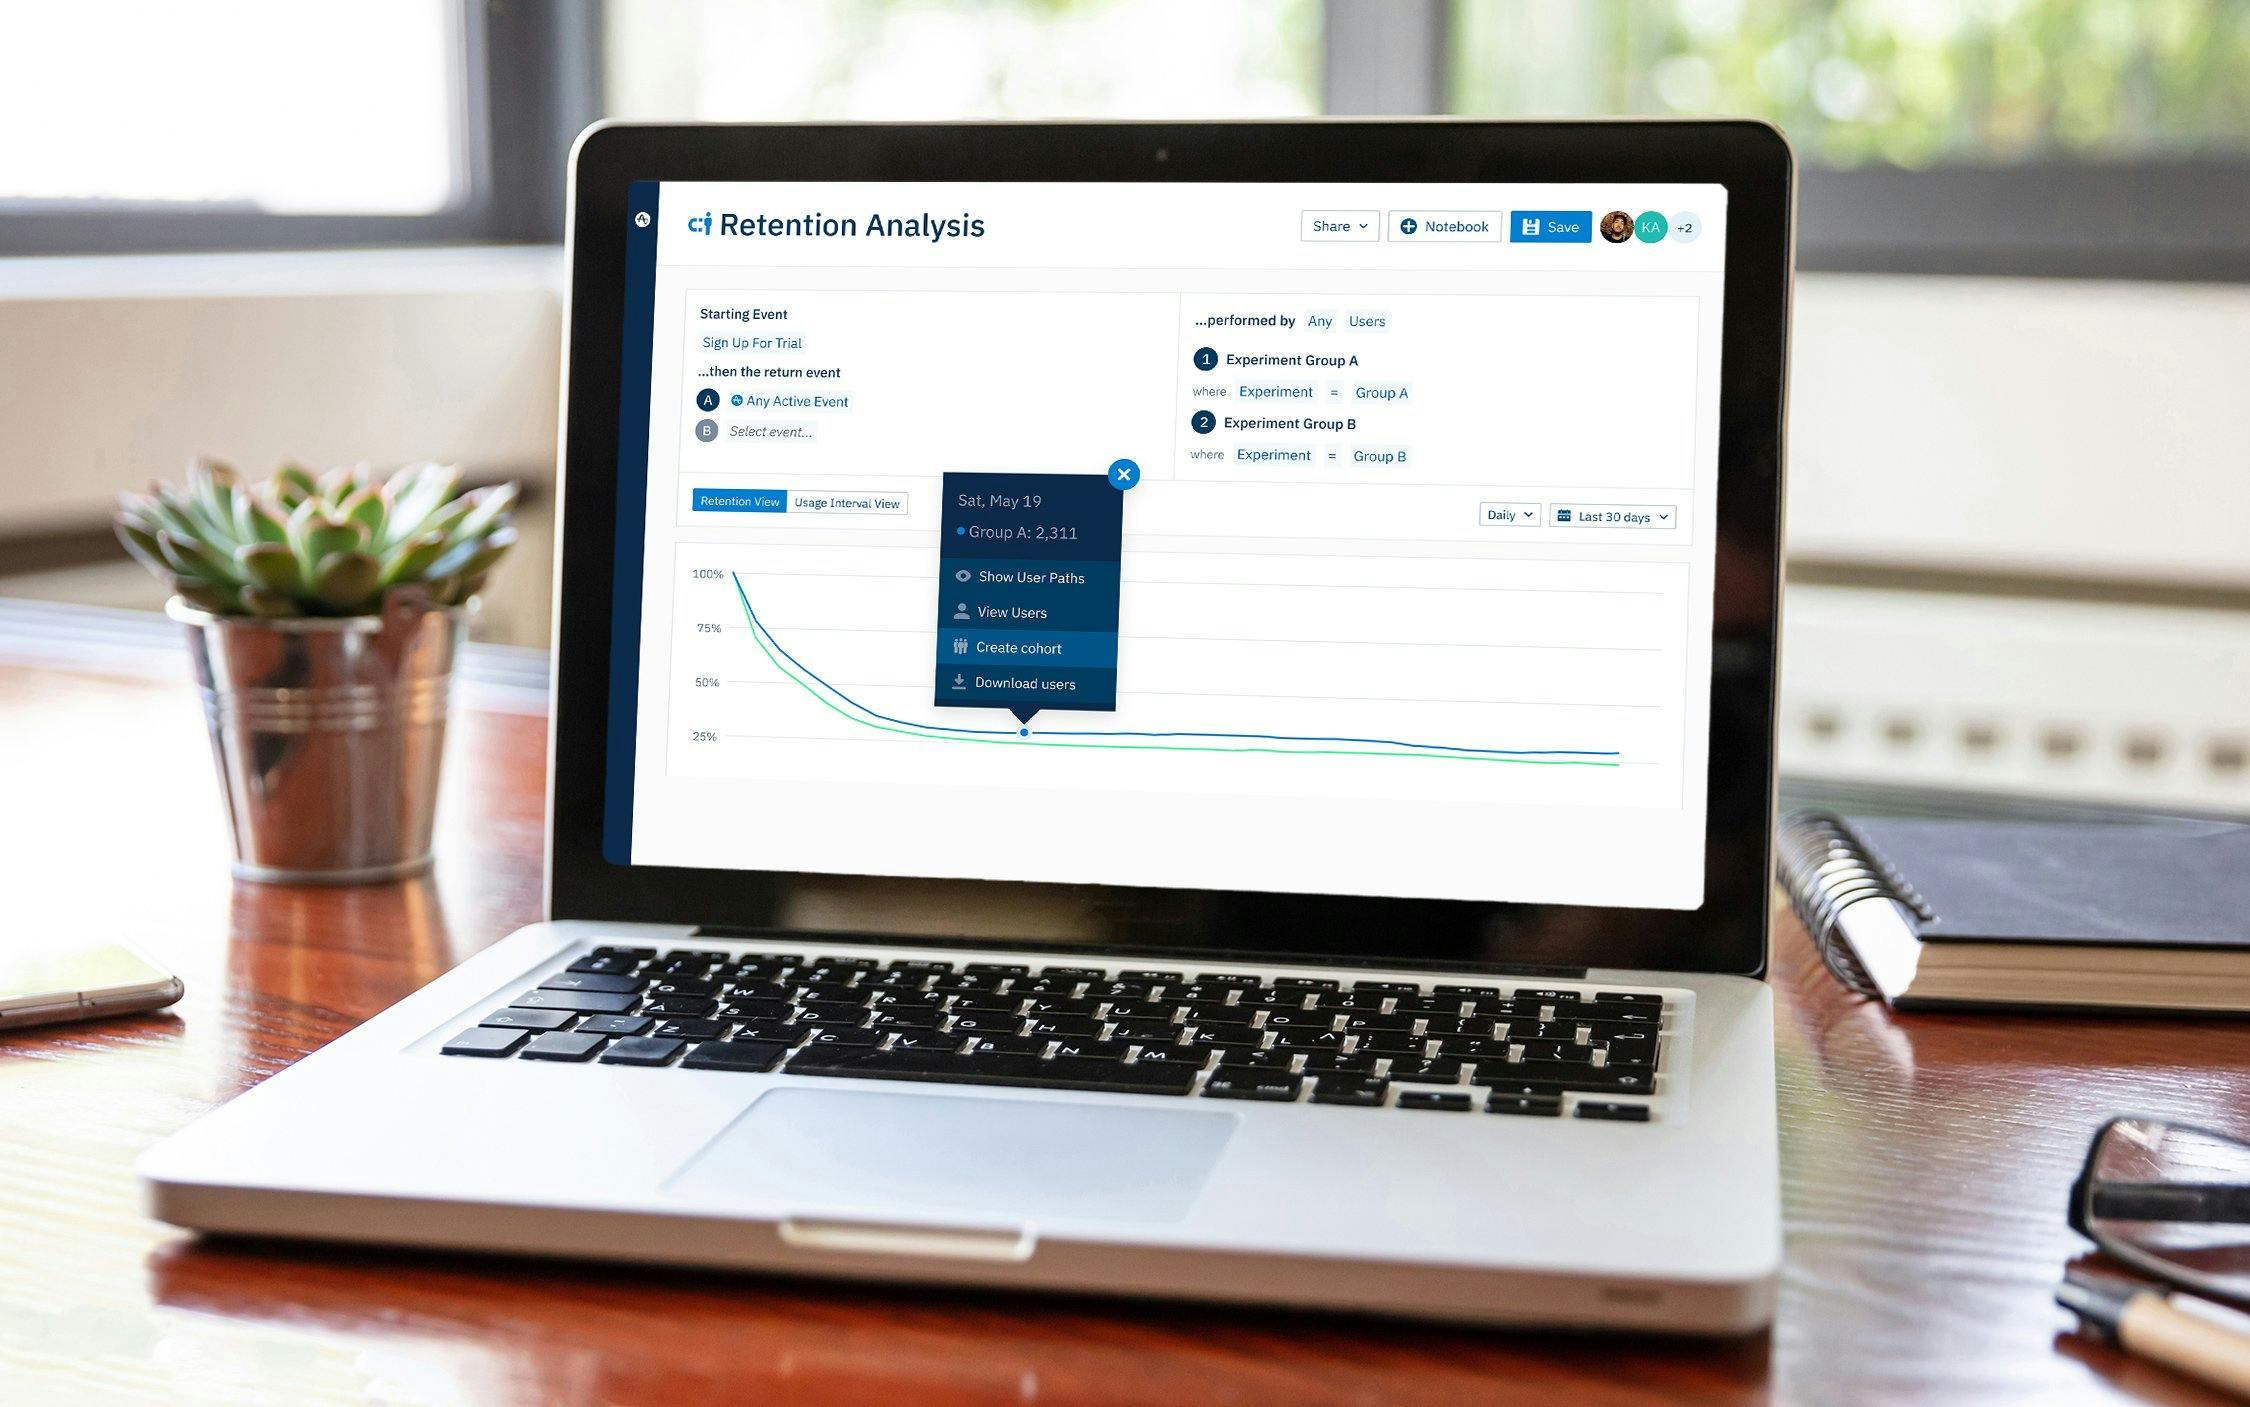
1. You can build a cohort within any chart in Amplitude, like the Retention Analysis chart below. Here, you can select any combination of behaviors and profile properties, like users who favorite a song or join a community.
Building a cohort within an Amplitude chart is a simple way to perform a quick analysis.
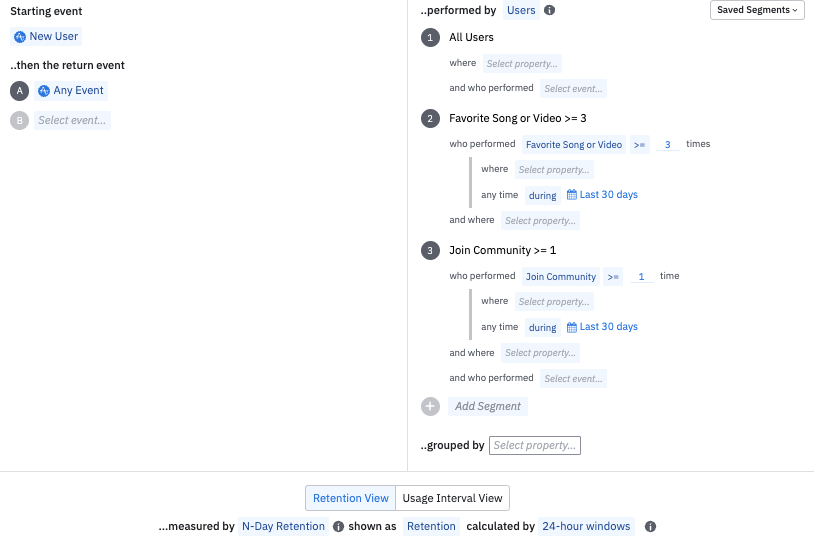
2. You can also use a dedicated Cohorts section to build custom cohort definitions based on your particular parameters. This custom cohort can then be used in other charts. For example, the cohort below shows new, active users on iOS who shared a pop or rock song in the last 30 days.
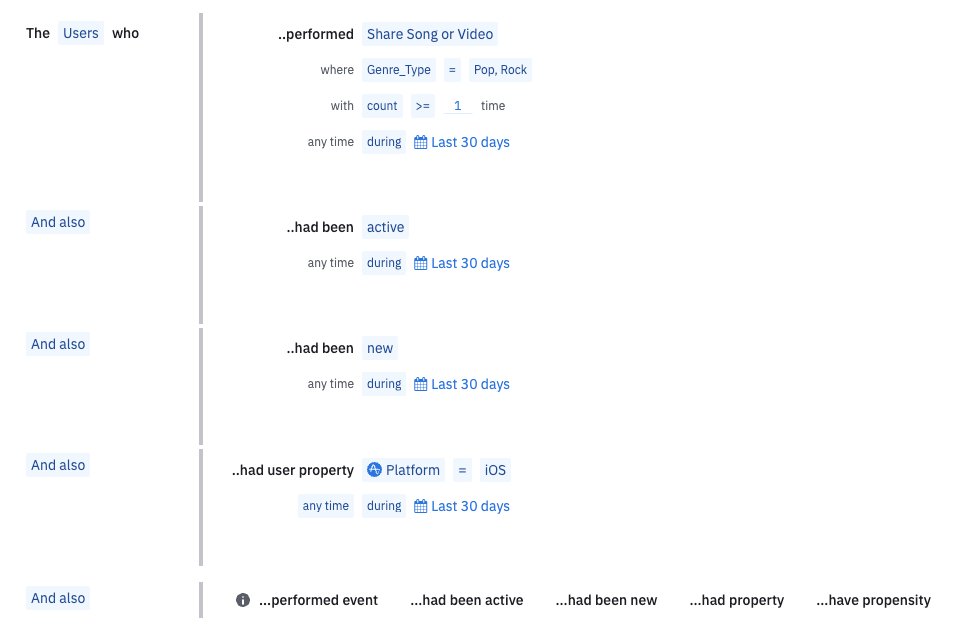
Product managers and marketers can build more precise cohorts within the Cohorts section in Amplitude.
3. You can build a cohort based on a single data point found in any chart. For example, you can identify new users from a July 26 product launch.
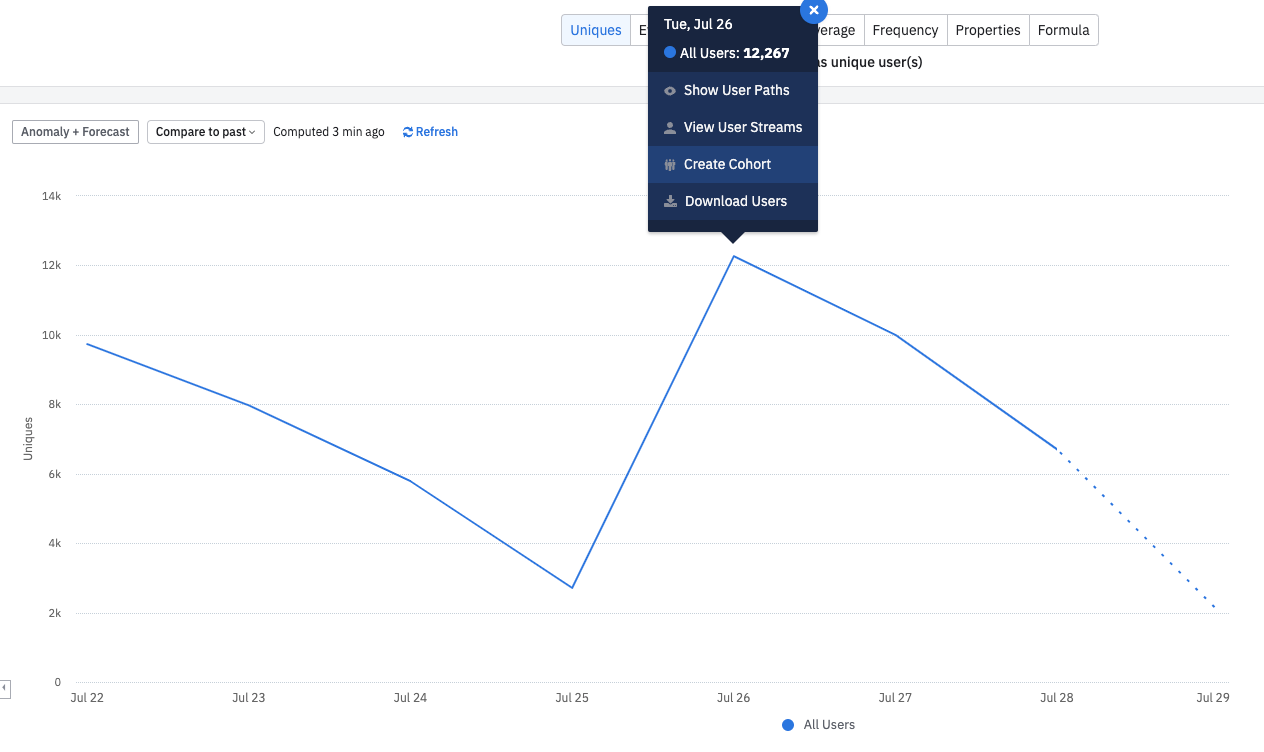
Amplitude makes it easy to create a cohort of users based on a specific data point within an existing chart.
Ultimately, a good cohort analysis tool empowers nontechnical teams to ask and answer questions. Putting that information directly in their hands gives them a better understanding of their product users and better data to drive business results.
Cohort analysis examples
Here are some examples of how Amplitude’s customers have performed cohort analysis to produce business results.
Calm: Cohort analysis example for retention
On a hunch, Calm used behavioral cohorts to test the retention of users who set daily reminders on its meditation app compared to those who didn’t use the feature. They discovered a 3x increase in retention for users who set daily reminders.
The reminder wasn’t easy to find, so there was a chance the users who liked the app most for some other reason simply dug into the menus further and found the feature. To test whether this was correlation or causation, Calm changed its onboarding tutorial to encourage some new users to set a reminder and left other first-time users as a control group.
That 3x retention rate held during the experiment, so Calm included the prompt to set daily reminders in its next app-wide update.
Cornerstone: Cohort analysis example for faster decisions
Cornerstone has transformed its product management workflow with Amplitude’s help. Before, product managers had to request data from engineers.
Those engineers would provide a cohort report with spreadsheets full of information, which required a full-time employee to pore over the information and glean insights that could lead to better business results.
The whole process could take days. Or weeks. Now, product managers can retrieve the same data in minutes and use the insights to make quick decisions.
How to get started with cohort analysis
Setting up your own cohort analysis with a cohort analysis tool like Amplitude is simple:
- Take a look at your retention by customer acquisition cohort. That will show you when users are dropping off.
- Define events for a few of your app’s core user actions, and then pull up your behavioral cohorts. Analyze your behavioral cohorts by comparing them, inverting them, and combining them. Use that with your learnings from looking at acquisition cohorts to generate a hypothesis about actions you can emphasize during a specific part of the customer journey to drive retention.
- Make changes to your app—using A/B testing with Amplitude Experiment if you have a high enough usage volume—to see whether driving certain actions in your app actually causes users to come back.
- Process your learnings and repeat.
With Amplitude’s behavioral cohorts, you can see the specifics of your customers’ behaviors and start to make data-driven decisions to enhance their experience with your product.
Try cohort analysis today with a free Amplitude plan, or check out our Mastering Retention playbook to learn how you can further increase retention.
References
- The Definitive Guide to Behavioral Cohorting. Amplitude.
- Step-by-Step Guide to Cohort Analysis & Reducing Churn Rate. Amplitude.
- How to Perform a SaaS Cohort Analysis to Reduce Churn. Amplitude.
- Cohort Analysis – All You Can Do with Acquisition Cohorts. Saras.
- 2019 Mobile App Benchmark Report to Inform Your 2020 Strategy. Upland.
- Using Cohort Analysis for Conversion Optimization. Speero.