
At Amplitude we’re big believers in product teams aligning their vision and strategy to a north star metric. In fact, we believe so strongly that this framework helps transform product organizations that we host workshops about it across the globe.
This isn’t just a “set it and forget it” thing we do at the leadership level. We organize our product team around our own north star and its leading indicators—this has been a very successful strategy for us, driving more than 4x growth of our user base in the past two years.
But what do you do when your strategy changes?
THE NORTH STAR PLAYBOOK
What’s your product’s North Star Metric?
Discover your product’s North Star Metric with our comprehensive guide.
The history of Amplitude’s north star metric
Let’s first talk about how we came up with our north star metric two years ago.
Although we were a small product development team of only about 20 people at that time, we knew it was important to have a metric that we could use to drive clarity, communicate progress to the rest of the organization, and hold product accountable to driving business outcomes for the company.
As a product analytics solution, our main value proposition was helping product managers and analysts answer questions, so we decided to use a ‘query’ as our indicator of value. That was important to us because our main differentiator from other analytics products was that Amplitude users didn’t just view dashboards, they explored the data deeply to understand what drives user behavior. So we aligned around ‘weekly querying users’ (WQUs) as our north star. This worked really well for us—we found that not only did WQUs reflect customers getting value out of Amplitude, but that this was also a leading indicator of our ability to retain and expand accounts to grow our business.
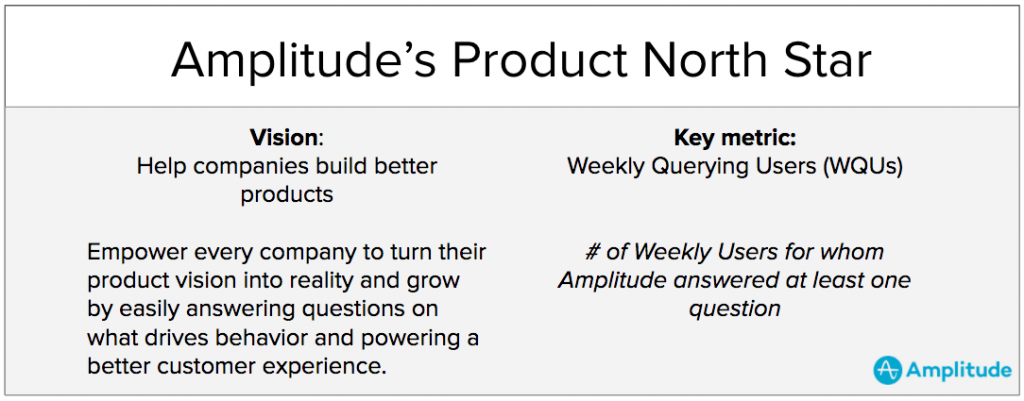
But over time we recognized that this metric wasn’t truly reflecting the type of impact we wanted to have with our customers. Our mission isn’t to help users build better analyses—it’s to help companies build better products. And building product is a team sport.
By only focusing on users who query, we were limiting the potential of our solution.
Evolving Amplitude’s north star
Changing a north star metric, especially at a company as analytically oriented as ours, is no small task. We started out doing what we do at our north star workshops: examining our product strategy.
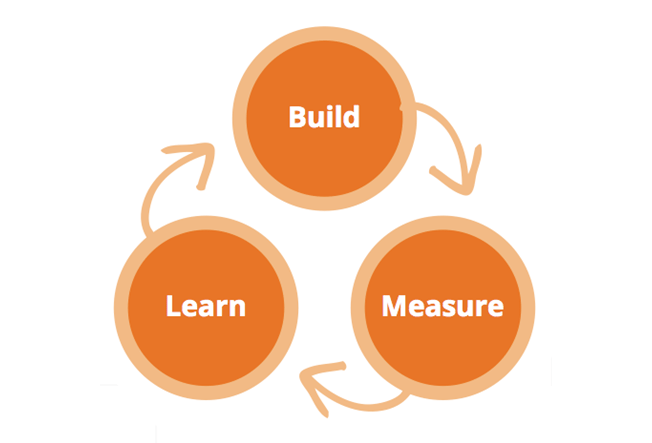
One of the changes we made in 2018 was deepening our focus on collaboration and exploration to help customers get to impact faster. By customer impact, we meant completing the Build > Measure > Learn loop (we’re big fans of loops at Amplitude).
We dug into our data to figure out how we could best represent a user completing the loop. We looked broadly across a multitude of factors: everything from Amplitude engagement and feature adoption to customer product velocity and usage of instrumentation.
We also did a deep network graph analysis to understand the relationships between users in our product. By looking at network structures and how they evolved over time, we could see how connectedness differed for our most successful customers compared to those who hadn’t fully adopted the platform.
Based on all of this, we ran correlations against our contract data and compared that to our existing WQU metric. And ultimately landed on a definition that we felt was simple enough for people to understand, yet robust enough to capture value delivered and be a strong driver of revenue for Amplitude: we call it the “weekly learning user” (WLU).
We ultimately landed on a north star definition that we felt was simple enough for people to understand…we call it the “weekly learning user” (WLU).
A WLU is a user who is active and shares a learning that is consumed by at least 2 other people in the previous 7 days. It represents our most valuable user persona—the Advocate—who shares context to drive decisions and take action in an organization.
But in addition to adapting our north star, we also wanted to identify the key leading indicators of this new metric so that we could align our pods to that strategy. We identified three new metrics for our team to set goals against:
1. Activated Accounts
Activated accounts are organizations that have reached at least 5 WLUs. We have found that once we reach this threshold, there is a high likelihood that this customer will continue to grow with us.
2. Broadcasted Learnings
A chart, dashboard, or Notebook is considered to be a “broadcasted learning” (BL) when it is consumed by 2 or more people within a 7 day period. By measuring the total number of high quality learnings, we are able to get great insight into the health of our accounts.
3. Consumption of Learnings
Consumption of learnings (CoL) measures the total reach of all BL. This is our best proxy of how deeply an insight is shared across the organization. CoL measures the total reach of BL in an organization within a 7 day period.
Benefits of this change
We believe our new north star metric better reflects our current product strategy—the value that we are delivering to our customers—and is a good leading indicator of revenue for the company. In the past 6 months we’ve seen a 50% increase in the number of WLUs per active organization.
We’re now exploring how to integrate our north star into other parts of our company. For example, how can we use WLU, BL and CoL in Customer Success as key inputs into account health? Can we trigger training sessions or campaigns with customers based on their likelihood to activate? How can we use these metrics to help our Account Management team identify customers that are likely to expand so they can establish a relationship with that account months before renewal? These are all questions we’re looking forward to tackling this year as we build upon our new north star metric.