
In common parlance, to “observe” is to give something a little more than a passing glance. You might “observe” that the train is late or that your coworker got a new haircut, but this kind of looking has very little to do with the kind of observation fundamental to the scientific method.
Scientific observation is not looking. It is a systematic, rigorous approach that relies upon the idea of reproducibility for validity. If Galileo Galilei, the father of the scientific method, had merely “looked” into the night sky, it would have been practically impossible for him to reach his conclusions. Imagine simply looking into the sky yourself, today, and making a claim totally contrary to all modern thought—like, say, that the Sun revolves around the Earth. Galileo didn’t rely on his intuition; he relied on his instruments and his interpretation of their results.
Whether you’re analyzing the movement of planets or your app’s metrics, real observation is not as easy as simply looking. It’s a process that requires an investment of time and effort, but do it right, and you’ll build yourself a framework that you can rely on.
There are three primary user research tools that will help with scientific observation of your app: self-reporting, user-testing and behavioral analytics.
Get People To Tell You All About Yourself
In the scientific process, a “self-report,” or survey, asks subjects to describe their own feelings and thoughts. There are some obvious issues with self-reporting: it’s prone to bias and can sometimes lead to false or misleading interpretations. But self-reporting is still essential when trying to understand human behavior.
To get at the truth, sometimes you have to get your hands dirty and listen to what your customers actually tell you.
HOW TO PERSONALIZE YOUR QUESTIONS AT SCALE
One of the simplest ways to begin investigating your app’s retention problem is by giving your users an opportunity to talk about why they use your app in the first place. The easiest way to do this is by making short questions about their motivations, goals, and projects part of your onboarding process. You can even automate them in an email marketing platform like Customer.io so you don’t have to think twice about sending them.
But you do have to keep in mind the limitations of self-reporting. The primary bias that you need to fight is that of self-selection. If you send questions to a random sample of your users seeking information on your app’s pain points, then you’re most likely going to be fielding a bevvy of complaints from your angriest users. People are generally apathetic about random emails in their inbox, and they’re unlikely to respond unless they have strong feelings one way or the other.
To break through and get some nuanced and useful responses, you need to ask the right questions and do it in a way that creates trust. One way to do this is by sending an email immediately upon sign-up that simultaneously builds trust and probes the user’s motivations for downloading your app before strong feelings can develop. And make it personal, because you’re not going to break through that apathy if users see you as a robot collecting data:
(No, that’s not a real startup.)
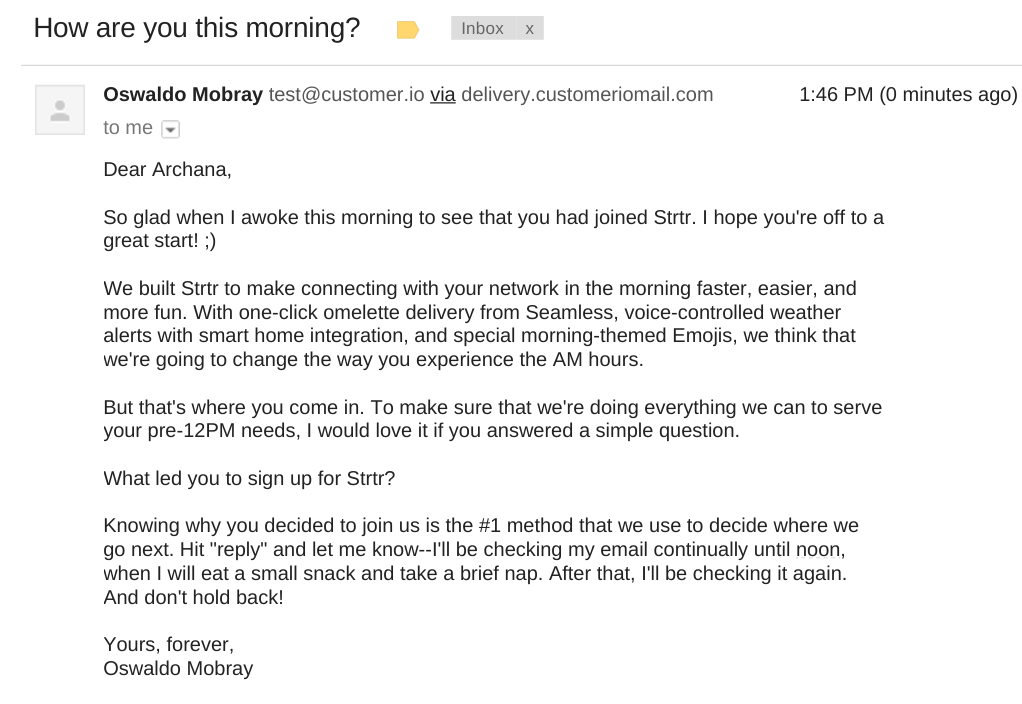
Don’t be afraid to get a little personal with your users. You’re asking people to hit reply on an email from someone they don’t know, and you need to look like a fellow human, not an automated message.
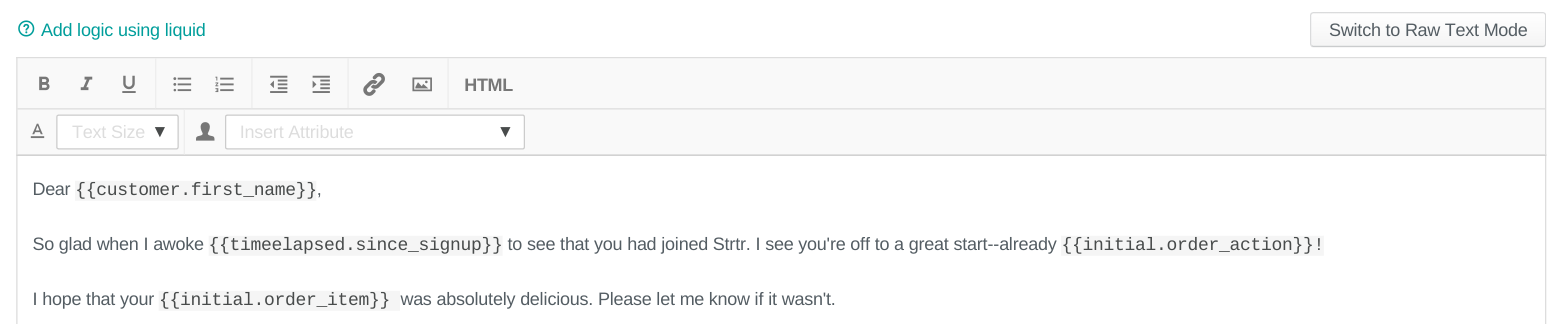
The more you can personalize, the better off you’ll be, and custom email logic can make precise personalization effortless. That means using code to create conditional statements and precise evocations of state that apply only to the particular person being emailed. The above email is full of panache, but this one, for instance, uses data to show the recipient that someone’s actually paying attention to their experience:
Show people you care, and they’ll trust you when you say you want to hear about their experience. They’ll actually want to help you with your retention problem.
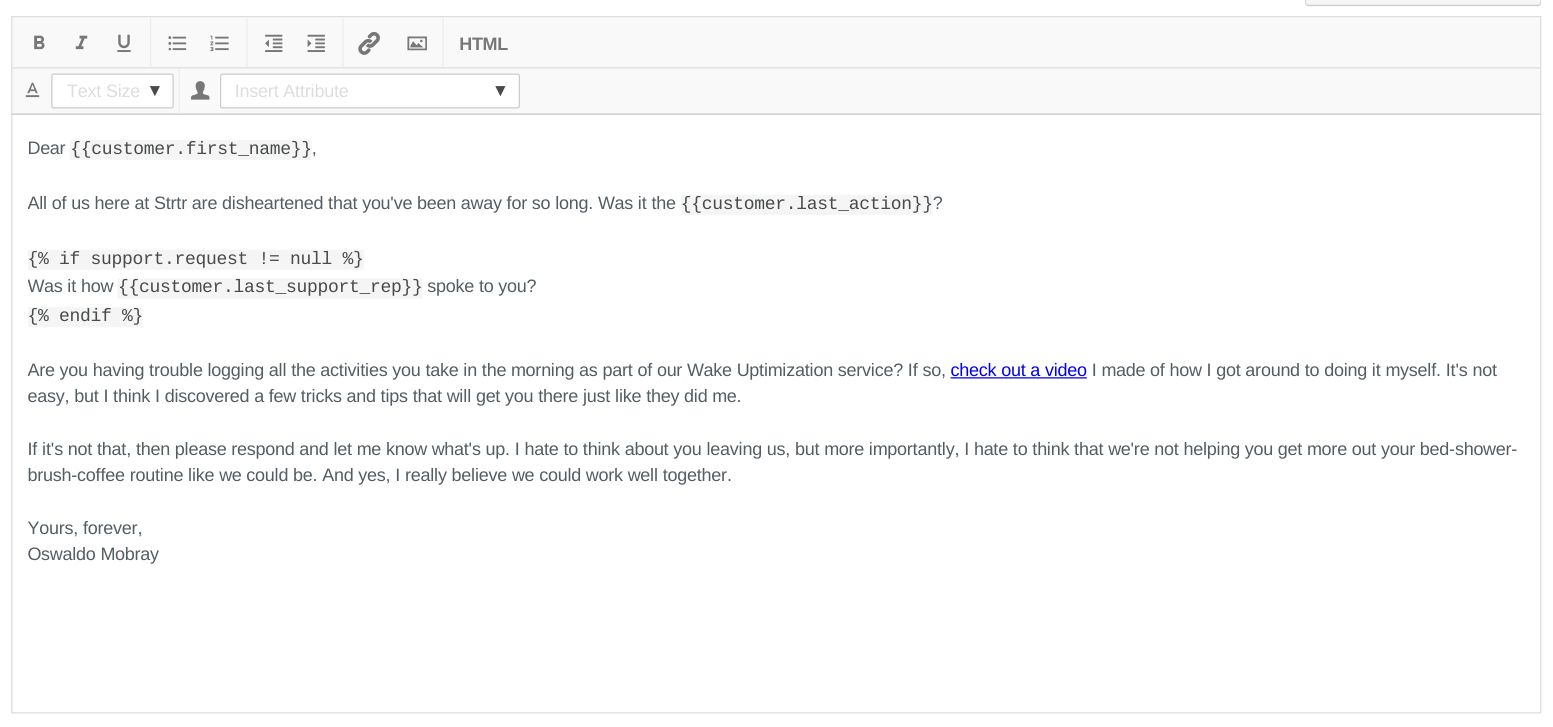
But don’t just send emails like this during onboarding. Emailing your disengaged customers is just as important. Once they churn out completely it’ll be hard to get in touch with them. Get in touch while they’re still partially engaged and ask them what’s going on, what’s missing that they expected from your app, and offer to make things right. This way, instead of just hearing from your most passionate users and trying to extrapolate, you nail down the exact scope of your observation—users who aren’t getting what they need—and can draw more precise conclusions.
This is how you turn a qualitative study into an empirically valid one. If the answers they give you when they sign up align with the answers they give you when they begin to churn, then you have a way into your churn problem—it’s about functionality. If they don’t, then you know you have some other issue on your hands.
USE AN NPS SURVEY TO GET HARD DATA
One of the most common ways to gather information on your app’s performance is a survey consisting of one simple question: “How likely are you to recommend our app to others?” You prompt the recipient to answer on a scale of 0-10, and the number they choose becomes your NPS, or net promoter score. If they rank you a 0-6, then they’re considered a detractor—someone who may actively dissuade others from using your app. If they rank you a 7-8, they’re considered neutral. If they rank you a 9-10, they’re considered a promoter—someone who raves about you to their friends.
If you see that some of your responding users are rating their likelihood of referral at a 9 or a 10, then you have a batch of users to probe about why your app is succeeding for them. You can use them to figure out what kind of usage and goals align with retention. If you see that some of your users are rating their likelihood of referral much lower (and you will) you know who you have to understand better if you want to fix your retention problem.
Here are some best practices to keep in mind as you ask users to self-report on your mission to fix your retention:
- Keep your ask small. Response rates drop as you add questions, so keep it short and simple.
- Get personal early on. The biases of apathy and self-selection can destroy your study, so build up trust with your users early on and ask them about their motivations before any passionate feelings can develop.
- Maintain consistency in your observations. If you can compare a specific user’s reasons for signing up with their reasons for leaving, then you’ll have a valid set of data that you can investigate for correlations.
See For Yourself What People Are Really Doing
If you want to know how people are really using your app, you’ll want to use both qualitative and quantitative methods. One of the most powerful ways to combine the two is by incorporating them into user testing.
What you want to do is compile qualitative data from actual users of your app—how they feel navigating through the user journey, what seems difficult, what surprises or confuses them—and combine it with quantitative measurements so you can understand changes over time or particular problem areas.
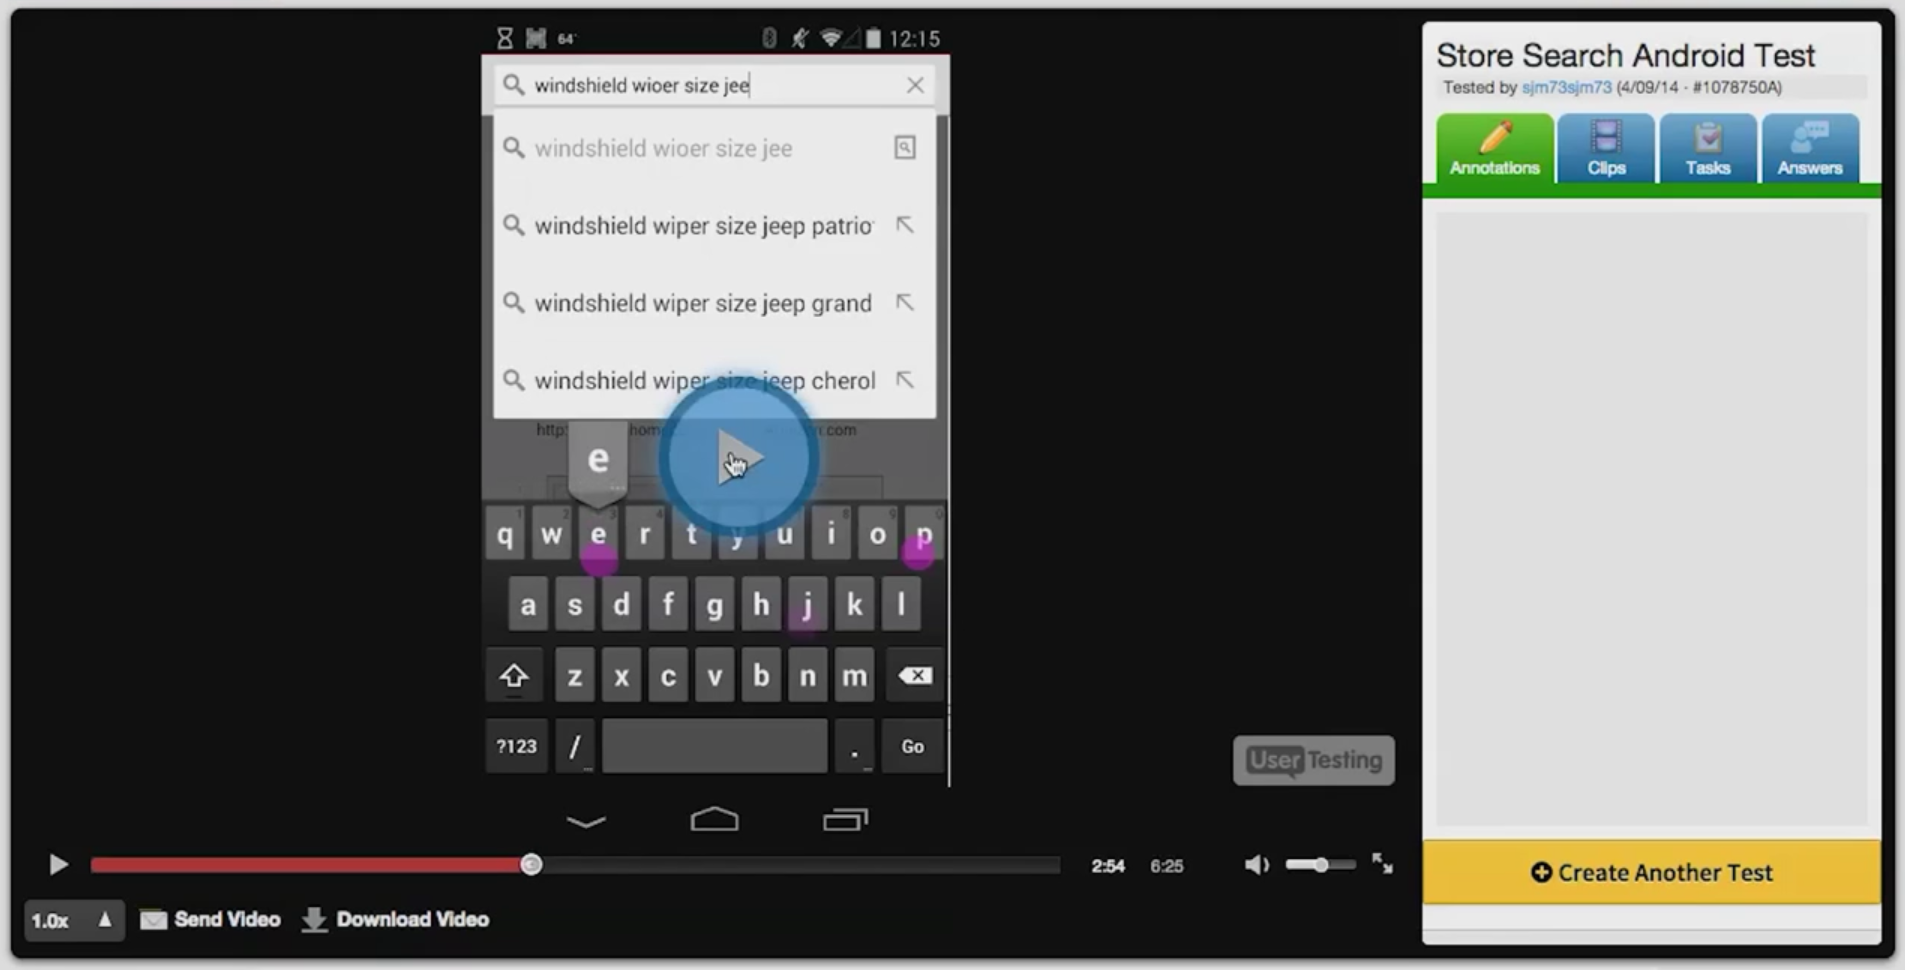
First, you need to craft a narrative of your user’s journey through your app. You can direct this hypothetical user through areas of your app you think need work or through a conventional signup-activation flow. With a service like UserTesting, you can then record people as they do what you ask, thinking out loud each step of the process, writing descriptive responses, and ranking by difficulty, or usefulness, or whatever other metrics you can think of.
This means you’ll get both qualitative data, a stream of user consciousness, and more measured quantitative responses. That’s a wealth of information about how your users experience your app, which is super valuable for two reasons:
- Until you actually see a user using your app and hear their anonymous complaints, you have no idea where your app’s pain points actually are.
- The quantitative data lets you track how effective your user experience is across pages of your app or across your entire app over time—also known as benchmarking.
The key to success is asking the right questions and phrasing them properly. Don’t use buzzwords or jargon, and don’t be vague: if you want to know how often a user testing subject ordinarily performs a task, for instance, ask specifically about how many times they did it within a window of time. Never let “It depends,” or “Maybe,” be an answer to a question.
You want precision here. You want to know the exact thought processes of your app’s users because you will learn things that you could never learn from simply looking at your conversion rates or bounce times: what _exactly _annoys people, what _exactly _seems confusing about a page, etc. Here’s an example for formatting your questions:
- Go to https://www.advanceautoparts.com/ on your phone. Try to find a pair of windshield wipers to fit a 2010 Jeep Patriot, then write a few sentences about how this went. Please be as descriptive as possible.
- **[Rating] **Overall this task was: [1 = Very Difficult, 5 = Very Easy]. Please explain your answer.
- Now, use the website to find any item that fits the needs of your current vehicle. Give 2-3 reasons why you made the selection you did.
- [Rating] Overall this task was: [1 = Very Difficult, 5 = Very Easy]. Please explain your answer.
Asking users to perform a behavior and describe their experience qualitatively is going to get you a wealth of useful information about the subjective process of using your app.
Asking them to assign scores afterwards is going to give you the anchor you need to place that subjective experience in context. You can compare scores across pages to see which part of the funnel your users are having the most trouble with, or compare scores across time to see if people begin to have an easier or harder time after you make adjustments.
Find Users’ Natural Behavior That Correspond With Retention
With user testing, even though you’re not literally there watching over the user’s shoulder, your observation is going to play a role in your results. People behave differently when they know they’re in an experiment. It’s human nature. Your buddy at the co-working space may have promised to use your app all the time, but you can’t rely on the things someone tells you either. You can only rely on what you actually see them do when they’re behaving naturally.
While there are a number of strategies you can use to minimize these kinds of effects, you can also go around the problem by using analytics. Every action that your users take within your app is logged and organized. Since your users aren’t told that they’re being watched or studied, your data will represent the natural ways that users navigate and interact with your app. You’re the eye in the sky of your app.
All you have to do is pick actions, pick users, and observe.
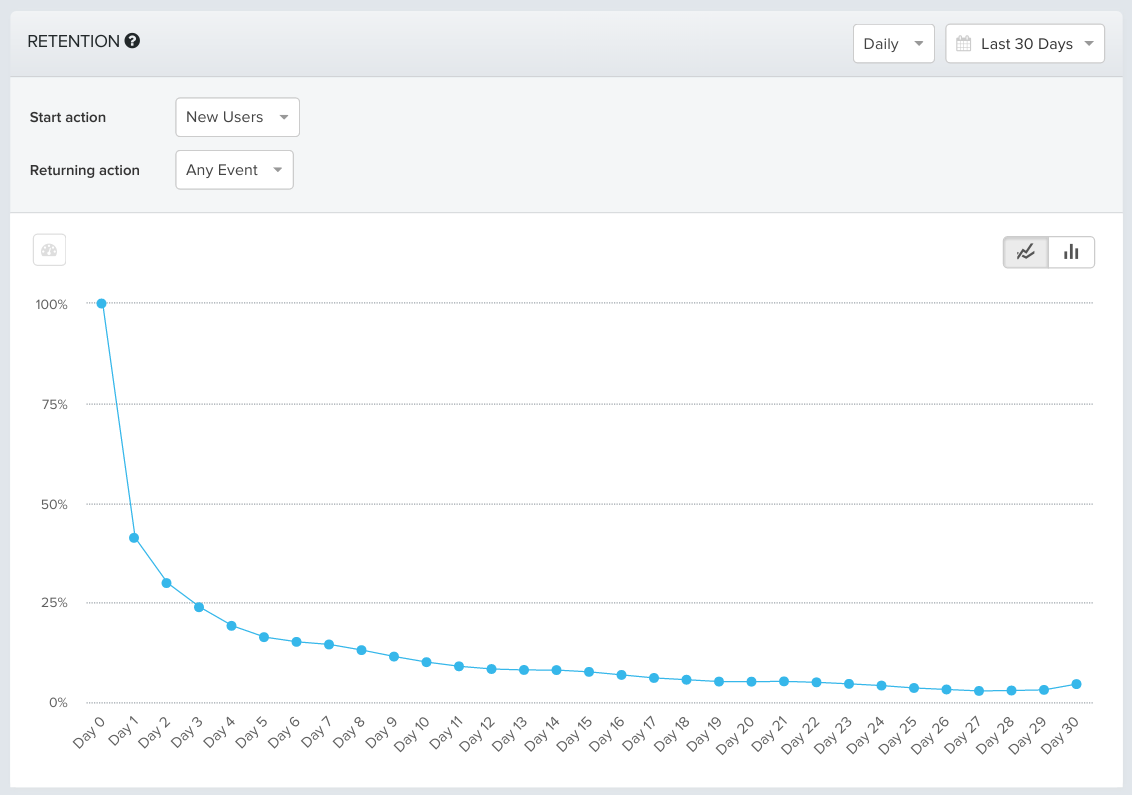
Here, for instance, we have a standard thirty-day retention graph on which users who came back and performed “any event” inside the app are counted as retained:
Only 41% of people came back a day after first signing up for your app. That number fell to 23% after three days, and then declined slowly until the thirty-day mark, at which point only 5% of your original cohort was still around.
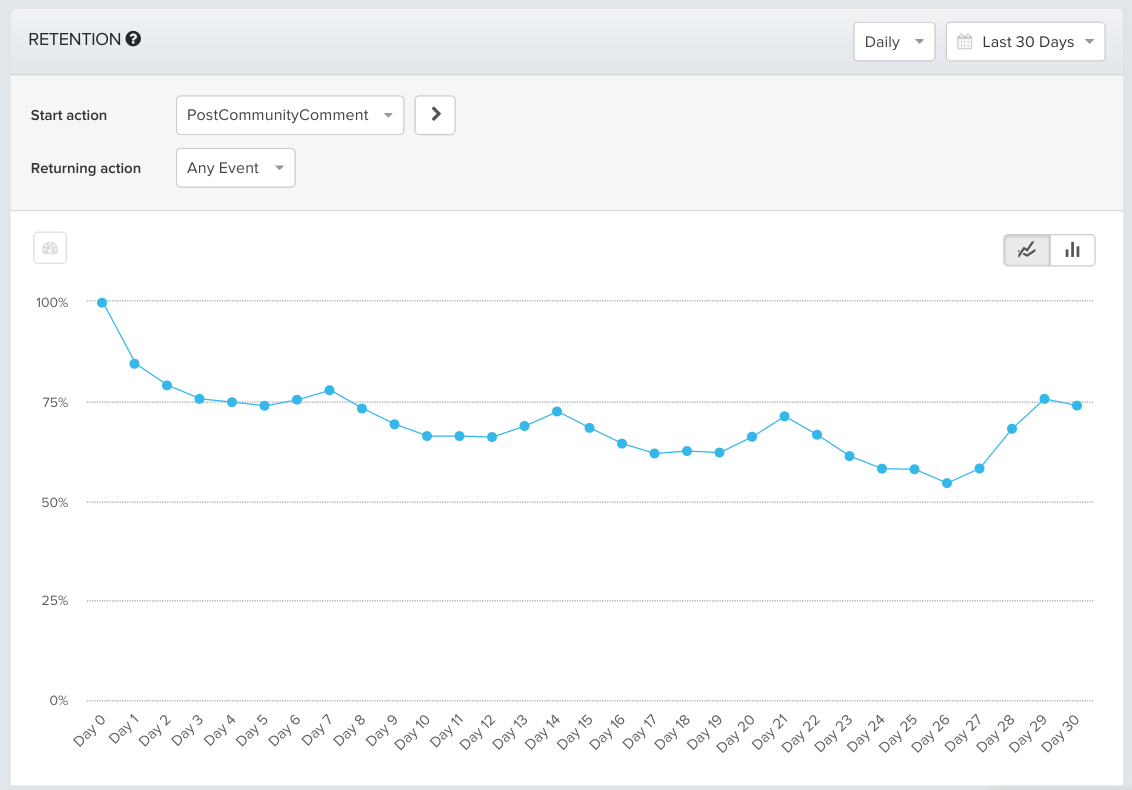
But looking at all of your new users is just a starting point. Let’s see what happens when users who’ve posted comments on the community instead:
Users who added friends are retained far better: 79% a day after signing up, 69% after two weeks, and about 75% on Day 30. Now you have a cohort of users who you can say with certainty are coming back to your app, and you have “posting a community comment” as a starting point for your investigation. You haven’t interfered with the way people use your app, just observed them, based on their behavior, from afar. It’s like you walked into a coffeeshop full of people using your app without any prompting. You sat somewhere in the back and just watched.
Good Observation Will Change The Way You See
Thomas Kuhn, when he first analyzed Aristotle’s theories of motion, thought they were simply wrong. There were serious errors there both in logic and mathematics. He couldn’t understand how this had been accepted until he looked at even earlier scientific work from the Greek world. That was when he came to his big insight: that even scientists work under paradigms of thought. When Galileo’s conclusions finally gained acceptance in the scientific and social community, it was the beginning of an entirely new paradigm. The rules were new, the foundation was different. And there was a whole new framework for science to proceed under, one that would remain until new observations necessitated the creation of another.
To build your own framework, you need to turn “looking” into a systematic, organized process. It cannot be haphazard, or founded on intuition. If it is, then the experiments that you try to run later are going to be just as haphazard.