Sales funnel analysis is the process of analyzing the series of actions a user takes before completing a specific goal, usually called a conversion. It shows you where users are dropping off and where there is friction in the conversion path.
- Sales funnel analysis involves analyzing a sequence of different steps a user takes before reaching a conversion.
- The most common sales funnel stages for websites are Awareness, Interest, Desire, and Action (the AIDA funnel). But specific sales funnel stages will vary depending on the type of website or product.
- You can visualize sales funnels as funnels or bar charts. Each visualization will help you perform sales funnel analysis at different levels of detail.
- Sales funnel analysis has been used by companies like Jitsi, Rappi, and Blue Apron to increase retention, average order size, and conversion, respectively.
- You can use several sales funnel analysis software to perform a sales funnel analysis, including Amplitude.
Sales funnel analysis 101
A funnel is a natural progression of steps a user follows to complete an action or conversion. Think of it as milestones along a journey.
A sales funnel analysis is the process of analyzing the customer journey to boost conversions. It’s helpful to identify any friction on the path to conversion, so teams can improve the customer experience and satisfy user needs.
There are a few different ways you can use a sales funnel analysis, including:
- Conversion: Look at how many users have converted through each step of the funnel.
- Conversion over time: View conversion rates for users who enter the funnel on a certain date, helping you understand how the sales funnel operates at different times of the year.
- Time to conversion: Analyze how long it takes someone to convert at every stage of the funnel.
- Frequency: How many times a user performs a specific milestone event before converting.
Sales funnel management using the information gained through funnel analysis allows you to:
- Identify the focus areas for product improvements to boost conversion.
- Know your highest-converting marketing channels.
- Understand user behavior at every step of the conversion path for converting users and users dropping off.
Most common sales funnel stages for websites and products
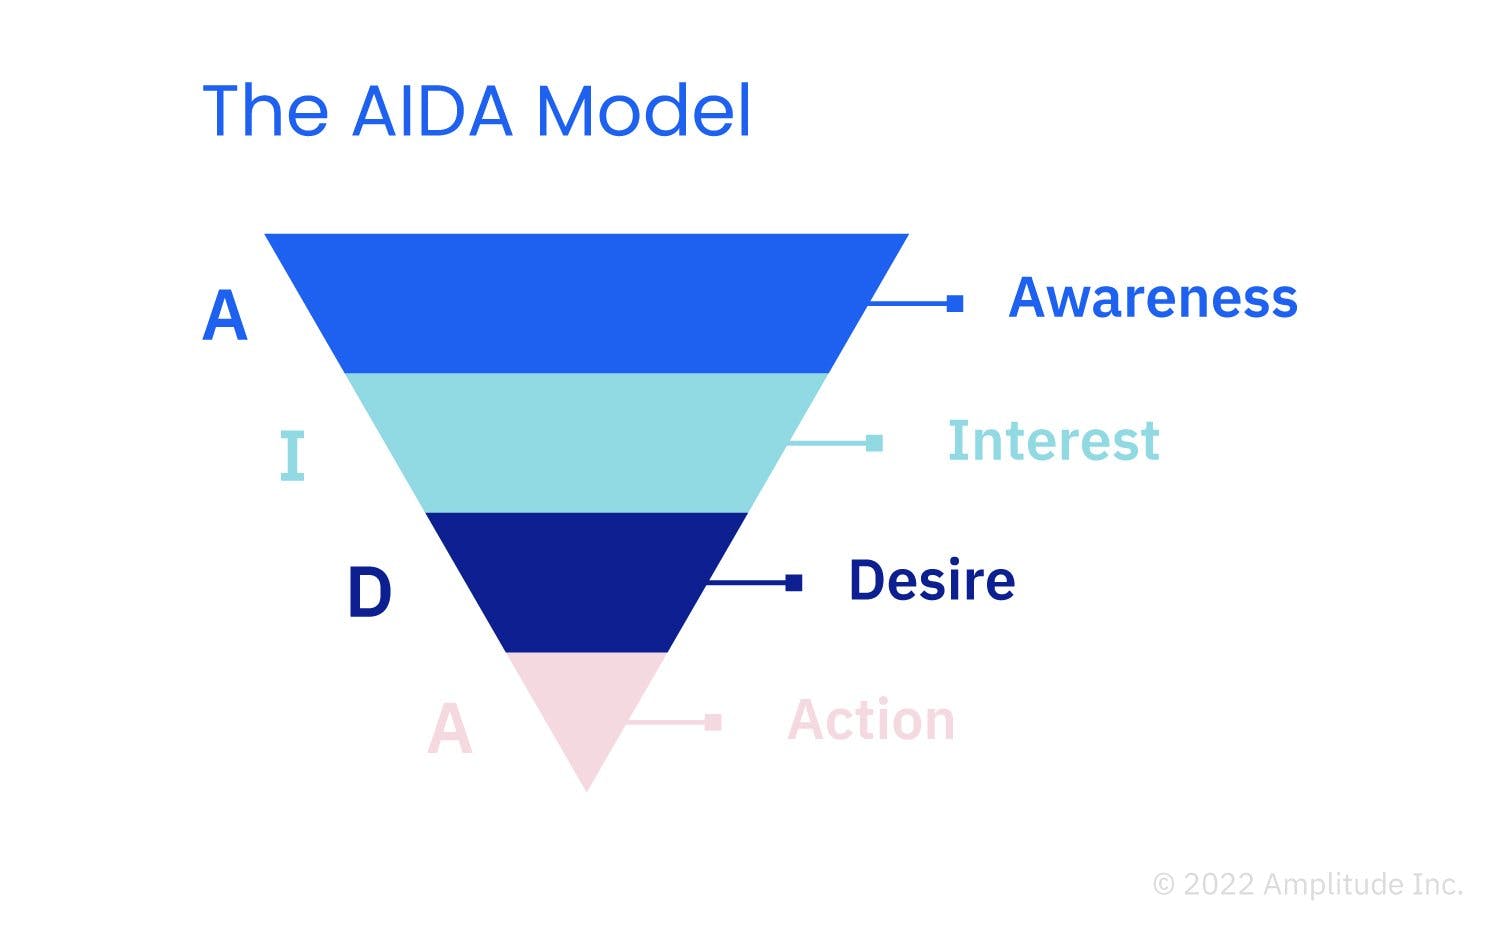
Typically, there are four key sales funnel stages, known as the AIDA funnel:
- Awareness: The user becomes aware of the existence of your brand.
- Interest: The user develops an interest in your brand and is open to learning more.
- Desire: The user connects your brand to a specific need and expresses a desire to acquire it.
- Action: The user takes concrete steps toward converting or purchasing.
Sales funnels for websites and products will broadly represent these four stages, but the exact sales funnel stages will depend on your industry. When analyzing a sales funnel, you’ll identify the stages most applicable to the customer journey for your website or product. Here are four sales funnel examples for different industries.
Ecommerce sales funnel
Ecommerce companies sell products or services. Sales funnel stages for an ecommerce app or website consist of:
- Viewing an ad about the product
- Visiting the website
- Performing a search for the product
- Adding the product to the cart
- Making a purchase
B2B SaaS sales funnel
B2B SaaS companies operate on a subscription model. The sales funnel stages here might consist of the user journey from using the free version of the product and converting to the paid version:
- Visiting the website
- Signing up for a free trial
- Creating an account and using the free trial
- Purchasing the paid version
Consumer tech sales funnel
Consumer tech companies are websites and products for consumer engagement, like mobile games and productivity apps. The sales funnel stages here might look like:
- Viewing an ad about the product
- Signing up for the freemium version of the game or app
- Engaging with the app
- Making in-app purchases or upgrading to the paid version of the product
Media sales funnel
Media companies are like news websites. Sales funnel stages here might look like:
- Reading free blog content on the site
- Engaging with free content through likes, shares, and comments
- Creating a user account
- Subscribing to the paid version of the website to unlock premium content
A typical sales funnel will have between three to five stages. Too few stages, and you won’t have enough specific information about user behavior and progression through the customer journey. Too many stages, however, and you may be unable to distinguish between them, or they’ll become too nuanced to be useful.
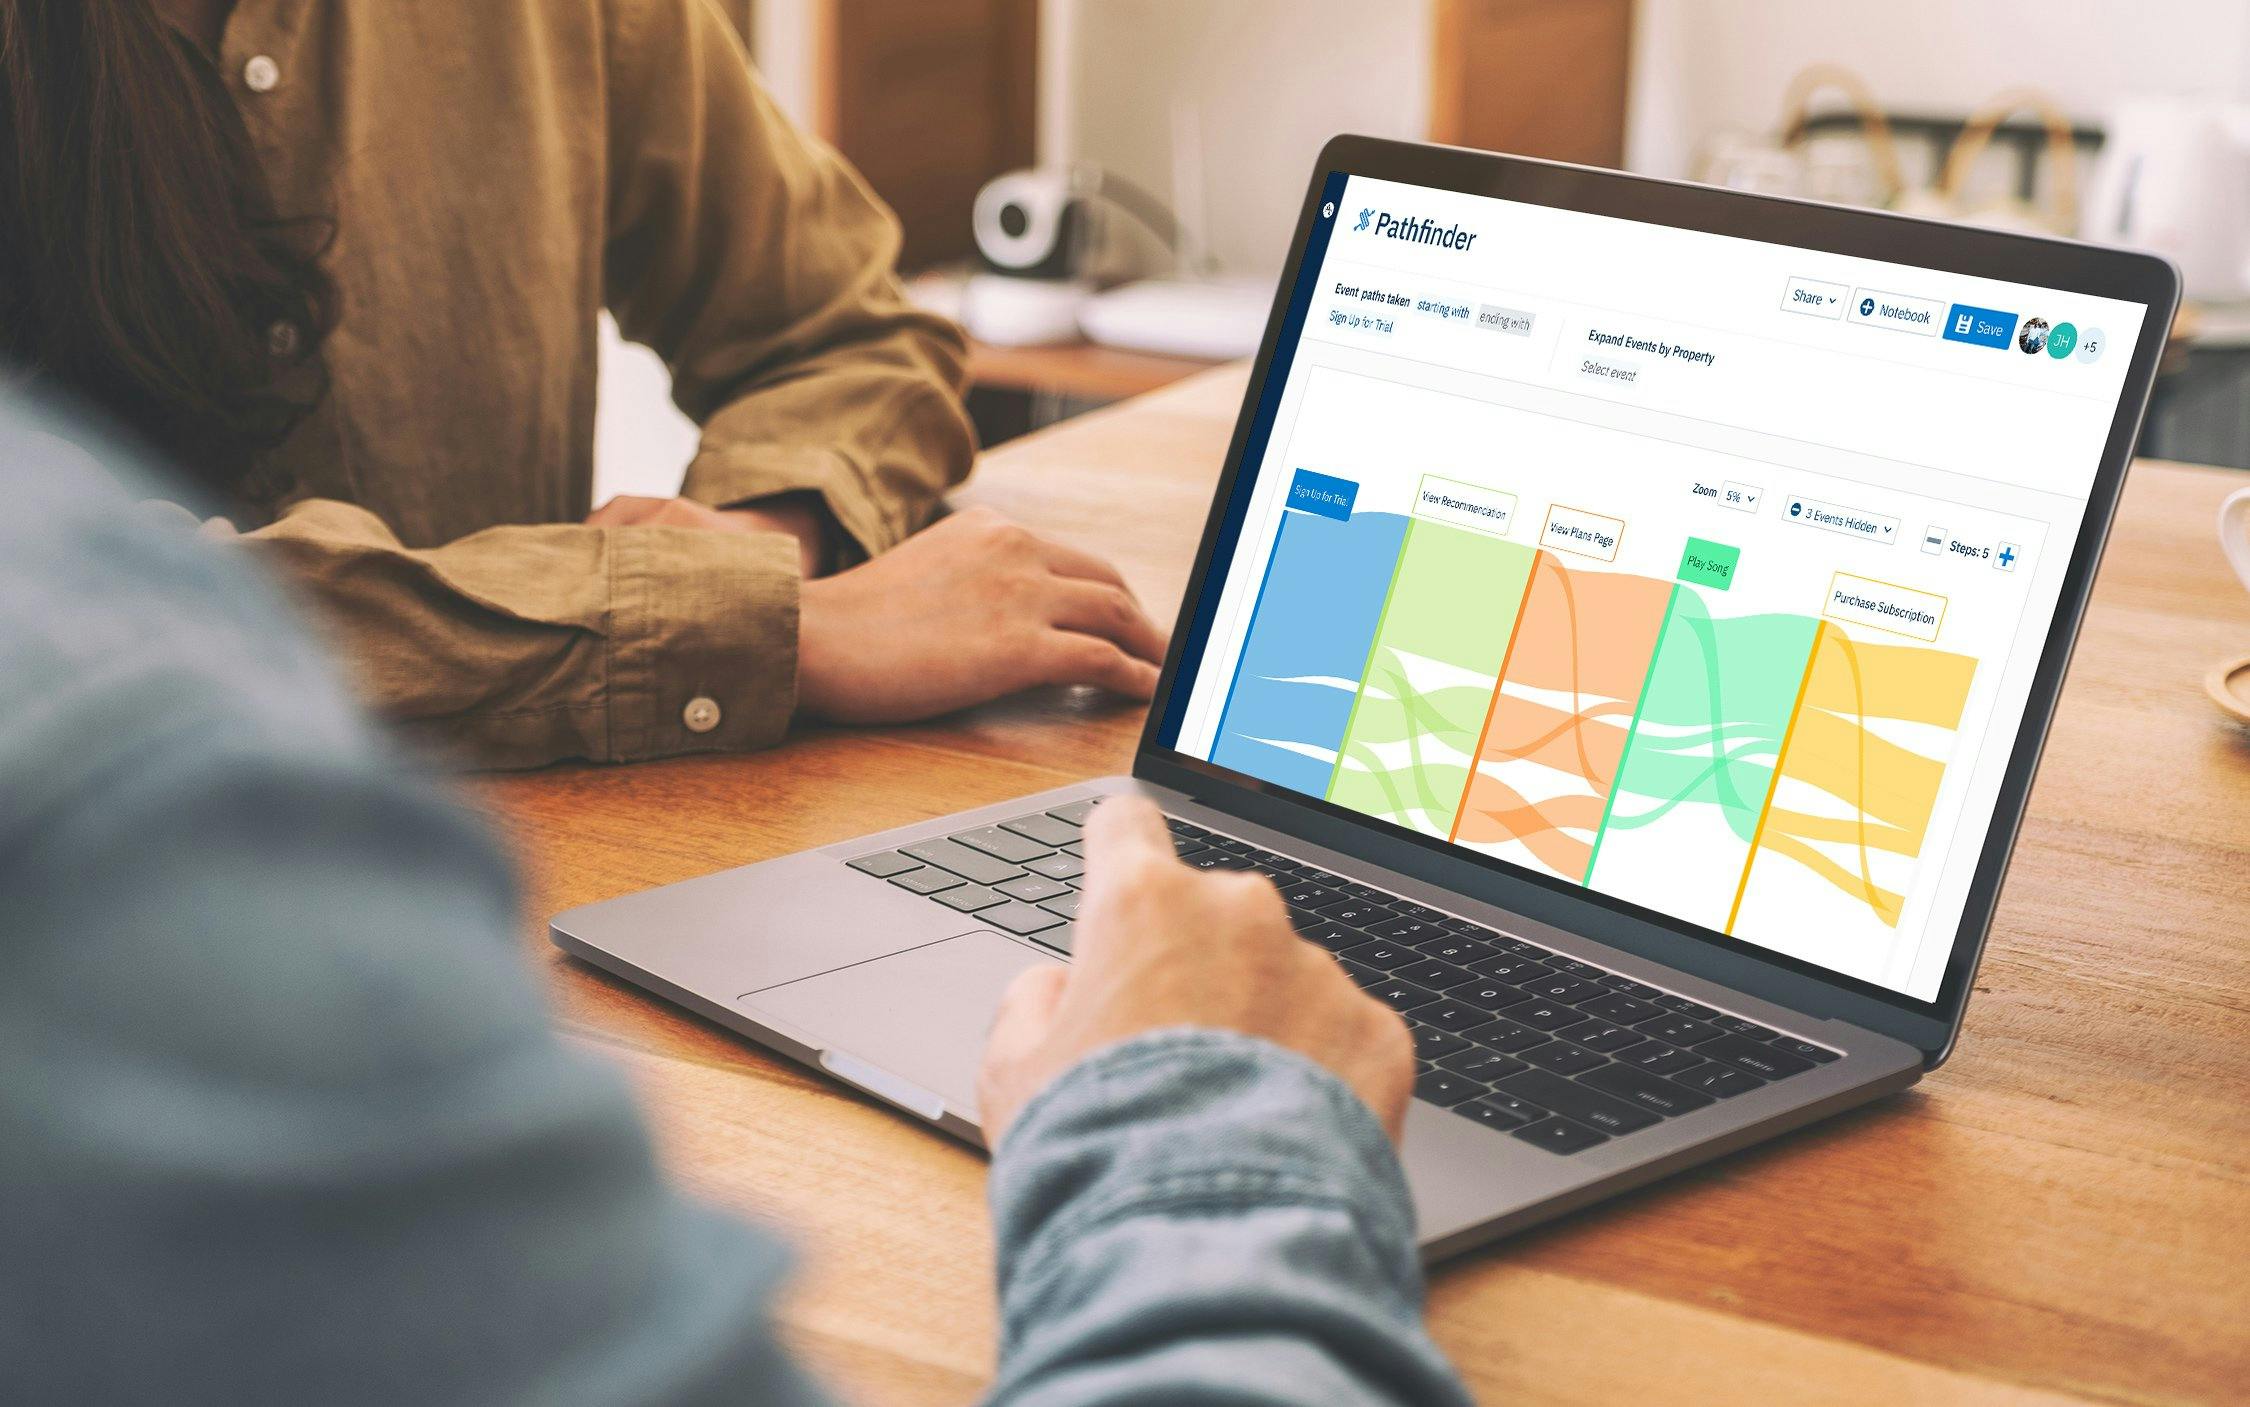
With Amplitude Journeys, you can conduct a sales funnel analysis to see how customers get from one stage of your sales funnel to another. Use this information to determine which product experiences lead to conversion and which ones result in friction and dropoff.
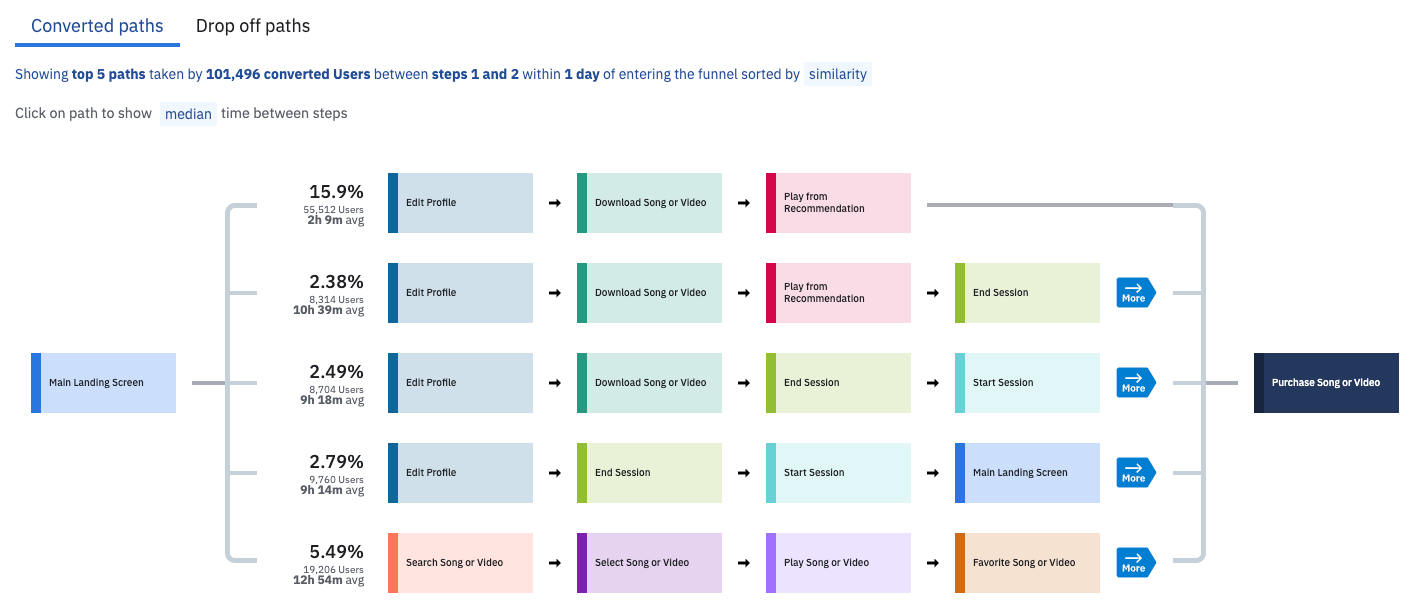
An Amplitude Journeys chart for a music-streaming app. Try it yourself with our free self-service demo.
How to visualize a sales funnel
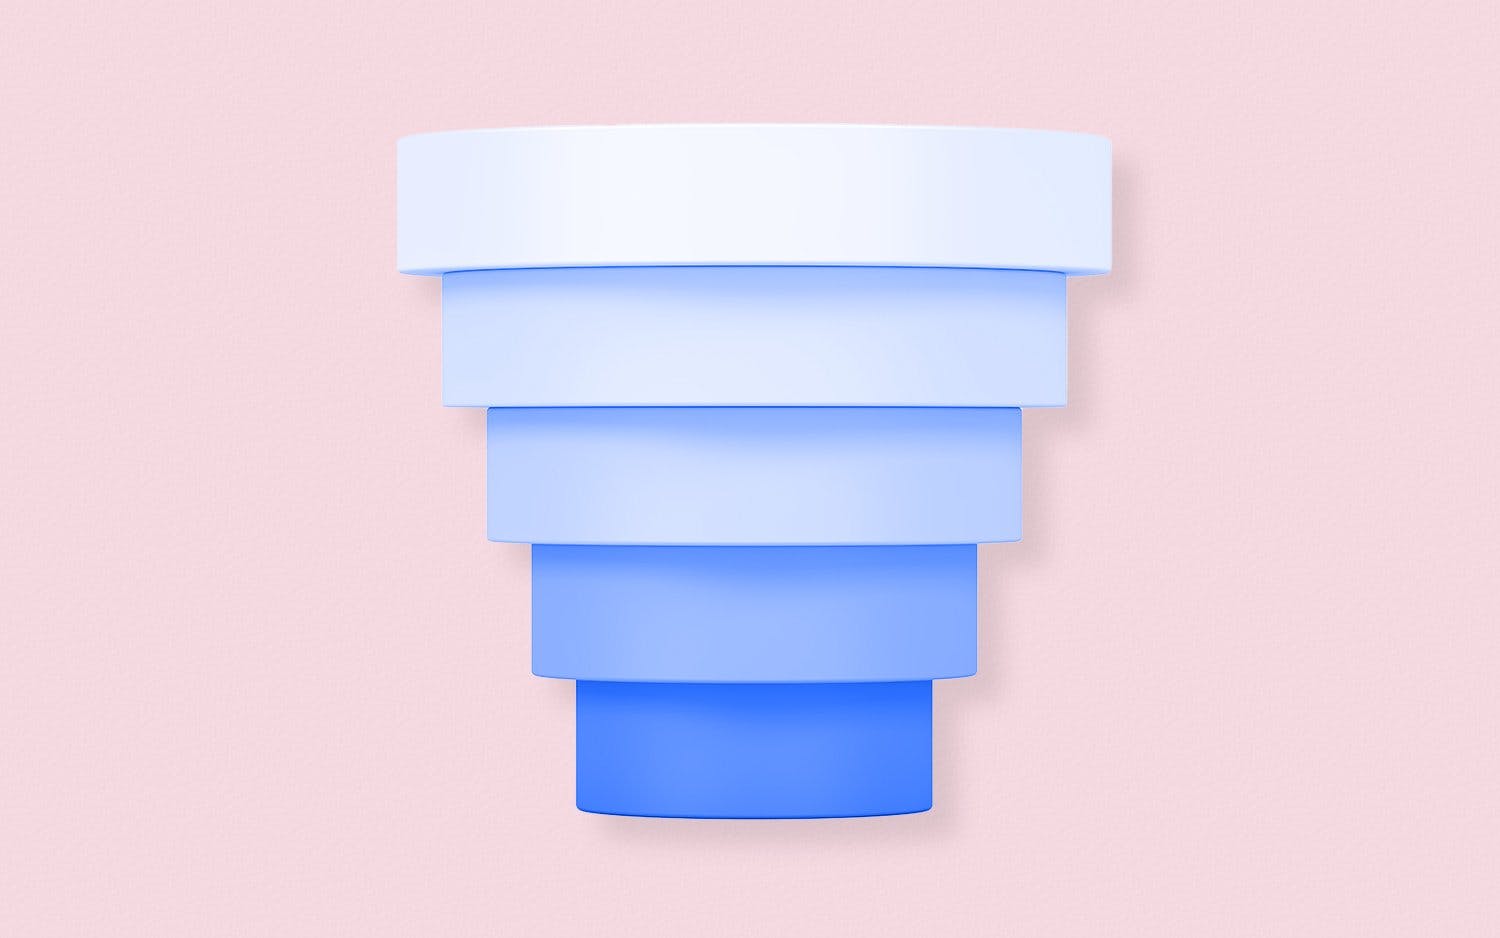
Like any kitchen funnel, a sales funnel has a broad top and a narrow bottom. It has sections representing the stages users go through along the conversion path. It should be able to translate the data into a meaningful graphic that shows how many users are converting at every stage of the funnel. As you move down the sales funnel, the percentage of users making subsequent actions continually narrows.
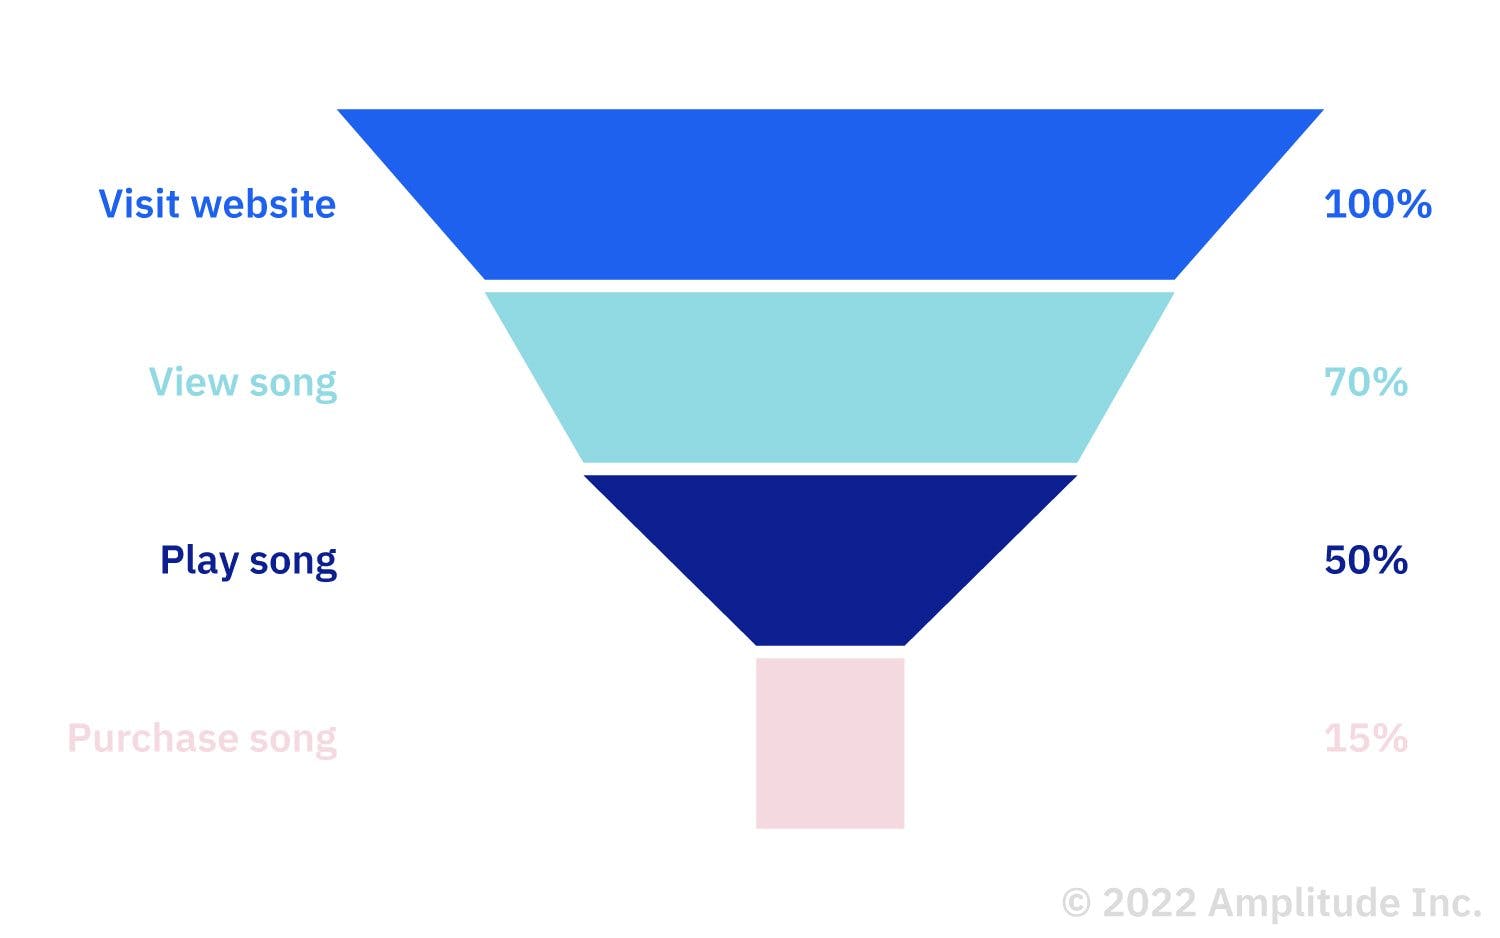
An example sales funnel for a music-streaming app with stages showing conversion.
Every sales funnel has three parts: top, middle, and bottom. The top part is about awareness—educating users and making them aware of the offering. The middle part is about helping users make informed decisions by providing more details about the product. The bottom part is about converting the user into a paying customer through conversion tactics.
You can also visualize sales funnels with a bar chart. A bar chart is a great way to identify friction and dropoff points in your customer journey.
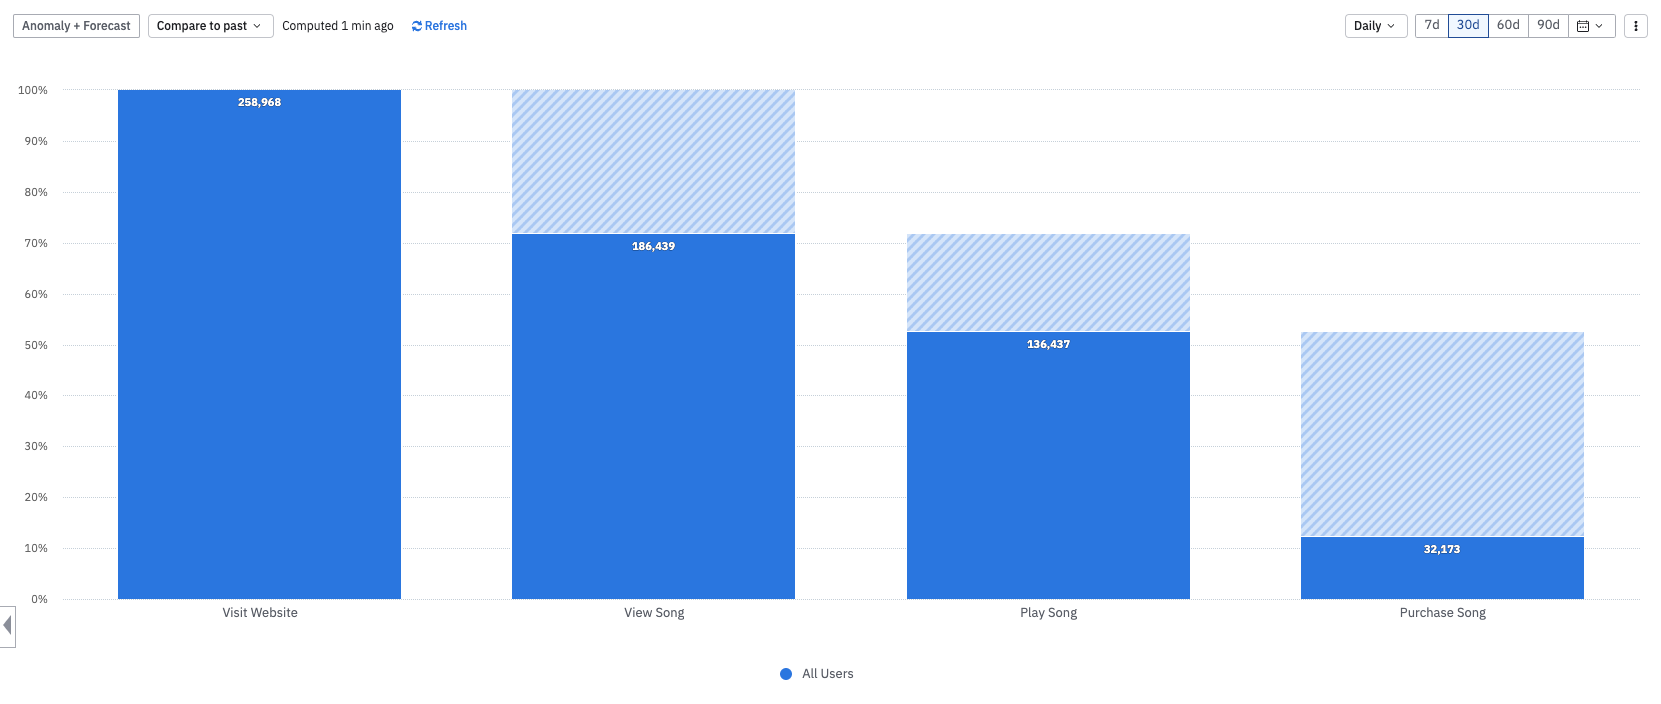
The Amplitude Funnel Analysis chart above shows the conversion for a music app’s sales funnel. The conversion rate from visiting the website to purchasing a song is around 12%, with the largest dropoff happening after users play a song. With this insight, you might take action to improve the song purchasing experience by A/B testing new purchase flows.
Start exploring your product’s sales funnels with a free Amplitude plan today.
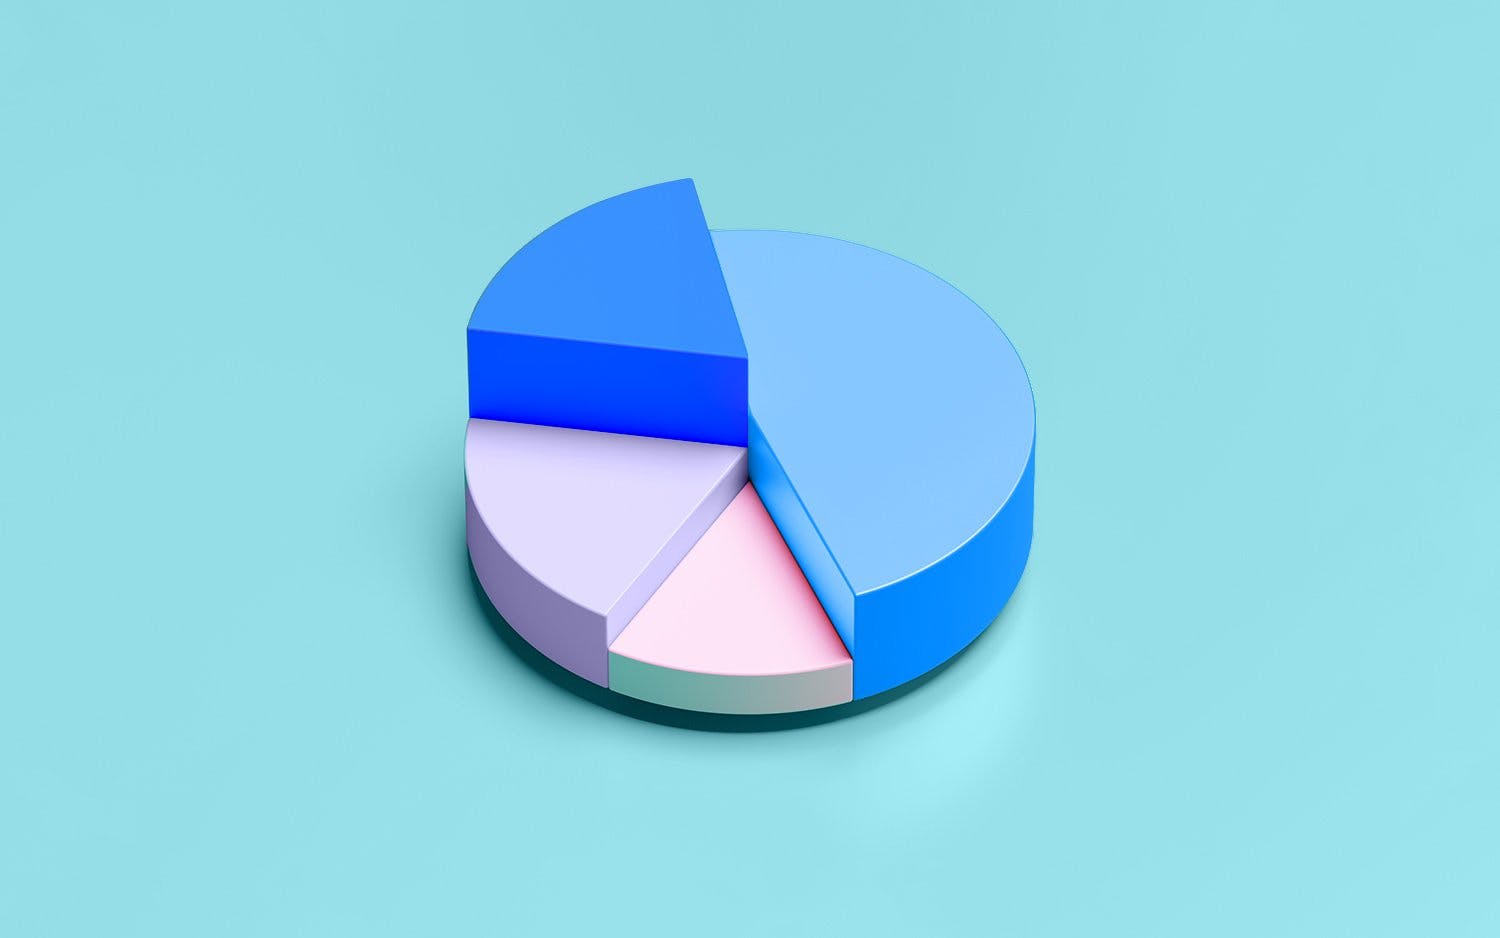
If you want to drill down further into the sales funnel, you can also look at subsets of your funnels based on different segments or cohorts. Cohort analysis breaks down what users with similar behaviors or demographics do at every stage of the conversion path.
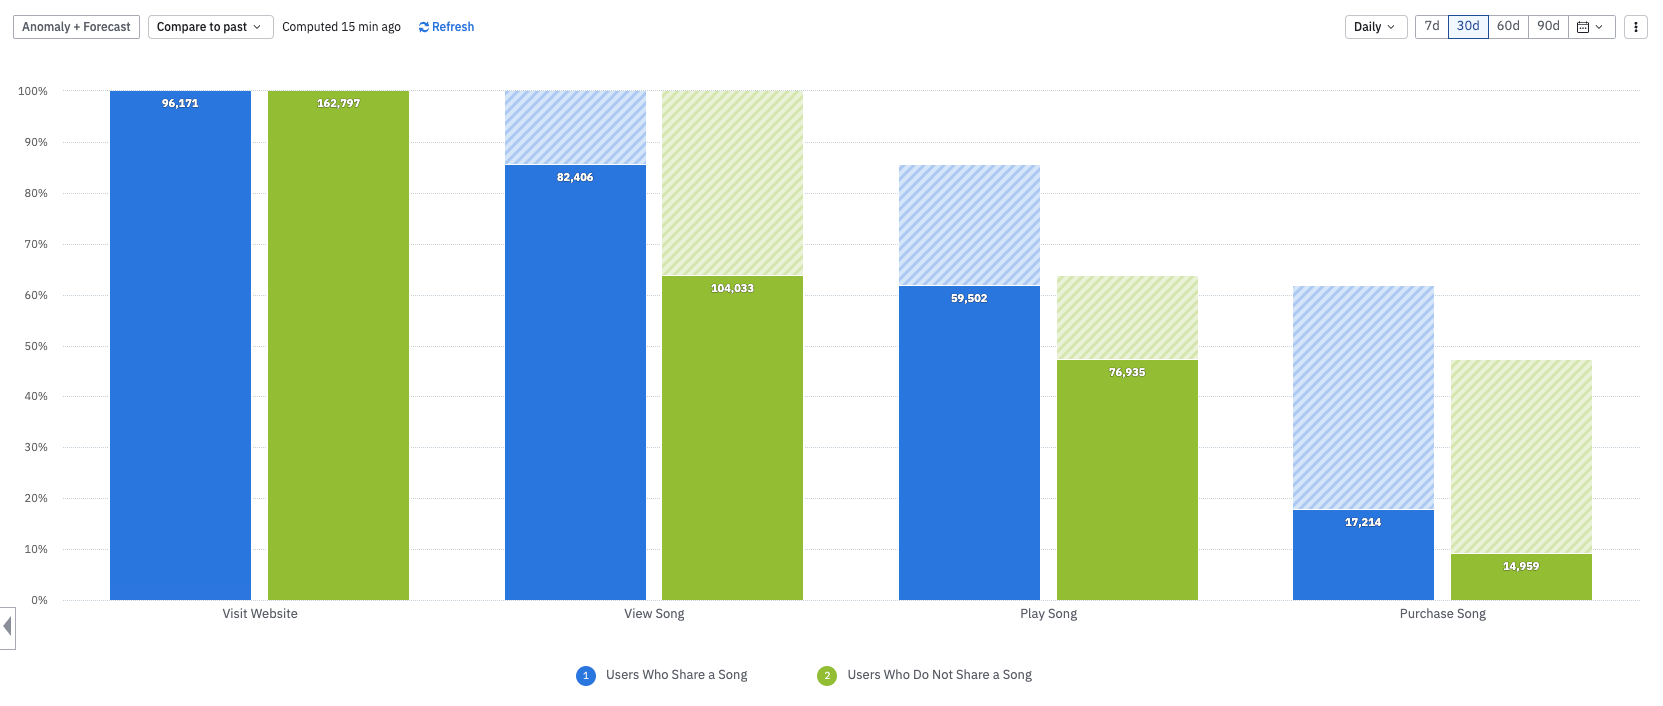
The chart above groups users by a specific behavior—whether they used the share a song feature or not. You can see that users who share a song (blue) have higher conversion rates throughout the sales funnel than those who do not (green). This insight might prompt you to experiment with surfacing the share song feature earlier in the customer journey.
Three sales funnel analysis examples that led to increased conversions and leads
8×8 revamps the Jitsi product roadmap to double retention
When 8×8’s video conferencing tool Jitsi.org realized its growth had stagnated, they used Amplitude’s Funnel Analysis and Conversion Drivers to investigate the reason. The analysis revealed that very few users were using their Chrome extension, which makes video conferencing tools available in your browser. But users who use the extension were much more likely to convert.
The funnel analysis also revealed that users held more unscheduled meetings than scheduled ones. This insight led 8×8 to change their product roadmap and release updates that make spontaneous meetings easier. They also improved the discoverability of their Chrome extension. Both of these changes helped double their retention rate.
Rappi offers free shipping costs to boost average order size by 15%
Latin American delivery app Rappi used Amplitude to perform a sales funnel analysis to track conversions. For Rappi, conversions refer to becoming a member of Rappi’s paid prime program, which consists of a monthly subscription with free delivery options. Rappi tested whether a free trial or a low-cost paid trial led to more subscriptions and found that users who paid for a low-cost trial were 25% more likely to purchase the subscription at the end of the trial.
Rappi also observed a significant drop in conversion rates when they added “shipping costs” to their orders. So Rappi offered free shipping costs when orders were above a specific dollar amount, which increased the average order size by 15%.
Blue Apron refreshed a prominent page to increase conversion by 5.5%
Meal box service Blue Apron discovered their recipe page was a critical part of the user’s digital experience. They used Amplitude’s Funnel Analysis to explore which pages were generating the highest conversion rates and found that visitors to the recipes page often continued to sign up for an account.
This insight indicated that recipe information helped move potential customers further down the sales funnel, so Blue Apron took action to refresh their recipes page. They added a stronger call-to-action and provided more information about upcoming recipes. This effort increased their conversion rate by 5.5%.
Best sales funnel software
Funnel flow software can help you perform conversion funnel analysis more easily. There are several sales funnel tools you can use to conduct a sales funnel analysis, including:
- Amplitude
- ClickFunnels
- GetResponse Autofunnel
- HubSpot Lead Management
- Kajabi
- Leadpages
- PlusThis
- Systeme.io
- Wishpond
Learn more about these and other sales funnel software on a review site like G2.
The customer journey doesn’t end at the last stage of your sales funnel. Learn about your product’s growth loops, or flywheels, in our Guide to Flywheels. Or if you’re ready to start analyzing your sales funnel today, get started with a free Amplitude plan.
Resources
- What Is Funnel Analysis? Definition, Examples, and Tools, Amplitude
- Build and Analyze a Funnel Analysis Chart Video, Amplitude
- Funnel Analysis and Its Use Cases Live Session, Amplitude
- The AIDA Model, SmartInsights.