
ref Update: In 2017, Amplitude migrated our SQL Query option from Redshift to Snowflake. Snowflake proved to be both faster and more cost effective than Redshift for our use case, and enabled us to offer a better end-user experience (including the ability to show SQL Charts within Amplitude Dashboards).
When Amplitude first started, we talked to a lot of customers about what they needed in a mobile analytics platform. Before we even built a product, we talked to dozens of companies to hear what they had to say. We’d take what we learned from these conversations, and use that to build our dashboards.
“So, what we’d really like is a way to get a list of users who came into our app through our last social media campaign, then invited at least 5 friends, and then used their discount code. Can we do that in Amplitude?” – Customer
One thing that kept coming up was that our early customers all had lots of specific, ad hoc queries like the one above. While they liked our dashboards, they also wanted to be able to answer more complex, specialized questions about user behavior.
Many of these first customers were ex-Zynga employees who were used to having an army of analysts who would run any analysis they needed. Each app team’s questions were very different, and it just wasn’t feasible to make a highly customized dashboard for every customer.
Many of our users had experience writing SQL queries, however, and said they wanted the option of querying analytics data themselves. Unfortunately, their teams didn’t have the resources needed to build out the infrastructure for data warehousing and querying in-house.
We realized that easy access to raw data was a huge missing piece in current analytics solutions. If we provided this access, we could give users the ability to answer essentially any question they wanted.
So, we decided we had to solve this problem: users of Amplitude would be able to painlessly run SQL queries on their raw data, without having to deal with data warehousing, or cleaning and formatting the data themselves. All of that would be included in the Amplitude platform. But to make this happen, we had to be careful to pick the right tools. Keep in mind, while today we have 15 employees and track over 20 billion events per month, at the time Amplitude was just three people. Like our early users, we were intensely resource constrained.
The whole Amplitude team back in 2013 (pardon the picture quality). From left to right: Curtis Liu, CTO; Spenser Skates, CEO; and Alan Ibrahim, Director of Customer Success.

One of the biggest decisions we made at that stage was to use Amazon Redshift analytics for our data warehousing. This ended up having a major impact on our product and company, and we’re convinced we made the right choice over all Redshift alternatives, so we’re going to walk you through how we made it.
Data warehousing options
As we thought about how our service would work, we decided on a few key requirements.
1. Efficient querying and storage for structured data. We collect events, and our data is structured and append-only. We were looking for a warehousing solution that could quickly perform aggregates over large amounts of this kind of data.
2. Fully managed rather than licensed. We needed a solution that would allow us to focus on the user experience, rather than get bogged down in the logistics of maintaining our own servers.
3. On-demand and scalable. We needed a flexible solution that we would quickly scale to handle increasing volumes of data — from our first few customers and a few hundred million data points, all the way up to hundreds of billions of data points per month.
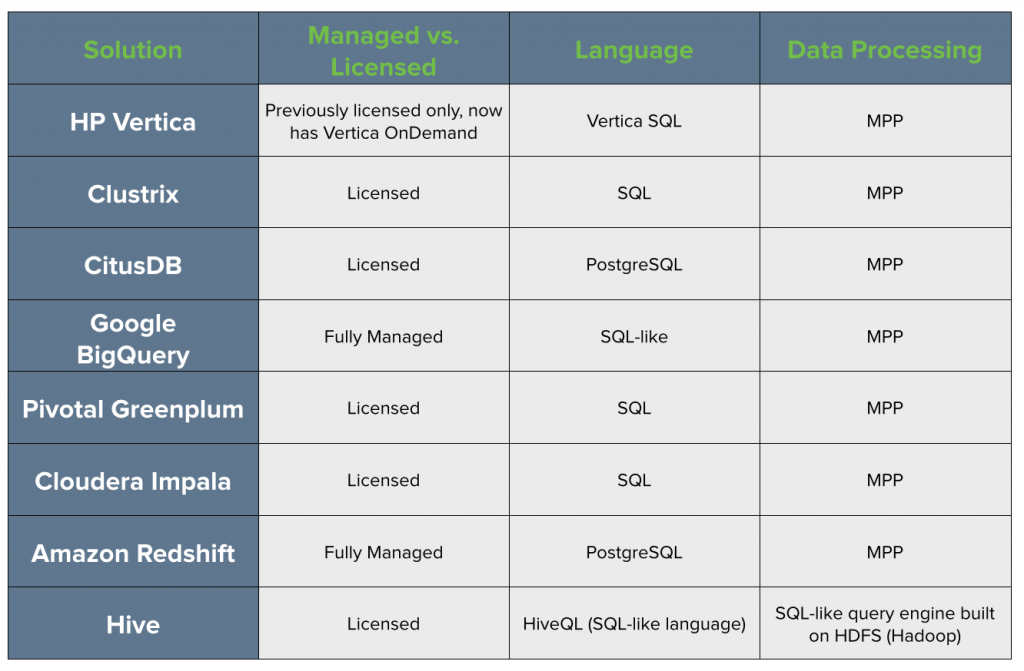
4. Follow the SQL standard. Given SQL’s wide usage, the vast majority of our intended users would already be comfortable using SQL to query their data. Below, you can see a table of all the different data warehousing options on our radar. These included HP Vertica, ClustrixDB, CitusDB, Google BigQuery, Amazon Redshift (which, in 2013, had just been released), and Hive.
Efficient querying and storage for structured data
Almost all of the solutions we considered have an MPP (massively parallel processing) architecture, which means that your data and queries get distributed across all of your nodes for the most efficient storage and processing.
Hive, on the other hand, works a bit differently. In a nutshell, Hive is a SQL-like data warehouse infrastructure built on HDFS (Hadoop Distributed File System). Instead of MPP, Hadoop uses a distributed processing model called MapReduce, which is also designed to process large data sets quickly. Hive + Hadoop are great for querying unstructured data, but that’s not what we needed.
At Amplitude, we collect events, and our data is semi-structured and append-only. MPP would give us faster query speeds, and thus a better experience for our users. In addition, Hive doesn’t have as robust a set of analytical functions as the MPP options. It also does not fully comply with standard SQL, which was one of our key requirements.
Thus, we moved on to look at Hive + Hadoop alternatives. For further discussion on Hive vs. MPP, you can check out this Quora thread on the topic. The engineers at Airbnb found that Redshift had a 5-20x speed improvement over Hive, while others have found >10x improvements in both speed and cost. In the end, performance was 90% of why we didn’t go with Hive, the other 10% being the headache of running a Hadoop cluster.
Managed vs. licensed
Many existing data warehousing solutions require you to purchase a license, and then set up the warehouse on your own servers, whether they’re on the cloud or on-premise, physical servers. First of all, we needed a cloud-based data warehouse, as there was no way we could have a physical server warehouse in this office:
Amplitude’s very first office — cozy.

Second, we didn’t want to have to manage our own servers. With our starting team, there was simply no way we could deal with setup and maintenance of a large data warehouse, especially since our primary focus was on the user experience.
Rather than go through the trouble of purchasing a license and setting the warehouse up on our own cloud or on-premise servers, with these fully managed services you can simply create an account and get started. With server management out of the way, we could work on streamlining the ETL pipeline and optimizing the data-processing infrastructure for faster query speeds.
Requiring a fully managed solution really helped us narrow down our options. At the time, the only options available were Amazon Redshift and Google BigQuery. Data warehouses that required licensing, like HP Vertica, Pivotal Greenplum, and Cloudera Impala were immediately out of the running. (As you can see in the table above, HP Vertica now offers their own on-demand solution, called Vertica OnDemand. It seems that the pricing model works similarly to other managed on-demand warehouses like Redshift, but we haven’t evaluated Vertica vs Redshift ourselves.)
On-demand and Scalable
Both Redshift and BigQuery offer on-demand and scalable solutions, which was another core requirement for us. This goes hand in hand with being fully managed. With our early customers, we would only need to handle a few hundred million data points; but we knew that with any luck, we’d need to scale rapidly as more users adopted our platform.
Must follow the SQL standard
At this point, we had narrowed our options down to Amazon Redshift vs Google BigQuery. Both solutions are incredibly powerful and flexible, but the final decision came down to the query language. BigQuery allows you to query your data using a SQL-like language called BigQuery’s SQL dialect.
However, it diverges from the SQL standard for many functions, which forces users who are accustomed to standard SQL to learn these differences and figure out the equivalent for many common functions. Not complying to standard SQL also makes it difficult to integrate with many 3rd party visualization or analysis tools that are built for working with SQL.
Redshift, on the other hand, uses industry-standard SQL, and is based off PostgreSQL 8.0.2. There are some slight differences between Amazon Redshift SQL and PostgreSQL, most of which are there to make Redshift better at querying large data sets.
Since SQL is already widely used by engineers and analysts, it made sense to provide our customers with data that they could query using familiar methods. The query semantics are exactly what our users expect, and they don’t have to learn a new language.
Perhaps equally important is that, because Redshift is built on Postgres, it’s easy for users to integrate their Redshift datastore with many other business intelligence and dashboarding tools which are interoperable with Postgres. These include data visualization tools like Tableau, Chartio, and Looker, as well as commonly used desktop SQL tools like Navicat and SQL Workbench. BigQuery does offer integrations with some third-party tools, but the options aren’t nearly as extensive as for Redshift.
The perks of Redshift
In the end, Redshift was the clear winner. It was a cloud-based, fully managed and hosted solution, which would allow us to scale as needed to massive data volumes, and it’s is built on Postgres, making it easy to use and integrate with other tools.
Furthermore, Redshift was designed specifically for the purpose that we wanted to use it for: to perform complex queries against very large data sets of structured data. Redshift performance is such that it can scan over terabytes of data in just a few minutes, meaning that our users can get answers to their questions quickly: in seconds to minutes, depending on the query complexity and data volume.
Last but not least, using Redshift analytics is incredibly cost-effective, which is necessary for us to provide our users with a reasonably priced service. The on-demand pricing structure allows us to pay only for what we need, and easily add nodes for more data storage and processing power as we add more data from users.
Compared to traditional data warehouses, where you have to pay for an upfront license fee as well as hardware and maintenance costs, Redshift provides huge savings. According to Amazon (so this data point may be somewhat biased), running an old school data warehouse costs $19,000 – $25,000 per terabyte per year. Redshift, on the other hand, boasts that it costs only $1,000 per terabyte per year at its lowest pricing tier.
Redshift pricing
Amazon Redshift costs $935 per TB per year for their lowest tier. AWS offers both on-demand and reserved instance pricing structures, with both Dense Compute and Dense Storage nodes. Reserved instance pricing offers a significant discount (up to 75%) over the on-demand rates, which start at $3,725 per TB per year.
The real value of Redshift
Beyond all the technical bells and whistles, though, the real value of Redshift over other Redshift competitors is that our customers can do ad hoc queries on all of their analytics data whenever they want. They don’t need to worry about the ETL process, or the costs of hosting their data; all they need to do is log in. This allows us to provide a unified business intelligence solution for app product teams – from marketers to product managers to data scientists to engineers. Our dashboards allow anyone to get insights about how their users are behaving in their app with just a few clicks. And more technical users can dig even deeper, going beyond the dashboards to look at custom metrics and answer really complex questions.
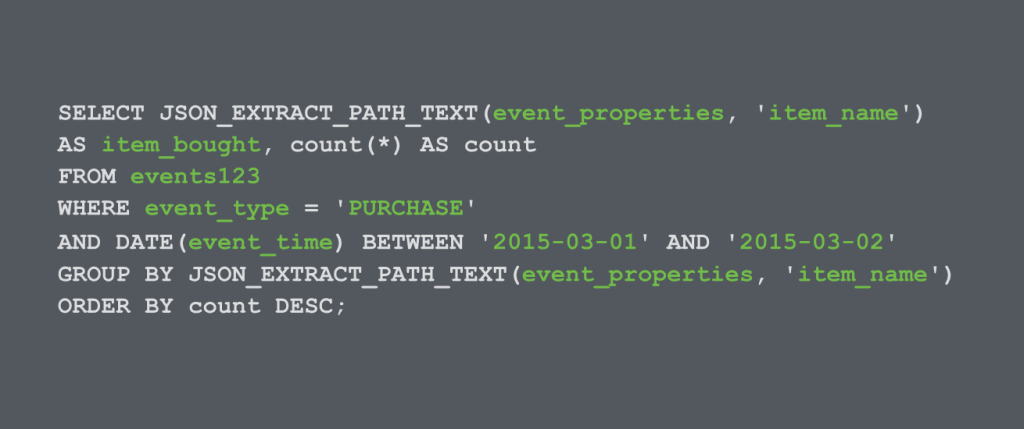
This commonly used query outputs the list of items bought and how frequently that item was purchased.
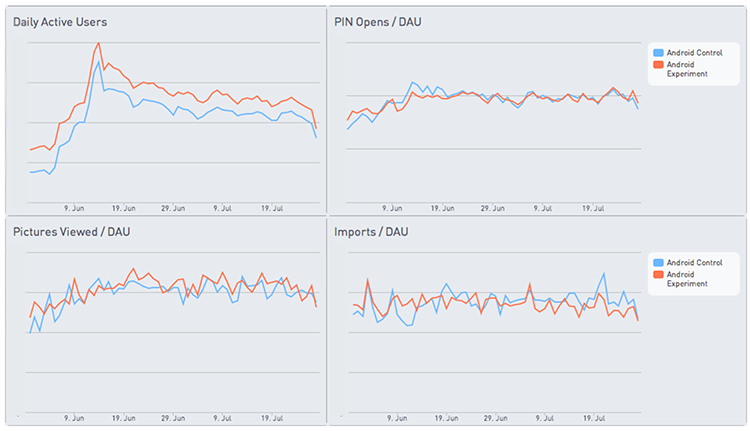
Zouhair Belkoura, CEO of KeepSafe, is an Amplitude customer. He uses Redshift to keep track of custom product metrics for the Keepsafe app, which provides secure photo storage on your phone. In addition to keeping track of his Daily Active Users (DAU), he needs details about what those DAUs are doing: how many pictures they view and import, and how many times they unlock their secure photo album. Zouhair uses his Amplitude Redshift database, connected to Periscope, a SQL query and data visualization tool, to calculate these metrics and make graphs like these:
KeepSafe uses their Amplitude Redshift database to calculate custom metrics like Pictures Viewed, PIN Opens, and Imports per Daily Active User (DAU). They hook up their Redshift database to Periscope for data visualization.
Another one of our users, an ordering platform, wanted to know what users did in their app after placing an order. By leveraging Redshift, they were able to write a query that told them the next 3 actions that users took in their app after ordering, from the most common to least common sequences of actions. **That’s the real value of Redshift for us: allowing our users to make ad-hoc queries and answer any question they want, with no limitations. **
The fact that we could leverage that technology when we were just a 3-person team working out of a tiny office was instrumental in us landing and providing real value to our early customers, despite our limited resources at the time.