# Amplitude Documentation — Full Corpus
# Generated: 2026-08-01T04:49:26Z
# Pages: 605
# Source: https://amplitude.com/docs/llms.txt
================================================================================
# Get Started
URL: https://amplitude.com/docs/get-started
================================================================================
# Get Started
This section walks a new Amplitude account from zero to a first chart: send events from your product, model the data, build a chart that answers a product question, and share it with the team that owns the work. Start here when you're setting up a new project or onboarding a teammate; if you want a one-command setup that writes the SDK integration for you, go to the [Wizard CLI](https://amplitude.com/docs/get-started/setup-wizard-cli) instead.
{% outcomes heading="Get started" %}
{% outcome icon="Plug" title="See your product in Amplitude today" href="https://amplitude.com/docs/get-started/amplitude-quickstart" %}
Pick an SDK or source and start streaming events from your product in minutes.
{% /outcome %}
{% outcome icon="LineChart" title="Answer your first product question" href="https://amplitude.com/docs/get-started/setup-wizard-cli" %}
Run the Wizard CLI to instrument your codebase and get a first dashboard from one terminal command.
{% /outcome %}
{% outcome icon="MessageSquare" title="Reach users without shipping code" href="https://amplitude.com/docs/guides-and-surveys" %}
Launch in-product guides and surveys to onboard, announce, and learn from users.
{% /outcome %}
{% outcome icon="FlaskConical" title="Test before you commit" href="https://amplitude.com/docs/feature-experiment/experiment-quick-start" %}
Roll out behind a flag and run A/B tests so the data, not a hunch, drives the release.
{% /outcome %}
{% outcome icon="ShieldCheck" title="Trust the data your charts use" href="https://amplitude.com/docs/data/data-overview" %}
Plan a taxonomy, validate events, and govern the data your team relies on every day.
{% /outcome %}
{% outcome icon="Users" title="Put findings in front of the right people" href="https://amplitude.com/docs/get-started/spaces" %}
Use spaces to organize charts, dashboards, and notebooks for the team that owns the work.
{% /outcome %}
{% /outcomes %}
## Set up the foundation
Create the account, project, and tracking plan that help Amplitude answer product questions from clean data.
- [Create an account](https://amplitude.com/docs/get-started/create-a-new-account) to start your Amplitude workspace.
- [Create a project](https://amplitude.com/docs/get-started/create-project) for the product or environment you want to analyze.
- [Plan your implementation](https://amplitude.com/docs/get-started/plan-your-implementation) to connect business questions to the events you track.
- [Identify users](https://amplitude.com/docs/get-started/identify-users) so Amplitude connects activity across sessions and devices.
## Build your first workflow
After data flows into Amplitude, use charts and shared spaces to turn activity into decisions.
- [Select events](https://amplitude.com/docs/get-started/select-events) that represent meaningful user actions.
- [Create a chart](https://amplitude.com/docs/get-started/create-a-chart) to answer your first product question.
- [Start from a template](https://amplitude.com/docs/get-started/start-from-template) to use prebuilt analysis patterns.
- [Share work in spaces](https://amplitude.com/docs/get-started/spaces) so teammates can find related charts, dashboards, and notebooks.
{% academy-link
title="Getting Started with Amplitude Analytics"
url="https://academy.amplitude.com/path/getting-started-with-amplitude-analytics-learning-path"
description="Learn the most fundamental features of Amplitude Analytics, including cohorts."
/%}
================================================================================
# Amplitude Quickstart
URL: https://amplitude.com/docs/get-started/amplitude-quickstart
Updated: 2026-04-12
================================================================================
# Amplitude Quickstart
Amplitude offers three install paths: a CLI wizard that detects your framework and writes the SDK integration, a copy-paste AI prompt for use inside Cursor or Claude Code, and a browser snippet that drops into your site's ``. All three send data to the same Amplitude project, so you can start with the fastest option and switch later.
## Pick the best path for you
{% card-grid columns="3" %}
{% card kind="quickstart-path" eyebrow="Wizard CLI" title="Full SDK setup" href="#wizard-cli" icon="⌘" meta="~15 min" tone="blue" featured=true %}
Best for developers or anyone comfortable in a terminal. The wizard detects your framework, authenticates you with Amplitude, and wires up the core implementation flow.
Full SDK setup.
AI-generated custom events.
MCP, Slack, and Teams integration.
{% /card %}
{% card kind="quickstart-path" eyebrow="AI Prompt" title="Low-code setup" href="#ai-prompt" icon="✦" meta="~5 min" tone="purple" %}
Best for teams that use AI coding tools. Paste one prompt into Cursor, Claude Code, Copilot, or another assistant and let it handle the implementation steps.
Full SDK setup.
Autocapture and Session Replay.
Client-side initialization guidance.
{% /card %}
{% card kind="quickstart-path" eyebrow="Browser Snippet" title="Paste-and-go install" href="#browser-snippet" icon="▣" meta="~2 min" tone="teal" %}
Best for web teams that want the fastest setup. Add one script tag to your site's `` and start collecting browser data without a bundler.
Script-tag install.
Autocapture.
Session Replay and remote config.
{% /card %}
{% /card-grid %}
---
## Wizard CLI
Full SDK setup for developers. The wizard authenticates you with Amplitude, detects your framework, proposes custom events, and confirms that data reaches your project before it exits.
{% prerequisites heading="What you get" %}
{% prerequisite %}
Full SDK setup with framework detection.
{% /prerequisite %}
{% prerequisite %}
[Autocapture](https://amplitude.com/docs/data/autocapture), including sessions, clicks, page views, and forms.
{% /prerequisite %}
{% prerequisite %}
[Session Replay](https://amplitude.com/docs/session-replay), [Feature Experiment](https://amplitude.com/docs/feature-experiment/workflow/feature-flag-rollouts), and [Guides & Surveys](https://amplitude.com/docs/guides-and-surveys).
{% /prerequisite %}
{% prerequisite %}
AI-generated custom events plus [Amplitude MCP](https://amplitude.com/docs/amplitude-ai/amplitude-mcp), [Slack](https://amplitude.com/docs/analytics/integrate-slack), and [Teams](https://amplitude.com/docs/analytics/integrate-microsoft-teams) integration.
{% /prerequisite %}
{% /prerequisites %}
Requires Node.js 20.
{% steps %}
{% step eyebrow="Run" title="Run the setup wizard" %}
Run the command in your terminal, or run it from Claude Code inside your terminal.
```bash
npx @amplitude/wizard
```
{% /step %}
{% step eyebrow="Add" title="Add your API key" %}
Paste the API key for the project you want to track when the wizard prompts you.
{% callout type="info" heading="Where to find your API key" %}
Go to _Settings > Projects_ and copy the API key for the project you want to track. Need an API key? Create a [free Amplitude account](https://app.amplitude.com/signup).
{% /callout %}
{% /step %}
{% step eyebrow="Verify" title="Verify that data is flowing" %}
Open the [Amplitude Debugger](https://amplitude.com/docs/analytics/debug-analytics) to confirm that the wizard's test events arrive in real time.
{% /step %}
{% /steps %}
**Tips**
- Use `--menu` to pick your framework instead of relying on auto-detection.
- Press `tab` during the wizard to ask questions or send feedback.
---
## AI Prompt
Low-code setup with an AI assistant. Copy this prompt into an AI coding tool to set up the Amplitude Browser SDK for a JavaScript web app without running the full wizard flow.
{% callout type="tip" heading="Set up with an AI prompt" %}
Use this option when you want an AI tool to make the code changes for you. If you want Amplitude to detect your framework and propose events automatically, use [Wizard CLI](#wizard-cli) instead.
{% /callout %}
{% prerequisites heading="What you get" %}
{% prerequisite %}
Full SDK setup for a JavaScript web app.
{% /prerequisite %}
{% prerequisite %}
[Autocapture](https://amplitude.com/docs/data/autocapture) and [Session Replay](https://amplitude.com/docs/session-replay).
{% /prerequisite %}
{% prerequisite %}
Remote config for feature flags and guides.
{% /prerequisite %}
{% /prerequisites %}
{% steps %}
{% step eyebrow="Copy" title="Copy the prompt into your AI tool" %}
Paste it into Cursor, Claude Code, Copilot, or another coding assistant that can edit your project.
```text
Install and configure Amplitude for this JavaScript web application.
Use API key: AMPLITUDE_API_KEY
Requirements:
- Run the implementation only on the client.
- Initialize Amplitude once during app load.
- Install the correct browser package for this project.
- Enable fetchRemoteConfig: true.
- Enable autocapture for attribution, page views, sessions, element interactions, form interactions, and file downloads.
- Enable Session Replay with sampleRate: 1.
- Preserve the project's existing TypeScript and framework patterns.
```
{% /step %}
{% step eyebrow="Review" title="Review the generated changes" %}
Confirm that the assistant installed the SDK, initialized it in the right client entry point, and kept the code client-side.
{% /step %}
{% step eyebrow="Verify" title="Verify that events arrive" %}
After the changes land, open the [Amplitude Debugger](https://amplitude.com/docs/analytics/debug-analytics) and confirm that page views and session data reach your project.
{% /step %}
{% /steps %}
**Tips**
- Click the **API key** button in the code block to insert your key before you copy the prompt.
- Create a [free Amplitude account](https://app.amplitude.com/signup) if you still need a project and API key.
---
## Browser Snippet
Paste-and-go install for websites. Paste this script into the `` of your site when you want the fastest possible browser install without a build step or npm package.
{% callout type="tip" heading="Set up with a browser snippet" %}
Use this option for static sites, CMS-driven sites, or any project where a script tag is easier than an SDK install. If you want framework-aware setup, use [Wizard CLI](#wizard-cli) instead.
{% /callout %}
{% prerequisites heading="What you get" %}
{% prerequisite %}
Script-tag install with no bundler.
{% /prerequisite %}
{% prerequisite %}
[Autocapture](https://amplitude.com/docs/data/autocapture) and [Session Replay](https://amplitude.com/docs/session-replay).
{% /prerequisite %}
{% prerequisite %}
Remote config for feature flags.
{% /prerequisite %}
{% /prerequisites %}
{% steps %}
{% step eyebrow="Paste" title="Paste the snippet into your site's ``" %}
Add it to every page you want to track.
```html
```
{% /step %}
{% step eyebrow="Set" title="Set your API key and load the page" %}
Replace the placeholder with your project's API key, then load a tracked page in your browser.
{% /step %}
{% step eyebrow="Confirm" title="Confirm data in Amplitude" %}
Open the [Amplitude Debugger](https://amplitude.com/docs/analytics/debug-analytics) and check for page view, session, and interaction events.
{% /step %}
{% /steps %}
**Tips**
- Click the **API key** button in the code block to insert your key before you copy the snippet.
- Use the EU CDN host if your project uses EU data residency.
- Create a [free Amplitude account](https://app.amplitude.com/signup) if you need a project and API key.
---
## Take the next step
After data starts flowing, use these guides to expand your implementation.
{% card-grid columns="3" %}
{% card kind="quickstart-link" title="Amplitude MCP server" href="https://amplitude.com/docs/amplitude-ai/amplitude-mcp" icon="⌁" tone="blue" %}
Query your analytics data from Claude, Cursor, or any other MCP-compatible client without leaving your workflow.
{% /card %}
{% card kind="quickstart-link" title="Claude Code plugin" href="https://github.com/amplitude/mcp-marketplace/tree/main/plugins/amplitude" icon="✦" tone="purple" %}
Install the Amplitude plugin for Claude Code to get built-in slash commands for charts, dashboards, and instrumentation work.
{% /card %}
{% card kind="quickstart-link" title="Custom events" href="https://amplitude.com/docs/sdks/analytics/browser/browser-sdk-2#track-an-event" icon="△" tone="green" %}
Track the product events that matter to your business after Autocapture covers the basics.
{% /card %}
{% card kind="quickstart-link" title="User identification" href="https://amplitude.com/docs/sdks/analytics/browser/browser-sdk-2#custom-user-identifier" icon="◎" tone="orange" %}
Connect anonymous activity to known users so you can analyze behavior across sessions and devices.
{% /card %}
{% card kind="quickstart-link" title="Group analytics" href="https://amplitude.com/docs/sdks/analytics/browser/browser-sdk-2#user-groups" icon="▣" tone="neutral" %}
Analyze behavior at the account, workspace, or team level with user groups.
{% /card %}
{% card kind="quickstart-link" title="Session Replay" href="https://amplitude.com/docs/session-replay" icon="▶" tone="teal" %}
Watch real user sessions alongside event data to find friction, confusion, and drop-off points.
{% /card %}
{% /card-grid %}
## More in this section
- [Amplitude MCP server](https://amplitude.com/docs/amplitude-ai/amplitude-mcp).
- [Claude Code plugin](https://github.com/amplitude/mcp-marketplace/tree/main/plugins/amplitude).
- [Custom events](https://amplitude.com/docs/sdks/analytics/browser/browser-sdk-2#track-an-event).
- [User identification](https://amplitude.com/docs/sdks/analytics/browser/browser-sdk-2#custom-user-identifier).
- [Group analytics](https://amplitude.com/docs/sdks/analytics/browser/browser-sdk-2#user-groups).
- [Session Replay](https://amplitude.com/docs/session-replay).
================================================================================
# Amplitude Wizard CLI
URL: https://amplitude.com/docs/get-started/setup-wizard-cli
Updated: 2026-06-05
================================================================================
# Amplitude Wizard CLI
The Amplitude Wizard CLI (`npx @amplitude/wizard`) installs Amplitude analytics into an existing codebase from one terminal command. It detects your framework, proposes tracking events based on your actual code, and writes the SDK integration in one session with your approval at every step.
Use the wizard when you want an AI agent to read your codebase and instrument events for you in one session. If you'd rather hand-pick events and write the SDK calls yourself, follow the [Amplitude Quickstart](https://amplitude.com/docs/get-started/amplitude-quickstart) instead.
```shell
npx @amplitude/wizard
```
The wizard runs in your terminal. Amplitude is testing Claude Code in Terminal, with Claude Code Desktop, Cursor Desktop, and more in development. Run `npx @amplitude/wizard --help` for information about subcommands and options.
{% callout type="note" %}
The Amplitude Wizard CLI requires Node.js 20+.
{% /callout %}
## What the Amplitude Wizard CLI does when you run it
1. **Authenticate**: The wizard signs you in (or picks up an existing session) and lets you choose your org, project, and data region.
2. **Detect your framework**: The wizard inspects your project and picks the right integration path. Auto-detection covers Next.js, Vue, React Router, Django, Flask, FastAPI, Swift, React Native, Android, Flutter, Go, Java, Unreal, and Unity, with language-level fallbacks for JavaScript (web), Python, and JavaScript (Node). If nothing matches, you can select manually or use the generic fallback. Web projects use [Browser SDK 2](https://amplitude.com/docs/sdks/analytics/browser/browser-sdk-2) or [Browser Unified SDK](https://amplitude.com/docs/sdks/analytics/browser/browser-unified-sdk).
3. **Propose and instrument events**: An Amplitude AI agent reads your codebase, proposes tracking events based on what your app does, and waits for your approval before writing any code. You don't need your own agent license.
4. **Set up MCP integration**: The wizard offers to install the Amplitude MCP server in your editor so you can query your analytics data in plain English.
5. **Verify**: The wizard polls the Amplitude API until it detects events arriving. Run your app, trigger some actions, and the wizard shows you the events as they flow in.
6. **Create charts and a dashboard**: The agent builds your first dashboard in Amplitude so you have something useful the moment data starts flowing.
If you stop the wizard with Ctrl+C, it crashes, or you close the terminal, the wizard saves a checkpoint. Run it again in the same directory to resume.
## Access your Amplitude data from the tools you already use
- **Terminal or IDE**: Use the Amplitude MCP server to ask questions about your data in plain English from Claude, Cursor, or any MCP-compatible AI tool. Agents can run the CLI using `--agent` mode.
- **Claude Code plugin**: Install the [Amplitude plugin for Claude Code](https://github.com/amplitude/mcp-marketplace/tree/main/plugins/amplitude), which provides the same MCP tools along with built-in slash commands for quick access.
Inside a Claude Code session:
```bash
/plugin install amplitude
```
Or from your terminal:
```bash
claude plugin install amplitude
```
After installing, run `/mcp` in Claude Code and follow the browser prompts to log in to Amplitude. The plugin includes slash commands like `/amplitude:create-chart`, `/amplitude:create-dashboard`, `/amplitude:instrument-events`, `/amplitude:replay-ux-audit`, `/amplitude:weekly-brief`, and more.
- **Slack or Teams app**: Connect Amplitude to your team's messaging tool to get insights, create charts, and more where you work.
## Run the Amplitude Wizard CLI from an AI agent
AI coding agents can drive the wizard end-to-end. `--agent` mode streams [NDJSON](https://github.com/ndjson/ndjson-spec) lifecycle events on stdout (one JSON object per line, each with a `v:1` envelope) so an orchestrator can render progress, file diffs, and prompts in real time. It auto-approves the wizard's prompts.
The right way to skip the human depends on whether the user already has an Amplitude account.
**Net-new Amplitude account.** Pass `--auth-onboarding create-account` plus the user's details so the wizard provisions the org, project, and app for them. Skip `--api-key` entirely. The wizard mints one as part of account creation. `--email`, `--full-name`, `--accept-tos`, and `--region` are all required when combining `create-account` with `--agent`, because the wizard has no TTY to prompt for them.
```shell
npx @amplitude/wizard --agent \
--auth-onboarding create-account \
--email \
--full-name "" \
--accept-tos \
--region \
--app-name "" \
-y
```
`--agent` already implies `--auto-approve`. `-y` is still needed to grant the inner agent write capability.
{% callout type="warning" %}
**`--accept-tos` and `--region` need explicit human consent.** AI coding agents and orchestrators must not pass these flags on the user's behalf without confirmation:
- `--accept-tos` programmatically accepts Amplitude's [Terms of Service](https://amplitude.com/terms). The acceptance is legally binding on the human whose account the wizard creates, not on the agent. Treat it like a click-through "I agree" checkbox: ask first, pass the flag only after the user confirms.
- `--region` (`us` or `eu`) selects the data center for the new account and has data-residency implications. Ask the user which region applies to them, based on regulatory requirements, internal data-handling policy, or where their other Amplitude data already lives. Then pass the chosen value verbatim.
Omitting either flag in `--agent` mode is a hard error, which is the intended safeguard.
{% /callout %}
**Existing Amplitude account, fully unattended.** Pass an Amplitude project API key inline so the wizard can skip OAuth. Add `--app-id ` to bind the run to a specific Amplitude app. It's the only scope flag agents need, because the wizard derives org, project, and environment automatically:
```shell
npx @amplitude/wizard --agent --install-dir . --api-key --app-id
```
**Existing Amplitude account, prior login on the same machine.** After a one-time `npx @amplitude/wizard login`, you can omit `--api-key` and the wizard reuses the stored OAuth token.
{% callout type="warning" %}
Don't pipe `--agent` output through `head`, `tail`, or `grep`. SIGPIPE ends the inner setup agent mid-run. Redirect to a file with `> wizard.log 2>&1` and tail it separately. If a run is interrupted, resume with `npx @amplitude/wizard --agent --resume -y`.
{% /callout %}
### Key flags
| Flag | Purpose |
| -------------------------- | ----------------------------------------------------------------------------------------------------------------------------------------------------------------------------------------------------------------------------------------------------------------------------- |
| `--api-key ` | Amplitude project API key for an existing account. Skips OAuth so the wizard can run unattended. Or set `AMPLITUDE_WIZARD_API_KEY`. |
| `--install-dir ` | Directory to install in. Required for `--agent`. |
| `--yes` / `-y` | Skip all confirmation prompts and let the inner agent write files. Required for the `apply` subcommand and for `create-account` runs. |
| `--auto-approve` | Silently pick the recommended choice on `needs_input` prompts. Doesn't grant write capability on its own; pair with `--yes` for that. `--agent` already implies `--auto-approve`. |
| `--auth-onboarding ` | OAuth path: `sign-in` (default) for an existing account, or `create-account` to provision a brand-new Amplitude account from the CLI. |
| `--email ` | Email for new-account creation. Required with `--auth-onboarding create-account` in `--agent`. |
| `--full-name ""` | Full name for new-account creation. Quote the value when it contains spaces. Required with `--auth-onboarding create-account` in `--agent`. |
| `--accept-tos` | Programmatically accepts Amplitude's [Terms of Service](https://amplitude.com/terms) on the user's behalf. Required with `create-account` in `--agent`. Don't pass without explicit user consent. The acceptance is legally binding on the human, not on the agent. |
| `--region ` | Data-center region (`us` or `eu`) for the new account. Has data-residency implications. Required with `create-account` in `--agent`. Don't default on the user's behalf; ask which region applies. Also accepted as `--zone`. |
| `--app-name ""` | Name for a new Amplitude app. Creates one when no apps exist, or whenever passed in `--agent`. |
| `--app-id ` | Numeric Amplitude app ID for an existing app. The only scope flag agents need; the wizard derives org, project, and environment automatically. |
| `--project-id ` | Numeric Amplitude project ID. Use when scoping to a project rather than a specific app. |
| `--resume` | Load the saved checkpoint and skip already-completed steps. Useful after a SIGPIPE or interrupted run. |
| `--json` | Machine-readable JSON output without the auto-approve side effects of `--agent`. |
Run `npx @amplitude/wizard manifest` to print the full machine-readable CLI surface (flags, environment variables, exit codes, and a glossary) as JSON.
### Plan, apply, and verify
For agents that want a human in the loop on the diff, split a run into three phases. `plan` and `verify` never touch disk:
```shell
npx @amplitude/wizard plan --json
npx @amplitude/wizard apply --plan-id --yes
npx @amplitude/wizard verify --json
```
1. `plan --json` builds a `WizardPlan` containing the detected framework, SDK choice, and intended file changes, then returns a `planId` that's valid for 24 hours. The output also includes a ready-to-run `resumeFlags` array. Feed it straight into `apply`.
2. `apply --plan-id --yes` executes the plan and streams NDJSON `file_change` events for every write. Add `--force` to allow destructive overwrites.
3. `verify --json` runs a cheap, no-network check that the SDK, API key, and framework integration are all in place. It exits non-zero on failure.
Other agent-friendly subcommands include `detect --json`, `status --json`, `auth status --json`, and `auth token` for reading the stored OAuth token from other scripts.
### MCP server mode
`npx @amplitude/wizard mcp serve` exposes the wizard's read-only operations as [Model Context Protocol](https://modelcontextprotocol.io) tools over stdio. AI agents call them as typed tools instead of spawning the CLI and parsing output. Add this snippet to your MCP client's config:
```json
{
"mcpServers": {
"amplitude-wizard": {
"command": "npx",
"args": ["-y", "@amplitude/wizard", "mcp", "serve"]
}
}
}
```
The server exposes `detect_framework`, `get_project_status`, `plan_setup`, `verify_setup`, `get_auth_status`, and `get_auth_token`. Pair `plan_setup` with the `apply` CLI subcommand to execute the resulting plan.
### Environment variables
The wizard reads these variables in `--agent` runs:
| Variable | Effect |
| ------------------------------ | ---------------------------------------------------------------------------------------------- |
| `AMPLITUDE_WIZARD_AGENT=1` | Force agent mode (NDJSON output, auto-approve prompts). |
| `AMPLITUDE_WIZARD_API_KEY` | Amplitude project API key. Equivalent to `--api-key`. |
| `AMPLITUDE_WIZARD_INSTALL_DIR` | Directory to install in. Equivalent to `--install-dir`. |
| `AMPLITUDE_WIZARD_PROJECT_ID` | Amplitude project ID. Equivalent to `--project-id`. |
| `AMPLITUDE_WIZARD_YES` | Skip all confirmation prompts. Equivalent to `--yes`. |
| `AMPLITUDE_TOKEN` | OAuth access-token override. Requires a prior `npx @amplitude/wizard login` to mint the token. |
| `AMPLITUDE_WIZARD_TOKEN` | Alias for `AMPLITUDE_TOKEN`. |
| `AMPLITUDE_WIZARD_MAX_TURNS` | Override the inner agent's per-run turn cap (default 200, max 10000). |
### Exit codes
Orchestrators can branch on the wizard's exit code:
| Code | Meaning |
| ----- | ------------------------ |
| `0` | Success. |
| `1` | General error. |
| `2` | Invalid arguments. |
| `3` | Authentication required. |
| `4` | Network error. |
| `10` | Inner agent failed. |
| `130` | User cancelled (Ctrl+C). |
Exit code `3` (`AUTH_REQUIRED`) is the critical signal for orchestrators. The wizard emits it when an `--agent` run starts without valid credentials, alongside a structured `lifecycle` NDJSON event whose `data.loginCommand` and `data.resumeCommand` arrays tell the orchestrator exactly how to prompt the human to sign in and re-run. Reason values include `no_stored_credentials`, `token_expired`, `refresh_failed`, and `env_selection_failed`.
```json
{
"v": 1,
"type": "lifecycle",
"level": "error",
"data": {
"event": "auth_required",
"reason": "no_stored_credentials",
"loginCommand": ["npx", "@amplitude/wizard", "login"],
"resumeCommand": ["npx", "@amplitude/wizard", "--agent"]
}
}
```
On `no_stored_credentials`, an alternative to surfacing `loginCommand` is to re-invoke with the net-new account flags (`--auth-onboarding create-account` plus `--email`, `--full-name`, `--accept-tos`, `--region`, `--app-name`) and create a fresh account inline. This path isn't zero-prompt, because `--accept-tos` and `--region` still need explicit human input, but it skips the browser-based OAuth handshake.
## Things to try after your data is flowing
- **Watch your first session replay**: Review exactly what users experience in your app.
- **Launch a web experiment**: A/B test features with no extra code using the Visual Editor.
- **Create a guide or survey**: Collect in-product feedback or surface messages to specific user segments.
## Feedback
The wizard is open source. View the source, report issues, and contribute on [GitHub](https://github.com/amplitude/wizard).
Share what's working and what you'd like next: wizard@amplitude.com.
================================================================================
# Provision Amplitude with Stripe Projects
URL: https://amplitude.com/docs/get-started/stripe-projects
================================================================================
# Provision Amplitude with Stripe Projects
[Stripe Projects](https://docs.stripe.com/projects) is a CLI tool that provisions third-party services (databases, auth, analytics, and more) under a single Stripe-managed billing relationship. Amplitude is an integrated provider, so you can create an Amplitude organization, project, and SDK API key without leaving your terminal.
```shell
stripe projects add amplitude/analytics
```
That one command creates your Amplitude org (or links you back to an existing one), provisions a default project, and writes an API key into your Stripe Projects vault. From there, run the [Amplitude Wizard CLI](https://amplitude.com/docs/get-started/setup-wizard-cli) with `npx @amplitude/wizard`, or [initialize the Amplitude Unified SDK](https://amplitude.com/docs/sdks/analytics/browser/browser-unified-sdk) directly, and you're sending events.
{% callout type="note" %}
Stripe Projects requires the Stripe CLI. Go to [Stripe's Projects documentation](https://docs.stripe.com/projects) for installation and authentication steps.
{% /callout %}
## Before you start
{% prerequisites %}
{% prerequisite %}
The Stripe CLI, authenticated against your Stripe account.
{% /prerequisite %}
{% prerequisite %}
A Stripe Projects directory — run `stripe projects init ` if you don't have one.
{% /prerequisite %}
{% prerequisite %}
For paid plans only: a billing method on your Stripe account, added with `stripe projects billing add`.
{% /prerequisite %}
{% /prerequisites %}
You don't need an existing Amplitude account. If the email on your Stripe profile already owns an Amplitude organization, Amplitude links the new project to it. Otherwise, Amplitude creates a fresh organization for you.
## Browse the catalog
Inspect what Amplitude exposes through Stripe Projects before you provision:
```shell
stripe projects catalog amplitude
stripe projects catalog amplitude --json
```
Two kinds of entries show up:
- `amplitude/analytics`: the deployable resource. Provisions an Amplitude project that includes product analytics, feature flags, session replay, and experimentation.
- Plan services: purchasable tiers that determine your monthly tracked user (MTU) quota and billing. Amplitude always offers the Free plan and one or more `plus-v3-*` paid plans.
## Provision Amplitude
### Free plan
Free is the default. It includes up to 10,000 monthly tracked users, core analytics, feature flags, and session replay. No billing method is required.
```shell
stripe projects add amplitude/analytics
```
### Paid plan
Pick a tier from the catalog and pass it as the `plan_tier` configuration field:
```shell
stripe projects add amplitude/analytics --config '{"plan_tier":"plus-v3-10k-mtu-monthly"}'
```
Stripe collects payment through a shared payment token at provision time. Your card details never reach Amplitude. Stripe Projects offers monthly billing only. To switch to annual billing, go to the Amplitude dashboard at _Settings > Billing_ after provisioning.
### Account configuration
The first time you provision Amplitude in a Stripe Project, the CLI prompts you for two fields:
- `region`: `us` or `eu`. Determines the data center where Amplitude stores and processes your data. This setting is immutable after Amplitude creates the account.
- `marketing`: optional boolean. Opts you in to product updates and marketing email from Amplitude.
## What you get back
A successful provision writes an `access_configuration` object into your Stripe Projects vault. Pull it into your local environment:
```shell
stripe projects env --pull
```
The vault stores:
- `api_key`: the API key for your default Amplitude project. Use it to initialize any Amplitude SDK.
- `dashboard_url`: an authenticated link to your organization's dashboard (paid plans only).
From here, you have two paths to events flowing:
- **Recommended: run the [Amplitude Wizard CLI](https://amplitude.com/docs/get-started/setup-wizard-cli).** It detects your framework, proposes tracking events tailored to your codebase, and instruments them for you. No manual SDK wiring is required.
```shell
npx @amplitude/wizard
```
- **Initialize the SDK yourself.** Drop the [Amplitude Unified SDK](https://amplitude.com/docs/sdks/analytics/browser/browser-unified-sdk) (analytics, session replay, and experiment in one package) into your app:
```javascript
import { Amplitude } from "@amplitude/unified";
Amplitude.init(process.env.AMPLITUDE_API_KEY);
Amplitude.track("Button Clicked", { button_name: "Sign Up" });
```
For platform-specific SDKs, go to the [Amplitude Quickstart](https://amplitude.com/docs/get-started/amplitude-quickstart).
{% callout type="tip" %}
If you need an API key for a project other than the auto-created default, retrieve it from the Amplitude dashboard at _Settings > Projects_. Open an authenticated session with `stripe projects open amplitude`.
{% /callout %}
## Change plans
Use `stripe projects upgrade` to move between tiers. The command issues a non-destructive update against your `analytics` resource. Your project, API key, and existing event data carry over unchanged.
```shell
stripe projects upgrade amplitude/analytics --config '{"plan_tier":"plus-v3-100k-mtu-monthly"}'
```
| Change | Effective |
| ------------------ | ------------------------------------------------------------------------ |
| Free → Plus | Immediately. Stripe charges a prorated amount for the rest of the cycle. |
| Plus → higher Plus | Immediately. Stripe charges a prorated amount for the rest of the cycle. |
| Plus → lower Plus | Scheduled for end of the current billing cycle. No refund or credit. |
| Plus → cancel | Scheduled for end of the current cycle. Reverts to Free. |
| Free | No cancellation needed. Free plans don't bill and stay active forever. |
Cancel a paid plan with:
```shell
stripe projects remove amplitude/analytics
```
You keep paid features until the billing cycle ends, then your account drops to Free automatically. Your project, events, and dashboards stay intact.
## Open the dashboard
Launch an authenticated dashboard session straight from the CLI:
```shell
stripe projects open amplitude
```
Deep link URLs are short-lived and single-use. Generate a fresh one each time. The link drops you into your organization's main analytics view, already signed in.
## Data residency
Amplitude operates separate US and EU data centers. The `region` you select at provision time pins your organization to one of them for its lifetime. Switching regions requires a manual migration through [Amplitude support](https://help.amplitude.com/).
The EU region routes through `eu.amplitude.com` and `api.eu.amplitude.com`. Make sure your SDK initialization sets the server zone to `EU` when you provisioned with `region: "eu"`:
```javascript
Amplitude.init(process.env.AMPLITUDE_API_KEY, { serverZone: "EU" });
```
## Returning users
If your Stripe profile email already matches an existing Amplitude login, Stripe Projects links the provisioning request to your existing account instead of creating a new one. When your email belongs to a single organization, the CLI receives credentials scoped to that org automatically. When it belongs to multiple, the CLI prompts you to pick one before completing the provision.
You can run `stripe projects add amplitude/analytics` from any Stripe Projects directory. Each provisioning creates a new Amplitude project inside the same organization, which is useful for separating dev, staging, and production environments.
## Troubleshooting
- **`requires_payment_method` error on a paid provision.** Add a billing method first with `stripe projects billing add`, then retry.
- **Wrong region.** Region is immutable. Run `stripe projects remove amplitude/analytics` to drop the resource, then re-provision with the correct region. This creates a new Amplitude organization. Your previous one stays in place but unlinked from Stripe.
- **Lost the API key.** Run `stripe projects env --pull` to refresh the vault, or grab the key from _Settings > Projects_ in the Amplitude dashboard.
================================================================================
# Quickstart for product managers and analysts
URL: https://amplitude.com/docs/get-started/quickstart-for-product-teams
================================================================================
# Quickstart for product managers and analysts
{% quickstart-meta audience="For product managers, analysts, and UX researchers" time="10 min" level="beginner" /%}
This quickstart walks product managers, analysts, and UX researchers through their first three tasks in Amplitude: building an event segmentation chart, saving a user cohort, and sharing a dashboard. Plan for roughly 10 minutes end to end, working in a project that already has events flowing.
Follow this quickstart if you focus on analysis and reporting. If you instrument SDKs and send events into Amplitude, go to [Quickstart for engineers](https://amplitude.com/docs/get-started/quickstart-for-engineers) instead.
{% outcomes %}
{% outcome icon="LineChart" title="Your first chart" href="https://amplitude.com/docs/analytics/charts/event-segmentation/event-segmentation-build" %}
An event segmentation chart showing how users interact with your product.
{% /outcome %}
{% outcome icon="Users" title="A user cohort" href="https://amplitude.com/docs/analytics/create-cohorts" %}
A saved group of users who share a behavior or property.
{% /outcome %}
{% outcome icon="Eye" title="A shared dashboard" href="https://amplitude.com/docs/analytics/dashboard-create" %}
Key metrics in one view that your whole team can follow.
{% /outcome %}
{% /outcomes %}
{% prerequisites %}
{% prerequisite %}
An Amplitude account — go to [Create a new account](https://amplitude.com/docs/get-started/create-a-new-account) if you don't have one.
{% /prerequisite %}
{% prerequisite %}
A project with data flowing in — go to [Create a project](https://amplitude.com/docs/get-started/create-project) to set one up.
{% /prerequisite %}
{% prerequisite %}
A Member or Admin role in your organization.
{% /prerequisite %}
{% /prerequisites %}
{% callout type="note" %}
No events yet? Ask your engineering team to instrument your product first, or go to [Quickstart for engineers](https://amplitude.com/docs/get-started/quickstart-for-engineers) to learn how that process works.
{% /callout %}
{% steps %}
{% step eyebrow="Analyze" title="Build your first chart" %}
[Event Segmentation](https://amplitude.com/docs/analytics/charts/event-segmentation/event-segmentation-build) shows how often users trigger specific events over time. It's the fastest way to answer "how many users did X?"
From the Amplitude home page, open a new chart and select **Event Segmentation**. Pick an event to analyze, such as a sign-up or a key feature interaction. Set a date range, then select **Run**. Your chart appears immediately.
Save the chart to a space so your team can find it later.
{% /step %}
{% step eyebrow="Segment" title="Create a cohort" %}
A [cohort](https://amplitude.com/docs/analytics/create-cohorts) is a saved group of users who share a behavior or property. Cohorts let you track how a specific segment performs over time and compare it against your full user base.
From any chart, select the user count to open the user list, then select **Save as cohort**. Give the cohort a name that describes who's in it, for example, "Users who completed onboarding in the last 30 days."
Use that cohort in future charts to compare this segment against the rest of your users.
{% /step %}
{% step eyebrow="Share" title="Set up a dashboard" %}
A [dashboard](https://amplitude.com/docs/analytics/dashboard-create) brings multiple charts together in one view. Add the event segmentation chart from the first step, then add one or two charts covering other key metrics like retention or conversion.
Select **Share** and enter your teammates' email addresses or Amplitude usernames to give them access.
{% /step %}
{% /steps %}
## Next steps
{% card-grid %}
{% card title="Query your data in plain language" description="AI Assistant lets you ask questions without building a chart manually." href="https://amplitude.com/docs/assistant/use-assistant" icon="💬" /%}
{% card title="Surface insights automatically" description="Amplitude AI detects anomalies and surfaces patterns across your event stream." href="https://amplitude.com/docs/amplitude-ai/global-agent-overview" icon="✨" /%}
{% /card-grid %}
================================================================================
# Quickstart for engineers
URL: https://amplitude.com/docs/get-started/quickstart-for-engineers
================================================================================
# Quickstart for engineers
{% quickstart-meta audience="For engineers implementing Amplitude" time="15 min" level="intermediate" /%}
This quickstart is for engineers implementing Amplitude for the first time. Follow these steps to install the Browser SDK, verify that events flow into your project, and ship your first feature flag.
{% callout type="tip" %}
Want automated setup? Run `npx @amplitude/wizard` in your project directory. The [Amplitude Wizard CLI](https://amplitude.com/docs/get-started/setup-wizard-cli) detects your framework, proposes custom events, and instruments the SDK automatically.
{% /callout %}
{% outcomes %}
{% outcome icon="Code" title="Browser SDK 2" href="https://amplitude.com/docs/sdks/analytics/browser/browser-unified-sdk" %}
Installed and sending events to your Amplitude project.
{% /outcome %}
{% outcome icon="Zap" title="Autocapture enabled" href="https://amplitude.com/docs/data/autocapture" %}
Clicks, page views, and sessions tracked without manual event calls.
{% /outcome %}
{% outcome icon="FlaskConical" title="A feature flag" href="https://amplitude.com/docs/feature-experiment/workflow/feature-flag-rollouts" %}
A live flag you can roll out to a subset of users.
{% /outcome %}
{% /outcomes %}
{% prerequisites %}
{% prerequisite %}
An Amplitude account and a project API key — go to [Create a project](https://amplitude.com/docs/get-started/create-project) if you don't have one.
{% /prerequisite %}
{% prerequisite %}
Access to your product's codebase (front-end or back-end, depending on your stack).
{% /prerequisite %}
{% prerequisite %}
A Member, Developer, or Admin role in your Amplitude organization.
{% /prerequisite %}
{% /prerequisites %}
{% callout type="note" %}
If your team is still deciding what to track, go to [Instrumentation prework](https://amplitude.com/docs/get-started/instrumentation-prework) first to align on a tracking plan before you write any code.
{% /callout %}
{% steps %}
{% step eyebrow="Install" title="Add the Browser SDK" %}
The [Browser SDK](https://amplitude.com/docs/sdks/analytics/browser/browser-unified-sdk) is the fastest path to getting data into Amplitude. Add it to your site with a script tag or an npm package, then initialize it with your project API key.
```html
```
Amplitude provides a pre-configured snippet and an AI prompt in your project settings when you first create an account. Go to your project settings to copy the snippet for your region.
After initialization, call `amplitude.track('Event Name', { property: 'value' })` to send your first custom event.
{% /step %}
{% step eyebrow="Capture" title="Enable Autocapture" %}
[Autocapture](https://amplitude.com/docs/data/autocapture) tracks clicks, page views, sessions, form interactions, file downloads, and marketing attribution without any manual event calls. Enable Autocapture by passing `autocapture: true` during initialization:
```js
amplitude.init("YOUR_API_KEY", { autocapture: true });
```
Check your Amplitude project's _Live Events_ view to confirm that events are arriving. You don't need to add additional tracking code for the behaviors Autocapture handles.
{% callout type="note" %}
Autocapture is best for capturing broad behavioral data. For business-critical actions, such as purchases, upgrades, and key feature usage, add explicit `amplitude.track()` calls so those events carry the right properties.
{% /callout %}
{% /step %}
{% step eyebrow="Experiment" title="Launch a feature flag" %}
[Feature Experiment](https://amplitude.com/docs/feature-experiment/experiment-quick-start) lets you roll out changes to a subset of users without a code deployment. Create a flag in the Amplitude UI, add the SDK to your codebase, and check the flag value at runtime.
```js
const variant = experiment.variant("my-flag");
if (variant.value === "treatment") {
// show new feature
}
```
Go to [Feature flag rollouts](https://amplitude.com/docs/feature-experiment/workflow/feature-flag-rollouts) for a full walkthrough of targeting rules, gradual rollouts, and flag cleanup.
{% /step %}
{% /steps %}
## Next steps
{% card-grid %}
{% card title="Get answers about your implementation" description="Common questions about identity, event batching, and data validation." href="https://amplitude.com/docs/get-started/engineer-questions" icon="❓" /%}
{% card title="Run an A/B test" description="Extend your feature flag into a full experiment with statistical analysis." href="https://amplitude.com/docs/feature-experiment/experiment-quick-start" icon="🧪" /%}
{% /card-grid %}
================================================================================
# Quickstart for growth and marketing teams
URL: https://amplitude.com/docs/get-started/quickstart-for-growth-teams
================================================================================
# Quickstart for growth and marketing teams
{% quickstart-meta audience="For growth marketers, lifecycle managers, and CRO practitioners" time="15 min" level="beginner" /%}
This quickstart is for growth marketers, lifecycle managers, and CRO practitioners. Follow these steps to run your first A/B test, launch an in-product guide or survey, and use Session Replay to find where users drop off.
{% outcomes %}
{% outcome icon="FlaskConical" title="Web Experiment" href="https://amplitude.com/docs/web-experiment/set-up-a-web-experiment" %}
Test a change on your site without writing code.
{% /outcome %}
{% outcome icon="MessageSquare" title="Guides and Surveys" href="https://amplitude.com/docs/guides-and-surveys/get-started" %}
An in-product message that appears at a key moment in the journey.
{% /outcome %}
{% outcome icon="Eye" title="Session Replay" href="https://amplitude.com/docs/session-replay" %}
Identify users who abandoned a funnel step and watch what happened.
{% /outcome %}
{% /outcomes %}
{% prerequisites %}
{% prerequisite %}
An Amplitude account — go to [Create a new account](https://amplitude.com/docs/get-started/create-a-new-account) if you don't have one.
{% /prerequisite %}
{% prerequisite %}
The Unified Browser SDK installed on your site. If it isn't installed yet, share [Quickstart for engineers](https://amplitude.com/docs/get-started/quickstart-for-engineers) with your engineering team.
{% /prerequisite %}
{% prerequisite %}
A Member or Admin role in your organization.
{% /prerequisite %}
{% /prerequisites %}
{% steps %}
{% step eyebrow="Test" title="Run a web experiment" %}
[Web Experiment](https://amplitude.com/docs/web-experiment/set-up-a-web-experiment) lets you test changes to your site using a visual editor, with no code required for most changes. Create an experiment, define a control and a treatment variant, and set a targeting rule (for example, users who reach a specific page or match a user property).
Amplitude assigns users to variants, tracks exposure automatically, and computes statistical results against the metrics you choose. You don't need to build any assignment or analysis logic yourself.
For a faster start, go to [out-of-the-box widgets](https://amplitude.com/docs/web-experiment/out-of-the-box-widgets) to launch pre-built banners, modals, and CTAs with one click.
{% /step %}
{% step eyebrow="Engage" title="Launch a guide or survey" %}
[Guides & Surveys](https://amplitude.com/docs/guides-and-surveys/get-started) delivers in-product messages and collects feedback using the same SDK your site already has installed. Target users based on behavior or properties, show onboarding walkthroughs, and trigger satisfaction surveys at key moments.
Go to [Build a survey](https://amplitude.com/docs/guides-and-surveys/build-a-survey) to create your first survey. Choose a template, set display conditions (such as after a user completes a key action), and publish. Amplitude captures all responses and ties them to user behavior data, so you can correlate NPS scores or survey answers with retention and conversion metrics.
{% /step %}
{% step eyebrow="Diagnose" title="Watch where users drop off" %}
[Session Replay](https://amplitude.com/docs/session-replay) lets you watch real user sessions and see exactly where users get stuck or abandon a flow. Filter replays by funnel step, rage clicks, or error events to zero in on the sessions most likely to reveal friction.
Start by filtering for sessions where users reached a key step but didn't convert — for example, users who viewed a pricing page but didn't start a trial. Watch a handful of those sessions to identify common patterns.
{% callout type="note" %}
Session Replay captures sessions at the sample rate you set during SDK initialization. Lower the rate in high-traffic production environments to manage volume and cost.
{% /callout %}
{% /step %}
{% /steps %}
## Next steps
{% card-grid %}
{% card title="Segment your experiment results" description="Create a cohort of users who saw a specific variant and compare their downstream behavior in Amplitude Analytics." href="https://amplitude.com/docs/analytics/create-cohorts" icon="📊" /%}
{% card title="Add personalization" description="Use targeting rules to show different experiences to different user segments based on properties or past behavior." href="https://amplitude.com/docs/web-experiment/set-up-a-web-experiment" icon="🎯" /%}
{% /card-grid %}
================================================================================
# Quickstart for data teams
URL: https://amplitude.com/docs/get-started/quickstart-for-data-teams
================================================================================
# Quickstart for data teams
{% quickstart-meta audience="For data engineers, implementation leads, and governance owners" time="15 min" level="intermediate" /%}
This quickstart walks data governance owners, data engineers, and implementation leads through creating a tracking plan, validating incoming event data, and setting up your team's instrumentation workflow in Amplitude. Plan for roughly 15 minutes end to end.
Follow this quickstart if you own data governance, taxonomy, and event quality. If you write the SDK code that sends events into Amplitude, go to [Quickstart for engineers](https://amplitude.com/docs/get-started/quickstart-for-engineers) instead.
{% outcomes %}
{% outcome icon="ClipboardList" title="A tracking plan" href="https://amplitude.com/docs/data/create-tracking-plan" %}
Defines every event and property your product sends to Amplitude.
{% /outcome %}
{% outcome icon="ShieldCheck" title="Validation rules" href="https://amplitude.com/docs/data/validate-events" %}
Flag unexpected or malformed events before they reach your charts.
{% /outcome %}
{% outcome icon="Database" title="A data catalog" href="https://amplitude.com/docs/data/amplitude-data-get-started" %}
Browse and document every event and property flowing into your Amplitude project.
{% /outcome %}
{% /outcomes %}
{% prerequisites %}
{% prerequisite %}
An Amplitude account with access to Amplitude Data. Go to [Create a new account](https://amplitude.com/docs/get-started/create-a-new-account) if you don't have one.
{% /prerequisite %}
{% prerequisite %}
An Admin or Manager role in your organization (required to create and publish tracking plans).
{% /prerequisite %}
{% prerequisite %}
Alignment with your product and engineering teams on what to track. Go to [Plan your implementation](https://amplitude.com/docs/get-started/plan-your-implementation) to work through those decisions first.
{% /prerequisite %}
{% /prerequisites %}
{% callout type="note" %}
Starting from scratch? Go to [Instrumentation prework](https://amplitude.com/docs/get-started/instrumentation-prework) to build alignment on taxonomy, user identity, and naming conventions before you create your tracking plan.
{% /callout %}
{% steps %}
{% step eyebrow="Create" title="Build a tracking plan" %}
A tracking plan is a single source of truth that defines every event and property your product sends to Amplitude. It gives engineers a spec to implement against, and gives analysts confidence in the data they query.
Go to [Amplitude Data](https://amplitude.com/docs/data/amplitude-data-get-started) and open the _Tracking Plan_ tab. Create a new plan and [add your events](https://amplitude.com/docs/data/create-tracking-plan). Start with the five to ten actions most critical to your product's success, such as sign-up, activation, and conversion events. For each event, define its required properties and their expected types.
Publish the plan so it's visible to your engineering and product teams.
{% /step %}
{% step eyebrow="Validate" title="Check incoming events" %}
After engineering instruments against your plan, use [event validation](https://amplitude.com/docs/data/validate-events) to check that real events match your spec. Amplitude Data flags events with missing required properties, unexpected property types, or names that don't match your plan.
Open the _Observe_ tab in Amplitude Data to see a live stream of incoming events alongside any validation warnings. Resolve issues by updating the tracking plan, fixing the instrumentation, or both. The resolution workflow keeps a record of what changed and why.
{% /step %}
{% step eyebrow="Organize" title="Set your team's workflow" %}
A clean tracking plan only stays clean if everyone follows the same process. Go to [Implementation team organization](https://amplitude.com/docs/get-started/implementation-team-organization) for a recommended workflow that covers who owns the tracking plan, how engineers request changes, and how to handle schema evolution over time.
Define your team's review process before implementation starts, so that new events go through the tracking plan before they reach production.
{% /step %}
{% /steps %}
## Next steps
{% card-grid %}
{% card title="Enforce naming conventions" description="Use Amplitude Data's linting rules to block events that don't follow your taxonomy before they reach production." href="https://amplitude.com/docs/data/amplitude-data-get-started" icon="🛡️" /%}
{% card title="Connect your data sources" description="Connect third-party sources, CDPs, and warehouses to your Amplitude project." href="https://amplitude.com/docs/data/amplitude-data-get-started" icon="🔌" /%}
{% /card-grid %}
================================================================================
# What is Amplitude?
URL: https://amplitude.com/docs/get-started/what-is-amplitude
================================================================================
# What is Amplitude?
Amplitude is an AI analytics platform that helps you build better products by tracking and understanding user behavior.
Use Amplitude to track user data and gain insights into user engagement, retention, and revenue. Amplitude keeps your data trustworthy and secure, so you have access to accurate and reliable information. Amplitude's analytics tools help answer questions about what happened, why it happened, and which actions to take next. With Amplitude, you can share your work across teams to support collaboration and drive growth.
{% callout type="note" heading="Availability by Pricing Plan" %}
Not all Amplitude products are available for every plan. Your experience with Amplitude may vary from the documentation depending on the plan you're using. For details on which functionality is available to each plan, go to the [Pricing](https://amplitude.com/pricing) page.
{% /callout %}
## Key concepts
Amplitude is an event-based analytics tool. It tracks user behaviors based on in-product interactions and analyzes user behavior in real time. Event-based analytics is the method of tracking and analyzing interactions between users and your product, also known as events. Before you get started with Amplitude, understand some key concepts.
| Name | Description | A music player app example |
| ---------------- | ------------------------------------------------------------------ | ---------------------------------------- |
| Events | An event is an action a user has taken | A user presses the "Play Song" button |
| Event Properties | Event properties are details about an event. | The genre of the music |
| Users | A user is the specific individual that interacts with your product | A user uses the app to play music |
| User Properties | User properties are details about a user | Whether a user is on a paid or free plan |
| Sessions | A session is the period of time a user has your app | A user uses the app to play music |
If you aren't interested in the details of these concepts, you can stop reading now.
### Events
Events are actions that users take in your product, such as clicking a button, making a purchase, or creating an account. You define the events you want to track in Amplitude and the data you want to capture for each event. For example, you can send a "Play Song" event every time a user presses the Play button in a music player application.
To learn more about how to decide which events to track, refer to [Select events to track](https://amplitude.com/docs/get-started/select-events).
#### Event properties
Event properties are details about events. For example, when someone presses the "Play Song" event in a music player application, event properties can track the genre. Any detail related to the event can be an event property.
### Users
A user is the specific individual who completed an interaction with your product. Amplitude analyses depend on accurately tracking unique users. This is often trickier than it sounds, because your users can log in and out at will, browse anonymously, or use multiple devices.
To learn more, refer to [Identify your users](https://amplitude.com/docs/get-started/understand-user-activity) and [How Amplitude tracks unique users](https://amplitude.com/docs/data/sources/instrument-track-unique-users) by using a combination of device IDs, user IDs, and Amplitude IDs.
#### User properties
User properties are details about users. For example, use them to track whether a user is on a paid or free plan in a music player application.
### Sessions
A session is the duration a user has your app in the foreground or has your website open. Sessions are useful for understanding the frequency and duration of your users' engagement with your product. Amplitude assigns a session ID to each session, and all events within the same session share the same session ID. To send data, Amplitude SDKs automatically generate and manage session IDs. However, you have to manage session IDs yourself when using HTTP APIs.
To learn more, refer to [How Amplitude tracks sessions](https://amplitude.com/docs/data/sources/instrument-track-sessions).
If you're new to Amplitude, complete [this course](https://academy.amplitude.com/path/getting-started-with-amplitude-analytics-learning-path) to get started and learn more [helpful definitions](https://amplitude.com/docs/get-started/helpful-definitions).
================================================================================
# Create a new account
URL: https://amplitude.com/docs/get-started/create-a-new-account
================================================================================
# Create a new account
Amplitude's onboarding helps you get data into your new organization as quickly as possible.
## Create your org
Get started with Amplitude for free. To create a new account:
1. Go to [amplitude.com/get-started](https://amplitude.com/get-started).
2. Sign in with Google or enter your work email address.
3. Verify your email address. You receive an email from Amplitude asking you to verify your email. Click the link in the email to set a password and finish creating your account.
4. Choose your data storage location (refer to the section below).
### Data storage location
When you sign up, you can choose the region that hosts your data, either United States or European Union. Amplitude complies with the [EU-US Data Privacy Framework](https://ec.europa.eu/commission/presscorner/detail/en/qanda_23_3752).
{% callout type="note" heading="" %}
This setting affects how your organization sends data to Amplitude, and where Amplitude stores that data. You can't change this setting after you create your org.
{% /callout %}
## The Amplitude snippet
After you sign up and activate your account, Amplitude prompts you to connect your first application with a single snippet. Enable [Session Replay](https://amplitude.com/docs/session-replay) and [Autocapture](https://amplitude.com/docs/data/autocapture) to turn those features on automatically.
{% get-data-flowing-snippet /%}
{% callout type="note" heading="Session Replay sample rate" %}
When you add Session Replay to the snippet, Amplitude sets the Sample Rate to `1`. This ensures you can verify the implementation during testing. In production, Amplitude recommends you set this value lower to account for your monthly quota. For more information, review [Session Replay Plugin | Sampling rate](https://amplitude.com/docs/sdks/session-replay/session-replay-plugin#sampling-rate).
{% /callout %}
Amplitude inserts your API key in the snippet as necessary. Paste the snippet in the `head` tag of each page where you want to track user behavior, create a feature flag, or build a cohort.
This snippet installs and initializes the [Browser SDK](https://amplitude.com/docs/sdks/analytics/browser/browser-sdk-2) and any extra features you enable.
After you install the snippet, browse your site so Amplitude can verify that data flows to your project.
After Amplitude verifies it can receive events, click **Next** to create your first chart and optionally save it as a dashboard.
## Other ways to install
Amplitude supports other [integrations](https://amplitude.com/docs/data/source-catalog), [SDKs](https://amplitude.com/docs/sdks/analytics), and the [API](https://amplitude.com/docs/apis/analytics/http-v2) to help you start sending data.
For these methods, refer to the associated documentation for help getting started.
## Send sample data
Amplitude supports sending test data to get you started. Use any of the following methods:
- CSV Upload.
- Chrome extension.
- Web bookmarklet.
================================================================================
# Create a project in Amplitude
URL: https://amplitude.com/docs/get-started/create-project
================================================================================
# Create a project in Amplitude
After you set up your organization and users have joined it, you can start adding **projects**. Each analysis you create belongs to a specific project. In Amplitude, a project is a way to subdivide your Amplitude organization into distinct territories. For example, you might want to create individual projects for different products, or for different areas or sections of your app. Projects are a useful way to keep related analyses grouped together.
Each project in Amplitude has its own separate API key for sending data. For example, if you have one iOS project and one Android project within your organization, each app sends data to its respective API key.
## Create a new project
To create a new project, follow these steps:
1. Navigate to _Settings > Organization settings > Projects_.
2. Click **Create Project**.
3. In the _Create New Project_ modal, type the project's name and a description. Then click **Next**.
4. Select the users you want to have access to the project, and specify their roles from the drop-down menus next to their names. Users must belong to the organization before you can add them to a project.
5. Click **Submit**.
{% callout type="note" %}
Always create a test project or a dev environment for each production project to test your instrumentation. After Amplitude records data to a project, you can't modify or delete it.
{% /callout %}
Now that you have a project to work with, learn about [data in Amplitude](https://amplitude.com/docs/get-started/select-events).
================================================================================
# Plan your implementation
URL: https://amplitude.com/docs/get-started/plan-your-implementation
================================================================================
# Plan your implementation
A successful Amplitude implementation starts with picking one data source, instrumenting two or three high-value events, and writing a tracking plan before you scale up. This page walks through those three decisions in order so your first dashboards measure something meaningful instead of noise.
Follow this guide when you're planning a fresh Amplitude rollout end-to-end and want to think through sources, events, and a tracking plan before you write code. If you'd rather skip planning and let Amplitude propose events from your existing codebase, use the [Setup Wizard CLI](https://amplitude.com/docs/get-started/setup-wizard-cli) instead.
## Send data
Without a data source, Amplitude can't show you who your customers are or how they behave in your product. Pick one source to start with and add more later if you need to. Send data to Amplitude client-side, server-side, or through a third party.
Amplitude supports two main ways to send data:
1. [Import existing data](#import-existing-data) if you have data stored elsewhere.
2. [Track data](#track-product-data) using Amplitude SDKs and APIs if you're starting from scratch.
After you set up your source, use the [debugging guide](https://amplitude.com/docs/analytics/debug-analytics) to check your initial setup.
### Import existing data
If you already collect data outside Amplitude, you can stream events directly from your chosen source by adding a [source](https://amplitude.com/docs/data/source-catalog) or [SDK](https://amplitude.com/docs/sdks/analytics).
### Track product data
{% callout type="tip" heading="Automate setup with the CLI" %}
Use the [Amplitude setup wizard CLI](https://amplitude.com/docs/get-started/setup-wizard-cli) to configure your SDK, generate tracking code, and start sending events in minutes.
{% /callout %}
You can track your product data using Amplitude SDKs or APIs:
1. Determine which data source works best for your product. Refer to [client-side vs server-side sources](https://amplitude.com/docs/sdks/client-side-vs-server-side).
2. Install a data source with an [SDK](https://amplitude.com/docs/sdks/analytics) or [API](https://amplitude.com/docs/apis/analytics/http-v2).
3. Tag a few [important events](#what-events-to-track) upfront.
## What events to track
{% callout type="note" heading="Know key concepts before you get started" %}
Go to [What is Amplitude?](https://amplitude.com/docs/get-started/what-is-amplitude/) for definitions of users, events, and properties.
{% /callout %}
If you're just starting out, resist the urge to track everything upfront. The number of events you should track depends on the complexity of your product.
Consider starting with two important events in your product to give you initial insights.
Use these sample questions to get you thinking:
| Questions | Events |
| ---------------------------------------------------------------------------------------------- | --------------------------------------------- |
| How many daily active users or how many logins per week do I get? | **Login** event |
| What percentage of users who add an item to their cart successfully check out? | **Add to Cart** event and **Checkout** event |
| What percentage of sign-ups request a demo? | **Sign Up** event and **Request Demo** event |
| What's the retention rate? How many users come back to the product two weeks after signing up? | **Sign Up** event and **Session Start** event |
After you successfully track these events, you can [track more](https://amplitude.com/docs/data/data-planning-playbook).
## Create a tracking plan
As you advance, it's critical to [create a tracking plan](https://amplitude.com/docs/data/create-tracking-plan) document that outlines what events and properties to track, why you're tracking them, and where they're tracked. A tracking plan should derive from the business outcomes you're trying to measure or improve.
If you're using Amplitude SDKs, Ampli Wrapper is a lightweight wrapper over the Amplitude SDK that provides type safety, supports linting, and enables features such as input validation. Ampli CLI works together with the Ampli wrapper to bring a tracking library into your project. Learn more about [Ampli](https://amplitude.com/docs/sdks/ampli).
================================================================================
# Instrumentation pre-work
URL: https://amplitude.com/docs/get-started/instrumentation-prework
================================================================================
# Instrumentation pre-work
Instrumentation pre-work is the planning you do before you write any tracking code: defining the business questions you need answered, deciding how to identify users, and listing the events and properties that map to those questions. Do this work first because event names, user identity, and project structure are expensive to change once data starts flowing. Each step below covers one of those decisions.
Work through this checklist when you're setting up a new Amplitude project or replanning an existing taxonomy. If you want to skip manual planning, the [Amplitude Wizard CLI](https://amplitude.com/docs/get-started/setup-wizard-cli) inspects your codebase and proposes an event taxonomy automatically.
## Define your business goals
Defining your business goals is critical to getting the most out of Amplitude. The more you know about your business goals, and the better you can articulate them, the more Amplitude can help you achieve them.
Start by identifying your business goals as specifically as possible. Which aspects of your product do you want to better understand or improve? For example, your goals for this quarter might include improving user acquisition, user retention, and paying user conversion. After you identify your goals, think about the data or events you need to reach them.
## Understand how Amplitude identifies and tracks users
If you don't track your users correctly, you can't get what you need from Amplitude. Read and understand the article on [how Amplitude identifies and tracks unique users](https://amplitude.com/docs/data/sources/instrument-track-unique-users) before you start instrumentation.
## Organize events and related properties
Consider making a spreadsheet that lists each event and its associated properties. It might look something like this:
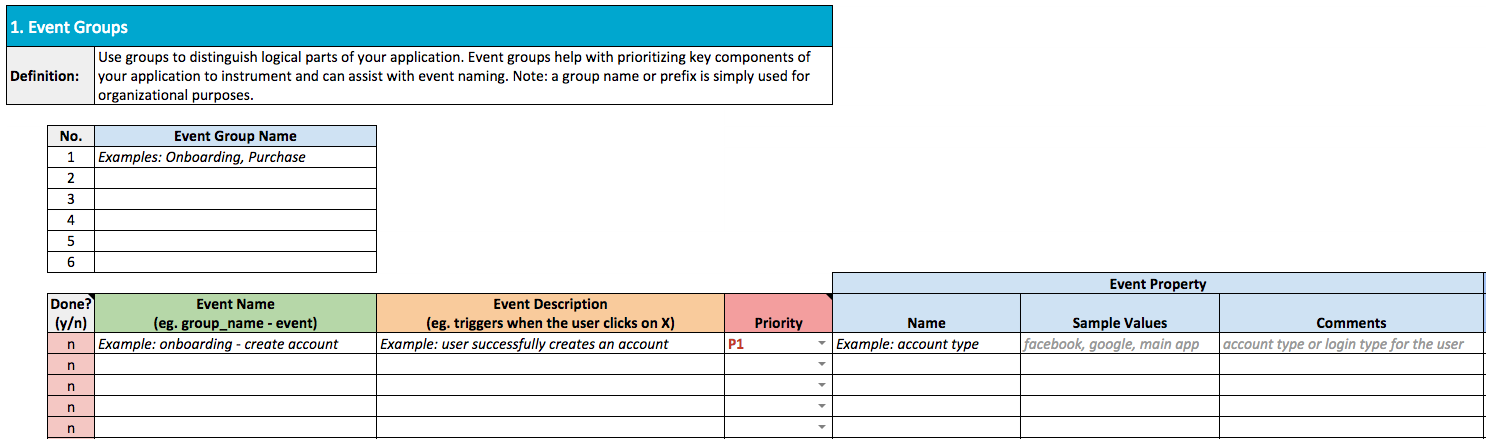
Make event names clear and intuitive. If your organization doesn't have a standard naming scheme, consider naming your events using the following syntax:
verb + noun (`clicked signup`) or noun + verb (`signup clicked`).
Go to the [Data Taxonomy Playbook](https://amplitude.com/docs/data/data-planning-playbook) for best practices around your event taxonomy. Download the template above as an [Excel](https://drive.google.com/file/d/1dIiJrLJXdVNBh6VQ4bcII0THNyEkaooO/view) or [Google Sheets](https://docs.google.com/spreadsheets/d/1-6rXRomzq05YDQ9A6QG9A2i-jez72amPw-Johhd-heQ/view) spreadsheet.
### Resist the urge to track everything immediately
New Amplitude users often assume that tracking as much data as possible generates more insights more quickly. The opposite is often true: too much data can obscure the answers you're looking for just as easily as too little data.
Instead, track only the events that answer the business goals you defined in the previous section. Your team has an easier time understanding and using the data Amplitude sends. Customers often mention that the most difficult thing to teach new hires isn't the Amplitude platform itself, but what the event data means and how to generate it.
Each event you track should have no more than 20 properties. This limit also applies to user properties. If you find it necessary later, you can always add more events and properties.
## Consider instrumenting a cross-platform project
If your product is similar across all platforms and the taxonomy is consistent, combine web and mobile data into the same project. Combining data lets you analyze how users move between different platforms. Instrument products with distinct taxonomies in separate projects. Refer to [the pros and cons of combining Android and iOS data or multiple apps in the same Amplitude project](https://amplitude.com/docs/get-started/cross-platform-vs-separate-platform).
## Next steps
If you still have questions, read the [article on instrumentation FAQs](https://amplitude.com/docs/get-started/create-project) and [get data into Amplitude](https://amplitude.com/docs/get-started/get-data-in).
{% callout type="tip" %}
Want to skip manual setup? The [Amplitude Wizard CLI](https://amplitude.com/docs/get-started/setup-wizard-cli) detects your framework, proposes events tailored to your codebase, and instruments the SDK automatically with your approval.
{% /callout %}
================================================================================
# Use Autocapture to get fast insights
URL: https://amplitude.com/docs/get-started/autocapture
================================================================================
# Use Autocapture to get fast insights
Autocapture automatically collects common interactions such as page views, sessions, clicks, and form interactions from the Amplitude Browser, iOS, and Android SDKs with minimal setup. This page shows how to enable Autocapture on each platform. For the full list of events and properties that Autocapture collects, refer to the [Autocapture reference](https://amplitude.com/docs/data/autocapture).
## Autocapture for the web
Starting with version 2.10.0, the Amplitude Browser SDK includes Autocapture to help you capture events, interactions, and attribution on your site.
### Install the Browser SDK
{% tabs tabs="Script Loader, npm, yarn" %}
{% tab name="Script Loader" %}
{% get-data-flowing-snippet /%}
{% /tab %}
{% tab name="npm" %}
```bash
npm install @amplitude/analytics-browser
```
{% /tab %}
{% tab name="yarn" %}
```bash
yarn add @amplitude/analytics-browser
```
{% /tab %}
{% /tabs %}
### Initialize the SDK
Browser SDK 2.10.0 and above includes element click and change tracking, which enables [visual labeling](https://amplitude.com/docs/data/visual-labeling) within Amplitude. To enable it, set `config.autocapture.elementInteractions` to `true` when you initialize the SDK.
{% tabs tabs="Script loader, npm / yarn" %}
{% tab name="Script loader" %}
No extra initialization required.
{% /tab %}
{% tab name="npm / yarn" %}
```js
import * as amplitude from "@amplitude/analytics-browser";
import { autocapturePlugin } from "@amplitude/plugin-autocapture-browser";
amplitude.init("AMPLITUDE_API_KEY", {
autocapture: {
elementInteractions: true,
webVitals: true, // Enable Core Web Vitals tracking
},
});
```
{% /tab %}
{% /tabs %}
### Content security policy (CSP)
If your web app configures a strict Content Security Policy (CSP), adjust the policy to allowlist Amplitude domains:
- Add `https://*.amplitude.com` to `script-src`.
- Add `https://*.amplitude.com` to `connect-src`.
### Events
| Event | Description | Properties |
| --------------- | ---------------------------------------------------------------------------------------------- | ------------------------------------------------------------------------------------------------------------------------------------------------------------------------------------------------------------------------------------------------------------------------- |
| Page viewed | Captures when a user loads a page on your site. | Page counter, Page domain, Page location, Page path, Page title, Page URL, Session Replay ID (if enabled), Referrer, [Attribution](#marketing-attribution), [User properties](#user-properties). |
| Start session | Captures when a user starts a session on your site. | Session Replay ID (if enabled), [User properties](#user-properties). |
| End session | Captures when a user ends a session on your site. | [User properties](#user-properties). |
| Form started | Captures when a user interacts with a form on your site. | Form destination, Session Replay ID (if enabled), [User properties](#user-properties). |
| Form submitted | Captures when a user submits a form on your site. | Form destination, Session Replay ID (if enabled), [User properties](#user-properties). |
| File downloaded | Captures when a user downloads a file from your site. | File extension, File name, Link text, Link URL, Session Replay ID (if enabled), |
| Element clicked | Captures when a user clicks an element on the page. | Element Aria Label, Element Class, Element Hierarchy, Element Href, Element ID, Element Parent Label, Element Position Left, Element Position Top, Element Selector, Element Tag, Element Text, Page Title, Page URL, Session Replay ID, Viewport Height, Viewport Width. |
| Element changed | Captures form element interactions, such as changes a dropdown or inputs text into a text box. | Element Class, Element Hierarchy, Element ID, Element Parent Label, Element Position Left, Element Position Top, Element Tag, Page Title, Page URL, Session Replay ID, Viewport Height, Viewport Width. |
| Network request | Captures when the application makes a network request. | URL, Request method, Status code, Duration, Request body size, Response body size, Session Replay ID (if enabled). |
| Web vitals | Captures Core Web Vitals performance metrics when the browser tab becomes hidden. | Page domain, Page location, Page path, Page title, Page URL, LCP, FCP, INP, CLS, TTFB metrics with performance ratings and timing data. |
For more information, refer to Autocapture in the [Browser SDK 2](https://amplitude.com/docs/sdks/analytics/browser/browser-sdk-2#autocapture) documentation.
{% callout type="tip" heading="Default event prefix" %}
Amplitude prefixes Autocapture events with the Amplitude logo.
{% /callout %}
### Marketing attribution
Captures the following properties:
- UTM parameters (`utm_source`, `utm_medium`, `utm_campaign`, `utm_term`, `utm_content`).
- Referrer parameters (`referrer`, `referring_domain`).
- Click identifiers for Google, Facebook, Kochava, Microsoft, TikTok, X (Twitter), LinkedIn, and Reddit.
- [First-touch](https://amplitude.com/docs/sdks/analytics/browser/browser-sdk-2#first-touch-attribution) and [multi-touch](https://amplitude.com/docs/sdks/analytics/browser/browser-sdk-2#multi-touch-attribution) attribution. For more information about attribution, refer to [Use sessions, channels, and attribution to drive marketing analytics](https://amplitude.com/docs/analytics/marketing-analytics).
### User properties
Amplitude attaches [User Properties](https://amplitude.com/docs/get-started/user-property-definitions) to all Autocapture events, unless disabled.
### Visual labeling for web
Amplitude's visual labeling tool lets you identify and select individual elements on a page to track. For example, to track the number of users who click a **Sign up** button, select the button with visual labeling. Amplitude then creates an event that targets that specific element.
Events you add with visual labeling work retroactively, because Amplitude captures all form-related events starting when your instrumentation goes live.
For more information, refer to [Visual labeling](https://amplitude.com/docs/data/visual-labeling).
## Autocapture for iOS
The latest version of Amplitude's [iOS SDK](https://amplitude.com/docs/sdks/analytics/ios/ios-swift-sdk) includes Autocapture capabilities.
### Install the SDK
Install the SDK as instructed in the [iOS-Swift SDK](https://amplitude.com/docs/sdks/analytics/ios/ios-swift-sdk#install-the-sdk) documentation.
### Initialize the SDK with Autocapture enabled
By default, the iOS SDK enables session tracking and disables application lifecycle, screen view, and element interaction tracking. To enable all Autocapture capabilities, initialize the SDK with the following snippet:
{% code-group %}
```swift Swift
let amplitude = Amplitude(configuration: Configuration(
apiKey: "API_KEY",
autocapture: [.sessions, .appLifecycles, .screenViews, .networkTracking]
))
```
```objc Obj-C
AMPConfiguration* configuration = [AMPConfiguration initWithApiKey:@"API_KEY"];
configuration.autocapture = [[AMPAutocaptureOptions alloc] initWithOptionsToUnion:@[
AMPAutocaptureOptions.sessions,
AMPAutocaptureOptions.appLifecycles,
AMPAutocaptureOptions.screenViews,
AMPAutocaptureOptions.networkTracking
]];
Amplitude* amplitude = [Amplitude initWithConfiguration:configuration];
```
{% /code-group %}
### Autocapture events
| Event | Description | Properties |
| ------------------------ | ---------------------------------------------------------------------------- | ---------------------------------------------- |
| Start session | Captures when a user starts a session in your app. | [User properties](#user-properties). |
| End session | Captures when a user ends a session in your app. | [User properties](#user-properties). |
| Application installed | Captures when a user opens the app for the first time after they install it. | |
| Application updated | Captures when a user opens the app for the first time after they update it. | |
| Application opened | Captures when a user launches or foregrounds the app after the first open. | |
| Application backgrounded | Captures when a user backgrounds the application. | |
| Screen viewed | Captures when a user views a screen in your app. | Screen name |
| Element Interacted | Captures when a user interacts with the UI elements in your app. | Element properties |
| Network request | Captures when a the app makes a network request. | URL, request method, status code, and so forth |
### User properties
Amplitude attaches [User Properties](https://amplitude.com/docs/get-started/user-property-definitions) to all Autocapture events, unless disabled.
## Autocapture for Android
The latest version of Amplitude's [Android SDK](https://amplitude.com/docs/sdks/analytics/android/android-kotlin-sdk) includes Autocapture capabilities.
### Install the SDK
Install the SDK as instructed in the [Android-Kotlin SDK](https://amplitude.com/docs/sdks/analytics/android/android-kotlin-sdk#install-the-sdk) documentation.
### Initialize the SDK with Autocapture enabled
By default, the Android-Kotlin SDK enables session tracking and disables application lifecycle, screen view, deep link, and element interaction tracking. To enable all Autocapture capabilities, initialize the SDK with the following snippet:
{% code-group %}
```kotlin Kotlin
Amplitude(
Configuration(
apiKey = AMPLITUDE_API_KEY,
context = applicationContext,
autocapture = autocaptureOptions {
+sessions // or `+Autocapture.SESSIONS` [tl! ~~]
+appLifecycles // or `+Autocapture.APP_LIFECYCLES` [tl! ~~]
+deepLinks // or `+Autocapture.DEEP_LINKS` [tl! ~~]
+screenViews // or `+Autocapture.SCREEN_VIEWS` [tl! ~~]
}
)
)
```
```java Java
Configuration configuration = new Configuration(AMPLITUDE_API_KEY, getApplicationContext());
configuration.getAutocapture().addAll(Arrays.asList(
AutocaptureOption.APP_LIFECYCLES,
AutocaptureOption.DEEP_LINKS,
AutocaptureOption.SCREEN_VIEWS
));
Amplitude amplitude = new Amplitude(configuration);
```
{% /code-group %}
### Autocapture events
| Event | Description | Properties |
| ------------------------ | ---------------------------------------------------------------------------- | ------------------------------------ |
| Start session | Captures when a user starts a session in your app. | [User properties](#user-properties). |
| End session | Captures when a user ends a session in your app. | [User properties](#user-properties). |
| Application installed | Captures when a user opens the app for the first time after they install it. | |
| Application updated | Captures when a user opens the app for the first time after they update it. | |
| Application opened | Captures when a user launches or foregrounds the app after the first open. | |
| Application backgrounded | Captures when a user backgrounds the application. | |
| Screen viewed | Captures when a user views a screen in your app. | Screen name |
| Deep link opened | Captures when a user opens a deep link in your app. | URL and referrer information |
| Element Interacted | Captures when a user interacts with the UI elements in your app. | Element properties |
### User properties
Amplitude attaches [User Properties](https://amplitude.com/docs/get-started/user-property-definitions) to all Autocapture events, unless disabled.
================================================================================
# What events will you need
URL: https://amplitude.com/docs/get-started/select-events
================================================================================
# What events will you need
Events record the actions users take in your product (signup, purchase, level completed); properties describe the context of each action (channel, plan tier, level number). Every chart, funnel, and cohort in Amplitude reads from this event data, so the events you choose to track determine the questions you can later answer. Track too few and key questions go unanswered; track everything and signal drowns in noise.
Use this guide when you're building a tracking plan from scratch and need a starting list of events. If you already have a draft and want to validate event naming and structure, go to the [data planning playbook](https://amplitude.com/docs/data/data-planning-playbook) instead.
## How many events should you track
New customers often try to track most, or even all, of the actions a user can take in their product. **Resist this urge**. Although it feels logical that more data leads to more insights, it usually doesn't work that way. Too much data **obscures** insights, burying them under an avalanche of events and properties you don't need.
The right number of events depends entirely on the complexity of your product. If your app has a focused feature set, you might only need to track 20 events or so. If your product is feature-rich, 200 might be more appropriate.
To find the right number, think about **what kinds of insights** you want from Amplitude. What questions do you want Amplitude to help you answer in the next quarter? The next two quarters? Identify those questions, and choose the events that take you there.
## What events should you track
Always track **any actions** that fit into these three categories:
- Actions that complete a process within your product, such as a tutorial or signup process.
- Actions that guide a user through the main mechanics of your product.
- Actions that let a user make an in-app purchase.
After you decide which events to track, [plan your events](https://amplitude.com/docs/data/data-planning-playbook) takes a deep dive into this question, so read that next.
## Common events and properties to track by industry
This section offers advice, broken down by industry, about which events and properties to track to answer the questions most commonly asked by others in your industry. This isn't a comprehensive list of everything you need. These are suggestions to keep in mind as you create your [taxonomy](https://amplitude.com/docs/data/create-tracking-plan).
| | |
| ----------------------------------------------------------------- | --------------------------- |
| **Typical questions** | **Charts that answer them** |
| How many page views do we get? | Event Segmentation |
| How many sessions were there? | User Sessions |
| How long do users stay in session? | User Sessions |
| How much content does a user consume? | Event Segmentation |
| Which content has changed MoM? | Data Table |
| How many new users retain each week? | Retention Analysis |
| What content do users view? | Data Table |
| Where are our users? | Event Segmentation |
| What device families do our users use? | Event Segmentation |
| What platforms do our users use? | Event Segmentation |
| When are unique visitors coming to my site? | Data Table |
| What percentage of users convert? | Funnel Analysis |
| Is conversion improving or worsening? | Event Segmentation |
| How well do my channels convert? | Data Table |
| How many goals are users completing? | Data Table |
| What content represents the largest percentage of all page views? | Event Segmentation |
**Required events and properties:**
- Event: `Page View`.
- Properties: `url`, `channel`, `[Amplitude] Event hour of the day`.
- Your conversion event.
- `[Amplitude] New User`.
- `[Amplitude] Any Active Event`.
### Ecommerce
| | |
| ------------------------------------------------------------------- | -------------------------------- |
| **Typical questions** | **Charts that answer them** |
| What are the top referrers or sources for our users? | Event Segmentation or Data Table |
| Which referrers have the highest purchase conversion? | Funnel Analysis |
| How many items are viewed per session? | User Sessions |
| What are the most popular items viewed? | Event Segmentation |
| What are the most popular items purchased? | Event Segmentation |
| What percentage of users complete an order after they view an item? | Funnel Analysis |
| How long does it take a user to complete an order? | Funnel Analysis |
| How many purchases are made weekly? | Event Segmentation |
| What is the total revenue in a given day/week/month? | Event Segmentation |
| What is the lifetime value of my users? | Revenue LTV |
**Required ecommerce events and properties:**
- Event: `Page View`.
- Property: `utm_source`.
- Event: `View Item`.
- Property: `product_id`.
### B2B / SaaS
| | |
| ------------------------------------------------------------------------- | --------------------------- |
| **Typical questions** | **Charts that answer them** |
| How many daily active businesses do we have? | Event Segmentation |
| How many daily active users do we have? | Event Segmentation |
| What are the top engaged user roles? | Event Segmentation |
| What percent of businesses start a trial and convert to paying customers? | Funnel Analysis |
| What percent of businesses on a trial perform [key event]? | Event Segmentation |
| How many users sign up per week? | Event Segmentation |
| How long does it take for a new user to perform [key event]? | Funnel Analysis |
| What % of daily active users perform [key event]? | Event Segmentation |
| How frequently do users perform [key event]? | Event Segmentation |
| What are the most popular paths users take when they log in? | Pathfinder |
**Required B2B / SaaS events and properties:**
- Group type: `Business`.
- User property: `role = eng`, `design`, and so forth.
- User property: `Paying = true/false`.
- Event: `Trial Started`.
- Event: `Trial Canceled`.
- Event: `Account Signed Up`.
- Event: `Account Logged In`.
- Your organization's own `[key event]`.
### Finance
| | |
| ---------------------------------------------------------------------------------- | --------------------------- |
| **Typical questions** | **Charts that answer them** |
| How many users sign up per week? | Event Segmentation |
| Which marketing channels have the most conversion to sign-ups? | Funnel Analysis |
| What percentage of users who sign up then connect their bank? | Funnel Analysis |
| What percentage of users have automatic transfers set up? | Event Segmentation |
| What is the monthly retention of users who come back to submit money transfers? | Retention |
| What is the conversion of users who connect a bank and make three money transfers? | Funnel Analysis |
| How frequently do users submit money transfers? | Event Segmentation |
**Required finance events and properties:**
- User property: `utm_source`.
- Event: `Account Signed Up`.
- Event: `Bank Connected (bank name)`.
- Event: `Automatic Transfer Created`.
- Event: `Transfer Submitted (transfer amount)`.
### Media
| | |
| ---------------------------------------------------------------------------- | --------------------------- |
| **Typical questions** | **Charts that answer them** |
| How many users sign up per week? | Event Segmentation |
| What percent of users start a free trial and then purchase a subscription? | Funnel Analysis |
| On what day within the trial do free-trial users usually cancel their trial? | Event Segmentation |
| What percent of users view content on phone vs tablet vs desktop? | User Composition |
| What is the average count of content viewed during a trial? | Event Segmentation |
| What percentage of users perform a search and then view content? | Funnel Analysis |
| What is the average count of content viewed per user per day? | Event Segmentation |
| What is the percentage of content viewed per genre? | Event Segmentation |
| What is the average session length per user? | User Sessions |
**Required media events and properties:**
- User property: `Active Trial = true/false`.
- User property: `Device Category = phone, tablet, desktop`.
- Event: `Account Signed Up`.
- Event: `Trial Started`.
- Event: `Trial Canceled`.
- Event: `Subscription Purchased`.
- Event: `Search Performed`.
- Event: `Content Viewed (genre property = comedy, romance, and so forth)`.
### Healthcare
| | |
| --------------------------------------------------------------------------- | --------------------------- |
| **Typical questions** | **Charts that answer them** |
| How many users sign up per week? | Event Segmentation |
| What percentage of weekly active users schedule an appointment? | Event Segmentation |
| What percentage of users perform a search and then schedule an appointment? | Funnel Analysis |
| How many users rate their visit after scheduling an appointment? | Funnel Analysis |
| What is the average appointment rating provided by users? | Event Segmentation |
| Of users who have booked an appointment, which regions are they from? | User Composition |
**Required healthcare events and properties:**
- User property: `Region`.
- Event: `Account Signed Up`.
- Event: `Search Performed`.
- Event: `Appointment Scheduled`.
- Event: `Appointment Rated (rating = 1, 2, 3, 4, 5)`.
### Gaming
| | |
| ---------------------------------------------------------------- | --------------------------- |
| **Typical questions** | **Charts that answer them** |
| How many users install the app per day? | Event Segmentation |
| How many users start a level per day? | Event Segmentation |
| What percentage of users complete a level per day? | Funnel Analysis |
| Which level do users fail the most? | Event Segmentation |
| What percentage of users who have played a game make a purchase? | Funnel Analysis |
| What is the average session count of users per day? | User Sessions |
| What is the average session length of users who start a level? | User Sessions |
| What is the lifetime value of users? | Revenue |
**Required gaming events and properties:**
- User Property: `Region`.
- Event: `App Installed`.
- Event: `Level Started (level = integer)`.
- Event: `Level Completed (level = integer)`.
- Event: `Level Failed (level = integer)`.
- Event: `Purchase Completed (revenue)`.
## Industry-specific guides
Amplitude also offers **industry-specific best practices guides** to help you implement and start getting insights quickly. With the goal of driving tangible conversion, retention, and product outcomes, these guides provide you with **recommended use cases and business questions**, a **proposed taxonomy**, and an **example dashboard** that you can use for your own implementation, all tailored to meet the specific needs of your industry.
Amplitude offers guides for companies in the [e-commerce](https://analytics.amplitude.com/share/8f32b20708e743e597b75c99b7a766d5), [fintech](https://analytics.amplitude.com/share/cbb3827995aa4d03852a3cdf9a3c46b0), [print media](https://analytics.amplitude.com/share/5940753342e04394bd0379cdd952cc18), and [streaming media](https://analytics.amplitude.com/share/6f40a915c14144b8ac992a5a8d7cf7cb) sectors, with more on the way.
================================================================================
# Track progress as you instrument Amplitude
URL: https://amplitude.com/docs/get-started/track-your-progress
================================================================================
# Track progress as you instrument Amplitude
As you implement Amplitude for the first time, take care to QA your data during each step of the process. This helps ensure that you're tracking the events, users, and actions that provide valuable insights for your product or service.
## QA your instrumentation
To verify your instrumentation works as intended, go to Amplitude's [User Activity tab](https://amplitude.com/docs/sdks/sdk-debugging). Fire some events using your test device, go to your project in Amplitude, and then watch as the device ID or user ID appears on the near-realtime feed. Clicking that ID takes you to that user's event stream, which should include the events you've decided to track. If you don't see the events you expect, something's wrong with your instrumentation.
## Know your event limits
If you go over your limit for the month, Amplitude still ingests your data as usual. However, you can't access that excess data unless you upgrade to a new tier or wait until the following month.
## Understand how Amplitude handles duplicate events
Amplitude de-duplicates your data so it doesn't log unique events multiple times. Amplitude checks the event ID, client event time, and device ID for every event. If the event isn't in the database, Amplitude writes it. Otherwise, Amplitude drops the event.
If you're using the Amplitude HTTP API, add an [insert_id field](https://amplitude.com/docs/apis/analytics/http-v2). Amplitude ignores subsequent events sent with the same event ID, client event time, and device ID, or with the same insert_id, within the past seven days.
================================================================================
# Questions your engineer might ask you
URL: https://amplitude.com/docs/get-started/engineer-questions
================================================================================
# Questions your engineer might ask you
Your engineer may have questions about how you want to use and classify data in Amplitude. Common questions follow, with resources to help you answer them.
## Could you provide a sample or example payload of the data issue you're seeing?
[User Lookup](https://amplitude.com/docs/analytics/user-data-lookup) lets you explore real-time data streams from actual users. You can also start with [Microscope](https://amplitude.com/docs/analytics/microscope) in a chart, then select **View User Streams** to drill down to User Lookup.
## What specific user or group properties do you need?
Refer to the [guide to events and properties by industry](https://amplitude.com/docs/get-started/select-events) for the most common selections. Start there first.
## How often do user properties need updating? Is updating on profile changes enough?
User properties reflect the state of the user. They [apply across all the user's future events](https://amplitude.com/docs/data/user-properties-and-events) until the next update. You don't have to send user properties with every event, because Amplitude fills in existing user property values for each event until the next update.
## Why is this classified as an event property rather than a user property?
The subject of the property value determines the property type. If a property describes a characteristic of a user, like location, language, device type, or referral source, it's a user property. If a property adds context to an event the user triggered, like the direction of a finger swipe or the title of a viewed article, it's an event property.
If your engineer asks this, look closely at the event to confirm you've classified it correctly.
================================================================================
# Cross-platform instrumentation vs. separate platform instrumentation
URL: https://amplitude.com/docs/get-started/cross-platform-vs-separate-platform
================================================================================
# Cross-platform instrumentation vs. separate platform instrumentation
Amplitude customers often ask if they should use the same API key for the iOS and Android versions of the same app, or if they should tie web and mobile data together. The answer depends on the kind of apps you have and the kind of analyses you want to do.
Sometimes an app behaves differently on each individual platform (Android, iOS, and web), so your top priority should be to analyze how each one performs on its own. Other times, understanding a user's behavior across platforms is the top priority. You know your users can come from any platform, and you're more interested in a user's actions than the platform they were on when they took those actions.
## When to do a cross-platform instrumentation
Cross-platform instrumentation makes sense in these situations:
- You expect frequent user crossover between platforms.
- You want to analyze user behavior across platforms as a key focus for your company. (This requires you to collect user IDs.)
- You have experience using the same API key in another analytics product.
- You've read and understood the advantages of using the same API keys.
This approach has two primary advantages: you can view totals across all platforms in a single unified view, and you can create funnels or retention charts that analyze user behavior across platforms.
## When to do a separate platform instrumentation
Sometimes separate platform instrumentation makes more sense. For example:
- Your app acts as a standalone on each platform, and user crossover analysis isn't important.
- Your goal is to understand how users engage within each platform.
Consider these advantages:
- **Platform differences**: Even if your app has the same primary functions on iOS and Android, slight differences exist in how Amplitude tracks certain actions (for example, asking for permissions). These differences may warrant separation. Any slight differences in the apps themselves (such as showing different landing or tutorial screens) may also be easier to manage when separated.
- **Different update cycles**: Instrumentation changes happen all the time, and app updates rarely go live on the same day. Data and possibly new events from a **new** version on a certain platform could mix with data and old events from the **old** version, which pollutes the dashboard and takes focus away from the important metrics.
- **Difficulty finding errors**: Having events from multiple platforms on the same dashboard makes it more difficult to spot errors and bugs in instrumentation and make the necessary fixes.
- **Web and mobile are very different**: The experiences on web and mobile differ, and the kinds of events you want to track may also be very different.
================================================================================
# The Amplitude Home page
URL: https://amplitude.com/docs/get-started/amplitude-home-page
================================================================================
# The Amplitude Home page
The Amplitude Home page shows how many users you have, how many are new, where they are, and what they're doing, alongside your last five visited items, a shortcut to create a chart, and a link to the template gallery. Click _Home_ in the top-left corner to open it.
Use the Home page when you want a default overview without configuring anything. If you need a persistent view tailored to a team or workflow, build a custom [dashboard](https://amplitude.com/docs/analytics/dashboard-create) instead.
After you get comfortable creating your own analyses in Amplitude, you can replace the included charts with others that fit your organization.
The **real-time event stream** shows what your users are doing in your product at any given moment. The stream lists the most recent events your users have triggered. Click any event to [generate an Event Segmentation chart](https://amplitude.com/docs/analytics/user-data-lookup) screen.
To open an empty Event Segmentation chart, click _Create a chart_ under _Quick Actions_. You then fill in the events and properties yourself. To view all available dashboard templates, click _Start from a template_ to go to the [template gallery](https://amplitude.com/docs/get-started/start-from-template).
In the template gallery, you can open a template, modify it by adding your own relevant events, and save it as a new dashboard.
If you aren't sure what any of these terms mean, click through the links in this article to read more about them in the Help Center.
**Next:** [Create a chart](https://amplitude.com/docs/get-started/create-a-chart)
================================================================================
# Create a chart
URL: https://amplitude.com/docs/get-started/create-a-chart
================================================================================
# Create a chart
**Charts** are the heart of almost any Amplitude analysis. To create a new chart, click _Create > Chart_, then select a new chart type from the Charts fly-out.
### Restrictions
This feature is **limited** for users on **Free plans**.
- Organizations on a Free plan can save up to ten charts.
- Organizations on a Free plan can query up to one year of data.
- Organizations on a Plus plan can query up to two years of data.
For a high-level overview of each chart type, refer to the [overview of charts and features](https://amplitude.com/docs/analytics/charts/find-the-right-chart).
Find and add relevant [events](https://amplitude.com/docs/analytics/charts/build-charts-add-events), [properties](https://amplitude.com/docs/data/user-properties-and-events), and [user segments](https://amplitude.com/docs/analytics/charts/build-charts-add-user-segments) for your chart to generate useful information. Follow those links to learn more about those elements of an Amplitude analysis. You can also start from a [pre-built template](https://amplitude.com/docs/get-started/start-from-template) instead.
To save your chart, click **Save**.
When you save your chart for the first time, fill in all the relevant information in the Save modal that appears. Give your chart a name and description, add it to a dashboard or notebook, and specify whether others in your organization can find and view your dashboard.
After you save your chart, the _More_ drop-down menu offers several options for managing and working with your chart:
- **Unlisted**: This option lets other members of your organization find your chart. Note that admins and managers can always find saved charts, whether they're listed or unlisted.
- **Open Notebook View**: This opens the notebook fly-out panel, where you can preview your chart in notebook format. You can also add your chart to a [notebook](https://amplitude.com/docs/analytics/notebooks) from here by selecting the notebook you want and clicking **+ Add chart to notebook**.
- **Export**: This lets you share your chart as a PNG, PDF, CSV, or [shared link](https://amplitude.com/docs/analytics/share-external).
- **Save As**: This lets you save a new copy of your chart.
- **Move**: This lets you move your chart to a different space or folder.
- **Copy**: This opens a copy of your chart in a new browser tab.
- **Revert**: This restores the most recently saved version of this chart.
- **Archive**: Archive a chart when it's no longer relevant to your analyses. Users can still search for archived charts in Search. Archiving a chart disables all [shared links](https://amplitude.com/docs/analytics/share-external) associated with that chart. When you un-archive the chart, the shared links reactivate.
After you populate a chart with data, you can zoom in by dragging diagonally across the chart to create a rectangle over the section you want to view in more detail. Restore the full view by clicking **Reset zoom**.
**Next:** [Keep your work organized with spaces](https://amplitude.com/docs/get-started/spaces).
================================================================================
# Spaces: Keep your work organized
URL: https://amplitude.com/docs/get-started/spaces
================================================================================
# Spaces: Keep your work organized
Some of the most valuable analyses come from collaboration among teammates. **Spaces** help product teams subscribe to and organize analyses shared in Amplitude.
Every saved piece of content must live in a space. By default, Amplitude saves content into your personal workspace. You can also move content into a shared space.
A piece of content can live in one location only, but you can create [shortcuts](https://amplitude.com/docs/analytics/collaborate-with-spaces) to that content in other spaces.
### Restrictions
This feature is **limited** for users on **Free** and **Plus plans**.
- Organizations on **Free** plans can use **one space**.
- Organizations on **Plus** plans can use up to **three spaces**.
## Your personal space
Your personal space is the default location for content that you save. To open it, select your name in the _Favorite Spaces_ tab of the _Spaces_ drop-down. All your charts, notebooks, dashboards, folders, and archives appear here, unless you save them into a different space.
Your personal workspace and the folders inside it aren't visible to other people in your organization. Team members can still search for any content you mark as **discoverable** through Amplitude's search (if they have project permissions to view it), and you can still share links to content inside your personal workspace.
Select a piece of content to open and edit it. To move, rename, archive, or pin a piece of content, check the box next to the content's name and select the appropriate button in the toolbar at the top of the list.
### Create a new folder
Folders group related content together in a single, easy-to-view spot. To create a folder in a space, follow these steps:
1. Navigate to your space and select _New Folder_.
2. In the modal that appears, give your folder a name and select _Create folder_.
3. Add content to your folder now, if you want. You can also do that later.
## Create a space
To create a space, follow these steps:
1. Navigate to _Spaces > Create New Space_.
2. Enter a name for your space and a description in the appropriate fields of the modal that appears.
3. In the _Members_ field, select everyone who you want to join your new space. After you finish, select _Create space_.
{% callout type="note" %}
Users with admin, manager, and member-level permissions can create a space.
{% /callout %}
Use naming conventions for your space that are recognizable throughout the organization, so that others can understand what the team space covers.
A space can reuse a previously used name for a new project, as long as that project is deleted.
There's a lot more to using spaces effectively. When you're ready to explore further, go to [this article in the Amplitude documentation](https://amplitude.com/docs/analytics/collaborate-with-spaces).
**Next:** [Starting your Amplitude analysis from a pre-built template](https://amplitude.com/docs/get-started/start-from-template).
================================================================================
# Start from a template
URL: https://amplitude.com/docs/get-started/start-from-template
================================================================================
# Start from a template
In Amplitude Analytics, **templates** help teams efficiently recreate common analyses and share best practices with just a few clicks.
After you build some analyses of your own, you can [create your own templates](https://amplitude.com/docs/analytics/templates). Before that, use Amplitude's suite of starter templates in the **Template Gallery** to start generating insights into your users and their behavior.
Select the template you want to open. Any templates you create in the future also appear here.
{% callout type="note" %}
If you can represent a process as a [funnel](https://amplitude.com/docs/analytics/charts/funnel-analysis/funnel-analysis-get-the-most), track the steps in a Funnel Analysis chart. For example, tracking an onboarding funnel helps you understand if first-time users complete your signup process. A retention funnel helps you understand which parts of your product users find confusing or frustrating, so you can fix them quickly. If you need help deciding what events to track and in what chart, contact your dedicated Success Manager, or contact [Amplitude Support](https://help.amplitude.com/hc/en-us/requests/new).
{% /callout %}
Find the Template Gallery by selecting _Start from a template_ on the Amplitude Home page.
================================================================================
# Understand your users' activity
URL: https://amplitude.com/docs/get-started/understand-user-activity
================================================================================
# Understand your users' activity
The User Activity Report template shows how often and how long your users engage with your product, with prebuilt charts for active users, session length, retention, and breakdowns by device, country, and platform. The template needs no setup, but you can customize it and its individual charts.
The User Activity Report template includes the following charts:
- How many users are active each day?
- What percent of active users are new users?
- What percent of active users are returning?
- How long is the average session?
- When do these users come back?
- Breakdown of these users by device family.
- Breakdown of these users by country.
- Breakdown of these users by platform.
For a more detailed view into any of these questions, click the title of the chart you want.
## Customize the User Activity template
You can customize this or any template by first converting it into a dashboard. In Amplitude, templates and dashboards are related but distinct concepts. A [dashboard](https://amplitude.com/docs/analytics/dashboard-create) is a single, convenient view of several related charts. Use a dashboard to share insights with other stakeholders in your Amplitude project. A template is a reusable version of a dashboard. Use a template to make other, similar dashboards, which you can then customize to meet the specific needs of a different project.
To turn the template into a dashboard, follow these steps:
1. Select the project from the dropdown in the upper left of the screen.
2. Under _Events_, select the event you want to use as the active event. The default value is `Any Active Event`. To use something more specific, scroll until you find the event you want and select it.
You don't have to replace `Any Active Event`.
3. Click **Save As Dashboard**, give your new dashboard a name, and select a location to save it. Then click **Save**.
Your dashboard is now ready to use.
For more information, refer to [Create dashboards](https://amplitude.com/docs/analytics/dashboard-create) and [Templates in Amplitude](https://amplitude.com/docs/analytics/templates).
================================================================================
# Analyze your acquisition channels
URL: https://amplitude.com/docs/get-started/analyze-acquisition-channels
================================================================================
# Analyze your acquisition channels
Understanding how many customers come to your site and where they come from matters for any business, especially e-commerce. Amplitude helps you understand how many customers find your store, how well different campaigns generate new revenue, and which channels drive the most engagement.
With this knowledge, you can focus your efforts on optimizing ad spend, marketing efforts, and product enhancements.
You can find this information in the Ecommerce Report template. The template needs no setup, though you can customize the template itself and the individual charts it includes.
The Ecommerce Report template includes the following charts related to customer acquisition:
- How are customers finding my shop?
- How many customers have visited my shop in the last 30 days?
For a more detailed view of any of these questions, click the title of the chart you want to explore.
## Customize the Ecommerce Report template
You can customize this or any template by first converting it into a **dashboard**. In Amplitude, templates and dashboards are related but distinct. A [dashboard](https://amplitude.com/docs/analytics/dashboard-create) is a single view of several related charts. Use a dashboard to share insights with other stakeholders in your Amplitude project. A template is a reusable version of a dashboard. Use it to make other, similar dashboards, which you can then customize to meet the needs of a different project.
To turn the template into a dashboard, follow these steps:
1. From the dropdown in the upper left, select the Amplitude project you want this dashboard to track. To track the current project, leave it as-is.
2. Under _Events_, select the events you want to use for the charts in this dashboard. The E-Commerce template tracks events for:
- **Page View / Navigation**
- **Viewing Item**
- **Adding to Cart**
- **Completing Purchase**
- Properties for **Traffic Source**
For example, you can select a page view or navigation event to understand traffic as it enters your site and general navigation throughout. To identify traffic sources instead, select a property of your page view or navigation event that tracks the user's source. The source is often a UTM parameter like `utm_source`.
You don't have to supply an event or property for anything you aren't ready to track right now.
3. Click _Save As Dashboard_, give your new dashboard a name, and select a location to save it in. Then click _Save_.
Your dashboard is ready to use.
For more information, refer to [Dashboards](https://amplitude.com/docs/analytics/dashboard-create) and [Templates](https://amplitude.com/docs/analytics/templates).
================================================================================
# Analyze the adoption of a feature
URL: https://amplitude.com/docs/get-started/analyze-feature-adoption
================================================================================
# Analyze the adoption of a feature
The charts in the **Feature Adoption Report template** help you understand the customer behaviors linked to conversion and drop-off. The template needs no setup, though you can customize the template itself and the individual charts it includes.
The Feature Adoption Report template includes the following charts:
- How many unique users do `Any Active Event` each day?
- How many times does `Any Active Event` happen each day?
- What percentage of active users do `Any Active Event` each day?
- What percentage of unique users do `Any Active Event` for the first time each day?
- On average, how many times does each user do `Any Active Event` each day?
- On average, how many times does `Any Active Event` happen per session?
- How many times does each unique user do `Any Active Event` in 30 days?
- How many users return to do `Any Active Event` after their first time?
For a more detailed view of any of these questions, click the title of the chart you want to explore.
## Customize the Feature Adoption Report template
You can customize this or any template by first converting it into a **dashboard**. In Amplitude, templates and dashboards are related but distinct. A [dashboard](https://amplitude.com/docs/analytics/dashboard-create) is a single view of several related charts. Use a dashboard to share insights with other stakeholders in your Amplitude project. A template is a reusable version of a dashboard. Use it to make other, similar dashboards, which you can then customize to meet the needs of a different project.
To turn the template into a dashboard, follow these steps:
1. From the dropdown in the upper left, select the Amplitude project you want this dashboard to track. To track the current project, leave it as-is.
2. Under _Events_, select the events you want to use for the charts in this dashboard.
For example, for questions about **feature discovery**, select an event that signals successful feature usage. For the **value moment** that results in a conversion, select an event that reflects the user behavior you want. For a streaming service, this might be `Video Watched`. For an e-commerce company, it might be `Complete Purchase`.
You don't have to supply an event for anything you aren't ready to track right now.
3. Click _Save As Dashboard_, give your new dashboard a name, and select a location to save it in. Then click _Save_.
Your dashboard is ready to use.
For more information, refer to [Dashboards](https://amplitude.com/docs/analytics/dashboard-create) and [Templates](https://amplitude.com/docs/analytics/templates).
================================================================================
# Understand the conversion rate of an important flow
URL: https://amplitude.com/docs/get-started/understand-conversion-rate
================================================================================
# Understand the conversion rate of an important flow
The charts on the Conversion Report template give you a deeper understanding of the customer behaviors linked to conversion and drop-off. You can apply it to any important in-product flow. No setup is required, but you can customize the template and the individual charts if you need to.
The Conversion Report template includes the following charts:
- What's the conversion rate of this funnel?
- How is the conversion rate changing over time?
- How long does it take users to convert?
- How many times do users do `New User` before doing `Any Active Event`?
- What paths do users take to get to `Any Active Event`?
For a more detailed view into any of these questions, click the title of the chart you're interested in.
## Customize the User Activity template
You can customize this or any template by first converting it into a dashboard. In Amplitude, templates and dashboards are related but distinct concepts. A [dashboard](https://amplitude.com/docs/analytics/dashboard-create) is a single, convenient view of several related charts. Use a dashboard to share insights with other stakeholders in your Amplitude project. A template is a reusable version of a dashboard. Use a template to make other, similar dashboards, which you can then customize to meet the specific needs of a different project.
To turn the template into a dashboard, follow these steps:
1. From the dropdown in the upper left, select the Amplitude project you want this dashboard to track. To track the current project, leave it as-is.
2. Under _Events_, select the active event you want to use for the charts in this dashboard.
You may want to replace the default `Any Active Event` event with something more specific. If so, consider selecting an event that clearly reflects the user behavior you want to measure. For a streaming service, this might be `Video Watched`. For an ecommerce company, it might be `Complete Purchase`.
Scroll until you find the event you want and select it.
You don't have to change the default active event.
3. Click _Save As Dashboard_, give your new dashboard a name, and select a location to save it in. Then click _Save_.
Your dashboard is now ready to use.
For more information, refer to [Create dashboards](https://amplitude.com/docs/analytics/dashboard-create) and [Templates in Amplitude](https://amplitude.com/docs/analytics/templates).
================================================================================
# How Amplitude identifies your users
URL: https://amplitude.com/docs/get-started/identify-users
================================================================================
# How Amplitude identifies your users
Amplitude identifies your users through three signals: the device ID that each device sends, the Amplitude ID that Amplitude computes to stitch those devices into one profile, and the user ID your product assigns after someone signs in. The device ID arrives automatically from the SDK; Amplitude generates the Amplitude ID once it has enough information to conclusively identify a unique user; and you decide when to set the user ID.
The user ID is a unique identifier for an individual user. Setting one is optional but recommended, because it lets Amplitude reconcile events across every device the same person uses. Set the user ID after a user creates an account, logs in, or is otherwise identified in your product.
Amplitude can use a user ID to reconcile events across multiple devices under the same user ID. Amplitude also merges a user's event data on the backend, which connects the correct user ID to any anonymous events the user generated before the user ID assignment. For this reason, you can wait to assign user IDs if that makes sense for your product. This is also why you shouldn't set user IDs for anonymous users.
After you set a user ID in Amplitude, you can't change it.
If your product doesn't assign user IDs, skip this section.
Before you continue to the next step, refer to [How Amplitude identifies unique users](https://amplitude.com/docs/data/sources/instrument-track-unique-users) for details.
## Best practices for setting user IDs
- **Don't set the user ID if there isn't one.** For example, if you set the user ID to the string `None` for multiple users, Amplitude doesn't recognize those users as separate users. Instead, Amplitude assumes all those users are the same user and groups all events for those users together under that `None` user ID. You can always set the user ID later.
- **Don't assign a user ID that might change.** User IDs are fixed forever. For example, don't set a user's email address as their user ID, because email addresses change.
- **User IDs are case-sensitive.** If you set a user ID in a different case, Amplitude tracks two separate profiles for the same user.
- **Assigning user IDs server-side can be tricky.** If you encounter issues assigning user IDs, [contact Amplitude Support](https://support.amplitude.com).
================================================================================
# Helpful definitions
URL: https://amplitude.com/docs/get-started/helpful-definitions
================================================================================
# Helpful definitions
This glossary defines the core Amplitude analytics terms, including identifiers, events, properties, cohorts, sessions, and metrics.
- **Active user**
- **Definition**: By default, an active user has logged at least one event during your selected interval: real-time (five minutes), hourly, daily, weekly, or monthly. You can edit this definition by marking certain events as inactive. Users who have only performed inactive events no longer show up as active users.
- **Amplitude ID**
- **Definition**: A unique ID that identifies a particular user across multiple User IDs or Device IDs.
- **Behavioral cohort**
- **Definition**: A set of users with shared behaviors and properties, such as users who have made at least five purchases within the last 30 days.
- **Device ID**
- **Definition**: A device-specific identifier. For iOS, the device ID is the identifierForVendor (IDFV), which doesn't persist across installs. For Android, Amplitude generates a random device ID and stores it locally on the phone. A flag exists to use the Advertising Identifier as the device ID. The Advertising Identifier persists across installs, but users can change this identifier on their devices at any time.
- **Event**
- **Definition**: An action a user takes in your product. An event can be anything from pushing a button, completing a level, or making a payment. Depending on your product, aim to track between 15 and 200 events to get a full understanding of how users engage with your app.
- **Event ID**
- **Definition**: A counter that distinguishes events. Event IDs associate with the device ID and aren't unique to an organization. For example, device ID XYZ can have event IDs of 1, 2, 3, 4, and so on, as the device fires those events. Another device ID, ABC, can also have event IDs of 1, 2, 3, 4, and so on, as that device fires events.
- **Event property**
- **Definition**: Reflects detailed information about an event at the time Amplitude tracked it. These properties depend on the type of app you have and the information you need to understand a particular event. Examples of general keys are cause, description, category, type, duration, level, % completed, name, count, source, status, from, number, lives, authenticated, error, rank, action, and mode.
- **Funnel**
- **Definition**: A customized series of events a user goes through to successfully do something in your app, such as successful onboarding.
- **Inactive event**
- **Definition**:
- Events that you configure as inactive in Amplitude Data.
- Amplitude users typically configure inactive events as events that aren't tied to a user action but still occur within the app or website. One example is a push notification or email sent to the end user.
- **Monthly tracked user (MTU)**
- **Definition**: A unique user who triggers one or more events in a project within a calendar month.
- **New user**
- **Definition**: A new user has logged an event for the first time, including inactive events. The user's new-user time is when the user logged their earliest event.
- **Retention**
- **Definition**: Measures how often your users return to your app over a time frame.
- **Session**
- **Definition**: A period of time when a user has your app in the foreground. By default, Amplitude combines events within five minutes of each other into a single session on a mobile app. On web, Amplitude combines events within 30 minutes of each other into a single session.
- **Session ID**
- **Definition**: The number of milliseconds since epoch (UTC) when the first event of the session occurs.
- **Stickiness**
- **Definition**: Measures the number of different days or weeks a user performs an event in each week or month interval.
- **Unique user**
- **Definition**: A distinct individual that Amplitude attributes events to. Amplitude uses a system of identifiers to count unique users. In the raw data, Amplitude counts unique users using amplitude_id.
- **User ID**
- **Definition**: A unique ID that identifies a user, such as an email address or username.
- **User property**
- **Definition**: Reflects traits about the individual person using your app. Examples of custom user properties are locale, referral source, plan type, number of photos uploaded, number of units of in-game currency, and current level in a game. These user properties reflect the state of the user and apply across all the user's events.
- **[Amplitude logo]**
- **Definition**: A prefix Amplitude uses to mark user properties it tracks automatically through its SDKs.
- **Any Active Event**
- **Definition**: Any event you track in Amplitude that you haven't marked as inactive.
- **Any Event**
- **Definition**: Any event you track in Amplitude, regardless of activity.
- **Top Events for Segment**
- **Definition**: The top 10 active events by event totals at the time of the query for the specific segment (in the chart's right module).
- **Top Global Events**
- **Definition**: The top 10 active events by event totals at the time of the query.
================================================================================
# User property definitions
URL: https://amplitude.com/docs/get-started/user-property-definitions
================================================================================
# User property definitions
By default, Amplitude tracks the user properties listed in the following table automatically, through client-side [SDKs](https://amplitude.com/docs/sdks/analytics). Amplitude prefixes all these properties with the Amplitude logo whenever you encounter them in Amplitude. If you prefer, configure Amplitude's SDKs to disable automatic tracking of these properties:
- [Browser SDK](https://amplitude.com/docs/sdks/analytics/browser/browser-sdk-2#optional-tracking)
- [iOS SDK](https://amplitude.com/docs/sdks/analytics/ios/ios-swift-sdk#disable-tracking)
- [Android SDK](https://amplitude.com/docs/sdks/analytics/android/android-kotlin-sdk#disable-tracking)
Amplitude uses the collected IP address to determine a user's location properties (`City`, `Country`, `Region`, and `DMA`) using the [MaxMind](https://www.maxmind.com/en/home) database. MaxMind ranks among the most reliable digital mapping sources.
In Amplitude charts, if you choose to segment by device ID, event ID, latitude, longitude, server upload time, session ID, user ID, or ID, you have to supply the exact values yourself. You also can't group by event ID, latitude, longitude, server upload time, or ID.
{% callout type="note" %}
If you send data server-side instead of using an SDK, Amplitude can't track these user properties automatically. You must set these properties explicitly.
{% /callout %}
| **Property** | **Value Definition** |
| ------------- | --------------------------------------------------------------------------------------------------------------------------------------------------------------------------------------------------------------------------------------------------------------------------------------------------------------------------------------------------------------------------------------------------------------------------------------------------- |
| Cohort | [Behavioral cohort](https://amplitude.com/docs/analytics/behavioral-cohorts) name: "Cohort Name" |
| Country | Country of the event. This is pulled using GeoIP. "United States" |
| City | City of the event. This is pulled using GeoIP. "San Francisco" |
| Region | Region (for example, state, province, or county) of the event. This is pulled using GeoIP. "California" |
| DMA | Designated Market Area (DMA) of the event. This is pulled using GeoIP. "San Francisco-Oakland-San Jose, CA" |
| Language | Language of the device. This is drawn from the user's device settings or browser settings. "English" |
| Paying | Paying is set to null for all users by default. The property value changes to "true" at the time of the user's first revenue event (or first verified revenue event, if [validation](https://amplitude.com/docs/data/sources/instrument-track-revenue#enable-revenue-verification) is on). After a property is set to "true", it doesn't change. You can manually change this value through Amplitude's [Identify API](https://amplitude.com/docs/apis/analytics/identify): "true", null/none |
| Platform | Platform of the product. "iOS", "Android", or "Web" |
| OS | `OS` = `os_name` + `os_version`. `os_name` is the name of the user's mobile operating system or browser. `os_version` is the version of the users' mobile operating system or browser. "ios 9.1", "Chrome 46" |
| Device Family | Family of the device. "Apple iPhone", "Samsung Galaxy Tablet", "Windows" |
| Device Type | Specific type of the device. "Apple iPhone 6", "Samsung Galaxy Note 4", "Windows". This SDK doesn't track the specific type of device. |
| Carrier | The device's carrier. "Verizon" |
| Start version | First version of your application identified for the user. This can change if the user reinstalls the app. "1.0.0" |
| Version | Current version of your application identified for the user. "1.0.0" |
| Library | Library used to send the event. "amplitude-ios/3.2.1", "http/1.0" |
| IP Address | IP address of the user. "127.0.0.1" |
| Device ID | The device ID of the user. "C8F9E604-F01A-4BD9-95C6-8E5357DF265D" |
| Latitude | The latitude of the user. "42.3296" |
| Longitude | The longitude of the user. "-88.9995" |
| User ID | The user ID of the user. This should be a unique user identifier of the user and should never change for the same user, e.g. a hashed string of the user's username. This is explicitly set by the customer; Amplitude does not auto-populate this field. "abc123" |
| ID | The Amplitude ID of the user. "16342233234" |
================================================================================
# Event property definitions
URL: https://amplitude.com/docs/get-started/event-property-definitions
================================================================================
# Event property definitions
By default, Amplitude tracks the event properties in the following table automatically for page-viewed events. Client-side SDKs track some properties, while Amplitude generates others, like Event Day of Week or Session Replay ID.
Amplitude prefixes these properties with the Amplitude logo in the application. To disable automatic tracking of these properties, configure Amplitude's SDKs.
| Property | Value definition | Amplitude generated? |
| ------------------------ | -------------------------------------------------------------------------------------------------------------------------------------------------------------------------------------------------- | -------------------- |
| Event Day of Week | Day of the week the user performed the event: `Monday`. | Yes |
| Event Historical Count | User's Nth instance of performing an action: "1st". Amplitude applies this count before other filters in your query. | Yes |
| Event Hour of Day | Hour of day the user performed the event: "1". | Yes |
| Historical Count | User's Nth instance of performing an action: "1st". Amplitude applies the count after other filters in your query. | Yes |
| Page Counter | User's Nth instance of performing a default Page Viewed event within a session: "1". Use Page Counter = "1" with default Page Viewed events to analyze landing pages. | No |
| Page Domain | Domain where the event triggered: "app.amplitude.com". | No |
| Page Location | Page where the event triggered: `https://analytics.amplitude.com/login?q=home`. The Page Location event property includes query string parameters, while the Page URL event property removes them. | No |
| Page Path | Path where the event triggered: `/signup`. | No |
| Page Title | Title of the page where the event triggered: "Cohorts - Amplitude". | No |
| Page URL | URL of the page where the event triggered: `https://analytics.amplitude.com/login`. | No |
| Server Upload Delay Time | Difference (in milliseconds) between Amplitude's server upload timestamps and actual event timestamps for every event: "500". Use with property aggregation metrics. | Yes |
| Session Recorded | Boolean property that indicates whether Amplitude recorded an event: "True". | Yes |
| Session Replay ID | Session Replay ID of a recorded session: `c2e7e321-9a83-4c46-b889-244a92741b96/1703121610776`. | Yes |
================================================================================
# Browser compatibility for Amplitude's product website
URL: https://amplitude.com/docs/get-started/browser-compatibility
================================================================================
# Browser compatibility for Amplitude's product website
Amplitude's SDKs support a wider range of browsers. Amplitude supports browsers that match any of these requirements:
- Any browser with more than 0.5% of the worldwide browser usage market.
- The five most-recent Firefox versions.
- The five most-recent Chrome versions.
- The two most-recent Edge versions.
- The three most-recent Safari versions.
Amplitude doesn't support these browser types:
- "Undead" browsers that the browser maker no longer supports (for example, Internet Explorer 10).
- Internet Explorer 11.
- Op_mini all.
================================================================================
# How to organize your team for implementation
URL: https://amplitude.com/docs/get-started/implementation-team-organization
================================================================================
# How to organize your team for implementation
As you prepare to implement Amplitude, assign these three roles to members of your implementation team.
## Project Lead
Also known as the Adoption Lead, the Project Lead is usually the main point of contact between your company and Amplitude, especially on paid plans. Depending on the team that implements Amplitude, a product manager or someone from the data science team often fills this role.
Example tasks and responsibilities:
- Coordinate with your Success Manager (Growth and Enterprise plans only) to organize training or other workshops with your teams.
- Drive Amplitude adoption and usage across teams at your company.
- Manage implementation where needed. For example, when you expand Amplitude to a new platform or product, confirm that a [tracking plan (taxonomy)](https://amplitude.com/docs/data/data-planning-playbook) exists and that engineering resources are available.
## Data Governor
The Data Governor designs your team's tracking plan and maintains your Amplitude data quality. This person must align your business goals to the data you need to track in Amplitude. A product manager, an analyst, or someone else from the data science team often fills this role.
Example tasks and responsibilities:
- Establish a consistent naming convention and build the taxonomy you need to send data to Amplitude.
- Confirm that you aren't tracking data that may violate privacy policies or legislation you're subject to.
- Design and manage the process for ongoing tracking development. For example, when planning a new feature, the Data Governor challenges the product manager on how to measure the success of that feature. After you decide what to measure, connect with an engineering resource to track the relevant events and properties to Amplitude.
- One Data Governor can oversee multiple products or projects, or you can have one Data Governor per project.
## Instrumentation Lead
The Instrumentation Lead is primarily responsible for instrumenting new Amplitude events. A senior developer or dev lead often fills this role, especially when data comes from multiple locations.
Example tasks and responsibilities:
- Confirm that you have the expertise to instrument Amplitude events and, where needed, guide other developers on the topic.
- If data comes from sources other than client-side SDKs, understand and document these sources and their constraints, such as how real-time the back-end data is.
- Work with the Data Governor to validate Amplitude data. Troubleshoot potential duplicate events and other data issues.
- Depending on your developer team structure, you can split this role by platform (iOS, Android, web) or by product.
================================================================================
# Optimize your Amplitude workflow to improve user engagement
URL: https://amplitude.com/docs/get-started/optimize-amplitude-workflow
================================================================================
# Optimize your Amplitude workflow to improve user engagement
Follow this six-step workflow to measure and improve product engagement in Amplitude: identify your product's critical event, determine its usage interval, then build retention, Lifecycle, Personas, and Engagement Matrix charts. Amplitude's most successful customers use this sequence to lay the groundwork for their most important metrics and to connect related charts.
## Step 1: Identify your product's critical event
A critical event is an action users take in your product that aligns closely with your core value proposition. You probably already know what your critical event is: the action you want to drive your users toward.
| | |
| --------------------------------------------- | ------------------------------- |
| **Type of Product** | **Critical Event** |
| Self-guided meditation | Completing a meditation session |
| Find and book nearby fitness classes | Booking a class |
| Multiplayer mobile game | Playing a game |
| Buy and sell used things near you | Completing a purchase |
| On-demand grocery delivery | Completing a delivery |
| Share songs on various social media platforms | Sharing a song |
Use these questions to help identify your product's critical event:
- Does your product have different offerings? If so, what are they, and what are your success metrics for each?
- Does your product have distinct groups of users? If so, how do they differ in the way they use your product, and what value does each group get?
- What's the one action that you want a user to do every time they open your product?
- What metrics do you care about as a company? What are you trying to drive up, and which user actions connect to that metric?
[Read more about the critical event](https://blog.amplitude.com/user-retention-app-critical-event)
## Step 2: Determine your product's usage interval
Just as important as defining your critical event is determining how often people take that action. The product usage interval is the frequency (daily, weekly, monthly, and so on) with which you expect people to use your product.
People use some products daily, such as social networking, media, casual gaming, or productivity apps. Others, such as on-demand, e-commerce, and expense reporting apps, see much less frequent use.
You can't calculate user retention without first understanding your product's usage interval and critical event.
[Read more about the usage interval](https://amplitude.com/docs/analytics/charts/funnel-analysis/funnel-analysis-interpret)
## Step 3: Create retention graphs to understand your user retention rates
If you're having trouble retaining users, it may signal a problem with the product, or with the experience of using it. But if you can't track retention, you may never identify the issue.
Amplitude's Retention Analysis chart shows how often users return to your product after taking a specific action, a key signal of product adoption. Use it to discover the events that keep users coming back, as well as the ones that drive them away.
[Read more about retention analysis](https://amplitude.com/docs/analytics/charts/retention-analysis/retention-analysis-build)
## Step 4: Plot a user Lifecycle graph
After you identify your product's critical event, find out how your user base interacts with that event over time. A Lifecycle analysis breaks out your active users into three subgroups (new, current, and resurrected, which were formerly inactive) for a more granular view of user behavior.
The goal is to use this information to grow your current and resurrected user counts, either by keeping users engaged or by giving them a reason to become active again. Pay attention to your dormant users: if this category starts growing, you may have an engagement problem.
[Read more about Lifecycle analysis](https://amplitude.com/docs/analytics/charts/lifecycle/lifecycle-interpret)
## Step 5: Map your user personas
Knowing who is using your product is just as important as knowing what they're doing with it.
Amplitude's Personas chart groups your users into clusters based on the similarities of their event behavior: users who behave the same way end up in the same cluster. The Personas chart can surface similarities between user cohorts you may not have thought to look for, and it can guide you through creating a comprehensive set of user personas for your product.
[Read more about Persona development](https://amplitude.com/docs/analytics/charts/personas/personas-clustering)
## Step 6: Compare engagement across personas with the Engagement Matrix
Amplitude's Engagement Matrix chart breaks out the top and bottom events for engagement into a four-quadrant matrix view. You can spot which features to refactor or deprecate, and which ones offer the potential for extending engagement into other areas of your product. This view shows the high-level pattern of feature engagement in your product, by both breadth and frequency.
[Read more about the Engagement Matrix](https://amplitude.com/docs/analytics/charts/engagement-matrix/engagement-matrix-discover)
## Ongoing work: Create cohorts, compare, A/B test, improve
Beyond this workflow, use Amplitude to explore your product and user data further. Create cohorts in various charts and compare how different groups of users engage with your product. Are they taking different flows in [their user journeys](https://amplitude.com/docs/analytics/charts/journeys/journeys-understand-paths)? Do [experiments](https://amplitude.com/docs/feature-experiment/overview) show they convert more quickly with one variant?
Drill down into the differences and develop hypotheses on what product changes can encourage all users to become power users. Test these hypotheses through [A/B testing](https://amplitude.com/docs/get-started/analyze-a-b-test-results).
Use your wins to make meaningful product changes, and repeat as needed.
================================================================================
# Analyze A/B test results in Amplitude
URL: https://amplitude.com/docs/get-started/analyze-a-b-test-results
================================================================================
# Analyze A/B test results in Amplitude
To analyze A/B test results in Amplitude, tag each user with the experiment variation they experienced as a user property, then compare how each variation performs in the [AB Test View](https://amplitude.com/docs/analytics/charts/funnel-analysis/funnel-analysis-interpret). A/B testing runs controlled, randomized experiments to improve a website or application metric, and the AB Test View measures that impact by comparing how each experiment group behaves in your application.
For example, you can show two different onboarding flows to different groups of new users, then use the results to identify the flow that drives more users to complete onboarding. You can also test different checkout flows to see which generates more sales.
{% callout type="note" heading="Note" %}
Use the AB Test View to analyze experiments you instrument yourself with user properties. If you want Amplitude to assign variations and run the experiment for you, use [Amplitude Experiment](https://amplitude.com/docs/analytics/charts/experiment-results/experiment-results-dig-deeper) instead.
{% /callout %}
## Instrument your experiments
Instrument your experiments before you analyze results. Amplitude recommends using user properties to associate a user with a given experiment variation. User properties reflect traits about each individual person using your product. Use them to segment your analysis in Amplitude Analytics.
Two main methods update a user property:
1. [SDKs](https://amplitude.com/docs/sdks) and [HTTP API](https://amplitude.com/docs/apis/analytics/http-v2): Update user properties on event action.
- **How**: Send user properties with each event through Amplitude's [SDKs](https://amplitude.com/docs/sdks) or [HTTP API](https://amplitude.com/docs/apis/analytics/http-v2).
- **Pros**: User properties take effect when your app sends the event. The properties stay with the user for all subsequent events until you explicitly update the values.
- **Cons**: These events count toward your monthly event volume. The events also count users as **active** users by default. Mark any A/B testing-related events as [inactive events](https://amplitude.com/docs/data/change-event-activity-status).
2. [Identify API](https://amplitude.com/docs/apis/analytics/identify): Update user properties without sending an event.
- **How**: Amplitude's [Identify API](https://amplitude.com/docs/apis/analytics/identify) updates a user property without sending an event.
- **Pros**: Updates a user property asynchronously without sending an event. The update doesn't affect your monthly event volume count.
- **Cons**: The user property doesn't take effect until the user takes an action. This isn't an issue for most experiments. The delay may affect experiments that track whether inactive users return to your application.
For example, suppose you're trying to bring users who have been inactive for more than seven days back to your app, and you're testing whether an email drives that return. If you use the [Identify API](https://amplitude.com/docs/apis/analytics/identify) to update a user property, the update only applies to users who return and trigger an event in your application. If a user remains inactive after receiving the email, the user property doesn't apply to that user. As a result, that inactive user isn't part of the experiment group that received the email, because the user property never attached. In situations like these, update user properties on an event action instead (for example, an event called `Email Sent`).
Learn more about [how Amplitude syncs user properties](https://amplitude.com/docs/data/user-properties-and-events).
## How many user properties to send
Amplitude users tend to take one of two approaches when instrumenting split tests:
### Use one user property per experiment
All user properties arrive as key-value pairs. This approach sets the experiment name as the key and all variations of the experiment as the potential values.
User Property Key: `Experiment 1`
User Property Value: `variation_a`
**Pros**: You can select experiments to segment by from the user segmentation tab.
**Cons**: The list of user properties can grow long, depending on the number of active experiments.
### Use one user property for all experiments
All user properties arrive as key-value pairs. This approach sets the key to `Split Tests` (or something similar) and stores the values in an array.
User Property: `Split Tests`
User Property Value: [`experiment_1_value`, `experiment_2_value`]
You can segment on the user property `Split Tests` by selecting the appropriate value or test group in the chart's [segmentation module](https://amplitude.com/docs/analytics/charts/build-charts-add-user-segments).
**Pros**: You have only one user property related to split testing (rather than one per experiment), so your user property list stays manageable in the dashboard.
**Cons**: Arrays can't exceed 10,000 characters when you use `append` or `prepend`. If an array exceeds this limit, Amplitude doesn't record any characters past the threshold.
{% callout type="note" heading="Note" %}
This feature doesn't support merged or transformed properties.
{% /callout %}
Amplitude also offers a full integration with [Optimizely](https://www.optimizely.com/) that updates user properties for each experiment.
## Viewing results in Amplitude
Review the results of your split tests after user properties update for each experiment group. Use the [AB Test View](https://amplitude.com/docs/analytics/charts/funnel-analysis/funnel-analysis-interpret) to conduct this analysis.
Compare the activity between experiment groups in the [segments module](https://amplitude.com/docs/analytics/charts/build-charts-add-user-segments) of the chart control panel. To do this, add your experimental groups.
================================================================================
# Cookies and consent management (Legacy JavaScript SDK)
URL: https://amplitude.com/docs/get-started/cookies-and-consent-management
================================================================================
# Cookies and consent management (Legacy JavaScript SDK)
{% callout type="warning" heading="Legacy JavaScript SDK" %}
This guide covers behavior with the legacy JavaScript SDK. **For new implementations, use the [Browser SDK 2 cookies and consent management guide](https://amplitude.com/docs/sdks/analytics/browser/cookies-and-consent-management)**, which covers the current TypeScript SDK.
New customers must use the new TypeScript SDK (Browser SDK 2). Existing customers should consider migrating to Browser SDK 2 for the latest features and improvements.
{% /callout %}
This guide covers functional and technical information about how Amplitude works with cookies, local storage, opt-in/opt-out options, and consent management (including CNIL regulations for France) when using the legacy JavaScript SDK.
{% callout type="info" heading="Recommended migration" %}
For the most current cookies and consent management features, migrate to [Browser SDK 2](https://amplitude.com/docs/sdks/analytics/browser/browser-sdk-2) and use the [Browser SDK 2 cookies and consent management guide](https://amplitude.com/docs/sdks/analytics/browser/cookies-and-consent-management).
{% /callout %}
## Amplitude cookies
A **cookie** is a piece of data from a website stored on a user's web browser. Websites retrieve cookies later to access data stored for functional or technical purposes. After initialization, the Amplitude SDK creates a cookie that begins with the prefix `AMP_` and ends with the first 10 digits of your project API key. You can customize this prefix with the `COOKIE_PREFIX` constant in the SDK's [constants.js](https://github.com/amplitude/Amplitude-JavaScript/blob/35e2dd3f342614cfb27fcb6455e361595ae222d7/src/constants.js#L36) file. The SDK defines the cookie's value in [amplitude-client.js](https://github.com/amplitude/Amplitude-JavaScript/blob/03c0a890d578db1ada383cf1e6195d71275bac44/src/amplitude-client.js#L121).
For example, if you use the default value for the prefix with the following:
```js
amplitude.getInstance().init("a2dbce0e18dfe5f8e...");
```
The Amplitude Browser 2.0 SDK creates a cookie with the format `AMP_` followed by the first 10 characters of your project's API key.
In previous versions of the SDK, you could customize the key for this cookie at initialization using the `cookieName` option. This no longer works, but if you use older SDK versions, the cookie name may differ from the standard name.
If another cookie appears with the key `amplitude_cookie_test` followed by a suffix of a random base64 string, the SDK uses that cookie to test whether the user has cookies enabled, and the SDK removes it when the test completes. For more information, refer to the detail in the SDK's [base-cookie.js](https://github.com/amplitude/Amplitude-JavaScript/blob/main/src/base-cookie.js#L97) file.
Sometimes, the SDK doesn't remove the `amplitude_test_cookie` cookie. In this case, the cookie remains in the cookie list, but the SDK doesn't use it. You can customize the key of this cookie with the `COOKIE_TEST_PREFEX` constant in the SDK's [constants.js](https://github.com/amplitude/Amplitude-JavaScript/blob/35e2dd3f342614cfb27fcb6455e361595ae222d7/src/constants.js#L35) file.
The cookie tracks the following metadata for the SDK:
- `deviceId`: A randomly generated string.
- `userId`: At user log-in, if your app sends this value to Amplitude, Amplitude stores it in the cookie. Set this to uniquely identify users. Amplitude encodes this value as Base64 before storing it.
- `optOut`: A flag to opt this device out of Amplitude tracking. If this flag is set, Amplitude stores no extra information about the user.
- `sessionId`: A randomly generated string for each session.
- `lastEventTime`: Time of the last event, used to decide when to expire and create a new session ID.
- `eventId`: An incrementing sequence of identifiers used to distinguish events.
- `identifyId`: An incrementing sequence of identifiers used to distinguish identify calls.
- `sequenceNumber`: A sequence number used to order events and identifies and to sequence them.
When the Amplitude JavaScript SDK loads, it checks the cookie for an Amplitude `device_id` (if the user is a returning user and generated a `device_id` in a previous visit). If so, the SDK uses that value. If not (either because the user is new or recently cleared cookies), the SDK randomly generates a `device_id` and saves it to the cookie.
### Cookie size
The cookie size varies from a minimum of 60 bytes to about 120 bytes. Because Amplitude can store two of them (`amp_*` and `amp_*.organization.domain`), assume 120 bytes as a safe average size for Amplitude cookies **per project API key**.
### Expiration time
The Amplitude SDK has a `cookieExpiration` option that lets you set the number of days until a cookie expires. Before SDK version 7.0, the default value was 10 years. After SDK version 7.0, `cookieExpiration` defaults to one year. Most browsers limit the lifetime of cookies set using `document.cookie` to between one and seven days.
### Remove Amplitude cookies
To programmatically remove the Amplitude cookie, use the JavaScript SDK's `clearStorage()` method. This method clears all cookies and deletes any metadata stored on them.
### Deprecated cookies
The following cookie keys are deprecated in the latest SDK versions:
- `amplitude_id_.your_org_domain`: In previous versions of the Amplitude JavaScript SDK, the cookie key defaulted to `amplitude_id`. This may appear in projects that use an SDK version before 6.0.0. In that case, the cookie key is `amplitude_id_.organization.domain`.
- `amplitude_test.your_org_domain`: The Amplitude SDK uses this cookie to more thoroughly test if cookies are available. By default, the key is `amplitude_cookie_test`. The SDK removes this cookie after the test.
## Disable cookies using LocalStorage (opt-out cookies)
The cookie contains data Amplitude needs to function correctly. It saves `deviceId`, `sessionId`, and the last event's timestamp. To store this information in a user's local storage instead, set `disableCookies` to `true` in the SDK's [options.js](https://github.com/amplitude/Amplitude-JavaScript/blob/4cbe557a81ca981d03e140bebed6134c49595a5e/src/options.js#L70) file.
### Data stored in local storage
Besides the information managed in the cookie, Amplitude uses local storage for:
- **Online events**: The `saveEvents` option in the SDK's [options.js](https://github.com/amplitude/Amplitude-JavaScript/blob/4cbe557a81ca981d03e140bebed6134c49595a5e/src/options.js#L103) controls these events (defaults to `true`). Amplitude stores every event it receives, then removes the event after successful upload. If set to `false`, events may be lost if the user navigates quickly to another page before Amplitude uploads the events.
- **Offline events**: The `savedMaxCount` option in the SDK's [options.js](https://github.com/amplitude/Amplitude-JavaScript/blob/4cbe557a81ca981d03e140bebed6134c49595a5e/src/options.js#L102) manages the number of offline events (defaults to 1000). If Amplitude logs more than 1000 events while offline, the SDK removes the oldest events from storage.
- **Failed events**: Amplitude stores failed events here for retry.
Amplitude stores this data in these keys:
- `amplitude_unsent_`: Stores unsent events. You can customize its name with the `unsentIdentifyKey` option in the SDK's [options.js](https://github.com/amplitude/Amplitude-JavaScript/blob/4cbe557a81ca981d03e140bebed6134c49595a5e/src/options.js#L126).
- `amplitude_unsent_identify_`: Stores unsent identify calls. You can customize its name with the `unsentKey` option in the SDK's [options.js](https://github.com/amplitude/Amplitude-JavaScript/blob/4cbe557a81ca981d03e140bebed6134c49595a5e/src/options.js#L125).
{% callout type="warning" heading="Local storage limitations" %}
Local storage restricts access by subdomain. For example, if you track non-identified users across subdomains like `www.amplitude.com` and `analytics.amplitude.com`, the `device_id` value for each subdomain isn't available while browsing the other.
The Amplitude SDK supports cross-site tracking with the `deviceIdFromURLParam` option in the SDK's [options.js](https://github.com/amplitude/Amplitude-JavaScript/blob/4cbe557a81ca981d03e140bebed6134c49595a5e/src/options.js#L71). When set to `true`, this option enables the SDK to capture the `amp_device_id` parameter from the URL. For more information, refer to [JavaScript SDK | Cross-domain tracking](https://amplitude.com/docs/sdks/analytics/browser/browser-sdk-2#cross-domain-tracking).
{% /callout %}
Other auto-captured properties aren't affected by using local storage instead of a cookie. [Refer to this article](https://amplitude.com/docs/get-started/user-property-definitions) for full detail.
This action disables cookie storage, but Amplitude stores the same data in the user's browser local storage. This isn't a valid option for a user who wants to fully opt out.
## Disable cookies and local storage / session storage (opt-out storage)
When you disable cookies and the user disables local storage and session storage, Amplitude creates a new `device_id` for that user every time they visit your site because Amplitude can't find an existing ID. If the user logs in or provides other identifying information, Amplitude's identity resolution system ties the various `device_id` values together with that user ID. The user must log in on each visit to enable Amplitude to merge identifiers.
## Disabling tracking (opt out tracking)
Users may want to opt out of cookies (which prevents Amplitude from storing any data in the cookie) and also opt out of tracking completely (which means Amplitude doesn't store events or records of their browsing history). The Amplitude SDK provides an `optOut` option to fulfill this request. To programmatically opt out of tracking, use the SDK method `amplitude.setOptOut(true)`.
### "Do not track" setting on browsers (DNT flag)
Some browsers have a "Do not track" setting intended to block all tracking. Amplitude doesn't adhere to this setting. The DNT standard isn't widely supported and it isn't clear what it's meant to disable. If you want to consider that setting, write your own code to test for the DNT flag and then set the `optOut` option in the SDK.
## Managing cookie consent
Certain jurisdictions require users to consent to non-essential cookies before you can collect any data. You're responsible for getting any necessary consents and making any necessary disclosures for the personal data you collect and send to Amplitude. You're also responsible for determining how you classify the Amplitude cookies in your cookie policy based on your specific use case and the jurisdictions in which you use them.
If you use the Amplitude SDK in one of these jurisdictions, don't initialize the SDK until the user has consented to your use of cookies. SDK initialization enables or disables Amplitude functions (for example, cookie storage, local storage, and tracking events).
To support this, the JavaScript SDK offers a `deferInitialization` option (defaults to `null`). If set to `true`, it disables the core function of the SDK (including saving a cookie or anything to the local storage) and all tracking until you explicitly enable it. The SDK instance loads without storage and tracking until you call `amplitude.getInstance().enableTracking()`.
When you call `amplitude.getInstance().enableTracking()`, Amplitude sets the `deferInitialization` option to `false` and creates the cookie with the option values you configured, as in the code in [client.js](https://github.com/amplitude/Amplitude-JavaScript/blob/03c0a890d578db1ada383cf1e6195d71275bac44/src/amplitude-client.js#L2060):
```js
/**
* Enable tracking through logging events and dropping a cookie
* Intended to be used with the deferInitialization configuration flag
* This will drop a cookie and reset initialization deferred
* @public
*/
AmplitudeClient.prototype.enableTracking = function enableTracking() {
// This will call init (which drops the cookie) and will run any pending tasks
this._initializationDeferred = false;
f(this);
this.runQueuedFunctions();
};
/**
* Saves deviceId, userId, event meta data to amplitude cookie
* @private
*/
var _saveCookieData = function _saveCookieData(scope) {
const cookieData = {
deviceId: scope.options.deviceId,
userId: scope.options.userId,
optOut: scope.options.optOut,
sessionId: scope._sessionId,
lastEventTime: scope._lastEventTime,
eventId: scope._eventId,
identifyId: scope._identifyId,
sequenceNumber: scope._sequenceNumber,
};
if (scope._useOldCookie) {
scope.cookieStorage.set(
scope.options.cookieName + scope._storageSuffix,
cookieData,
);
} else {
scope._metadataStorage.save(cookieData);
}
};
```
This doesn't affect users who have an Amplitude cookie, as shown in the code from [amplitude-client.js](https://github.com/amplitude/Amplitude-JavaScript/blob/03c0a890d578db1ada383cf1e6195d71275bac44/src/amplitude-client.js#L140). At some point, the user provided consent, which is all Amplitude needs to create the cookie legitimately. To opt that user out of tracking, remove any Amplitude cookies already set for that user.
The presence of an Amplitude Analytics cookie determines whether Amplitude tracks a user's events. For users who have one, consider the following:
1. If you manually set `cookieExpiration` to a short lifespan, you may need to run `amplitude.getInstance().enableTracking()` when the Amplitude Analytics cookie expires, or when the user logs in.
2. If the user removes all cookies, they see the consent banner again the next time they visit your app. Because no Amplitude Analytics cookie is set yet, the flow follows the [Managing cookie consent](#managing-cookie-consent) section, and the initialization of storage and tracking options waits if you use `deferInitialization = true`.
3. If the user consented to the Amplitude Analytics cookie at some point in the past, and that consent has expired for any reason (website cookie deletion, consent tracking expired), Amplitude prompts the user for consent again. If the user declines, you **must** explicitly remove the Amplitude Analytics cookie. Otherwise, it continues to collect the user's information against their will.
## Getting the SDK initialization options per project
From any site that uses the Amplitude JavaScript SDK, you can see which initialization options are set. Run the following command from the JavaScript console in the browser you use to access the site:
```js
amplitude.getInstance().options;
```
Amplitude displays the options alongside their values. For example, on amplitude.com you may see the following.
### API options in Amplitude Event Explorer Chrome extension
If you use the Amplitude Event Explorer Chrome extension, you can access the initialization options values in the "API Options" tab by first selecting the project you want.
If the Amplitude object instance isn't stored in the `window` object, this information isn't available to extract from the console or from the Chrome extension. This usually happens when using Node.js instead of the JavaScript SDK.
The error in the console appears like this.
### Storage options explained
This table gives a brief overview of each option related to storage.
| Option | Default Value | Definition |
| ---------------------- | ---------------------------------------- | --------------------------------------------------------------------------------------------------------------------------------------------------------------------------------------------------------------------------------------------------------------- |
| `cookieExpiration` | 365 | The number of days after which the Amplitude cookie expires. The default 12 months is for GDPR compliance. |
| `cookieForceUpgrade` | False | Forces SDK pre-v6.0.0 instances to adopt SDK post-v6.0.0 compatible cookie formats. |
| `deferInitialization` | Null | If _`true`_, disables the core functions of the SDK, including saving a cookie and all logging, until you explicitly enable them by calling _`amplitude.getInstance().enableTracking()`_. |
| `deviceIdFromUrlParam` | False | If _`true`_, the SDK parses device ID values from the URL parameter `amp_device_id` if available. This is useful for cross-domain tracking. Device IDs defined in the configuration options during init take priority over device IDs from URL parameters. |
| `disableCookie` | False | Disable Amplitude cookies altogether. |
| `domain` | The top domain of the current page's URL | Set a custom domain for the Amplitude cookie. To include subdomains, add a preceding period, for example: _`.amplitude.com`_. |
| `optOut` | False | Disable tracking for the current user. |
| `sameSiteCookie` | None | Sets the SameSite flag on the Amplitude cookie. Decides cookie privacy policy. |
| `saveEvents` | True | If `true`, the SDK saves events to local storage and removes them after successful upload. **Note:** Without saving events, events may be lost if the user navigates to another page before Amplitude uploads them. |
| `savedMaxCount` | 1000 | Maximum number of events to save in local storage. If the SDK logs more events while offline, it removes the oldest events. |
| `secureCookie` | False | If `true`, the SDK sets the Amplitude cookie with the Secure flag. The secure flag lets the browser send this cookie only on encrypted HTTPS transmissions. This ensures your cookie isn't visible to an attacker in, for instance, a man-in-the-middle attack. |
| `unsentIdentifyKey` | amplitude_unsent_identify | _`localStorage`_ key that stores unsent identifies. |
| `unsetKey` | amplitude_unsent | _`localStorage`_ key that stores unsent events. |
## Abstraction layer for storage
Find the abstraction layer for storage, available options, and stored metadata in Amplitude's GitHub:
- [constants.js](https://github.com/amplitude/Amplitude-JavaScript/blob/master/src/constants.js).
- [options.js](https://github.com/amplitude/Amplitude-JavaScript/blob/master/src/options.js).
- [cookiestorage.js](https://github.com/amplitude/Amplitude-JavaScript/blob/master/src/cookiestorage.js).
- [cookie.js](https://github.com/amplitude/Amplitude-JavaScript/blob/master/src/cookie.js).
- [base-cookie.js](https://github.com/amplitude/Amplitude-JavaScript/blob/master/src/base-cookie.js).
- [localstorage.js](https://github.com/amplitude/Amplitude-JavaScript/blob/master/src/localstorage.js).
- [metadata-storage.js](https://github.com/amplitude/Amplitude-JavaScript/blob/master/src/metadata-storage.js).
Amplitude sets the options at initialization. For cookie and metadata storage, this happens in the `Init` method for the Amplitude client:
- [amplitude-client.js](https://github.com/amplitude/Amplitude-JavaScript/blob/master/src/amplitude-client.js)
```js
this.options.apiKey = apiKey;
this._storageSuffix =
"_" +
apiKey +
(this._instanceName === Constants.DEFAULT_INSTANCE
? ""
: "_" + this._instanceName);
this._storageSuffixV5 = apiKey.slice(0, 6);
this._oldCookieName = this.options.cookieName + this._storageSuffix;
this._unsentKey = this.options.unsentKey + this._storageSuffix;
this._unsentIdentifyKey = this.options.unsentIdentifyKey + this._storageSuffix;
this._cookieName = Constants.COOKIE_PREFIX + "_" + this._storageSuffixV5;
this.cookieStorage.options({
expirationDays: this.options.cookieExpiration,
domain: this.options.domain,
secure: this.options.secureCookie,
sameSite: this.options.sameSiteCookie,
});
this._metadataStorage = new MetadataStorage({
storageKey: this._cookieName,
disableCookies: this.options.disableCookies,
expirationDays: this.options.cookieExpiration,
domain: this.options.domain,
secure: this.options.secureCookie,
sameSite: this.options.sameSiteCookie,
storage: this.options.storage,
});
const hasOldCookie = !!this.cookieStorage.get(this._oldCookieName);
const hasNewCookie = !!this._metadataStorage.load();
this._useOldCookie =
!hasNewCookie && hasOldCookie && !this.options.cookieForceUpgrade;
const hasCookie = hasNewCookie || hasOldCookie;
```
## Frequently asked questions
{% accordion title="Are Amplitude's cookies first-party or third-party cookies?" %}
**Amplitude uses first-party cookies**. From a technical standpoint, there's no difference between first-party and third-party cookies. The distinction relates to:
1. The context of a particular visit.
2. Who creates the cookie.
Every cookie has an owner, which is the domain defined in the cookie:
- **First-party cookies** come from a website that a user views directly. If a user lands on a website (for example, `fit.amplitude.com`), this site creates a cookie that's then saved on the user's computer.
This is how Amplitude works. When a customer adds the Amplitude JS SDK to their website, the customer (through their website) directly creates the cookie stored on the visitor's computer.
- **Third-party cookies** come from somewhere other than the website the user is visiting. Imagine you're visiting `fit.amplitude.com`, and the site uses YouTube videos for virtual non-live classes. In this case, YouTube sets the cookie that's saved on the user's computer.
The website owner embeds code, provided by YouTube, so the videos play directly in `fit.amplitude.com`. When that YouTube code executes in the browser, or the video loads, YouTube can track the player and put data in its cookies. The cookie qualifies as a third-party cookie because a domain other than `fit.amplitude.com` / `amplitude.com` creates it.
{% /accordion %}
{% accordion title="Will Google Chrome's plan to remove third party cookies affect Amplitude?" %}
**No.** As stated above, **Amplitude is not a third-party cookie**. Amplitude customers add Amplitude to their website or bundle themselves, and Amplitude sets it in their own bundled code through `document.cookie`, so Amplitude has the privileges of a first-party cookie.
{% /accordion %}
{% accordion title="Why aren't Amplitude cookies marked as `HttpOnly`?" %}
It doesn't make sense for Amplitude's cookies to be `HttpOnly`. The point of that option is to prevent `document.cookie` from reading those cookies (because they'd only be used in client-server communication). The point of Amplitude's cookies is the opposite: Amplitude **wants** to persist data in the browser and rest in `document.cookies`. Amplitude can't read from the server because Amplitude is client-side code.
If you're concerned that this makes the Amplitude cookie vulnerable to authentication information theft, you shouldn't be. Amplitude stores no authentication information in that cookie, so there's no danger of an XSS attack. The worst thing an attacker could do is steal Amplitude's cookie and take that user's device ID and user ID, which shouldn't be PII to begin with.
If this is still a serious concern for you, disable Amplitude's cookies.
{% /accordion %}
{% accordion title="Why aren't Amplitude's cookies marked as secure?" %}
The secure flag lets the browser **send the cookie only on encrypted HTTPS transmissions**. This ensures your cookie isn't visible to an attacker in, for instance, a man-in-the-middle attack. Amplitude stores no authentication information or other sensitive information in that cookie, so Amplitude isn't in danger of an XSS attack. Again, the worst thing an attacker could do is steal Amplitude's cookie and take that user's device ID and user ID.
For these reasons, Amplitude doesn't consider this a security vulnerability.
{% /accordion %}
{% accordion title="Will cookies cause unsent events to send to a project with a different API key?" %}
No. SDKs later than version 4.0.0 all scope events stored in the unsent keys (local storage) with the API key. If a product changes the project (or its API key) it's sending events to, those old events don't reach the new project.
In SDK versions before 4.0.0, this wasn't the case. The events didn't consider the API key when queued for retry. If the product still uses an old SDK version, old unsent events remaining in local storage reach the new project the moment the connection with Amplitude runs again. To mitigate this problem if you can't upgrade to a newer SDK version, try using an instance name for the project instead of the default project. Use this code to instantiate the Amplitude client: `amplitude.getInstance('ProjectName').init("API_KEY")`. Use this code to log any event: `amplitude.getInstance(ProjectName).logEvent()`.
{% /accordion %}
{% accordion title="How do you integrate with third-party Consent Management Platforms?" %}
Websites and applications can use a consent management platform (CMP) to manage legal consent from users about collecting and processing their personal data through any cookies and other trackers operating on the domain, as applicable privacy laws (such as GDPR, CCPA, and ePrivacy) may require. Some examples of these tools are OneTrust, Axeptio, and Responsum.
At the time of this writing, Amplitude doesn't have a default integration with any of these tools. Configure your CMP to pass the outcome of the consent to the Amplitude SDK, so that the Amplitude SDK opts any end user who hasn't provided consent (or who has revoked consent, depending on the end user's jurisdiction) out of tracking. The SDK as implemented on the customer's site or application must receive that signal to execute the _`amplitude.getInstance().enableTracking()`_ method while using the SDK deferred initialization as described in [**Managing Cookie Consent**](#managing-cookie-consent).
{% /accordion %}
{% accordion title="Can I use OneTrust with Amplitude to stay GDPR compliant?" %}
Yes, you can use Amplitude with a CMP, like OneTrust, in a GDPR-compliant manner. Amplitude can't direct you on how to classify the Amplitude SDK and cookies. Your privacy and legal teams should make this assessment based on the data you're collecting. Most customers, including in the EU, classify Amplitude cookies as Performance/Analytics cookies.
Customers may also choose to implement through a server-side integration, bypassing Amplitude's cookies from the SDK. Customers who integrate through a server-side integration are still responsible for getting any necessary consents and making any necessary disclosures for the personal data they collect and send to Amplitude.
{% /accordion %}
{% accordion title="When a user opts out, how can I opt them in again?" %}
Besides the `amplitude.getInstance().enableTracking()` method discussed earlier, after a user opts out you can opt them in programmatically by calling the `amplitude.setOptOut(false)` method. This sets the `optOut` option to `false`, resetting the cookie with the new options and enabling tracking. Find the following code in the Amplitude client:
```js
/**
* Sets whether to opt current user out of tracking.
* @public
* @param {boolean} enable - if true then no events will be logged or sent.
* @example: amplitude.setOptOut(true);
*/
AmplitudeClient.prototype.setOptOut = function setOptOut(enable) {
if (this._shouldDeferCall()) {
return this._q.push(
["setOptOut"].concat(Array.prototype.slice.call(arguments, 0)),
);
}
if (!utils.validateInput(enable, "enable", "boolean")) {
return;
}
try {
this.options.optOut = enable;
_saveCookieData(this);
} catch (e) {
utils.log.error(e);
}
};
```
{% /accordion %}
## CNIL France - Frequently asked questions
{% callout type="warning" heading="CNIL France FAQs" %}
FAQs related to CNIL aren't intended as legal or regulatory advice and don't constitute any warranty or contractual commitment on the part of Amplitude. Amplitude encourages customers to seek independent legal advice on your legal and regulatory obligations with issues related to this subject matter.
{% /callout %}
{% accordion title="CNIL France - What is the CNIL cookie exemption?" %}
**The CNIL (Commission Nationale Informatique & Libertés)** is the French Data Protection Agency. As a general rule, the CNIL requires user consent before a website, mobile application, or other connected device can use cookies. The CNIL allows a limited exemption from this requirement for cookies that collect only anonymous, aggregated statistical data used for measuring website traffic or performance. You can't combine data collected from these cookies with other data or use it to identify users.
{% /accordion %}
{% accordion title="CNIL France - What does the CNIL cookie exemption really mean?" %}
The CNIL maintains a list of services that you can use under the exemption. Any use of an analytics service under the CNIL exemption is subject to the following limitations:
1. **You can place analytics cookies** without asking for user consent **only if they collect anonymous statistical data for audience measurement** (overall traffic, page views).
2. **This doesn't mean a customer can collect ALL data** about a user for analysis.
3. Under the exemption, **customers can't use or create "user" analyses**.
{% /accordion %}
{% accordion title="CNIL France - What does the CNIL exemption mean for Amplitude and our cookies?" %}
As discussed, the CNIL allows a limited exemption from the requirement that companies obtain user consent for any non-essential cookies. In general, this exemption applies to analytics cookies for the limited purpose of audience measurement of an app or a site, and it's limited to the use of anonymous tracers.
**A customer's use of an analytics service under the exemption is therefore very limited**. Without the CNIL cookie exemption, customers might only collect and measure part of their traffic. The power of the limited data set (for example, the data set with just the users that opt in or consent) in Amplitude is much more valuable than the limited data that you can collect under the exemption, because:
- Audience measurement (page views, overall sessions) doesn't help customers make better decisions; behavioral analytics guides actions and learning.
- Amplitude doesn't need 100% of traffic to derive meaningful insights.
- Most exempted tools don't have the powerful analytics capabilities of Amplitude.
Besides using the SDKs, customers can still send data to Amplitude server-side. This doesn't require customers to obtain consent for a separate Amplitude SDK cookie. Customers who integrate through a server-side integration are still responsible for getting any necessary consents and making any necessary disclosures for the personal data they collect and send to Amplitude.
{% /accordion %}
{% accordion title="CNIL France - 13-month cookie limit" %}
The Amplitude SDK has a [`cookieExpiration` option](#expiration-time) that lets customers set the number of days a cookie lives. It defaults to one year as of the current version. Most browsers default to limiting the lifetime of cookies set using `document.cookie` to between one and seven days.
{% /accordion %}
{% accordion title="CNIL France - 25-month data retention max" %}
Use [Amplitude's Time to Live](https://amplitude.com/docs/data/time-to-live) functionality to set a retention schedule for event data.
{% /accordion %}
{% accordion title="CNIL France - Purpose strictly limited to the sole measurement of the site's or application's audience" %}
On the requirement to have a purpose strictly limited to the sole measurement of the site's or application's audience (performance measurement, detection of browsing problems, optimization of technical performance or ergonomics, estimation of the server power required, analysis of contents consulted), for the exclusive account of the publisher: Amplitude customers fully control the data they choose to send to the Amplitude platform, and can choose to only send Amplitude events related to audience measurement and page views.
{% /accordion %}
{% accordion title="CNIL France - Only serve to produce anonymous statistical data" %}
Before you start using Amplitude to produce anonymous statistical data:
- [Contact Amplitude](https://amplitude.zendesk.com/hc/en-us/requests/new) to:
- Request that Amplitude drop IP address for projects that contain end users who haven't provided consent.
- Discuss disabling Amplitude's User Look-Up and the ability to view user streams for projects that contain data for end users who haven't provided consent.
- Discuss the most effective configuration options for your use case.
- Ensure you don't send `deviceID` to Amplitude for end users who haven't provided consent.
- For end users who haven't provided consent, set a `userID` that's randomly generated or hashed.
- Consider disabling the capacity to filter end users at the individual level by hiding user properties such as `userID`, `deviceID`, and `Amplitude ID`. Review [Transformations](https://amplitude.com/docs/data/transformations) for more information.
- Consider disabling user downloads. Review [Managing Projects](https://amplitude.com/docs/admin/account-management/manage-orgs-projects) for more information.
{% /accordion %}
{% accordion title="CNIL France - Compliant with GDPR" %}
Amplitude's privacy program is based on privacy-by-design principles. Amplitude's privacy program ensures it complies with all relevant domestic and international privacy regulations and laws about processing personal data, including GDPR.
Amplitude also offers customers the choice of hosting their data in the US-West based AWS environment or the EU based AWS environment. To ensure Amplitude's customers can respond to and comply with end-user data deletion requests as required by global privacy laws such as GDPR, Amplitude built an API endpoint that lets customers programmatically submit requests to delete all data for a set of known Amplitude IDs or User IDs. For more details, refer to the developer documentation: [User Privacy API](https://amplitude.com/docs/apis/analytics/user-privacy).
You can also complete Data Subject Access Requests (DSARs) using the DSAR API, which makes it easy to retrieve all data about a single user. For more details, refer to the [CCPA DSAR API documentation](https://amplitude.com/docs/apis/analytics/ccpa-dsar).
For more information on Amplitude's stance on privacy and security, refer to [Amplitude Trust](https://amplitude.com/trust).
{% /accordion %}
{% accordion title="CNIL France - Cookies must not lead to a cross-checking of the data with other processing or that data be passed on to third parties." %}
Amplitude doesn't export data unless the customer chooses to export data to third-party products. Customers shouldn't use Amplitude to export data related to end users who haven't provided consent to third-party products.
On request, Amplitude can disable its cohort syncing and data streaming capabilities for orgs containing only data for end users who haven't provided consent.
{% /accordion %}
{% accordion title="CNIL France - Cookies must not allow the global follow-up" %}
The CNIL exemption states that cookies must not allow global follow-up of a person's navigation using different applications or browsing on different websites. Any solution that uses the same identifier across multiple sites (for example, through cookies placed on a third-party domain loaded by multiple sites) to cross-reference, duplicate, or measure a unified reach for content is excluded.
To comply with this requirement, **customers shouldn't use Amplitude's [cross-domain tracking](https://amplitude.com/docs/sdks/analytics/browser/browser-sdk-2#cross-domain-tracking)**, and should use [separate platform instrumentation](https://amplitude.com/docs/get-started/cross-platform-vs-separate-platform) for any projects with data from end users who haven't provided consent. By default, Amplitude doesn't use cross-domain tracking for customers.
{% /accordion %}
{% accordion title="CNIL France - The data is collected, processed and stored independently for each publisher" %}
In Amplitude, customer data is logically separated and stored in encrypted form in Amplitude's AWS environment.
{% /accordion %}
{% accordion title="CNIL France - The trackers are completely independent of each other and of any other tracker" %}
The cookie the Amplitude SDK uses is a [first-party cookie](#frequently-asked-questions), and the customer (as the controller of the data) collects any data the cookie collects. Amplitude only processes the customer's data as a processor or service provider, and doesn't use customer data for its own purposes.
{% /accordion %}
================================================================================
# Migrate From Adobe
URL: https://amplitude.com/docs/migration/migrate-from-adobe
================================================================================
# Migrate From Adobe
Migrating from Adobe Analytics to Amplitude means mapping Adobe's data model of hits, eVars, props, and Success Events to Amplitude's event-and-property model, re-pointing your data collection to Amplitude, and rebuilding the reports your team relies on. Start here when you plan to move product analytics off Adobe Analytics, then work through the sections in order: map your data, set up sources, backfill historical data, validate collection, and replicate reports.
## Migration goals
This guide provides insights into the following areas as you plan your migration:
### Data continuity and accuracy
- Ensure a smooth transition with minimal disruption to continuity.
- Guarantee the accuracy and consistency of analytics data in Amplitude.
### Efficient configuration and customization
- Replicate the custom configurations and custom reports you have in Adobe Analytics.
- Customize Amplitude to align with your organization's specific reporting needs and business requirements.
### User adoption and training
- Provide training on Amplitude to ensure a smooth transition for end-users.
- Provide clear communication to address user concerns and foster user adoption.
### Documentation and knowledge transfer
- Document the migration process, including configuration and troubleshooting procedures.
- Transfer knowledge to internal teams responsible for maintaining and using Amplitude.
### Compliance and governance
- Ensure compliance with data governance policies and regulatory requirements.
- Review and update privacy and consent policies to align with organizational policies.
### Integration
- Enable integration with other tools and platforms that your organization uses.
- Validate and optimize the data flows between Amplitude and other business systems.
## Differences in data models and top metrics
Adobe Analytics and Amplitude have different approaches to data modeling and tracking user interactions. Amplitude's data model focuses on events and properties. Adobe Analytics has different configurable data types like "hits" and custom metrics.
- Event Tracking
- Amplitude:
- Uses a flexible, event-centric data model.
- Enables dynamic event tracking without predefined configuration.
- Supports tracking of user interactions, custom events, and properties.
- Adobe:
- Uses page views and custom events to track user interactions.
- Pre-defines events that require configuration in the Adobe Analytics user interface.
- Has a more complex creation process for custom events.
- Properties
- Amplitude:
- Offers more flexibility with event properties.
- Captures properties dynamically with events.
- Allows richer, more dynamic segmentation of user data.
- Adobe:
- Relies on eVars and props to capture extra information about events.
- Requires variable configuration before users can create queries with metrics.
- User identification
- Amplitude:
- Uses a user-centric model.
- Tracks users with an identified user ID.
- Supports direct user identification and association with events.
- Adobe: Uses the concept of a [visitor](https://experienceleague.adobe.com/docs/analytics/components/metrics/unique-visitors.html?lang=en) to track users across sessions.
- Integrations and API
- Amplitude:
- Offers more flexibility with event properties.
- Captures properties dynamically with events.
- Allows richer, more dynamic segmentation of user data.
- Adobe: Provides an API for custom data integrations.
## Top metrics
Amplitude and Adobe Analytics use different terminology and structures for metrics, so direct one-to-one mapping may not be possible. The following table compares key metrics in Adobe Analytics with potential equivalents or comparable concepts in Amplitude.
| Term | Definition | Amplitude Equivalent |
| ---------------------------------- | ------------------------------------------------------------------------ | -------------------------------------------------------------------------------------------------------------------------------------------------------------------------------------------------------------------------------------------------------------------------------------- |
| Page Views | The total number of times users view a page. | `PageView` event. Amplitude captures this by default, and you can pass it from any data source. Refer to this [Community thread](https://community.amplitude.com/product-updates/default-event-tracking-as-part-of-our-browser-sdk-2-0-2462) for more information about autotracked events. |
| Unique Visitors | A count of the distinct visitors to a website or app. | Amplitude ID. Amplitude derives this from the User ID Count and Device ID Count. |
| Events | Custom interactions or actions tracked on a website or app. | Custom Events |
| Conversion Rate | The percentage of visitors who complete a specified action. | Conversion (tracked as a specific event). Build a [Funnel](https://amplitude.com/docs/analytics/charts/funnel-analysis/funnel-analysis-get-the-most), which is a series of steps a user takes as part of the experience. |
| Bounce Rate | Percentage of single-page sessions or visits. | Bounce Rate [session metric](https://amplitude.com/docs/analytics/charts/data-tables/data-tables-use-session-metrics). |
| Revenue / Transactions | The total revenue generated or total number of transactions. | Custom events for transactions and revenue. |
| Conversion funnel metrics | Metrics related to user progression through a defined conversion funnel. | [Funnel Analysis](https://amplitude.com/docs/analytics/charts/funnel-analysis/funnel-analysis-build) |
| Segmentation | The ability to segment data based on various criteria. | [Event Segmentation](https://amplitude.com/docs/analytics/charts/event-segmentation/event-segmentation-build) and User Properties. |
| Custom Variables (eVars and Props) | Custom variables used for segmentation and reporting. | Event Properties and User Properties. |
## Align on your top metrics and business use cases
Aligning on your top business use cases makes it easier for your users to find useful reports and reduces future maintenance costs.
Before you migrate data, ensure all stakeholders and team members agree on what they want to get from the data. Consider the following:
### Top reports and analysis workspaces
To identify the analysis workspaces you use most, use external tools that read your Adobe configuration and provide a report. For example, a third-party [Component Editor](https://docs.datacroft.de/main-functions/the-component-editor-tab) can return workspace use statistics that show which workspaces and projects are most active.
### Use cases and critical metrics to focus on
Work with your top Adobe users and champions to confirm which key reports and KPIs they want to query in Amplitude. Capturing their use cases lets you define the data they need in Amplitude and focus on what matters most. These users build the reports and queries others use, so enabling them as change agents benefits your migration.
For more information, refer to Amplitude's [industry-specific best practice guides](https://amplitude.com/docs/data/data-planning-playbook) for sample use cases and questions.
## Map your Adobe variables to the Amplitude schema
When you map variables from Adobe Analytics to Amplitude, align the terminology and concepts used in each platform. The following table provides a general guide. The mapping may not be one-to-one, and each platform may collect and report data differently. Specific variable configuration may vary based on the complexity of your analytics implementation.
| Adobe Analytics | Amplitude Analytics | Notes |
| ------------------------------- | ------------------------------------------------------- | --------------------------------------------------------------------------------------------------------------------------------------------------------------------------------------------------------------------------------------------------------------------------------------------------------------------------------------------------------------------------------------------------------------------------------------------- |
| Page Views | Event: PageView | If you use Amplitude's Browser SDK, you can track Page Views with [default event tracking](https://amplitude.com/docs/sdks/analytics/browser/browser-sdk-2#autocapture). For users who want a more strategic taxonomy, Amplitude recommends that you identify the correct level of abstraction based on the page hierarchy and site map. |
| Success/Custom Events | Event | Success Events map to Amplitude Events. [Custom Events](https://help.amplitude.com/hc/en-us/articles/16805886899483-Custom-events) in Amplitude are different from Custom Events in Adobe. |
| Counter Success Event | Event | |
| Currency Success Event | Event | Currency and Numeric Success Events often map to special numeric and currency Event Properties in Amplitude. When you send Revenue/Purchase events to Amplitude, track specific revenue event properties prepended with a $. These event properties relate to the Purchase event. For more information, refer to [Track Revenue](https://amplitude.com/docs/data/sources/instrument-track-revenue). |
| Numeric Success Event | Event Property | Currency and Numeric Success Events often map to special numeric and currency Event Properties in Amplitude. When you send Revenue/Purchase events to Amplitude, track specific revenue event properties prepended with a $. These event properties relate to the Purchase event. For more information, refer to [Track Revenue](https://amplitude.com/docs/data/sources/instrument-track-revenue). |
| eVars (Conversion Variables) | Event Properties or User Properties | You can send eVars as either User or Event Properties, depending on the use case. To choose, determine whether the Adobe data variable relates to the user or to events the user performs, and consider how often the values change. User property values persist to subsequent events like eVars, while event property values don't. |
| Props (Traffic Variables) | Event Properties | |
| Visit | [Session](https://amplitude.com/docs/data/sources/instrument-track-sessions) | |
| Visitor ID | User ID | |
| Visitor (Cross-Device Tracking) | Amplitude ID | Amplitude ID is an ID that's used to identify a [particular user](https://amplitude.com/docs/data/sources/instrument-track-unique-users) across multiple User and/or Device IDs |
| Conversion Variables | Event Properties, Funnels | |
| Segments | Cohorts, Event Segmentation | |
| Instances | Count | |
| Unique Visitors | User ID Count | |
| Pathing | Funnel Analysis, Journeys | |
| Time Parting | Time-based Analysis, Custom Session Definition | |
After you understand how Amplitude collects data, the next step is to map your current Adobe Analytics variables to Amplitude variables. Use a standard spreadsheet. Most Adobe Analytics customers have a Solution Design Reference (SDR) that lists all Success Events, eVars, and sProps. The SDR spreadsheet can map existing Adobe Analytics variables to Amplitude variables.
To complete this exercise, add an extra column to each SDR tab and add the Amplitude event or property next to each existing Adobe Analytics variable you want to keep. Adobe Analytics Success Events map to Amplitude properties, and Adobe Analytics eVars and sProps also map to Amplitude properties.
As you map each Amplitude property in the spreadsheet, decide whether the property is an Event Property or a User Property.
## Track real-time data with Amplitude
After you translate your Adobe schema into Amplitude's required data structure, create a [tracking plan](https://amplitude.com/docs/data/create-tracking-plan) document that outlines the events and properties to track, why you track them, and where you track them.
To create your Tracking Plan, go to the *Data* tab in your organization. If you instrument with Amplitude SDKs, Amplitude recommends the [Ampli Wrapper](https://amplitude.com/docs/sdks/ampli), a lightweight wrapper for the Amplitude SDK that provides type safety, supports linting, and enables features like input validation. The Ampli CLI works with the Ampli wrapper to bring a tracking library into your project.
## Select the data source and implementation method
After you decide which data elements to collect in Amplitude and create your Tracking Plan, set up your Source and begin sending data into Amplitude.
Data collection is one of the most critical steps in any analytics program. Digital analytics products must consistently and accurately collect data as customers interact with digital properties. Most organizations have built a data collection layer that pushes data elements from websites and mobile apps to digital analytics products. An intermediary often sits between the data layer and the digital analytics product to map the raw data elements into data variables.
This intermediary could be a Software Development Kit (SDK), JavaScript code, an Application Programming Interface (API), a Customer Data Platform (CDP), or a tag management system. Your organization likely has data collection tools in place for your existing Adobe Analytics implementation. You can often reuse those tools to send data to Amplitude.
Amplitude provides many [sources](https://amplitude.com/docs/data/source-catalog) to help you collect and send data.
### Client-side sources
Use client-side sources in apps that users run on their own devices, such as mobile, web browser, and desktop apps. Code runs on the user's device.
Amplitude's client-side sources include these SDKs:
- Web: Browser, Marketing Analytics Browser, React Native
- Mobile: Android, iOS, Unity Plugin, Flutter, React Native
- Game engine: Unity Plugin, Unreal
### Server-side sources
Use server-side sources in secure, multi-user environments like web servers and services you run on your own servers. Code runs on the server.
Amplitude's server-side sources include these SDKs and APIs:
- [HTTP API](https://amplitude.com/docs/apis/analytics/http-v2)
- [Node.js SDK](https://amplitude.com/docs/sdks/analytics/node/node-js-sdk)
- [Go SDK](https://amplitude.com/docs/sdks/analytics/go/go-sdk)
- [Python SDK](https://amplitude.com/docs/sdks/analytics/python/python-sdk)
- [Java SDK](https://amplitude.com/docs/sdks/analytics/java/jre-java-sdk)
### Third-party sources
For web-based data collection, you may have a data layer that works with a tag management system. Popular tag management systems used by Adobe Analytics users include Adobe Launch, Tealium, and Google Tag Manager.
Amplitude has pre-built integrations with these tag management systems. These integrations let you reuse your organization's existing data layer work to send data to Amplitude. Update existing tag management system rules to send data to Amplitude instead of Adobe Analytics.
#### Adobe Launch
If your organization uses Adobe Launch (Adobe's tag management system) to populate Adobe Analytics data, you can use the Amplitude [Adobe Launch extension](https://exchange.adobe.com/apps/ec/109447) to send data to Amplitude. The extension is a wrapper for the Amplitude JavaScript SDK that lets your organization reuse the existing Adobe Launch data layer to send data to Amplitude.
{% callout type="note" heading="Adobe Launch availability" %}
Adobe provides Adobe Launch free for Adobe clients, but if you remove all Adobe products, you may lose access to Adobe Launch. The Amplitude Adobe Launch extension is a low-effort way to try Amplitude. If your organization replaces Adobe Analytics, you may need to switch to another tag management system later.
{% /callout %}
#### Tealium
Amplitude integrates with Tealium IQ, Tealium's enterprise tag management service.
Tealium IQ is a universal JavaScript library that creates a universal data object (UDO) for all elements of a page. Tealium sends this data to the data layer first, then you can forward it to third-party vendors, including Amplitude.
You can integrate Tealium iQ with your website in two ways: use Tealium's tag manager or their JavaScript library. For setup instructions, refer to [Integrate Tealium with Amplitude](https://amplitude.com/docs/data/source-catalog/tealium).
#### Google Tag Manager
Amplitude provides [Analytics Google Tag Manager](https://amplitude.com/docs/data/source-catalog/google-tag-manager) templates that collect data and let developers set up event tracking in their applications. These pre-configured templates streamline tracking tag deployment and reduce the time needed to set up event tracking.
#### Segment
Amplitude offers two methods to integrate with Segment:
- Install Amplitude's SDKs and send data directly to Amplitude through a client-side bundled integration.
- Set up a Segment destination and connect it with a Segment source.
For more information, refer to [Migrating from Segment to Amplitude](https://amplitude.com/docs/migration/migrate-from-segment).
#### mParticle
For more information, refer to [mParticle's integration with Amplitude documentation](http://docs.mparticle.com/integrations/amplitude/event/).
## Send data downstream to destinations
Use [Amplitude Destinations](https://amplitude.com/docs/data/destination-catalog) to send your data to third-party platforms. Destinations let you share data generated in Amplitude with other tools and stakeholders.
## Backfill historical data
When you migrate from Adobe Analytics, Amplitude recommends that you track only new data going forward.
If you need to send historical Adobe data, Amplitude recommends the following:
- Determine whether historical data is critical to answer your key business questions and metrics. Confirm the source where you store historical data after you sunset Adobe Analytics. If possible, export the data to a warehouse rather than to Amplitude first.
- Key identifiers, data structures, and user definitions can differ between Adobe Analytics and Amplitude. Because Adobe unique identifiers are complex, align on the logic for the main identifier for your unique visitors. Data model differences can cause expected discrepancies on certain metrics, so align on an acceptable percentage of discrepancies.
- If you need to analyze historical data, confirm the specific events and properties you consider critical. Migrating the full historical dataset takes considerable time, so rank the events and properties your users are most likely to query in Amplitude.
- To prevent identity management issues caused by data model differences, backfill historical data into separate projects. If the data exists in a separate project, you may not be able to analyze trends across certain time periods.
- When historical data is essential, Amplitude recommends limiting backfill to two years of data, with the cutoff usually set to the last month before the full dataset flows into Amplitude. For example, if you plan to start tracking data in your Production project on June 1, your backfilled dataset should end no later than May 31.
Refer to the [Data Backfill Guide](https://amplitude.com/docs/data/data-backfill) for more instructions on backfilling data into Amplitude using the [Batch Event Upload API](https://amplitude.com/docs/apis/analytics/batch-event-upload).
### Migrate historical data to Amplitude
To migrate historical data from Adobe to Amplitude:
1. Export your historical data to your data warehouse so you have a record of your Adobe Analytics data. After export, transform the data warehouse tables into the event and property models that Amplitude expects.
1. After your historical data is in a warehouse, use Amplitude's [Data Warehouse sources](https://amplitude.com/docs/data/source-catalog) or the [Batch Event Upload API](https://amplitude.com/docs/apis/analytics/batch-event-upload) to import the reformatted data into Amplitude. Refer to the [Data Backfill Guide](https://amplitude.com/docs/data/data-backfill) for detailed instructions on backfilling data using the Batch Event Upload API.
2. If your historical data is in an Amazon S3 bucket, use Amplitude's [Amazon S3 import](https://amplitude.com/docs/data/source-catalog/amazon-s3) to backfill large amounts of data.
2. If your historical data is in a CDP, check whether the CDP has a historical import feature. For example, Segment's Replay feature can backfill historical data if it's part of your organization's plan.
3. If you need to migrate data directly from Adobe Analytics through Adobe's [Data Feeds](https://experienceleague.adobe.com/docs/analytics/export/ftp-and-sftp/set-up-ftp-accounts/ftp-datafeeds.html?lang=en) feature, contact your Amplitude representative.
## Verify your data collection
After you set up your Source and complete instrumentation, verify that data is flowing into Amplitude and validate its quality. Follow these best practices as you send data to Amplitude:
- Always test your instrumentation: Amplitude recommends a testing project for every production project in your organization. A testing project gives you a reliable way to test instrumentation before you send production data to Amplitude.
- Amplitude can't retroactively change historical data: If your instrumentation is wrong, you can't clean up the data you collect later. Follow the steps below to QA your event data in Amplitude.
Data validation is a critical step in instrumentation. Amplitude lets you validate event data with the following tools:
- [Ingestion Debugger](https://amplitude.com/docs/analytics/debug-analytics#ingestion-debugger)
- [User Lookup](https://amplitude.com/docs/analytics/debug-analytics#user-lookup)
- [Event Explorer Chrome extension](https://amplitude.com/docs/analytics/debug-analytics#instrumentation-explorer)
### Ingestion debugger
Use the Ingestion Debugger in Amplitude to check requests, event and identify counts, and throttled users or devices:
1. Log in to Amplitude.
2. Select *Data* in the top nav bar, then select *Source* from the left nav bar.
3. Navigate to the *Ingestion Debugger* tab.
The Ingestion Debugger has three charts that show successful requests, event and identify counts, and error requests for the endpoints you specify. You can specify a time range of either one hour or one week.
Below the Ingestion Debugger is the list of throttled users and devices, including users and device IDs throttled in the last 30 minutes, and a list of silenced device IDs.
### User lookup
After you instrument your events, manually send some of those events from your own device. Then follow these steps:
1. Navigate to the *Users & Sessions* tab in the top nav bar of Amplitude.
2. Navigate to the *User* tab to view user-level details rather than account-level details.
3. Search by user ID, device ID, Amplitude ID, or user property values.
After you find your user profile, scroll down to the [Event Stream](https://amplitude.com/docs/analytics/user-data-lookup#activity) section. The event stream displays a user's full event history, grouped by session. The most recent activity appears at the top, and events populate the stream in ten seconds to one minute.
When you select an event, User Lookup shows detailed information about that event, including the user property and event property values at the time of the event.
Because the event stream updates in real time, you can use it to confirm Amplitude captures new events correctly, or to troubleshoot instrumentation errors. For example, if you trigger an event one time but the event stream consistently displays two instances, the instrumentation may have an error.
Select *Raw* to view the raw event data in JSON format.
### Event explorer
The [Amplitude Event Explorer](https://chrome.google.com/webstore/detail/amplitude-event-explorer/acehfjhnmhbmgkedjmjlobpgdicnhkbp) is a Google Chrome extension that helps you examine and debug your Amplitude Browser SDK instrumentation as you interact with your product. The extension captures each Amplitude event you trigger and displays it in the extension popup.
The extension supports Browser SDK and device-mode/client-side CDP/tag manager implementations.
In the Event Explorer, the *Events* tab shows detailed insights into the parameters of each event you trigger on your website, including `user_id`, `device_id`, `event_properties`, and `user_properties`.
## Migrate users and replicate reports
After production data flows into the Amplitude project, create accounts for users and begin replicating reports and dashboards.
To create Amplitude users, reference the Adobe Analytics user logs to identify which users most often accessed Adobe Analytics. You can create these users in your organization's settings in Amplitude.
If essential reports or dashboards exist in Adobe Analytics, replicate them in Amplitude and share them with the same users who had access in Adobe Analytics. The third-party [Component Manager](https://docs.datacroft.de/) tool can extract this information. The tool also shows popular Adobe Analytics segments and Calculated Metrics that you may want to replicate in Amplitude.
The following charts are the ones users most often replicate in Amplitude:
- [Data Tables](https://amplitude.com/docs/analytics/charts/data-tables/data-tables-multi-dimensional-analysis): Most like Adobe Analysis Workspace. Supports multi-dimensional analysis with metrics, events, and properties.
- [Funnel Chart](https://amplitude.com/docs/analytics/charts/funnel-analysis/funnel-analysis-get-the-most): Most like Adobe's Funnel Visualization Report. Measures conversion rates.
- [Journeys](https://amplitude.com/docs/analytics/charts/journeys/journeys-understand-paths): Analyzes the customer journey and common paths users take. Most like Multi-Channel Funnel reports.
- [User Sessions](https://amplitude.com/docs/analytics/charts/user-sessions/marketing-metrics-recipes): Analyzes session data ("Visits").
- [Metrics](https://amplitude.com/docs/analytics/charts/data-tables/data-tables-create-metric): Define and save reusable analysis objects and custom metrics.
================================================================================
# Migrate From Mixpanel
URL: https://amplitude.com/docs/migration/migrate-from-mixpanel
================================================================================
# Migrate From Mixpanel
The Amplitude Professional Services team compiled this guide to help you migrate from Mixpanel and start getting insights quickly.
{% callout type="tip" heading="Customer case study" %}
Learn how Whisk migrated from Mixpanel to Amplitude on the [Amplitude Blog](https://amplitude.com/blog/whisk-product-growth).
{% /callout %}
## Import Mixpanel historical data
Amplitude offers two options to migrate historical data from Mixpanel:
* The [Mixpanel import tool](#mixpanel-import-tool): Best for sending historical event data quickly.
* The [Batch Event Upload API](#amplitude-batch-event-upload-api): Best for sending historical data, including events and user profile properties, at scale.
### Mixpanel import tool
With your Mixpanel project's API key or service account credentials, this tool uses [Mixpanel's Export API](https://developer.mixpanel.com/reference/raw-event-export) to export event data from Mixpanel and import it to your Amplitude project.
#### Limitations
* The tool processes about 160,000 events per batch.
* The tool doesn't support User Profile imports. To import user profile information, use one of the following options:
* Export your data from Mixpanel with the Mixpanel [Export](https://developer.mixpanel.com/reference/raw-event-export) and [Engage](https://developer.mixpanel.com/reference/engage-query) APIs, and import it to Amplitude with the [Batch Event Upload API](https://amplitude.com/docs/apis/analytics/batch-event-upload).
* Contact Amplitude Support or your Amplitude account manager to get custom services from Amplitude's Professional Services team.
#### Troubleshooting
If the import tool responds with an authentication error:
* Confirm you provide the correct authentication to the Mixpanel import tool.
* If you use your Mixpanel project's API key, reference the correct project. Each project in Mixpanel has its own API key.
* If you use a [Mixpanel service account](https://developer.mixpanel.com/reference/service-accounts), enter the credentials as follows:
| Service account value | Amplitude field |
| -------------------- | ------------------------------------ |
| Username | The username field in the import tool |
| Password | The API Key field |
| Project ID | The Project ID field |
* If you don't have the username and password for your Mixpanel project's service account, create a new service account for your project and copy the values.
* Confirm your Mixpanel service account has permission to access the information you need. Test your credentials with [Mixpanel's Download Data page](https://developer.mixpanel.com/reference/raw-event-export). If the page responds with a `200` status, your service account has the necessary permissions.
If the import tool doesn't complete or responds with a generic error:
* The data set may be too large to process. Try again with a narrower time range, aiming for no more than ~160,000 events per batch.
If the tool imports fewer transactions than expected:
* Amplitude detects and excludes duplicate events. If your data contains many duplicates, Amplitude imports fewer events than expected.
* Some Mixpanel events may not be compatible with Amplitude events because of missing information. If your Mixpanel instrumentation doesn't capture fields like `name`, `date`, or `device ID`, Amplitude may not import those events.
### Amplitude Batch Event Upload API
Export your data from Mixpanel through the [Mixpanel API](https://developer.mixpanel.com/reference/raw-data-export-api) and upload it to Amplitude with the [Batch Event Upload API](https://amplitude.com/docs/apis/analytics/batch-event-upload). If you host your data in another external source, you can also use the batch endpoint to upload data to Amplitude.
### Professional Services
To get custom services from the Amplitude Professional Services team, contact your Amplitude account manager.
## Plan new Amplitude tracking from Mixpanel
### Set product goals
Before you start implementation, confirm that stakeholders and team members agree on what you want to get from the data and which use cases to focus on.
#### Common use cases by industry
{% tabs tabs="B2B, Fintech, E-commerce, Streaming media" %}
{% tab name="B2B" %}
**Goal**: Understand product engagement.
**Key points:**
* See how your users convert through critical funnels: acquisition (free trial, sales, partner, POC), onboarding, activation, workflow, cross-sell/upsell funnels.
* Target the right customers at the right time to move them through a critical funnel.
* Find patterns in the way your customers move through key milestones (acquisition, onboarding, activation, renewal).
* Understand different customer segments’ use and adoption to define key personas based on use cases and needs.
* Optimize your product experience to target different customers personas needs and make them more successful.
{% /tab %}
{% tab name="Fintech" %}
**Goal**: Understand what makes your users purchase.
**Key questions:**
* What's the efficiency of marketing channels?
* How many users complete sign-up and money transfer in one session?
* How do users engage with product features?
* What impacts user retention?
* What's the % of users that have used accounts with > 2 currencies in the last 30 days?
* How much revenue do we get from a customer?
* What impacts referrals?
{% /tab %}
{% tab name="E-commerce" %}
**Goal:** Understand revenue and conversion drivers.
**Key questions:**
* How often do users look at products?
* What's our purchase conversion rate?
* And what's the falloff in each step? (rates of- click to category page, click to product, add to cart, view cart, start checkout, order conversion)
* What features do users interact with that lead to conversions?
* What are the drivers that lead from user registration to first purchase?
* How many purchases include more than one item?
* Does the ATC (add to cart) decrease by user or device type?
{% /tab %}
{% tab name="Streaming media" %}
**Goal:** Understand the acquisition and subscription drivers of your users' engagement with your product.
**Key questions:**
* What's the total length of time from content consumption in the Free Trial for churned trials vs. subscription converters?
* What activities are common between users who convert vs don't convert after the Free Trial expires?
* How do users interact with our site and how do they consume content?
* What is the percentage of content consumed per genre?
* What brings users back?
{% /tab %}
{% /tabs %}
### Design and instrument a data taxonomy
* Review the [Mixpanel to Amplitude Taxonomy workbook](https://docs.google.com/spreadsheets/d/1lsZa6uZmcUmJdq-_sr5JawckMPiiQDCCzl_ytSYccNg/edit#gid434510064), built from common use cases of Amplitude customers who migrated from Mixpanel.
* For broader taxonomy guidance, refer to the [Data Taxonomy Playbook](https://amplitude.com/docs/data/data-planning-playbook).
#### Choose an instrumentation method
You can send data to Amplitude client-side, server-side, or through a third party. Use the following options based on where you track events:
* Client-side event tracking: use the [Amplitude SDK Catalog](https://amplitude.com/docs/sdks/analytics). Reference the Amplitude mapping to replace your existing instrumentation.
* Server-side event tracking: use the [Amplitude HTTP API](https://amplitude.com/docs/apis/analytics/http-v2).
#### Map Mixpanel methods to Amplitude methods
The mapping between Mixpanel and Amplitude tracking and identification methods depends on the type of data.
##### Event tracking
* Mixpanel tracks events with the `'mixpanel.track()'` method, which takes an event name and a set of properties.
* Amplitude tracks events with the `'amplitude.getinstance().logEvent()'` method, which takes an event name and a set of properties as a JSON object.
##### Property tracking
Mixpanel super properties attach to all subsequent events. Amplitude user properties function similarly: after you set them, they attach to all subsequent events that Amplitude ingests.
* In Mixpanel, set super properties with the `'mixpanel.register()'` method.
* In Amplitude, update user properties with the `'amplitude.identify()'` method.
##### User identification
* Mixpanel identifies a user with the `'mixpanel.identify()'` method, using a combination of `distinct_id` (a randomly generated identifier on a specific platform) and `user_id` (set by the instrumenting team).
* Amplitude identifies a user with the `'amplitude.identify()'` method, using a combination of `device_id` (a randomly generated identifier on a specific platform) and `user_id` (set by the instrumenting team).
For more on how Amplitude resolves user identities, refer to [Track unique users](https://amplitude.com/docs/data/sources/instrument-track-unique-users).
## Data privacy considerations
Consider the following features and areas when managing your customer data:
* [Time to Live (TTL)](https://amplitude.com/docs/data/time-to-live): Amplitude feature that controls how long event data lives in your Amplitude instance.
* [How to manage Opt-Outs](https://amplitude.com/docs/sdks/analytics/browser/browser-sdk-2#opt-users-out-of-tracking): SDK settings that let your website visitors disable activity tracking.
* [IP Address](https://amplitude.com/docs/apis/analytics/batch-event-upload): Amplitude captures IP address and location-based details by default with client-side tracking. To disable this tracking, refer to [Browser SDK | Optional Tracking](https://amplitude.com/docs/sdks/analytics/browser/browser-sdk-2#optional-tracking).
* [User Privacy API](https://amplitude.com/docs/apis/analytics/user-privacy): API to delete all data for a set of known Amplitude IDs or User IDs.
* [Amplitude's Stance on Security & Privacy](https://amplitude.com/amplitude-security-and-privacy)
## GDPR compliance
Amplitude is fully GDPR compliant. For more information about compliance, refer to [Security and Privacy](https://amplitude.com/amplitude-security-and-privacy).
Amplitude maintains a [user privacy API](https://amplitude.com/docs/apis/analytics/user-privacy) that lets you service end user data deletion requests.
## Feedback or questions
To submit feedback or questions about this implementation guide, use [this form](https://forms.gle/EMh9JeNs1iNCQzx67).
================================================================================
# Migrate From mParticle
URL: https://amplitude.com/docs/migration/migrate-from-mparticle
================================================================================
# Migrate From mParticle
Use Amplitude for both your [Analytics](https://amplitude.com/amplitude-analytics) and [CDP](https://amplitude.com/customer-data-platform) needs. This document covers the steps to:
1. Migrate your Source and Destination configuration.
2. Update SDK implementation to send data to Amplitude.
3. Validate the migration is successful.
The following table maps mParticle offerings to their Amplitude equivalents.
| mParticle | Amplitude |
|-----------------------------------------------------------------------------------| ----------- |
| [Connections](https://docs.mparticle.com/guides/platform-guide/connections/) | [Sources](https://amplitude.com/docs/data/source-catalog) & [Destinations](https://amplitude.com/docs/data/destination-catalog/) |
| [Audiences](https://docs.mparticle.com/guides/platform-guide/audiences/overview/) | [Audiences](https://help.amplitude.com/hc/en-us/sections/360011146031-Amplitude-Audiences) |
| | [Data Management](https://help.amplitude.com/hc/en-us/categories/5078631395227-Amplitude-CDP) |
{% callout type="info" heading="Recommended best practice" %}
Follow a strict release process and [configure multiple environments](https://amplitude.com/docs/data/amplitude-data-settings). Validate changes within each environment before deploying.
{% /callout %}
## Add a source
To add a [new source](https://amplitude.com/docs/data/source-catalog):
1. From Data, click **Sources** in the Connections section.
2. Click **Add Source**.
3. Browse or search for the source you want to add.
4. Follow the on-screen prompts.
For detailed instructions, refer to the documentation for the [source](https://amplitude.com/docs/data/source-catalog) you want to add.
## Update SDK implementation
Both mParticle and Amplitude SDKs capture first-party data by tracking user interactions. Aside from syntax differences, they work similarly. The following table maps concepts between mParticle and Amplitude.
| mParticle | Amplitude | Notes |
|-----------|-----------|--------------------------------------------|
| app_key | api_key | Unique key to validate source of the data. |
| Workspace | Project | [Projects](https://amplitude.com/docs/admin/account-management/manage-orgs-projects) allow you to organize your data. |
| User | User | User who is performing action. |
| Identify | Identify | Identify updates properties/attributes of the user.|
| Event | Event | Events track the action user is performing.|
| Screen | Event | Create an Event to track Screen views.|
| Page | Event | Create an Event to track Page views.|
| | Group | A Group is a collection of users. In Amplitude, one user can belong to multiple groups. Each group can have properties available to query or forward on actions performed by any user in the group.|
| Kits | Plugins | Plugins extend Amplitude by running custom code on every event.|
{% tabs tabs="Browser, iOS, Android" %}
{% tab name="Browser" %}
Documentation for [Browser SDK 2](https://amplitude.com/docs/sdks/analytics/browser/browser-sdk-2).
### Identify
#### mParticle
```typescript
var identityRequest = {
userIdentities: { email: 'updated-email@example.com' }
}
mParticle.Identity.modify(identityRequest, identityCallback);
```
#### Amplitude
```typescript
setUserId('12091906-01011992');
identify(
Identify()
.set('email', 'updated-email@example.com')
);
```
### Track
#### mParticle
```typescript
mParticle.logEvent('Article Completed',
mParticle.EventType.EVENT-TYPE,
{
'title':'How to Create a Tracking Plan',
'course':'Intro to Analytics'}
);
```
#### Amplitude
```typescript
track('Article Completed', {
title: 'How to Create a Tracking Plan',
course: 'Intro to Analytics',
});
```
### Group
#### Amplitude
Assign user to a group:
```typescript
amplitude.setGroup('Working Group', 'UNIVAC')
```
Update properties of a group:
```typescript
groupIdentify(
'Working Group',
'UNIVAC' ,
new Identify()
.set('principles', ['Eckert', 'Mauchly']);
.set('site', 'Eckert–Mauchly Computer Corporation');
.set('statedGoals', 'Develop the first commercial computer');
.set('industry', 'Technology')
);
```
{% /tab %}
{% tab name="iOS" %}
Documentation for [iOS Swift SDK](https://amplitude.com/docs/sdks/analytics/ios/ios-swift-sdk).
### Identify
#### mParticle
```swift
currentUser?.setUserAttribute("top_region", value: "Europe")
```
#### Amplitude
```swift
Amplitude.instance().setUserId("abc")
Amplitude.instance().identify(
AMPIdentify()
.set("top_region", value: "Europe")
)
```
### Track
#### mParticle
```swift
if let event = MPEvent(name: "Video Watched", type: MPEventType.navigation) {
event.customAttributes = ["category": "Destination Intro", "title": "Paris"]
MParticle.sharedInstance().logEvent(event)
}
```
#### Amplitude
```swift
Amplitude.instance().logEvent("Video Watched", withEventProperties: ["category": "Destination Intro", "title": "Paris"] )
```
### Group
#### Amplitude
Assign user to a group:
```swift
Amplitude.instance().setGroup("orgName", groupName:NSString(string:"xyz"))
```
Update properties of a group:
```swift
Amplitude.instance().groupIdentifyWithGroupType(
"orgName",
groupName:NSString(string:"xyz"),
groupIdentify:AMPIdentify().set("plan", value: "enterprise")
)
```
{% /tab %}
{% tab name="Android" %}
Documentation for [Android Kotlin SDK](https://amplitude.com/docs/sdks/analytics/android/android-kotlin-sdk).
### Identify
#### mParticle
```kotlin
IdentityApiRequest modifyRequest = IdentityApiRequest.withEmptyUser()
.email("updated-email@example.com")
.build()
MParticle.getInstance().Identity().modify(modifyRequest)
```
#### Amplitude
```kotlin
amplitude.setUserId("abc")
amplitude.identify(Identify().set("email", "updated-email@example.com"))
```
### Track
#### mParticle
```kotlin
val customAttributes: MutableMap = HashMap()
customAttributes["name"] = "Moto 360"
val event = MPEvent.Builder("Product Viewed", MParticle.EventType.Navigation)
.customAttributes(customAttributes)
.build()
MParticle.getInstance()?.logEvent(event)
```
#### Amplitude
```kotlin
amplitude.track(
"Product Viewed",
mutableMapOf("name" to "Moto 360")
)
```
### Group
#### Amplitude
Assign user to a group:
```kotlin
amplitude.setGroup("orgName", "xyz");
```
Update properties of a group:
```kotlin
amplitude.groupIdentify("orgName", "xyz", Identify().set("plan", "enterprise"))
```
{% /tab %}
{% /tabs %}
For all other SDKs, refer to the relevant [SDK documentation](https://amplitude.com/docs/sdks/analytics).
## Validate events
Data validation is a critical step in the instrumentation process. Validate your event data using Amplitude's debugging [tools](https://amplitude.com/docs/analytics/debug-analytics).
## Add a destination
To add a [new destination](https://amplitude.com/docs/data/destination-catalog):
1. From Data, click **Destinations** in the Connections section.
2. Click **Add Destination**.
3. Browse or search for the destination you want to add.
4. Follow the on-screen prompts.
For detailed instructions, refer to the documentation for the [destination](https://amplitude.com/docs/data/destination-catalog) you want to add.
## Migration checklist
Validate the migration to minimize impact on downstream data consumers.
- [x] Added all sources to Amplitude
- [x] Migrated existing tracking code to Amplitude SDKs
- [x] Validated events are flowing in to Amplitude correctly
- [x] Added all destinations to Amplitude
- [x] Validated data is flowing into destinations correctly
- [x] Validated downstream consumers aren't affected (for example, BI, Mktg, ML, Ops)
## Frequently asked questions
{% accordion title="How long does it take to migrate?" %}
Migration time depends on how you implemented your CDP. However, generally, plan a minimum of two month to complete the migration. Updating your taxonomy and tracking plan can require more upfront planning.
{% /accordion %}
{% accordion title="What if I don't see an integration that I need?" %}
Amplitude regularly adds new integrations. Add a request in the product or ask your CSM for a timeline.
{% /accordion %}
{% accordion title="What if I have an existing CDP contract?" %}
Contact your CSM or AE to discuss available options.
{% /accordion %}
================================================================================
# Migrate From Segment
URL: https://amplitude.com/docs/migration/migrate-from-segment
================================================================================
# Migrate From Segment
Amplitude handles both [Analytics](https://amplitude.com/amplitude-analytics) and [CDP](https://amplitude.com/customer-data-platform) needs. This document covers how to:
1. Migrate your source and destination configuration.
2. Update your SDK implementation to send data to Amplitude.
3. Validate the migration.
The following table maps Segment offerings to their Amplitude equivalents.
| Segment | Amplitude |
| ------------------------------------------------------- | ------------------------------------------------------------------------------------- |
| [Connections](https://segment.com/product/connections/) | [Sources](https://amplitude.com/docs/data/source-catalog) & [Destinations](https://amplitude.com/docs/data/destination-catalog) |
| [Profiles](https://segment.com/product/profiles/) | [Predictive analytics](https://amplitude.com/docs/analytics/predictive/predictive-analytics) |
| [Protocols](https://segment.com/product/protocols/) | [Data Management](https://amplitude.com/docs/data) |
{% callout type="info" heading="Recommended best practice" %}
Follow a strict release process and [configure multiple environments](https://amplitude.com/docs/data/amplitude-data-settings). Validate changes within each environment before deploying.
{% /callout %}
## Add a source
To add a [new source](https://amplitude.com/docs/data/source-catalog):
1. From Data, click **Sources** in the Connections section.
2. Click **Add Source**.
3. Browse or search for the source you want to add.
4. Follow the on-screen prompts.
For detailed instructions, refer to the documentation for the [source](https://amplitude.com/docs/data/source-catalog) you want to add.
## Update SDK implementation
Segment and Amplitude SDKs both capture first-party data by tracking user interactions, and they work similarly aside from syntax differences. The following table maps concepts between Segment and Amplitude.
| Segment | Amplitude | Notes |
| --------- | --------- | --------------------------------------------------------------------------------------------------------------------------------------------------------------------------------------------------- |
| write_key | api_key | Unique key that validates the source of the data. |
| Workspace | Project | [Projects](https://amplitude.com/docs/admin/account-management/manage-orgs-projects) organize your data. |
| User | User | The user performing the action. |
| Identify | Identify | Identify updates user properties. |
| Track | Event | An [event](https://amplitude.com/docs/apis/analytics/http-v2/) in Amplitude tracks an action a user performs. |
| Screen | Event | Create an event to track screen views. |
| Page | Event | Create an event to track page views. |
| Group | Group | A group is a collection of users. In Amplitude, one user can belong to multiple groups. Each group can have properties that you can query or forward when any user in the group performs an action. |
| Plugins | Plugins | Plugins extend Amplitude by running custom code on every event. |
{% tabs tabs="Browser, iOS, Android" %}
{% tab name="Browser" %}
Documentation for [Browser 2 SDK](https://amplitude.com/docs/sdks/analytics/browser/browser-sdk-2).
### Identify
#### Segment
```typescript
analytics.identify("12091906-01011992", {
name: "Grace Hopper",
email: "grace@usnavy.gov",
});
```
#### Amplitude
```typescript
setUserId("12091906-01011992");
identify(
Identify().set("name", "Grace Hopper").set("email", "grace@usnavy.gov"),
);
```
### Track
#### Segment
```typescript
analytics.track("Article Completed", {
title: "How to Create a Tracking Plan",
course: "Intro to Analytics",
});
```
#### Amplitude
```typescript
track("Article Completed", {
title: "How to Create a Tracking Plan",
course: "Intro to Analytics",
});
```
### Group
#### Segment
```typescript
analytics.group("UNIVAC Working Group", {
principles: ["Eckert", "Mauchly"],
site: "Eckert–Mauchly Computer Corporation",
statedGoals: "Develop the first commercial computer",
industry: "Technology",
});
```
#### Amplitude
Assign user to a group:
```typescript
amplitude.setGroup("Working Group", "UNIVAC");
```
Update properties of a group:
```typescript
groupIdentify(
'Working Group',
'UNIVAC' ,
new Identify()
.set('principles', ['Eckert', 'Mauchly']);
.set('site', 'Eckert–Mauchly Computer Corporation');
.set('statedGoals', 'Develop the first commercial computer');
.set('industry', 'Technology')
);
```
{% /tab %}
{% tab name="iOS" %}
Documentation for [iOS Swift SDK](https://amplitude.com/docs/sdks/analytics/ios/ios-swift-sdk).
### Identify
#### Segment
```swift
Analytics.shared().identify("abc", traits: ["email": "abc@domain.com"])
```
#### Amplitude
```swift
Amplitude.instance().setUserId("abc")
Amplitude.instance().identify(
AMPIdentify()
.set("email", value: "female")
.set("age",value: NSNumber(value: 20))
)
```
### Track
#### Segment
```swift
Analytics.shared().track("Button Clicked", properties: ["Hover Time": "100ms"])
```
#### Amplitude
```swift
Amplitude.instance().logEvent("Button Clicked", withEventProperties: ["Hover Time": "100ms"] )
```
#### Group
#### Segment
```swift
Analytics.shared().group("OrgName-xyz", traits: ["plan": "enterprise"])
```
#### Amplitude
Assign user to a group:
```swift
Amplitude.instance().setGroup("orgName", groupName:NSString(string:"xyz"))
```
Update properties of a group:
```swift
Amplitude.instance().groupIdentifyWithGroupType(
"orgName",
groupName:NSString(string:"xyz"),
groupIdentify:AMPIdentify().set("plan", value: "enterprise")
)
```
{% /tab %}
{% tab name="Android" %}
Documentation for [Android Kotlin SDK](https://amplitude.com/docs/sdks/analytics/android/android-kotlin-sdk).
### Identify
#### Segment
```kotlin
Analytics.with(context).identify("abc", Traits().putEmail("abc@domain.com"), null)
```
#### Amplitude
```kotlin
amplitude.setUserId("abc")
amplitude.identify(Identify().set("email", "abc@domain.com"))
```
### Track
#### Segment
```kotlin
Analytics.with(context).track("Product Viewed", Properties().putValue("name", "Moto 360"))
```
#### Amplitude
```kotlin
amplitude.track(
"Product Viewed",
mutableMapOf("name" to "Moto 360")
)
```
### Group
#### Segment
```kotlin
Analytics.with(context).group("abc", "orgName-xyz", Traits().putplan("enterprise"))
```
#### Amplitude
Assign user to a group:
```kotlin
amplitude.setGroup("orgName", "xyz");
```
Update properties of a group:
```kotlin
amplitude.groupIdentify("orgName", "xyz", Identify().set("plan", "enterprise"))
```
{% /tab %}
{% /tabs %}
For all other SDKs, refer to the relevant [SDK documentation](https://amplitude.com/docs/sdks/analytics).
## Validate events
Data validation is a critical step in instrumentation. Validate your event data using Amplitude's debugging [tools](https://amplitude.com/docs/analytics/debug-analytics).
## Add a destination
To add a [new destination](https://amplitude.com/docs/data/destination-catalog):
1. From Data, click **Destinations** in the Connections section.
2. Click **Add Destination**.
3. Browse or search for the destination you want to add.
4. Follow the on-screen prompts.
For detailed instructions, refer to the documentation for the [destination](https://amplitude.com/docs/data/destination-catalog) you want to add.
## Migration checklist
Validate the migration to minimize impact on downstream data consumers.
- [x] Added all sources to Amplitude
- [x] Migrated existing tracking code to Amplitude SDKs
- [x] Validated events are flowing in to Amplitude correctly
- [x] Added all destinations to Amplitude
- [x] Validated data is flowing into destinations correctly
- [x] Validated downstream consumers aren't affected (for example, BI, Mktg, ML, Ops)
## Frequently asked questions
{% accordion title="How long does it take to migrate?" %}
Migration time depends on how you implemented your CDP. Most teams should plan a few months to complete the migration. Updating your taxonomy and tracking plan can require more upfront planning.
{% /accordion %}
{% accordion title="What if I don't see an integration that I need?" %}
Amplitude regularly adds new integrations. Add a request in-product or ask your CSM for a timeline.
{% /accordion %}
{% accordion title="What if I have an existing CDP contract?" %}
Contact your CSM or AE to discuss available options.
{% /accordion %}
================================================================================
# Migrate from Google Analytics
URL: https://amplitude.com/docs/migration/migrate-from-google-analytics
================================================================================
# Migrate from Google Analytics
This guide describes the options for migrating from Google Analytics (GA4) to Amplitude. Migration requires adjusting your tracking implementation to align with Amplitude's event structure and capabilities.
Amplitude offers two migration methods:
1. A [low-code Google Analytics event forwarding plugin](#forward-events-from-google-analytics)
2. A [migration guide](#replace-google-analytics) that highlights the differences between Google Analytics and Amplitude tracking.
{% callout type="note" heading="Import historical GA4 data" %}
You can import your historical Google Analytics 4 data into Amplitude through BigQuery. For setup instructions, refer to the [Google Analytics 4 Import documentation](https://amplitude.com/docs/data/source-catalog/ga4).
{% /callout %}
## Forward events from Google Analytics
For less complex implementations, Amplitude offers a low-code migration tool: the Google Analytics Event Forwarder.
### How the Google Analytics events forwarder works
The forwarder is a plugin to the Amplitude Browser SDK. After you install the plugin on your application, the plugin listens for the events that Google Analytics (GA4) tracks. For each event sent to Google Analytics (GA4), the plugin sends a corresponding event to Amplitude.
### Initialize Amplitude with Google Analytics events forwarder
Add the Amplitude SDK with Google Analytics events forwarder snippet before your Google Tag snippet. Placement before the Google Tag snippet ensures that Amplitude can receive all events you collect with Google Analytics.
```
```
Replace `'YOUR_API_KEY'` with your Amplitude API key, which you can find in your Amplitude account.
The Google Tag appears on every page of your website, immediately after the `` element. The Google Tag for your account looks like the snippet below.
```html
```
After you add both the Google Analytics and Amplitude snippets, Google Analytics events appear in Amplitude without extra instrumentation.
Event names and properties forwarded from Google Analytics retain the naming convention set in Google Analytics. For example, if you store the `city` in a custom dimension in Google Analytics, that event property may appear as `ua_dimension_14` in Amplitude.
Amplitude also tracks the Measurement ID from Google Analytics to help you identify where an event originates.
For events that both Google Analytics and Amplitude track by default, like `page_view`, the plugin uses the Amplitude default to avoid duplication.
## Replace Google Analytics
For more customized implementations, replace Google Analytics with Amplitude and adjust your tracking so events track correctly with Amplitude.
### Initialize Amplitude
In your application's code, replace the Google Analytics (GA4) initialization script with the Amplitude initialization script.
Google Analytics script:
```html
```
Copy the Amplitude initialization script below, or refer to [GitHub](https://github.com/amplitude/Amplitude-TypeScript/tree/v1.x/packages/plugin-ga-events-forwarder-browser#1-import-amplitude-packages) for more installation options.
```
```
### Track events
Amplitude's tracking function requires different parameters than Google Analytics (GA4). Compare the tracking functions in the code snippets below.
#### Google Analytics (GA4)
```js
gtag('event', 'event_name', {
param1: 'value1',
param2: 'value2',
});
```
#### Amplitude
Refer to [Tracking an event](https://amplitude.com/docs/sdks/analytics/browser/browser-sdk-2#track-an-event) for more details.
```js
amplitude.track('event_name, {
param1: 'value1',
param2: 'value2',
})
```
### Set a user ID
#### Google Analytics (GA4)
```js
gtag('config', 'GA_MEASUREMENT_ID', {
user_id: 'USER_ID',
});
```
#### Amplitude
Refer to [Custom user ID](https://amplitude.com/docs/sdks/analytics/browser/browser-sdk-2#custom-user-identifier) for more details.
```js
amplitude.setUserId('USER_ID');
```
### Set user properties
#### Google Analytics (GA4)
```js
gtag('set', 'user_properties', {
property1: 'value1',
property2: 'value2',
});
```
#### Amplitude
Refer to [User properties](https://amplitude.com/docs/sdks/analytics/browser/browser-sdk-2#user-properties) for more details.
```js
amplitude.identify(
new amplitude.Identify()
.set('property1', 'value1')
.set('property2', 'value2'),
);
```
For more information, refer to the [Amplitude Browser SDK documentation](https://amplitude.com/docs/sdks/analytics/browser/browser-sdk-2).
================================================================================
# Data
URL: https://amplitude.com/docs/data
================================================================================
# Data
Send data into Amplitude, organize and clean it, and activate it across your downstream tools. Connect sources, resolve identities across devices, govern your taxonomy, and stream behavioral data to the rest of your stack.
{% outcomes heading="Explore Data" %}
{% outcome icon="Plug" title="Get every event into Amplitude" href="https://amplitude.com/docs/data/source-catalog" %}
Stream activity from SDKs, servers, warehouses, and pre-built sources so no behavior goes uncounted.
{% /outcome %}
{% outcome icon="Database" title="Activate insights in your stack" href="https://amplitude.com/docs/data/destination-catalog" %}
Send behavioral data and cohorts to the marketing, ad, and warehouse tools your team already uses.
{% /outcome %}
{% outcome icon="Users" title="See one user, not many" href="https://amplitude.com/docs/data/profiles" %}
Stitch warehouse profile data to behavioral events so each person is the same user across devices.
{% /outcome %}
{% outcome icon="ShieldCheck" title="Trust the data your team queries" href="https://amplitude.com/docs/data/create-tracking-plan" %}
Lock in a tracking plan, review changes, and keep events on-spec as your product evolves.
{% /outcome %}
{% outcome icon="Workflow" title="Fix data without redeploying" href="https://amplitude.com/docs/data/transformations" %}
Rename, redact, or reshape events on the way in instead of waiting on an instrumentation fix.
{% /outcome %}
{% outcome icon="ClipboardList" title="Add the context analysts need" href="https://amplitude.com/docs/data/lookup-tables" %}
Join reference data like plans, regions, or accounts to events so every chart has the full picture.
{% /outcome %}
{% /outcomes %}
## Plan and collect data
Start with an implementation plan that defines the events, users, and properties your team needs.
- [Plan your implementation](https://amplitude.com/docs/get-started/plan-your-implementation) to connect product questions to the events you track.
- [Create a tracking plan](https://amplitude.com/docs/data/create-tracking-plan) to document event names, properties, and ownership.
- [Choose client-side or server-side tracking](https://amplitude.com/docs/data/client-side-vs-server-side) to match your product architecture.
- [Use Autocapture](https://amplitude.com/docs/data/autocapture) to collect website interactions before you manually instrument every event.
## Govern and activate data
Keep your taxonomy healthy, then send trusted data to the teams and tools that need it.
- [Configure schema](https://amplitude.com/docs/data/configure-schema) to monitor event volume, property types, and unexpected changes.
- [Transform incoming events](https://amplitude.com/docs/data/transformations) to rename, redact, or reshape data after ingestion.
- [Manage data access controls](https://amplitude.com/docs/data/data-access-control) to limit access to sensitive events and properties.
- [Forward data to destinations](https://amplitude.com/docs/data/destination-catalog) to activate behavioral data in downstream tools.
{% academy-link
title="Get Started with Amplitude Data"
url="https://academy.amplitude.com/getting-started-with-amplitude-data"
description="Learn the fundamentals of Amplitude Data."
/%}
================================================================================
# Overview of Amplitude Data
URL: https://amplitude.com/docs/data/data-overview
================================================================================
# Overview of Amplitude Data
Amplitude Data governs the event taxonomy behind your Amplitude project. It defines events and properties in a shared plan, validates incoming data against that plan, and gives you the tools to clean, enrich, and monitor data after ingestion. Use it when multiple teams instrument the same product and you need one source of truth for what every event means.
## Planning and instrumentation
* Create a plan directly in Amplitude. Define your events, properties, and taxonomy standards directly in Amplitude. This information appears when you select events and properties. Amplitude Analytics monitors this information to make sure your incoming data matches your spec.
* Use the Ampli developer toolkit. Ampli uses your plan to generate a type-safe tracking library and lints code to ensure proper tracking of your events and properties.
Planning directly in Amplitude Data gives you an up-to-date plan your company can use instead of one-off spreadsheets or wiki pages that can quickly become outdated. Refer to the walkthrough of the [complete planning workflow](https://amplitude.com/docs/data/data-planning-workflow) for the process from start to finish.
## Data management
For data Amplitude has ingested:
* Improve data discoverability by enriching the metadata on your events and properties. Ensure your company has a shared definition and understanding of all your tracking.
* Clean up your data with tools to transform existing events and properties, drop incorrect data from your queries, and block or delete data you no longer want to collect.
* Enrich your data by using your existing events and properties to create new custom events, map existing properties to values with lookup properties, and generate new derived properties based on formulas.
* Monitor your data with observability, which monitors your incoming data and compares it to your plan in real time.
Amplitude also provides Data Assistant, which delivers intelligent recommendations and automation to make it faster to improve your data quality.
================================================================================
# Common Patterns
URL: https://amplitude.com/docs/data/common-patterns
================================================================================
# Common Patterns
Amplitude fits into many different data stacks. Most customers use one of four patterns:
1. Amplitude as the primary analytics destination.
2. Amplitude with a Customer Data Platform (CDP) such as Segment.
3. Amplitude with a data warehouse such as Snowflake, BigQuery, Redshift, or Databricks.
4. Amplitude with both a CDP and a data warehouse.
Across all four, Amplitude's web, mobile, and server SDKs give you a single way to collect events, power Session Replay, and stream that same data to the rest of your stack through Event Stream and exports. After you instrument your product, you rarely need to change application code when you add new destinations.
You can instrument Amplitude Session Replay in several ways. For the browser, use the Session Replay plugin for the Amplitude Browser SDK, a standalone Session Replay SDK, Google Tag Manager, or a Segment integration. For iOS, Android, and React Native, use plugins that sit on top of Amplitude's analytics SDKs, standalone Session Replay SDKs, or Segment-based options.
Instrumenting Session Replay together with events gives you three main benefits:
* You can trace every chart, funnel, and cohort back to real user sessions so teams can watch what users did.
* Product and engineering teams can debug issues faster by combining quantitative signals such as drop-offs or errors with qualitative evidence from replays.
* You get a single set of SDKs and privacy controls for both analytics events and replay, which simplifies governance.
The sections below describe how each data stack pattern works.
## Amplitude only
In this setup, Amplitude and its SDKs are your main event collection, Session Replay, and analytics layer.
### Data flow
Your website, mobile apps, and backend services send behavioral events directly to Amplitude using Amplitude SDKs or HTTP APIs. The same web and mobile SDKs can capture Session Replay data for selected sessions. Amplitude stores and processes everything for product analytics, experimentation, journey analysis, cohorts, and session-level insights. From there, you can sync events, cohorts, and selected replay links to downstream tools.
### Role of the SDKs and Session Replay
Because Amplitude SDKs collect events and replay, you can later turn on Event Stream and forward those same events from Amplitude to other tools such as a warehouse, CDP, or marketing systems, without changing tracking in your application. Session Replay shares the same user and session identifiers as your events, so product teams can move from a funnel in Amplitude to a specific session and watch what happened at a critical step.
### When this works well
This pattern is ideal when you're building a new analytics stack, don't yet have a central warehouse or CDP, and want to standardize tracking and replay quickly with one SDK implementation.
### Key benefits
* Fast time to value with minimal infrastructure.
* Single place to define events, properties, identities, and replay settings.
* You can use Event Stream from Amplitude as you add new tools later.
* Direct connection between quantitative analysis and qualitative replay for faster debugging and UX improvement.
## Amplitude with a CDP
Here, a CDP is the primary collection and routing layer, and Amplitude is a downstream analytics and activation destination.
### Data flow
Your product sends events to the CDP using CDP SDKs. The CDP forwards a copy of those events to Amplitude and routes them to marketing tools and ad platforms. Amplitude uses that behavioral data for product analytics, experimentation, cohorts, and activation.
You can instrument Session Replay in four main ways. The last method uses a CDP:
1. Using the [Amplitude Session Replay SDK](https://amplitude.com/docs/sdks/session-replay/session-replay-standalone-sdk).
2. Using the [Amplitude Session Replay Browser SDK plugin](https://amplitude.com/docs/sdks/session-replay/session-replay-plugin).
3. Using [Google Tag Manager](https://amplitude.com/docs/sdks/session-replay/session-replay-google-tag-manager).
4. Using [Segment](https://amplitude.com/docs/sdks/session-replay/session-replay-integration-with-segment).
These methods let you keep the CDP as the central event router while still getting session-level visibility inside Amplitude.
### Role of the SDKs and Session Replay
Most customers either instrument events only through the CDP SDKs and use Amplitude's SDKs specifically for Session Replay and any extra product-only events, or combine CDP and Amplitude SDKs more broadly for redundancy and lower latency. In all cases, Amplitude can still use Event Stream to forward its copy of events to other destinations.
### When this works well
This pattern is common when you've already deployed a CDP that owns identity resolution and audience syncs, and marketing teams rely on it. Amplitude becomes the main product analytics and Session Replay surface while the CDP remains the system through which events pass.
### Key benefits
* Single event schema in the CDP shared across Amplitude and marketing tools.
* Amplitude benefits from the CDP's unified identities while adding deep product analytics and replay.
* You can use Session Replay to explain patterns seen in CDP-driven campaigns and journeys.
* You can stream Amplitude's enriched event data into other systems.
## Amplitude with a data warehouse
In this pattern, Amplitude is the product analytics and event collection layer, and the warehouse is the central storage and business intelligence layer.
### Data flow
Your applications send events and Session Replay data into Amplitude using Amplitude SDKs. Amplitude stores and processes events and replay for analytics and troubleshooting. Amplitude then exports raw or modeled event data to your warehouse on a schedule or through streaming. Business intelligence tools query the warehouse to combine Amplitude events with billing, CRM, support, and other data. You can activate this data out of the warehouse with a Reverse ETL tool like Hightouch.
### Role of the SDKs and Session Replay
Amplitude SDKs define a behavioral schema optimized for product analytics and replay. After you instrument, you don't need separate tracking for warehouse use. Events flow first into Amplitude, then into the warehouse through exports or Event Stream. Session identifiers and user identifiers stay consistent across analytics in Amplitude and tables in the warehouse, so data teams can link warehouse-based models such as churn or lifetime value back to specific replays for qualitative investigation.
### When this works well
This pattern fits organizations where product teams rely on Amplitude for self-service analytics and debugging, while the data team uses the warehouse for cross-domain reporting and modeling.
### Key benefits
* One instrumentation path for both analytics and warehouse use.
* The warehouse receives clean event data that Amplitude has already validated.
* Data teams can join behavioral events with other domains while still using Amplitude for quick analysis and Session Replay.
* Replays give valuable context when investigating anomalies or model outputs discovered in warehouse-based dashboards.
## Amplitude with CDP and data warehouse
This pattern combines all three components. The CDP (or a CDI like Snowplow) is the real-time collection and routing layer, the warehouse is the long-term storage and modeling layer, and Amplitude is the product analytics, Session Replay, and activation layer.
### Data flow
Your applications send events into the CDP using its SDKs. The CDP forwards those events to Amplitude and to the warehouse. Amplitude instruments Session Replay through its own SDKs, plugins, or Segment-based integrations, and attaches replays to the sessions that originate from CDP events. The warehouse receives event data from the CDP or Amplitude, and data teams build models and aggregate tables there. You can send modeled attributes and scores back into Amplitude or the CDP with reverse ETL.
### Role of the SDKs and Session Replay
CDP SDKs typically provide the core event stream. Amplitude SDKs focus on Session Replay and any Amplitude-specific instrumentation that you choose to add. Amplitude can still stream enriched events and replay metadata to the warehouse or other tools. This combination gives you multiple controlled paths for data without duplicating tracking logic in code.
### When this works well
This pattern fits data-mature organizations where:
* The CDP owns event collection, identity resolution, and routing.
* The warehouse owns storage, modeling, and governance.
* Amplitude owns behavioral analytics, experimentation, Session Replay, and product-led activation.
### Key benefits
* Shared behavioral data across product, marketing, sales, and analytics teams.
* Strong governance for schemas and identities with clear ownership in CDP and warehouse.
* Session Replay directly tied to CDP-based journeys and warehouse-based models to explain the why behind metrics.
* You can stream Amplitude events and replay context to many downstream tools without new SDK work in the product.
## Choosing the right pattern
Many customers evolve through these patterns over time.
1. Start with Amplitude only and instrument both events and Session Replay with Amplitude SDKs to get quick value and a consistent behavioral model.
2. Add a CDP to standardize collection for marketing and other tools while still using Amplitude for analytics and replay.
3. Add a warehouse to centralize storage, join across systems, and support advanced modeling and business intelligence.
4. Connect all three so that the system best suited for each job handles collection, analytics, replay, and storage.
Across all four scenarios, Amplitude's instrumentation layer for events and Session Replay is reusable and extensible. After data flows into Amplitude, you can use Event Stream and exports to route events and replay context across your stack, so your architecture can evolve while your tracking plan remains stable.
================================================================================
# Getting set up with Amplitude Data
URL: https://amplitude.com/docs/data/amplitude-data-get-started
================================================================================
# Getting set up with Amplitude Data
Amplitude Data plans, instruments, validates, and deprecates the events your product sends to Amplitude. It covers the full data lifecycle: design a tracking plan, implement it with typed SDK code, catch instrumentation drift in QA, and retire events as your product changes.
## Get data into Amplitude
Amplitude supports several methods for ingesting data. You can collect data from your app using [SDKs](https://amplitude.com/docs/get-started/get-data-in).
### Choose an ingestion method
Consider these factors when deciding which ingestion method works best for your organization.
#### Use Amplitude SDKs
Amplitude SDKs are a good way to integrate if you're getting started with analytics. You can use Ampli to keep your instrumentation clean from the start while retaining the flexibility to send data to [various destinations](https://amplitude.com/docs/data/destination-catalog) later.
{% callout type="tip" %}
Want to skip manual setup? The [Amplitude Wizard CLI](https://amplitude.com/docs/get-started/setup-wizard-cli) detects your framework, proposes events tailored to your codebase, and instruments the SDK automatically with your approval.
{% /callout %}
When using Amplitude SDKs, decide whether to send events from front-end clients or back-end servers:
* **Client-side tracking**: Add client-side SDKs to your web and mobile apps. This method can be more direct because you can use default event tracking and capture both client-side and server-side interactions with your application. However, events that span all your clients require deployment changes across all your apps. On mobile, updates can take time depending on how long it takes your customers to update their apps.
* **Server-side tracking**: Send events directly from your servers to Amplitude. For example, when tracking an order completion, send the event from the back-end server that processes the order. This centralized approach is generally the most reliable because a single place in your control sends the events. You also don't have to wait for customers to update their app version.
Amplitude recommends server-side tracking for events that require high precision and client-side tracking for everything else.
#### Use cloud storage, warehouses, and event streaming
If you already have a reliable data source, connecting to that source can be the fastest way to get started with Amplitude. Customers often use these methods to connect with current sources of truth and use Amplitude's self-serve capabilities to expand data access across their company.
You can use Amplitude's data management capabilities even when you connect through an existing source.
## What to track
Identifying and planning the events and properties you want to track is essential to maximizing your data. A solid tracking plan helps you answer business questions and prevents gaps in your analyses.
Use these resources to help decide what to track:
* To get started quickly, read about [what events you need](https://amplitude.com/docs/get-started/select-events). That article recommends events and properties commonly tracked in each industry.
* Refer to the [data planning playbook](https://amplitude.com/docs/data/data-planning-playbook) for a deeper understanding of creating a taxonomy from scratch.
* If you've identified events and properties to track and want to get them into Amplitude, refer to [creating your tracking plan](https://amplitude.com/docs/data/create-tracking-plan).
## Best practices
These practices help ensure good results both initially and as you scale with Amplitude Data.
### Establish a naming convention
Simple, self-explanatory names that follow a consistent convention make your plan understandable across your organization. Consistent naming also prevents data quality issues. Two events with different capitalizations, such as `Song Played` and `song played`, appear as two separate events.
Set your naming convention in settings, and Amplitude Data prompts anyone who creates events to follow that convention.
### Use a separate environment for testing
Keep your data clean by using separate projects for development and production. Separate projects let you test your implementation without affecting your final business reports. They're also a good place to try data management tools before applying them to production data. Refer to [creating a project in Amplitude](https://amplitude.com/docs/get-started/create-project).
================================================================================
# Autocapture
URL: https://amplitude.com/docs/data/autocapture
================================================================================
# Autocapture
Autocapture collects a predefined set of user interactions from your website or app with one SDK snippet, no event-by-event instrumentation. On web, it captures sessions, page views, clicks, form interactions, file downloads, marketing attribution, and page URL enrichment through the [Browser SDK](https://amplitude.com/docs/sdks/analytics/browser/browser-sdk-2); on iOS and Android, it captures installs, upgrades, sessions, and screen views through the [iOS Swift SDK](https://amplitude.com/docs/sdks/analytics/ios/ios-swift-sdk) and [Android-Kotlin SDK](https://amplitude.com/docs/sdks/analytics/android/android-kotlin-sdk). Turn it on when you want baseline product analytics quickly, before you scope custom event tracking.
Use Autocapture when you want broad baseline coverage immediately with no instrumentation work. Use precision tracking when you need custom events or properties tied to specific business logic, such as purchases or feature-specific actions. The two work together, so most teams run both.
On the web, you can also use visual labeling to navigate your site and create new events from the click information.
## Autocapture and precision tracking
Amplitude offers two primary ways to capture events:
* Autocapture automatically collects a predefined set of events and properties in a standardized taxonomy using Amplitude SDKs.
* Precision tracking instruments events and properties specific to your business needs and analyses.
From the moment you install the SDK, Amplitude automatically collects data to provide insights into feature usage, funnel conversion rates, and click analysis on the web. The Browser SDK also enriches all events with page URL information, including previous page tracking and page type classification. Autocapture lets you focus on speed when setting up your analysis.
To investigate specific actions in your application that require additional metadata, or to track events such as a purchase event that may be core to your business, use precision tracking. Precise tracking in code lets you send these events with a robust set of properties to perform deeper analyses.
For example, imagine you're releasing a new feature and don't have time to implement precision tracking. Autocapture can serve as a safety net for collecting baseline metrics and answering engagement questions. After you have these insights and want to go deeper, work with your team to implement precisely tracked events and get the best of both approaches.
## Optimize your event volume
Autocapture provides several configuration options to help you adjust your implementation to your needs. You can turn individual Autocapture events on and off as needed and tune those events further to optimize your event volume.
The default configuration provides the right balance of automatically capturing events that matter while excluding ones that don't. This balance is critical when capturing clicks. By default, Amplitude captures clicks on interactive elements (for example, links, text fields, dropdowns, and other form elements). Amplitude also captures clicks on elements that result in a change on the page (for example, a new visual element) or a navigation to a new page. This configuration excludes clicks on blank areas, text highlighting, and similar actions to ensure you don't pay for low-value user behaviors.
Amplitude recommends monitoring your event volume (go to *Settings > Plans & Billing*) as you make changes to ensure it matches your expectations. You can change your configuration to capture clicks only on specified elements (or elements with certain classes), track only on specific pages, or turn click tracking off while still using other Autocapture data such as page views and sessions.
## Your taxonomy with Autocapture
Keeping your taxonomy clean and organized ensures users can find what they need. When you enable Autocapture, you get a predefined set of event and property types for ingestion. For example, the SDK captures click interactions as two events ("Element Clicked" and "Element Changed") with a predefined set of properties rather than a stream of noisy user interactions.
[Visual labeling](https://amplitude.com/docs/data/visual-labeling) lets users in your organization create events, so consider the following when thinking about your taxonomy:
* Set up the correct permissions for each user. Users with a Member role or higher can create labeled events.
* Align your naming convention with your existing taxonomy for labeled events.
* Add descriptions to your labeled events to help other users understand their purpose.
Additional details about labeled events:
* Labeled events have a separate tab in *Data > Events* to help you manage them differently from your raw ingested events. This tab displays who created the labeled events and the creation date for each event.
* Labeled events have a different icon in the event dropdown so you and your users can distinguish them from other events.
## Privacy and security
For many organizations, data privacy, security, and personally identifying information (PII) are critical factors when setting up data collection. Business needs, the purpose of your digital products, and compliance requirements between jurisdictions may vary. There's no one-size-fits-all solution that works in every situation.
Autocapture provides flexible configuration options to help you adhere to your company's privacy and security policies and requirements. While ensuring your use of Amplitude complies with your data privacy policies and requirements is your responsibility, these settings help you reach compliance.
### Default Autocapture protections
You control what information Autocapture collects and sends to the Amplitude platform. To update the events that Autocapture sends to Amplitude, refer to [Browser SDK | Disable Autocapture](https://amplitude.com/docs/sdks/analytics/browser/browser-sdk-2#disable-autocapture).
The following list describes Autocapture's default settings for capturing clicks and changes on page elements ("Element Clicked" and "Element Changed" events). The list also includes the following privacy and security considerations. You don't need to do anything to turn these protections on. They're always active.
* For sensitive elements such as end user text inputs, selects, text area elements, and any HTML elements with `contenteditable="true"` as an attribute, the SDK only collects class names and the type attribute. Autocapture excludes any end user-inputted text.
* Autocapture's default settings further restrict collection of sensitive input fields, such as passwords or form fields with the hidden attribute, and only capture class and type attribute values. Autocapture doesn't capture other details about these elements, including any content an end user populates in the input fields.
* Autocapture captures the text your website or app displays. For example, the content (`textContent`) of the element clicked and its children. Amplitude doesn't recommend using Autocapture's element interaction tracking on pages that may contain sensitive information. Amplitude uses pattern matching to automatically mask any text content that looks like a credit card number, social security number, or email address.
* The exception to these attribute collection rules is when an element has an explicit attribute added with the prefix `data-amp-track-`. This exception lets data in these attributes pass back to Amplitude intentionally.
* Autocapture automatically removes value, event handlers, style, and react attributes.
* Mask page titles in page view events by adding the `data-amp-mask` attribute to the `` element. This replaces the actual title with a masked value to protect sensitive information. For implementation details, refer to [Browser SDK page title masking](https://amplitude.com/docs/sdks/analytics/browser/browser-sdk-2#page-title-masking).
### Manual Autocapture protections
The following Autocapture protections are available if you choose to implement them. By default, Amplitude doesn't enable them. You can enable all or some of the protections listed below.
For some of these protections, you must add an attribute to your elements. You enable some of these protections through the *Data Settings > Autocapture* page. The documentation for each protection indicates how to enable it.
#### Precise text masking
Precise text masking redacts text capture from specific elements on the page. Adding this attribute lets you track clicks while redacting text displayed in particular elements.
To mask an element's text, add the attribute `data-amp-mask` to it. For example, if you have the following on a button:
```html
<div data-amp-mask>John Doe</div>
```
Autocapture still tracks the click on the div element. However, the text content "John Doe" appears as `*****` in the Autocapture data. This exclusion works at the SDK level.
Precise text works recursively, so Autocapture masks any text contained in an element. For example:
```html
<div data-amp-mask>
John Doe
<div>Jane Doe</div>
</div>
```
In this example, Autocapture masks both names with `*****`.
#### Precise attribute masking
Precise attribute masking redacts specific HTML attributes from capture. Defining which attributes to mask lets you track clicks with Autocapture while redacting attributes in your HTML. Specifying attributes on an element masks that attribute on all child elements as well.
For example, if you include the following attribute:
```html
<div data-amp-mask-attributes="name">
<span name="John D">Account</span>
</div>
```
on a button or link, Autocapture masks the name "John D" with `*****`.
You can also use a list to specify more than one attribute to mask. When using a list, format the masking attributes as `data-amp-mask-attributes="name,ssn"`.
{% callout type="note" heading="" %}
You can't mask information from ID and Class attributes because of their importance for [Visual Labeling](https://amplitude.com/docs/data/visual-labeling).
{% /callout %}
#### Pattern (RegEx) masking
You can mask information based on patterns you specify (regular expressions or RegEx). If you aren't familiar with RegEx, review this page on [regular expressions](https://www.regular-expressions.info/quickstart.html).
Specify a pattern of information for Autocapture to mask. This configuration occurs in the [SDK](https://amplitude.com/docs/sdks) and provides an additional layer of protection to the default patterns Amplitude uses to mask email, credit cards, and social security numbers. RegEx filters mask values in any fields where this data may appear, including both visible fields and hidden attributes on the page.
For example, you can set a RegEx pattern to filter out credit card numbers such as `****-**** **** 1234`. In this example, you want to fully mask the credit card information, including the final four digits. Add the RegEx filter `/(?i)ends\s*in\s*[0-9]{4}/`. If Amplitude finds credit card information that matches the pattern, Autocapture masks those numbers as `*****`.
Enable this through the *Data Settings > Autocapture > Element Interactions* page.
#### Page URL exclude and allow lists
Page URL exclude and allow lists let you specify unique URL page patterns to exclude from or include in Autocapture. Use these capabilities if your organization requires stronger restrictions or safeguards, or if your website or app may contain pages with highly sensitive data such as those in financial services, healthcare, and medical technologies.
For example, you can exclude user activity from specific sub-domains on your URL, such as your user's account settings or URLs that only include testing data.
If you host your site on multiple domains such as `.com` and `.co.uk`, specify that you only want to include data from the `.co.uk` domain.
**Examples**
Using the example of `.com` and `.co.uk` above, here are examples of the exclude and allow lists:
**Exclude list**
* Add `https://example.co.uk/account/*` as a glob pattern to the exclude list. This pattern captures everything on the `.co.uk` domain except for the account section.
**Allow list**
* Add `https://example.co.uk/*` as a glob pattern to the allow list. Amplitude only captures data from the `.co.uk` domain. Amplitude doesn't capture data from the `.com` domain.
{% callout type="note" heading="" %}
The exclude list always takes priority over the allow list. This priority prevents you from capturing data that you don't want. If you include the same pattern in both the exclude and allow lists, Autocapture excludes that pattern.
{% /callout %}
Enable this through the *Data Settings > Autocapture > Element Interactions* page.
#### Limit click tracking
To support visual labeling, Autocapture captures interaction information about the elements clicked or changed and information about the element's parents in the HTML structure. Depending on your site's structure, you can:
* Refine the elements allowed for click and change tracking. Configure the `cssSelectorAllowlist` and `actionClickAllowlist` options to change the list of elements that Autocapture can track. You can remove all common HTML elements and restrict to elements with a specific class.
Enable this through the *Data Settings > Autocapture > Element Interactions* page.
#### Turn off Autocapture events
You can turn off Autocapture entirely and use precision tracking for data collection. Amplitude includes robust data management tools and workflows that support planning and implementing a custom taxonomy.
[Turn off any or all Autocapture events](https://amplitude.com/docs/sdks/analytics/browser/browser-sdk-2#disable-autocapture) through your SDK configuration.
================================================================================
# Autocapture Remote Configuration
URL: https://amplitude.com/docs/data/autocapture-remote-configuration
================================================================================
# Autocapture Remote Configuration
Autocapture Remote Configuration updates your [Autocapture](https://amplitude.com/docs/data/autocapture) settings from the Amplitude UI without a code change or SDK redeploy. It toggles which event types Autocapture tracks, adjusts allowlists and exclude lists for element interactions, and adds extra event properties such as page referrer or page URL across all events.
Use Remote Configuration when you want non-engineers to adjust Autocapture without shipping code. If you need the settings hardcoded in the client or want to gate them behind a deploy, configure Autocapture directly in your Browser SDK initialization options instead.
{% callout type="note" heading="" %}
Autocapture Remote Configuration works with [Browser SDK](https://amplitude.com/docs/sdks/analytics/browser/browser-sdk-2) v2.10.0+ when you enable `fetchRemoteConfig`. Browser SDK v2.16.1 enables Remote Configuration by default.
{% /callout %}
## Set up remote configuration for Autocapture
1. Go to *Data > Settings > Autocapture*.
2. Specify which elements you want to capture. By default, Amplitude captures all elements. You can capture or not capture any of the following elements:
* **File downloads**: Track when a user clicks an anchor or `<a>` tag linked to a file.
* **Form Interactions**: Track a user's interaction with the form element.
* **Sessions**: Track the period of time that a user has your website open. Amplitude tracks both Start Session and End Session events.
* **Page Views**: Track when a user navigates to a page.
* **Element Interactions**: Track when users click links, buttons, inputs, and so forth.
3. For Element Interactions, specify the following additional aspects:
* **CSS Selector Allowlist**: CSS selectors that specify which elements on the page Amplitude always tracks.
* **Action Click Allowlist**: Additional CSS selectors to track when clicked.
* **Page URL Allowlist**: Defines one or more URLs or URL patterns on which Amplitude tracks element click and change events.
* **Page URL Exclude List**: Defines one or more URLs or URL patterns to exclude from element click and change tracking. **Note**: Using RegEx or glob patterns requires your SDK version to be 2.23.7 or higher.
* **Text Masking RegEx Patterns**: Defines the RegEx patterns to mask for event properties in Autocapture. **Note**: Using this masking feature requires your SDK version to be 2.23.7 or higher.
* **Data Attribute Prefix**: Lets Amplitude capture data attributes as event properties.
* **Frustration interactions**: Frustration interactions (rage or dead clicks) performed by the user. Rage clicks are clicks that occur four or more times in a second. Dead clicks are clicks on an interactive element that result in no visible change within three seconds.
4. Click **Save Changes**.
================================================================================
# Autocapture Events and Properties
URL: https://amplitude.com/docs/data/autocapture-events-and-properties
================================================================================
# Autocapture Events and Properties
This reference lists Autocapture event types and event property names for web when you use the [Browser SDK 2](https://amplitude.com/docs/sdks/analytics/browser/browser-sdk-2). Use this reference to understand what Amplitude captures automatically, configure your tracking plan, or set up pipelines and validation.
For a machine-readable version of this page, go to [Web Autocapture Schema](https://amplitude.com/docs/data/web-autocapture-schema). For native iOS and Android Autocapture event properties, go to [Mobile Autocapture Schema](https://amplitude.com/docs/data/mobile-autocapture-schema).
## Shared conventions
- Property names in bold (for example, **Page URL**) reflect how they appear in Amplitude.
- Autocapture prefixes some properties with `[Amplitude]`. Amplitude generates these automatically and marks them as read-only.
- Configure which events Amplitude captures through `AutocaptureOptions` in the Browser SDK 2.
## Sessions
### Session started
Captures when a user session begins, either on first page load or after a period of inactivity.
| Property Name | Description |
| ------------------------- | ----------- |
| *No properties collected* | |
### Session ended
Captures when a user session ends due to inactivity or the browser tab closing.
| Property Name | Description |
| ------------------------- | ----------- |
| *No properties collected* | |
## Page views
### Page viewed
Captures each time a user loads or navigates to a page, including single-page app route changes.
| Property Name | Description |
| ----------------- | ------------------------------------------------------------------------------------------------ |
| **Page Domain** | The full hostname from the current web address, including any subdomains such as `www` or `app`. |
| **Page Location** | The full URL of the current page, including any URL Search Parameters. |
| **Page Path** | The pathname of the current page. This excludes any URL Search Parameters and URL Fragments. |
| **Page Title** | The title of the page. |
| **Page URL** | The URL of the page excluding the URL Search Parameters. |
## File downloads
### File downloaded
Captures when a user clicks a link that triggers a file download.
| Property Name | Description |
| ------------------ | --------------------------------------------------------------------------------------------------- |
| **File Extension** | The extension of the downloaded file. For example: .pdf, .docx, .zip, and so forth. |
| **File Name** | The full pathname of the downloaded file. This can include more than just the filename of the file. |
| **Link ID** | The ID of the link element. |
| **Link Text** | The text content of the link element. |
| **Link URL** | The link address of the file download. |
## Form interactions
Autocapture captures forms that use the `<form>` tag.
### Form started
Captures when a user initially interacts with a form element, including modifications to a text input, radio button, or dropdown.
| Property Name | Description |
| -------------------- | ---------------------------------------------------------------------------------------- |
| **Form Destination** | The action attribute of the form element. For example, for `<form action="/subscribe">`, the value is `/subscribe`. |
| **Form ID** | The ID of the form element. |
| **Form Name** | The name attribute of the form element. |
### Form submitted
Captures when a user submits the form.
| Property Name | Description |
| -------------------- | ---------------------------------------------------------------------------------------- |
| **Form Destination** | The action attribute of the form element. For example, for `<form action="/subscribe">`, the value is `/subscribe`. |
| **Form ID** | The ID of the form element. |
| **Form Name** | The name attribute of the form element. |
## Element interactions
### Element clicked
Captures clicks on page elements.
The default configuration captures user interactions with interactive elements on your page. The default eliminates event noise such as clicks to highlight text and white-space clicks. The default captures the following:
* All clicks on form elements: `<a>`, button, input, select, text area, label, and elements where `contentEditable` is set to `true`.
* All clicks on video and audio elements.
* Clicks on select elements that result in a change on your page (for example, a modal appearing) or navigation to another page. These elements include divs, spans, and headers.
* All clicks on elements with an attribute of `data-amp-default-track` or a class of `amp-default-track`.
* You can customize this configuration to add or remove selectors. You can choose whether Amplitude always tracks those selectors or only when the click results in a change to the page.
| Property Name | Description |
| ----------------------- | ---------------------------------------------------------------------------------------------------------------------------------------------------------------------------------------- |
| **Element ID** | The `id` attribute of the HTML element. For example, an element with `id="myID"` produces the value `myID`. |
| **Element Class** | The `class` attribute of the HTML element. For example, an element with `class="myClass"` produces the value `myClass`. |
| **Element Tag** | The tag name of the HTML element. For example, an `<a>` element produces the value `a`. |
| **Element Text** | The text content (`innerText`) of the HTML element. Only applies to the Element Clicked event. For example, a link with text "Home" produces the value `Home`. |
| **Element Href** | The `href` attribute of the HTML element. Only applies to `<a>` tags on the Element Clicked event. Amplitude truncates values longer than 128 bytes. |
| **Element Position Left** | The distance of the element from the left of the screen view, in pixels. For example, a value of `600` means the element was 600px from the left. |
| **Element Position Top** | The distance of the element from the top of the screen view, in pixels. For example, a value of `400` means the element was 400px from the top. |
| **Viewport Height** | The height of the viewport in pixels when the element was clicked. For example, a value of `900` means the viewport was 900 pixels tall. |
| **Viewport Width** | The width of the viewport in pixels when the element was clicked. For example, a value of `1200` means the viewport was 1200 pixels wide. |
| **Page URL** | The URL of the page where the element was clicked. |
| **Page Title** | The page title of the page where the element was clicked. |
| **Element Hierarchy** | DOM elements and attributes of the element clicked and its parent or sibling elements. Amplitude uses this for visual labeling. |
| **Element Selector** | **Deprecated** in favor of Element Hierarchy. A unique CSS selector of the element. For example, an element with `id="myID"` produces the value `#myID`. |
| **Element Attributes** | Unique attributes associated with click events through the `dataAttributePrefix` setting. For example, an element with attribute `id="feature-start"` produces a property `[Amplitude] Element Attributes.id` with the value `feature-start`. |
| **Element Aria Label** | The `aria-label` of the element, used for interactive elements without visible text. For example, an element with `aria-label="Close"` produces the value `Close`. |
| **Element Parent Label** | The text label in the parent element (or upper ancestors if not found in the one-level parent) of the element. |
### Element changed
Captures form element interactions, such as changes to a dropdown or entering text in a text box.
| Property Name | Description |
| ----------------------- | ---------------------------------------------------------------------------------------------------------------------------------------------------------------------------------------- |
| **Element ID** | The `id` attribute of the HTML element. |
| **Element Class** | The `class` attribute of the HTML element. |
| **Element Tag** | The tag name of the HTML element. |
| **Element Position Left** | The distance of the element from the left of the screen view, in pixels. |
| **Element Position Top** | The distance of the element from the top of the screen view, in pixels. |
| **Viewport Height** | The height of the viewport in pixels when the element changed. |
| **Viewport Width** | The width of the viewport in pixels when the element changed. |
| **Page URL** | The URL of the page where the element changed. |
| **Page Title** | The page title of the page where the element changed. |
| **Element Hierarchy** | DOM elements and attributes of the element changed and its parent or sibling elements. Amplitude uses this for visual labeling. |
| **Element Selector** | **Deprecated** in favor of Element Hierarchy. A unique CSS selector of the element. |
| **Element Attributes** | Unique attributes associated with change events through the `dataAttributePrefix` setting. |
| **Element Aria Label** | The `aria-label` of the element, used for interactive elements without visible text. |
| **Element Parent Label** | The text label in the parent element (or upper ancestors if not found in the one-level parent) of the element. |
## Network requests
Captures when the application makes a network request. By default, Amplitude tracks network requests with a response code in the range 500-599 and excludes requests made to any `amplitude.com` domain.
To enable network request tracking, set `config.autocapture.networkTracking` to `true` in your SDK configuration.
| Property Name | Description |
| ---------------------------------- | ----------------------------------------------------------------------------------- |
| **[Amplitude] URL** | The URL of the network request with sensitive information masked. |
| **[Amplitude] URL Query** | The query parameters of the URL. |
| **[Amplitude] URL Fragment** | The fragment identifier of the URL. |
| **[Amplitude] Request Method** | The HTTP method used for the request (for example, GET, POST, PUT, or DELETE). |
| **[Amplitude] Status Code** | The HTTP status code of the response. |
| **[Amplitude] Error Code** | The local error code if the request failed without a status code. |
| **[Amplitude] Error Message** | The local error message if the request failed without a status code. |
| **[Amplitude] Start Time** | The timestamp when the request started, in milliseconds since Unix epoch. |
| **[Amplitude] Completion Time** | The timestamp when the request completed, in milliseconds since Unix epoch. |
| **[Amplitude] Duration** | The duration of the request in milliseconds. |
| **[Amplitude] Request Body Size** | The size of the request body in bytes. |
| **[Amplitude] Response Body Size** | The size of the response body in bytes. |
| **[Amplitude] Request Body** | The captured JSON request body (when you configure a `requestBody` capture rule). |
| **[Amplitude] Response Body** | The captured JSON response body (when you configure a `responseBody` capture rule). |
For more information about configuring network tracking, including advanced capture rules and filtering options, refer to [Track network requests](https://amplitude.com/docs/sdks/analytics/browser/browser-sdk-2#track-network-requests) in the Browser SDK 2 documentation.
## Web Vitals
Captures Core Web Vitals performance metrics when the browser tab hides.
| Property Name | Description |
| ----------------------------------- | ---------------------------------------------------------------------------------------------------------------- |
| **Page Domain** | The full hostname from the current web address, including any subdomains such as `www` or `app`. |
| **Page Location** | The full URL of the current page, including any URL Search Parameters. |
| **Page Path** | The pathname of the current page. This excludes any URL Search Parameters and URL Fragments. |
| **Page Title** | The title of the page. |
| **Page URL** | The URL of the page excluding the URL Search Parameters. |
| **LCP (Largest Contentful Paint)** | The time it takes for the largest content element to become visible in the viewport. Measured in milliseconds. |
| **FCP (First Contentful Paint)** | The time it takes for the first content element to be painted on the screen. Measured in milliseconds. |
| **INP (Interaction to Next Paint)** | The time from a user interaction to the next paint. Measured in milliseconds. |
| **CLS (Cumulative Layout Shift)** | The sum of all individual layout shift scores for unexpected layout shifts. A dimensionless value. |
| **TTFB (Time to First Byte)** | The time from the navigation start to when the first byte of the response is received. Measured in milliseconds. |
Each metric includes a performance rating (good, needs-improvement, or poor) based on Web Vitals thresholds and timing data.
================================================================================
# Web Autocapture Schema
URL: https://amplitude.com/docs/data/web-autocapture-schema
================================================================================
# Web Autocapture Schema
This reference lists Autocapture event types and event property names for web when you use the [Browser SDK 2](https://amplitude.com/docs/sdks/analytics/browser/browser-sdk-2). Use it when you need a stable contract for pipelines, partners, or validation.
For Autocapture setup steps, go to [Autocapture](https://amplitude.com/docs/get-started/autocapture). For full property descriptions with examples, go to [Autocapture events and properties](https://amplitude.com/docs/data/autocapture-events-and-properties). For native iOS and Android Autocapture event properties, go to [Mobile Autocapture Schema](https://amplitude.com/docs/data/mobile-autocapture-schema).
## Shared conventions
- **Event type** values match what Amplitude stores as `event_type` (for example, `Page viewed`).
- Web event types don't use the `[Amplitude]` prefix, except for `[Amplitude] Network Request`.
- **Property names** appear in Amplitude exactly as listed here.
- Session events carry no additional properties beyond standard user and session context.
## Machine-readable schema
```json
{
"description": "Web Autocapture event types and event property names for the Amplitude Browser SDK 2.",
"documentation": "/docs/data/web-autocapture-schema",
"web": {
"sdk": "Browser SDK 2",
"events": {
"Session Started": { "properties": [] },
"Session Ended": { "properties": [] },
"Page viewed": {
"properties": ["Page Domain", "Page Location", "Page Path", "Page Title", "Page URL"]
},
"File Downloaded": {
"properties": ["File Extension", "File Name", "Link ID", "Link Text", "Link URL"]
},
"Form Started": {
"properties": ["Form Destination", "Form ID", "Form Name"]
},
"Form Submitted": {
"properties": ["Form Destination", "Form ID", "Form Name"]
},
"Element Clicked": {
"properties": [
"Element ID",
"Element Class",
"Element Tag",
"Element Text",
"Element Href",
"Element Position Left",
"Element Position Top",
"Viewport Height",
"Viewport Width",
"Page URL",
"Page Title",
"Element Hierarchy",
"Element Attributes",
"Element Aria Label",
"Element Parent Label"
]
},
"Element Changed": {
"properties": [
"Element ID",
"Element Class",
"Element Tag",
"Element Position Left",
"Element Position Top",
"Viewport Height",
"Viewport Width",
"Page URL",
"Page Title",
"Element Hierarchy",
"Element Attributes",
"Element Aria Label",
"Element Parent Label"
]
},
"[Amplitude] Network Request": {
"properties": [
"[Amplitude] URL",
"[Amplitude] URL Query",
"[Amplitude] URL Fragment",
"[Amplitude] Request Method",
"[Amplitude] Status Code",
"[Amplitude] Error Code",
"[Amplitude] Error Message",
"[Amplitude] Start Time",
"[Amplitude] Completion Time",
"[Amplitude] Duration",
"[Amplitude] Request Body Size",
"[Amplitude] Response Body Size",
"[Amplitude] Request Body",
"[Amplitude] Response Body"
]
},
"Web Vitals": {
"properties": [
"Page Domain",
"Page Location",
"Page Path",
"Page Title",
"Page URL",
"LCP (Largest Contentful Paint)",
"FCP (First Contentful Paint)",
"INP (Interaction to Next Paint)",
"CLS (Cumulative Layout Shift)",
"TTFB (Time to First Byte)"
]
}
}
}
}
```
## Web (Browser SDK 2)
Configure which events Amplitude captures using `AutocaptureOptions` in the Browser SDK 2. Go to [Autocapture (Browser SDK 2)](https://amplitude.com/docs/sdks/analytics/browser/browser-sdk-2#autocapture) for configuration options.
| Event type | When it fires | Typical event properties |
| ---------- | ------------- | ------------------------ |
| `Session Started` | Session begins on first page load or after inactivity. | None. |
| `Session Ended` | Session ends due to inactivity or browser tab closing. | None. |
| `Page viewed` | User loads or navigates to a page, including single-page app route changes. | `Page Domain`, `Page Location`, `Page Path`, `Page Title`, `Page URL`. |
| `File Downloaded` | User clicks a link that triggers a file download. | `File Extension`, `File Name`, `Link ID`, `Link Text`, `Link URL`. |
| `Form Started` | User initially interacts with a form element (text input, radio button, or dropdown). | `Form Destination`, `Form ID`, `Form Name`. |
| `Form Submitted` | User submits a form. | `Form Destination`, `Form ID`, `Form Name`. |
| `Element Clicked` | User clicks an interactive page element. | `Element ID`, `Element Class`, `Element Tag`, `Element Text`, `Element Href`, `Element Position Left`, `Element Position Top`, `Viewport Height`, `Viewport Width`, `Page URL`, `Page Title`, `Element Hierarchy`, `Element Attributes`, `Element Aria Label`, `Element Parent Label`. |
| `Element Changed` | User changes a form element such as a dropdown or text input. | `Element ID`, `Element Class`, `Element Tag`, `Element Position Left`, `Element Position Top`, `Viewport Height`, `Viewport Width`, `Page URL`, `Page Title`, `Element Hierarchy`, `Element Attributes`, `Element Aria Label`, `Element Parent Label`. |
| `[Amplitude] Network Request` | Application makes a tracked HTTP request (response codes 500–599 by default). | `[Amplitude] URL`, `[Amplitude] URL Query`, `[Amplitude] URL Fragment`, `[Amplitude] Request Method`, `[Amplitude] Status Code`, `[Amplitude] Error Code`, `[Amplitude] Error Message`, `[Amplitude] Start Time`, `[Amplitude] Completion Time`, `[Amplitude] Duration`, `[Amplitude] Request Body Size`, `[Amplitude] Response Body Size`, `[Amplitude] Request Body`, `[Amplitude] Response Body`. |
| `Web Vitals` | Browser tab hides; Amplitude collects Core Web Vitals. | `Page Domain`, `Page Location`, `Page Path`, `Page Title`, `Page URL`, `LCP (Largest Contentful Paint)`, `FCP (First Contentful Paint)`, `INP (Interaction to Next Paint)`, `CLS (Cumulative Layout Shift)`, `TTFB (Time to First Byte)`. |
================================================================================
# Mobile Autocapture Schema
URL: https://amplitude.com/docs/data/mobile-autocapture-schema
================================================================================
# Mobile Autocapture Schema
This reference lists Autocapture event types and event property names for native iOS and Android when you use the [iOS Swift SDK](https://amplitude.com/docs/sdks/analytics/ios/ios-swift-sdk) and [Android-Kotlin SDK](https://amplitude.com/docs/sdks/analytics/android/android-kotlin-sdk). Use it when you need a stable contract for pipelines, partners, or validation.
{% callout type="note" heading="React Native packages" %}
Amplitude doesn't ship a separate React Native Autocapture package. React Native apps that need comparable behavior typically instrument events manually or bridge to native SDKs. This schema applies to native iOS and Android Autocapture only.
{% /callout %}
For Autocapture setup steps, go to [Autocapture](https://amplitude.com/docs/get-started/autocapture). For web Autocapture event properties, go to [Autocapture events and properties](https://amplitude.com/docs/data/autocapture-events-and-properties). For a machine-readable web schema, go to [Web Autocapture Schema](https://amplitude.com/docs/data/web-autocapture-schema).
## Machine-readable schema
```json
{
"description": "Native mobile Autocapture event types and event property names for Amplitude iOS Swift SDK and Android-Kotlin SDK. React Native is not included.",
"documentation": "/docs/data/mobile-autocapture-schema",
"ios": {
"events": {
"[Amplitude] Start Session": { "properties": [] },
"[Amplitude] End Session": { "properties": [] },
"[Amplitude] Application Installed": {
"properties": ["[Amplitude] Version", "[Amplitude] Build"]
},
"[Amplitude] Application Updated": {
"properties": [
"[Amplitude] Version",
"[Amplitude] Build",
"[Amplitude] Previous Version",
"[Amplitude] Previous Build"
]
},
"[Amplitude] Application Opened": {
"properties": [
"[Amplitude] Version",
"[Amplitude] Build",
"[Amplitude] From Background"
]
},
"[Amplitude] Application Backgrounded": { "properties": [] },
"[Amplitude] Screen Viewed": {
"properties": ["[Amplitude] Screen Name"]
},
"[Amplitude] Deep Link Opened": {
"properties": ["[Amplitude] Link URL", "[Amplitude] Link Referrer"]
},
"[Amplitude] Network Request": {
"properties": [
"[Amplitude] URL",
"[Amplitude] URL Query",
"[Amplitude] URL Fragment",
"[Amplitude] Request Method",
"[Amplitude] Status Code",
"[Amplitude] Error Code",
"[Amplitude] Error Message",
"[Amplitude] Start Time",
"[Amplitude] Completion Time",
"[Amplitude] Duration",
"[Amplitude] Request Body Size",
"[Amplitude] Response Body Size",
"[Amplitude] Request Body",
"[Amplitude] Response Body",
"[Amplitude] Request Headers",
"[Amplitude] Response Headers"
]
},
"[Amplitude] Element Interacted": {
"properties": [
"[Amplitude] Action",
"[Amplitude] Target View Class",
"[Amplitude] Target Text",
"[Amplitude] Target Accessibility Label",
"[Amplitude] Target Accessibility Identifier",
"[Amplitude] Action Method",
"[Amplitude] Gesture Recognizer",
"[Amplitude] Hierarchy",
"[Amplitude] Screen Name"
]
},
"[Amplitude] Rage Click": {
"properties": [
"[Amplitude] Begin Time",
"[Amplitude] End Time",
"[Amplitude] Duration",
"[Amplitude] Click Count",
"[Amplitude] Clicks",
"[Amplitude] Action",
"[Amplitude] Target View Class",
"[Amplitude] Target Text"
]
},
"[Amplitude] Dead Click": {
"properties": [
"[Amplitude] Begin Time",
"[Amplitude] End Time",
"[Amplitude] Duration",
"[Amplitude] Action",
"[Amplitude] Target View Class",
"[Amplitude] Target Text"
]
}
}
},
"android": {
"events": {
"[Amplitude] Start Session": { "properties": [] },
"[Amplitude] End Session": { "properties": [] },
"[Amplitude] Application Installed": {
"properties": ["[Amplitude] Version", "[Amplitude] Build"]
},
"[Amplitude] Application Updated": {
"properties": [
"[Amplitude] Version",
"[Amplitude] Build",
"[Amplitude] Previous Version",
"[Amplitude] Previous Build"
]
},
"[Amplitude] Application Opened": {
"properties": [
"[Amplitude] Version",
"[Amplitude] Build",
"[Amplitude] From Background"
]
},
"[Amplitude] Application Backgrounded": { "properties": [] },
"[Amplitude] Screen Viewed": {
"properties": ["[Amplitude] Screen Name"]
},
"[Amplitude] Fragment Viewed": {
"properties": [
"[Amplitude] Screen Name",
"[Amplitude] Fragment Class",
"[Amplitude] Fragment Identifier",
"[Amplitude] Fragment Tag"
]
},
"[Amplitude] Deep Link Opened": {
"properties": ["[Amplitude] Link URL", "[Amplitude] Link Referrer"]
},
"[Amplitude] Network Request": {
"properties": [
"[Amplitude] URL",
"[Amplitude] URL Query",
"[Amplitude] URL Fragment",
"[Amplitude] Request Method",
"[Amplitude] Status Code",
"[Amplitude] Error Message",
"[Amplitude] Start Time",
"[Amplitude] Completion Time",
"[Amplitude] Duration",
"[Amplitude] Request Body Size",
"[Amplitude] Response Body Size"
]
},
"[Amplitude] Element Interacted": {
"properties": [
"[Amplitude] Action",
"[Amplitude] Target Class",
"[Amplitude] Target Resource",
"[Amplitude] Target Tag",
"[Amplitude] Target Text",
"[Amplitude] Target Source",
"[Amplitude] Hierarchy",
"[Amplitude] Screen Name"
]
},
"[Amplitude] Rage Click": { "properties": [] },
"[Amplitude] Dead Click": { "properties": [] }
}
}
}
```
## Shared conventions
- **Event type** values match what Amplitude stores as `event_type` (for example, `[Amplitude] Screen Viewed`).
- **Property names** use the `[Amplitude] ...` prefix in the product and in this doc.
- Session events typically carry only standard user and session context unless you add more in code.
## iOS (Swift SDK)
Enable options through `AutocaptureOptions`. Go to [Autocapture (iOS)](https://amplitude.com/docs/sdks/analytics/ios/ios-swift-sdk#autocapture) for configuration options.
| Event type | When it fires | Typical event properties |
| ---------- | ------------- | ------------------------ |
| `[Amplitude] Start Session` | Session starts | User properties (when you enable user property collection). |
| `[Amplitude] End Session` | Session ends | User properties (when you enable user property collection). |
| `[Amplitude] Application Installed` | First open after install | `[Amplitude] Version`, `[Amplitude] Build`. |
| `[Amplitude] Application Updated` | First open after update | `[Amplitude] Version`, `[Amplitude] Build`, `[Amplitude] Previous Version`, `[Amplitude] Previous Build`. |
| `[Amplitude] Application Opened` | Launch or foreground after first open | `[Amplitude] Version`, `[Amplitude] Build`, `[Amplitude] From Background` (when applicable). |
| `[Amplitude] Application Backgrounded` | App enters background | None. |
| `[Amplitude] Screen Viewed` | UIKit screen appears | `[Amplitude] Screen Name`. |
| `[Amplitude] Deep Link Opened` | Deep link opens | `[Amplitude] Link URL`, `[Amplitude] Link Referrer`. |
| `[Amplitude] Network Request` | SDK captures HTTP traffic (per SDK rules) | `[Amplitude] URL`, `[Amplitude] URL Query`, `[Amplitude] URL Fragment`, `[Amplitude] Request Method`, `[Amplitude] Status Code`, `[Amplitude] Error Code`, `[Amplitude] Error Message`, `[Amplitude] Start Time`, `[Amplitude] Completion Time`, `[Amplitude] Duration`, `[Amplitude] Request Body Size`, `[Amplitude] Response Body Size`, plus optional experimental body and header properties when you enable them. |
| `[Amplitude] Element Interacted` | `UIControl` / gesture interaction | `[Amplitude] Action`, `[Amplitude] Target View Class`, `[Amplitude] Target Text`, `[Amplitude] Target Accessibility Label`, `[Amplitude] Target Accessibility Identifier`, `[Amplitude] Action Method`, `[Amplitude] Gesture Recognizer`, `[Amplitude] Hierarchy`, `[Amplitude] Screen Name`. |
| `[Amplitude] Rage Click` | Frustration (rage click) | Go to [Track frustration interactions](https://amplitude.com/docs/sdks/analytics/ios/ios-swift-sdk#track-frustration-interactions) for more information. |
| `[Amplitude] Dead Click` | Frustration (dead click) | Same as [Rage Click](https://amplitude.com/docs/sdks/analytics/ios/ios-swift-sdk#track-frustration-interactions). |
## Android (Kotlin SDK)
Enable options through `AutocaptureOption`. Go to [Autocapture (Android)](https://amplitude.com/docs/sdks/analytics/android/android-kotlin-sdk#autocapture) for configuration options.
| Event type | When it fires | Typical event properties |
| ---------- | ------------- | ------------------------ |
| `[Amplitude] Start Session` | Session starts | User properties (when you enable user property collection). |
| `[Amplitude] End Session` | Session ends | User properties (when you enable user property collection). |
| `[Amplitude] Application Installed` | First open after install | `[Amplitude] Version`, `[Amplitude] Build`. |
| `[Amplitude] Application Updated` | First open after update | `[Amplitude] Version`, `[Amplitude] Build`, `[Amplitude] Previous Version`, `[Amplitude] Previous Build`. |
| `[Amplitude] Application Opened` | Launch or foreground after first open | `[Amplitude] Version`, `[Amplitude] Build`, `[Amplitude] From Background` (when applicable). |
| `[Amplitude] Application Backgrounded` | App backgrounds | None. |
| `[Amplitude] Screen Viewed` | Activity appears | `[Amplitude] Screen Name`. |
| `[Amplitude] Fragment Viewed` | Fragment appears | `[Amplitude] Screen Name`, `[Amplitude] Fragment Class`, `[Amplitude] Fragment Identifier`, `[Amplitude] Fragment Tag`. |
| `[Amplitude] Deep Link Opened` | Deep link opens | `[Amplitude] Link URL`, `[Amplitude] Link Referrer`. |
| `[Amplitude] Network Request` | SDK captures HTTP traffic (plugin) | `[Amplitude] URL`, `[Amplitude] URL Query`, `[Amplitude] URL Fragment`, `[Amplitude] Request Method`, `[Amplitude] Status Code`, `[Amplitude] Error Message`, `[Amplitude] Start Time`, `[Amplitude] Completion Time`, `[Amplitude] Duration`, `[Amplitude] Request Body Size`, `[Amplitude] Response Body Size`. |
| `[Amplitude] Element Interacted` | Clickable view or Compose | `[Amplitude] Action`, `[Amplitude] Target Class`, `[Amplitude] Target Resource`, `[Amplitude] Target Tag`, `[Amplitude] Target Text`, `[Amplitude] Target Source`, `[Amplitude] Hierarchy`, `[Amplitude] Screen Name`. |
| `[Amplitude] Rage Click` | Frustration (optional) | Go to [Track frustration interactions](https://amplitude.com/docs/sdks/analytics/android/android-kotlin-sdk#track-frustration-interactions) for more information. |
| `[Amplitude] Dead Click` | Frustration (optional) | Same as [Rage Click](https://amplitude.com/docs/sdks/analytics/android/android-kotlin-sdk#track-frustration-interactions). |
================================================================================
# Visual Labeling
URL: https://amplitude.com/docs/data/visual-labeling
================================================================================
# Visual Labeling
Visual Labeling creates tracked events from elements you click directly on your site, so non-technical Amplitude users can define events without writing code or understanding the structure of the page. It requires [Autocapture](https://amplitude.com/docs/data/autocapture) on your site.
Amplitude maintains labeled events separately from events you've created in other ways. If there are issues with data for labeled events, make adjustments from within the Labeled Events tab, instead of involving your engineering team.
## Prerequisites
- [Amplitude Browser SDK](https://amplitude.com/docs/sdks/analytics/browser/browser-sdk-2) 2.10.0 or higher.
- The SDK's `config.autocapture.elementInteractions` option set to `true`. For more information, go to the [Browser SDK Configuration](https://amplitude.com/docs/sdks/analytics/browser/browser-sdk-2#configure-the-sdk).
{% callout type="note" heading="" %}
Visual Labeling is available to Amplitude users with the role **Member** and above.
{% /callout %}
{% callout type="tip" heading="Retroactive analysis" %}
Events you create with visual labeling work retroactively against all Autocapture data. Amplitude applies your labeled event definitions to historical click and form interaction data captured since your instrumentation went live. You can analyze user behavior from the past without waiting for new data to accumulate.
{% /callout %}
## Create a labeled event with visual labeling
To use Visual Labeling to create new labeled events, follow these steps:
1. Open Amplitude Data and click **Visual Labeling**.
2. Click the drop-down menu to select the URL you want or add a new URL.
3. Click **Start Labeling**. Amplitude opens your website or app in a new tab, with the visual labeling toolbar at the top of the page.
4. Click an element you want to label. The visual labeling overlay appears.
5. In the visual labeling overlay, enter a name, description, and category for your labeled event. Select if tracking should happen when a user clicks the element, or when it changes. Visual labeling uses the `clicked` event by default. Refine the definition and select filters as needed.
6. Click **Save**. If Amplitude detects an existing event with the same or a similar definition, a warning appears before the event saves. Refer to [Avoid event duplication](#avoid-event-duplication) for details. Amplitude saves the labeled event and displays a confirmation with an option to view the labeled event.
7. Repeat for each event you want to label.
8. You can select another element to continue labeling or click "Back to Amplitude" if you're done.
9. (*Optional*) Click **Navigate** to go to a different part of the site to label more elements on different pages.
When you finish, return to Amplitude where you can manually update the tag, text, selector, and page URL of each labeled event.
{% callout type="note" heading="" %}
If you leave any fields blank, Amplitude interprets that as `[any value]`. For example, if you leave the URL field blank, the tracking for that event fires on any page.
{% /callout %}
### AI-generated CSS selector
Amplitude uses AI to recommend precise CSS selectors for elements on your web page during the visual labeling process. When you click an element to label it, Amplitude automatically suggests a selector that may best capture the intended target.
AI-generated CSS selectors appear on individual elements (such as a button) and on groups of elements (such as a list or product tiles).
The AI pre-fills the **Name** and **Description** fields using contextual understanding of the selected element. You can modify the AI-generated input for these fields at any time.
### Avoid event duplication
When you save a labeled event, Amplitude checks for two types of overlap with existing events and surfaces a warning before you finalize the event:
- **Same definition**: Another labeled event already captures the exact same page element and interaction. Amplitude surfaces the `This labeled event already exists` warning. Click **View** to open the existing event and decide whether to use it instead of creating a new one.
- **Similar page elements**: Another labeled event matches similar page elements, even if the definitions aren't identical. Amplitude surfaces the `Event has a similar definition` warning. Click **View** to compare your new event to the existing events. Amplitude highlights the elements on screen that define each event so you can tell them apart.
Reviewing these warnings before saving helps you avoid duplicate coverage across your tracking plan and keeps your event taxonomy clean. If an existing event covers the same interaction, use it rather than creating a new one.
{% callout type="note" heading="" %}
Visual Labeling prevents saving events with duplicate names or identical definitions. You must resolve a `This labeled event already exists` warning before you can save.
{% /callout %}
## Edit a labeled event
When your site's code changes, you need to update the definition of your labeled events to match. Because Autocapture consistently captures the raw click events, you can update the definition of your labeled events and fix any gaps in your data.
To edit your labeled events, follow these steps:
1. Open Amplitude Data and click **Events**, then select the **Labeled Events** tab.
2. Select the labeled event you want to edit. In the flyout tab, click **Edit**.
3. If your event is no longer collecting data because of a site change, add another condition at the bottom by clicking **Select action...**.
4. Add a new condition based on your new site structure.
### Repair a labeled event
Sometimes, changes to your site's DOM break Visual Labeling's reference to the specific element on your site. You also need to repair a labeled event when an element moves to a different location or its structure changes.
Visual Labeling's repair flow preserves your event history by adding a new `OR` statement with a secondary definition, rather than replacing the original definition. All historical data remains intact while the event begins tracking the new element as well.
To repair a labeled event:
1. Open Amplitude Data and click **Events** in the left rail, then in the main section, click the **Labeled Events** tab.
2. Select a labeled event. In the flyout tab, you can interact with:
* A chart that depicts the number of times Amplitude saw the event over the last 30 days.
* Charts for each definition you've added to the labeled event.
3. To repair an event that doesn't have event volume, click **Repair**. This opens the Visual Labeling flow with the context of the selected event.
4. Select a new element on the page to update the labeled event's definition. The repair process adds this as an additional OR condition to your existing definition, keeping all historical data.
5. Click **Save** to exit the Visual Labeler and apply the updated definition.
### Find misconfigured events
Amplitude provides information to indicate if a labeled event isn't working as it should.
Go to *Data > Events*, and open the Labeled Events tab. The **Recency** column shows the last time Amplitude tracked each event. Events that weren't seen recently may show an issue with the event definition.
## Labeled events and event volume
When you enable Autocapture, Amplitude begins tracking click and page change events on your site. These events count toward your total event volume. Labeled events act like a virtual layer on top of these events, and help define a specific type of click and use that click in an analysis. Labeled events don't impact event volume beyond Autocapture.
For example, a well-instrumented site may record 10,000 events each day, and Autocapture may add as many as 2,000 events each day. The site could experience a 20% increase in daily events. A less-instrumented site may only record 1,000 instrumented events each day. The plugin adding another 2,000 events counts as a 200% increase.
In both cases, the increase in daily events comes from tracking click and page change events. Labeled events don't impact the event count.
## Limitations
- **Event streams**: Labeled events aren't available in live events, or in the event stream in user lookup and Session Replay. The raw `Element clicked` and `Element changed` events are visible instead.
- **Google Chrome extension**: The Amplitude Event Explorer Chrome extension only displays raw events from the browser, so labeled events don't appear.
- **Destination event streaming**: You can't send labeled events to destinations with [event streaming](https://amplitude.com/docs/data/destination-event-streaming-overview). You can use your labeled events to define cohorts and then use cohort syncing to integrate with [other destinations](https://amplitude.com/docs/data/destination-catalog).
- **Content Security Policy (CSP)**: Amplitude requires cross-tab communication between your site and Amplitude. Visual Labeling requires `cross-origin-opener-policy` to be `unsafe-none` or unset.
## Troubleshooting
**I don't see the visual labeling experience on my site**
If the visual labeling tools don't appear on your site, check the following:
- If you have pop-up or adblocking tools enabled, they can interfere with the Visual Labeling experience. Disable the adblocker and retry.
- If the URL you entered redirects to another URL, the visual labeling experience may not load. For security reasons, the domain of the page you're labeling must match the domain you entered in Amplitude. Try using the final URL after any redirects complete.
- Ensure `Cross-Origin-Opener-Policy` is set to `unsafe-none` or unset.
================================================================================
# Debug with the Amplitude Chrome extension
URL: https://amplitude.com/docs/data/chrome-extension-debug
================================================================================
# Debug with the Amplitude Chrome extension
The Amplitude Event Explorer Chrome extension captures every Amplitude event your browser JS SDK fires and displays each event's payload in a popup as you interact with your product. It also surfaces Guides and Surveys trigger state and Web Experiment exposure so you can debug why a guide, survey, or experiment doesn't behave as expected. Install it from the [Chrome Web Store](https://chrome.google.com/webstore/detail/amplitude-instrumentation/acehfjhnmhbmgkedjmjlobpgdicnhkbp).
Use the extension when you need to inspect events at the moment they fire in the browser, with their raw event and user properties. To review events after they arrive in Amplitude and search across users and sessions, use [User Look-up](https://amplitude.com/docs/analytics/user-data-lookup) instead.
{% callout type="note" title="" %}
The Event Explorer displays the `event_type`, even when it has a different display name.
{% /callout %}
## View triggered events
In the Event Explorer, the **Events** tab contains detailed insights into the parameters of each event you trigger on your website. These parameters include `user_id`, `device_id`, `event_properties`, and `user_properties`.
To switch between the different Amplitude projects receiving your events, select the project from the **Project** dropdown. An abbreviated API key distinguishes each Amplitude project.
To clear all the events from your popup, select **Clear Events**.
To hide specific event types, select the **Invisible** icon.
To copy your events' event and user property parameters, select the **Copy** icons.
## View configuration options
To view the [configuration options](https://amplitude.com/docs/sdks/analytics/browser/browser-sdk-2#configure-the-sdk) you've set for each project's SDK, select the **API Options** tab.
## View hidden events
To see a list of your hidden events or to display events on the webpage as they trigger, select the **Settings** tab.
## Guides & Surveys
The extension includes tools to help you debug Guides & Surveys. Use these features to verify SDK setup, troubleshoot why guides or surveys don't show, and test event-based triggers.
{% callout type="tip" %}
The **Guides & Surveys** tab doesn't update live. Wait for the page to finish loading before you review its information.
{% /callout %}
### SDK setup
Verify the Guides & Surveys SDK runs correctly on the page before troubleshooting specific guides or surveys.
The SDK setup section shows the status of four steps:
- **Installed**: The SDK is installed on the page.
- **Initialized**: The SDK is initialized with your configuration.
- **Analytics Connected**: The SDK connects to at least one analytics SDK.
- **Booted**: The SDK received user info and is ready to display guides and surveys based on triggers.
If all checks pass but guides or surveys still don't work, verify these settings:
- **Configuration**: Use **Show config** to verify the API key matches the project where your guide or survey is published.
- **User identification**: Use **Show user info** to verify the `user_id` matches the expected user.
- **SDK installation**: The Guides & Surveys SDK might be installed on some pages but not others. Verify it's installed on all pages where you plan to set up a guide or survey.
- **Boot step**: The boot step might be conditional on certain environments or user types. Make sure it's always called regardless of environment or user type.
### Troubleshoot Guides & Surveys
The troubleshooting section shows all published guides and surveys for the associated project's API key. Each guide or survey displays its trigger conditions and whether those conditions pass.
Open a preview of any guide or survey to see the Preview toolbar and debug individual steps. The preview helps you test the guide's behavior and identify issues with specific steps.
The expanded section also shows why a guide or survey may not show without opening a preview. Check the trigger conditions to see which requirements aren't met:
- **Should show if triggered**: Whether the guide would show if all trigger conditions passed.
- **Trigger conditions**: Built-in throttles, custom throttles, limits, page targeting, snooze settings, and user targeting.
### Forwarded Events
View all events that the Guides & Surveys SDK sees client-side. The SDK only sees client-side events and doesn't have access to server-side events.
Use the Forwarded Events section to:
- View events the SDK has received.
- Simulate test events to trigger guides that depend on specific events.
To test an event-based trigger, enter the event name in the input field and select **Test Event**. The event appears in the logged events list with its timestamp and full event payload.
## Web Experiments
The extension shows granular targeting details for active [Web Experiments](https://amplitude.com/docs/web-experiment) so you can diagnose why an experiment isn't firing. When an experiment runs on the page, the extension displays a **Debugging Details** panel with an overall exposure badge that shows **Exposed** or **Not Exposed** at a glance.
{% callout type="note" heading="" %}
Update to the latest version of the extension to see Web Experiment debugging details.
{% /callout %}
### Audience targeting
The **Audience Targeting** section shows which segment matched and which variant the experiment assigns to the current user. Use it to confirm the user falls into the segment you expect.
### Page targeting
The **Page Targeting** section shows the configured page view rule, whether the current URL matches that rule, and the trigger status. Check this section first when an experiment doesn't fire, since URL mismatches and trigger misconfiguration cause most issues.
### Preview a variant
To QA a specific variant without changing the experiment configuration, use **Preview Variant** to override the variant the experiment assigns to the current user. The override applies only to your session, so it doesn't affect other users or the live experiment.
================================================================================
# Manage your Amplitude Data settings
URL: https://amplitude.com/docs/data/amplitude-data-settings
================================================================================
# Manage your Amplitude Data settings
On the Amplitude Data settings page, you configure and govern your Amplitude Data project, from naming and schema rules to integrations, API tokens, and permissions. Use these settings to:
- Name your project and specify the naming conventions you use for events and properties.
- Specify whether you require team reviews for all changes to main.
- Set the Amplitude projects for your environments.
- Add integrations.
- Generate API tokens.
- Delete your Amplitude Data project.
These settings and features appear on five tabs: General, Environments, Integrations, API Tokens, and Schema Settings. This article describes each tab.
{% callout type="note" heading="" %}
Configure your settings before setting up your first Amplitude Data project.
{% /callout %}
## Roles and permissions in Amplitude Data
{% callout type="note" heading="Role-based Access Controls (RBAC)" %}
For Enterprise organizations with Role-based Access Controls (RBAC) enabled, review the available [Data Roles and Permissions](https://amplitude.com/docs/admin/account-management/role-based-access-controls-rbac#rbac-permission-reference).
{% /callout %}
| Role | Permissions |
| ------- | ------------------------------------------------------------------------------------------ |
| Admin | Configure workspace settings, approve tracking plan changes, and modify the tracking plan. |
| Manager | Approve tracking plan changes and modify the tracking plan. |
| Member | Modify the tracking plan for approval. |
| Viewer | View the tracking plan and comment. |
You can also restrict data management access while keeping permissions the same for other areas of Amplitude. Refer to [The Permissions tab](#the-permissions-tab) for more details.
{% callout type="info" heading="" %}
If you disable the **Require team reviews to make changes to the main branch** option in the project settings, members can modify the tracking plan, but approval isn't required. All other permissions remain the same.
{% /callout %}
## General
The General tab is where you set the project **name**, the event and property **naming conventions**, **team review requirements** for changes on main, and where you **delete your project**. It's also where you find a **public link** to a read-only version of your tracking plan, so you can share it with stakeholders across your organization.
### Naming conventions
Amplitude Data requires a consistent naming convention for events and properties. Without one, your tracking plan becomes harder to read and manage, because multiple events or properties can share the same name with different capitalization.
Specify a custom naming convention, or choose from the following:
- lower case.
- Sentence case.
- Title Case.
- CamelCase.
- lowerCamelCase.
- snake_case.
### Team reviews
For larger teams and organizations, require team reviews for changes made to main. With this option, make any changes to your tracking plan in a branch other than main. Specify the number of reviewers required for approval, up to seven.
### Public link to your tracking plan
To share your tracking plan, use the public link on the **General** tab. Copy it to your clipboard and paste it into an email or Slack message. Stakeholders can read it but can't make changes.
You can also enable or disable the public link, which changes the availability for the selected project. Click **Create Public Link** or **Delete Public Link**.
## Integrations
Integrate Amplitude Data with existing tools to streamline your analytics workflow. To integrate a platform, click **Connect** or **Add** next to its name.
## API Tokens
Use API tokens to authenticate to Amplitude Data using credentials other than your email address and password. Tokens authorize applications to use the same roles and permissions you have when you log in personally.
To create an API token, click **Create Token**. Amplitude Data generates the token and displays it in a modal window.
Click **Copy to clipboard** immediately, because you can't retrieve the token later.
## Schema Settings
Amplitude Data might receive data from your app that it doesn't know what to do with. This is usually the result of a schema violation, meaning your schema doesn't account for the received data. This usually happens when you don't plan for a particular data type or value when first setting up your schema.
Configure your schema settings to tell Amplitude how to handle these situations.
For any unplanned events, event properties, event property types, user properties, or user property types, tell Amplitude Data to either mark them as **unexpected** or to **reject** them outright. Amplitude Data ingests any unexpected events or properties and sends a notification to everyone subscribed to this schema. If you reject unexpected data, Amplitude Data doesn't ingest or store the rejected data, but subscribers still receive a notification.
Click **Save** to apply any changes to your schema settings.
## The Permissions tab
Data permissions restrictions limit who can perform Data Management functions. For example, you might want most users to have the Member role so they can create dashboards and charts, but limit custom event creation and other data management features to managers or administrators.
In the Permissions tab, add restrictions for selected roles to limit data management access while keeping other permissions unchanged for those roles.
Under Restrict access in Amplitude Data, choose from the following options to restrict permissions to the viewer level on a per-project basis:
- Use Default Restrictions.
- Restrict Members.
- Restrict Members and Managers.
Then click **Save**.
Permission restrictions are available for Enterprise customers only. Only administrators can access the Permissions tab.
### Copy to other projects
Click **Copy to Other Projects** to apply the current permission restriction settings to another project.
## Autocapture
The Autocapture settings in Amplitude Data let you change the configuration of the Analytics Browser SDK directly from within Amplitude, so you can make changes without code changes or releases. These settings merge with any configuration you defined locally in your SDK initialization code on your website.
### Availability
Autocapture settings are available on projects that use version 2.10.0 or higher of the [Amplitude Browser SDK](https://amplitude.com/docs/sdks/analytics/browser/browser-sdk-2) with `fetchRemoteConfig` enabled.
To disable remote configuration, set `fetchRemoteConfig` to `false`. Disabling `fetchRemoteConfig` doesn't disable the remote configuration options in Data Settings.
{% callout type="note" heading="Remote configuration by default" %}
SDK version 2.16.1 and higher enable `fetchRemoteConfig` by default.
{% /callout %}
### How it works
When the SDK initializes with `fetchRemoteConfig` enabled, the SDK retrieves configuration settings from Amplitude's servers using the project's API key. These remote settings merge with any local configuration you defined on your site. After merging, the SDK completes its initialization along with any plugins using this combined configuration. Remote configuration doesn't impact the load time of pages on your site but may impact SDK initialization time.
{% callout type="note" heading="Configuration timeout" %}
If the configuration takes longer than 5 seconds to load from Amplitude's servers, the SDK falls back to the local configuration set during initialization.
{% /callout %}
On the Settings page, each configuration category offers three options:
* **Default**: Keeps the local configuration in the SDK as-is. Settings in the UI don't override it.
* **On**: Overrides the local configuration and sets the category to true. All settings within the category (for example, Element Interactions) follow the configuration in the UI.
* **Off**: Overrides the local configuration and sets the category to false.
{% callout type="note" heading="Disabling Session Tracking" %}
If you use Session Replay, ensure your Session Replay SDK version is 1.12.1 or above.
{% /callout %}
Changes made through the UI take effect after 10 minutes.
### Element interactions
When you enable Element Interactions, several options appear:
| Option | Purpose |
| ---------------------- | -------------------------------------------------------------------------------------------------------------------------------------------------------------------- |
| CSS Selector Allowlist | Selectors for elements that users interact with, such as links and form elements. If you have custom or non-standard elements that users interact with, specify them here. |
| Action Click Allowlist | Amplitude tracks the elements in this list only when a user clicks them and the click results in a page or DOM change. |
| Page URL Allowlist | Specify URLs or URL patterns (using glob or regular expression) on which Amplitude tracks element click and change events. |
| Data Attribute Prefix | Specify a prefix for data attributes, for example `data-amp-track`. Amplitude saves the value of these attributes as event properties. |
[Zoning Insights](https://amplitude.com/docs/zoning-insights) also uses element interaction data to analyze engagement within defined areas of your pages. To use Zoning Insights, enable element interactions (and optionally configure allowlists) here or in your [Browser SDK](https://amplitude.com/docs/sdks/analytics/browser/browser-sdk-2#track-element-interactions) initialization.
{% callout type="tip" heading="Lower event volume" %}
These options can help you control event volume. By ignoring dead clicks, the Action Click Allowlist is the most efficient method to reduce volume while still tracking relevant interactions.
{% /callout %}
================================================================================
# Data backfill
URL: https://amplitude.com/docs/data/data-backfill
================================================================================
# Data backfill
A data backfill loads historical events into your project so past user activity appears alongside your current data. You can import historical data to Amplitude using the [Batch Event Upload API](https://amplitude.com/docs/apis/analytics/batch-event-upload).
## Considerations
Review these considerations before backfilling data.
- Consider keeping historical data in a separate Amplitude project instead of backfilling into a live production project. Keeping historical data separate makes the upload easier and keeps your live Amplitude data clean and focused on current and future data. You typically don't need to check historical data often, but you still want it available. Historical user property values overwrite current live values during a backfill. Amplitude syncs the out-of-date property values onto new live events. To skip user property sync, add the following to your event payload: `"$skip_user_properties_sync": true`.
- To connect historical data with current data, combine the historical data and live data in the same project. To connect users from each dataset, the users need matching Amplitude user IDs in each set.
- The new user count might change. Amplitude defines a new user based on the *earliest* event timestamp it sees for a given user. If Amplitude records a user as new on June 1 2021 and you backfill data for the user from February 1 2021, then Amplitude defines the user as new on February 1 2021.
- Backfilling can compromise your app data. If a mismatch exists between the current user ID and the backfilled user ID, Amplitude interprets the two distinct User IDs as two distinct users. As a result, Amplitude double-counts users. Because Amplitude can't delete data after it's recorded, you might have to create a new project to prevent data issues.
- Amplitude uses the Device ID and User ID fields to compute the Amplitude ID. For more information, refer to [Track unique users](https://amplitude.com/docs/data/sources/instrument-track-unique-users).
- Events in the backfill count toward your monthly event volume.
## Limits
Keep these limits in mind when backfilling data.
- **Daily limit**: An ingestion daily limit of 500K events per device ID (and per user ID) applies to each project to protect Amplitude from event spam. This limit uses a 24-hour rolling window of 1-hour intervals. A user or device can send at most 500K events in the last 24 hours at any given time. If you hit this limit, you get `exceeded_daily_quota_users` or `exceeded_daily_quota_devices` in the response. For more information, refer to [Batch Event Upload](https://amplitude.com/docs/apis/analytics/batch-event-upload#daily-limit).
- **Batch limit**: An upload limit applies of 100 batches per second and 1000 events per second. You can batch events into an upload, but Amplitude recommends sending no more than 10 events per batch. Amplitude throttles your upload if you send more than 10 events per second for a single device ID. For more information about throttling, refer to [Batch Event Upload](https://amplitude.com/docs/apis/analytics/batch-event-upload#code-429-explained). To avoid overloading your ingestion workers, Amplitude recommends limiting backfill event upload to 300 events per second per device ID. Backfills can exceed 300 events per second if you iterate through historical data and send data as fast as possible in parallel.
## Backfill best practices
- Review the documentation for the [Batch API](https://amplitude.com/docs/apis/analytics/batch-event-upload). If you exported historical data using the Export API and want to use the data to backfill, note that the exported fields aren't in the same format as the fields needed for import. For example, the Export API uses `$insert_id`, while HTTP and Batch APIs use the format `insert_id` without the `$`.
- Decide which fields to send and map your historical data to Amplitude fields. Amplitude strongly recommends that you use the `insert_id` field to deduplicate events.
- Because no way exists to undo an import, create a test project in Amplitude to send sample data from your backfill. Run several tests with a few days' worth of data in an Amplitude test project before the final upload to the production project.
Amplitude recommends this approach for backfilling large amounts of data:
1. Break up the set of events into mini non-overlapping sets (for example, partition by `device_id`).
2. Have one worker per set of events run these steps:
1. Read many events from your system.
2. Partition those events into requests based on `device_id` or `user_id`.
3. Send your requests concurrently or in parallel to Amplitude.
To optimize further, add aggressive retry logic with high timeouts. Continue to retry until you receive a 200 response. If you send an `insert_id`, Amplitude deduplicates data that has the same `insert_id` sent within 7 days of each other.
### Skip user properties sync
When Amplitude captures an event, it includes the current values for each user property, which can change over time. When Amplitude receives an event with user properties, it updates the existing user properties and adds any new user properties. To change this behavior, add `"$skip_user_properties_sync": true` to the event payload.
When you include `"$skip_user_properties_sync": true`, Amplitude ignores the user properties table completely. The event has only the user properties sent with the event, doesn't update the user properties table, and doesn't display any preexisting user properties.
{% callout type="example" heading="" %}
For example, you send the following event to Amplitude. The user property table already has the user property `"city": "New York"`.
```json
{
"api_key": "API_KEY",
"events": [
{
"user_id": "b4ee5d78-e1b6-11ec-8fea-0242ac120002",
"insert_id": "97b74bc6-a8c8-48f3-bbc7-de9f95aea636",
"device_id": "",
"event_type": "Button Clicked",
"user_properties":{
"subscriptionStatus":"active"
}
}
]
}
```
The event appears in Amplitude as:
```json
"events": [
{
"user_id": "b4ee5d78-e1b6-11ec-8fea-0242ac120002",
"insert_id": "97b74bc6-a8c8-48f3-bbc7-de9f95aea636",
"device_id": "",
"event_type": "Button Clicked",
"user_properties":{
"city":"New York",
"subscriptionStatus":"active"
}
}
]
```
You include `"$skip_user_properties_sync": true` and send the same event. The event appears in Amplitude like this:
```json
"events": [
{
"user_id": "b4ee5d78-e1b6-11ec-8fea-0242ac120002",
"insert_id": "97b74bc6-a8c8-48f3-bbc7-de9f95aea636",
"device_id": "",
"event_type": "Button Clicked",
"$skip_user_properties_sync": true,
"user_properties":{
"subscriptionStatus":"active"
}
}
]
```
The event doesn't include the city property.
Next, you include `"$skip_user_properties_sync": true` and send this event:
```json
{
"api_key": "API_KEY",
"events": [
{
"user_id": "b4ee5d78-e1b6-11ec-8fea-0242ac120002",
"insert_id": "97b74bc6-a8c8-48f3-bbc7-de9f95aea636",
"device_id": "",
"event_type": "Button Clicked",
"$skip_user_properties_sync": true,
"user_properties":{
"city":"San Francisco"
}
}
]
}
```
Amplitude doesn't update the user properties table, and the event appears in Amplitude like this:
```json
"events": [
{
"user_id": "b4ee5d78-e1b6-11ec-8fea-0242ac120002",
"insert_id": "97b74bc6-a8c8-48f3-bbc7-de9f95aea636",
"device_id": "",
"event_type": "Button Clicked",
"user_properties":{
"city":"San Francisco"
}
}
]
```
Any new event still has `"city":"New York"`, but this event displays `"city":"San Francisco"`.
{% /callout %}
### Timing
If you send data with a timestamp 30 days or older, it can take up to 48 hours to appear in some parts of Amplitude. Use the [User Activity tab](https://amplitude.com/docs/analytics/user-data-lookup) to check the events you're sending, because that tab updates in real time regardless of the event time.
### Resources
- Example scripts for data import: <https://gist.github.com/djih/2a7e7fb2c1d45c8277f7aef64b682ed6>
- Example data: <https://d24n15hnbwhuhn.cloudfront.net/sample_data.zip>
## Data ingestion system
In Amplitude's ingestion system, each user's current user properties are tracked and synced to a user's incoming events.
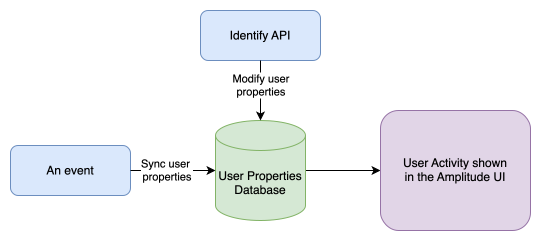
When sending data to Amplitude, you either send event data or send `identify` calls to update a user's user properties. These `identify` calls update a user's current user property values and affect the user properties attached to events received after the `identify` call.
{% callout type="example" heading="" %}
The Datamonster user has one user property, 'color', set to 'red'. Datamonster logs a 'View Page A' event and triggers an `identify` that sets 'color' to 'blue'. Afterward, Datamonster logs a 'View Page B' event:
1. `logEvent` -> 'View Page A'
2. `identify` -> 'color':'blue'
3. `logEvent` -> 'View Page B'
If Amplitude receives events from Datamonster in that exact order, you'd expect 'View Page A' to have 'color' = 'red' and 'View Page B' to have 'color' = 'blue'. Amplitude maintains the value of user properties at the time of the event. For this reason, the order in which events are uploaded matters. If the `identify` arrives after 'View Page B', then 'View Page B' has 'color' = 'red' instead of 'blue'.
{% /callout %}
Because Amplitude processes all of a user's events using the same ingestion worker, Amplitude guarantees that it processes events in the order it receives them. All Datamonster's events queue in order on a single ingestion worker. If two separate workers processed these events in parallel, ordering would be harder to guarantee. For example, one worker might run faster than another.
Because a single ingestion worker processes a user's events, a user sending an abnormally high number of events in a short period can overload that worker. To avoid overloading your ingestion workers, Amplitude recommends limiting event upload to 300 events per second per device ID. Backfills can exceed 300 events per second if you iterate through historical data and send data as fast as possible in parallel. Amplitude tracks each device ID's event rate and rejects events with a 429 throttling HTTP response code if a device ID sends too many events. If you receive a 429 in response to an event upload, the process should sleep for a few seconds and then keep retrying the upload until it succeeds. This approach ensures that events aren't lost in the backfill process. If you don't retry after a 429 response code, Amplitude doesn't ingest that batch of events.
## Backfill preexisting users
If you have preexisting users, backfill them to accurately mark when they became new users. Amplitude marks users new based on the timestamp of their earliest event.
To backfill your preexisting users, use the [Batch API](https://amplitude.com/docs/apis/analytics/batch-event-upload). Send a placeholder event or a signup event where the event timestamp is the actual time the user was originally created. For example, if a user signed up on Aug 1st, 2022, the timestamp of the event you send should be Aug 1st, 2022.
================================================================================
# Plan your taxonomy
URL: https://amplitude.com/docs/data/data-planning-playbook
================================================================================
# Plan your taxonomy
A taxonomy defines which events and properties you track, what you name them, and how they fit together. A solid taxonomy keeps analyses consistent, prevents data gaps, and avoids costly schema rework later. This playbook walks through the three steps to build one: define business objectives, break down key metrics, then optimize the resulting events and properties.
Use this playbook when you're designing a tracking plan by hand or auditing an existing one. If you'd rather have Amplitude propose events from your codebase automatically, use the [Amplitude Wizard CLI](https://amplitude.com/docs/get-started/setup-wizard-cli) instead.
## What is a taxonomy
A taxonomy is a set of hierarchical classifications and naming conventions for your data. A taxonomy identifies and categorizes your event and user data so that Amplitude can generate relevant and valuable insights. The process of setting up a taxonomy in Amplitude differs from organization to organization, but the core steps are selecting the events you want to track, identifying event properties and user properties to track, and naming them.
## Users, events, and properties
Amplitude's analyses use a combination of events and properties attached to your users.
### Users
A user represents a unique individual taking an action or engaging in an activity related to your application. Amplitude uses multiple methods to identify and reconcile your users across various devices.
You can learn how Amplitude tracks unique users, including how to reconcile anonymous users before login.
### Events
An event is a distinct action or activity a user takes within your product. Events can be active when a user interacts with your app (for example, starting a game or adding to their cart), or inactive (the user receives a push notification).
When naming events, Amplitude recommends establishing a consistent naming convention that uses:
- **Consistent capitalization**: Amplitude captures `Song Played` and `song played` as two separate events. This naming convention helps prevent messy data, especially when multiple teams send the same event.
- **A consistent syntax**: `Song Played` and `Played Song` are also separate events. For example, a standard of `[Noun]` + `[Past-Tense Verb]` ensures all your events stay consistent.
- **A consistent actor**: Does `Message Sent` mean that the user sent a message, or that you sent a message to the user? If all your events use the user's perspective, the meaning is clear immediately.
Default events use Title Case from the user's perspective, with `[Noun]` + `[Past Tense Verb]`. You can also establish your own convention as long as you stay consistent.
### Properties
Properties are attributes that help define details around your events and users:
- **Event properties** are attributes that describe details specific to a particular instance of an event. For example, if you have a `Purchase Completed` event, you can specify what the user purchased, the total value of the order, and the payment method used.
- **User properties** are traits that describe the user and apply across all the user's future events until the properties are modified. Amplitude's SDK captures several user properties by default, and you can also set up your own properties to track.
Learn more about the differences between [events and user properties](https://amplitude.com/docs/data/user-properties-and-events). As with events, establish a naming convention with consistent casing.
## Step 1: Define your business objectives
Starting with your goals and metrics helps ensure you've prioritized the most important ones for your implementation. For example:
- What are you and your team working toward?
- What metric are you trying to optimize?
- What questions do you want to answer with data?
Some typical goals Amplitude customers pursue include:
- Improving acquisition ROI.
- Finding the "aha" moment in the product.
- Optimizing conversion.
- Increasing user retention and LTV.
After you identify your organization's overarching goals, it's easier to break them down into individual metrics and ensure your tracking plan measures the outcome you want.
For example, suppose you have an e-commerce app and want to increase purchases. You can do this by:
- Increasing the conversion rate of users through your purchase flow.
- Increasing the number of users who make multiple purchases.
- Increasing the number of users coming to your app.
Each of these can be an input metric to achieve your goal. Prioritize these input metrics so you can answer the most important question first. Consider an iterative approach, where you plan and instrument your most important metrics, then iterate later to add more.
## Step 2: Break down your key metrics
After you know your ultimate goal and have hypotheses about how to accomplish that goal, break down those input metrics further. What critical paths do your users take, and how do they involve each of those metrics? What actions are essential to each of those paths?
Suppose you start with increasing the conversion rate of users through your purchase flow. What are users' critical interactions with your application through the purchase flow? They could be:
- **Search completed**: The user searched for an item to purchase.
- **Product details viewed**: The user viewed the details of an item.
- **Product added**: The user added an item to their order to purchase.
- **Order reviewed**: The user viewed the items in their order before purchase.
- **Order completed**: The user made a purchase and completed their order.
For each of these, think about the various factors involved in each step. For example:
- When using search, what term did the user search for?
- When the user viewed an item, what was the `Product ID` for the item purchased?
One helpful technique is to think about the objects involved with each action and include attributes of those actions in each event. For example, an item in your system likely has an ID, a category, and a price, all properties you can add to events related to your items.
## Step 3: Optimize your events and properties
It's time for final optimizations on your plan. Ask yourself these questions.
### Do you have multiple events for similar actions
Suppose you have two user actions you can capture as two separate events, or as a single event with a property distinguishing the two distinct cases.
For example, suppose you believe payment method is a critical factor. Should you instrument:
- `Order Completed` as a single event with a `Payment Method` property that captures `Credit Card` or `Apple Pay`, or
- Separate events for `Credit Card Order Completed` and `Apple Pay Order Completed`?
Consider these factors:
- Start with your key metrics. In this case, while the purchase method is important, the key metric is the purchase flow conversion. A single `Order Completed` event is easier to include in a funnel to view the overall purchase flow conversion.
- Is the event scalable? In this example, what happens when you introduce PayPal as a new payment method? Any chart measuring overall conversion would need an update. You'd also be using three events for an interaction where one is enough.
- Do you want to identify these separately in [Journeys](https://amplitude.com/docs/analytics/charts/journeys/journeys-understand-paths)? If so, a single `Order Completed` event is probably fine. If you made all your events `Page Clicked` instead, a series of these generic events is unlikely to help when looking at a user flow.
### Are your property definitions consistent across your events
Even though event properties are specific to each event, define them consistently across your taxonomy. For example, instead of having a property called `Type` that could represent the type of an item in one event and a type of payment in another, consider separate properties: `Item Type` and `Payment Type`.
### Are your properties captured across all applicable events
One typical use case for event properties is tracking values that must hold constant to count toward funnel conversion. For example, suppose you want to know how often users add to cart after viewing details:
- Step 1: `Product Details Viewed`
- Step 2: `Product Added`
Here, users should count as having converted through the funnel only if they triggered the event on the same product. To ensure this, instrument the event property `Product ID` and require the funnel to hold this value constant. Every event in the funnel must have that property for the holding constant feature to work.
- Step 1: `Product Details Viewed`
- `Product ID` = `3345`
- Step 2: `Product Added`
- `Product ID` = `3345`
- `quantity` = `1`
In this example, you can understand how often a user adds to their cart after viewing an item. Without the `Product ID`, you'd be analyzing how often a user adds any item to their cart after viewing any item.
## AI-assisted taxonomy planning
Amplitude's MCP plugin includes skills that automate the most time-consuming parts of taxonomy design and event instrumentation. Install the plugin from the [Amplitude MCP Marketplace](https://github.com/amplitude/mcp-marketplace) to unlock all six skills in Claude Code, Cursor, or any MCP-compatible editor.
### Taxonomy and governance skills
| Skill | What it does |
| --------------------------------------- | ----------------------------------------------------------------------------------------------------------------------------------------------------------------------------------------------- |
| `amplitude:taxonomy` | Source of truth for naming conventions, property standards, scoring frameworks, deprecation procedures, and AI-readiness guidance. Use when creating or auditing a tracking plan. |
| `amplitude:discover-analytics-patterns` | Scans your codebase for existing analytics call patterns and SDK imports to surface naming conventions. Run this before writing any new instrumentation to help you match what's already there. |
### Automated instrumentation pipeline
Use `amplitude:add-analytics-instrumentation` as a single entry point. It runs the full pipeline end-to-end for a given PR, branch, file, or feature description, and outputs a concrete instrumentation plan you can hand to engineering.
Internally, three sub-skills run sequentially:
1. **`amplitude:diff-intake`**: Reads a PR or branch diff and produces a structured summary of which files changed, which user-facing surfaces the changes affect, and the overall analytics scope.
2. **`amplitude:discover-event-surfaces`**: Given that summary, generates a prioritized list of candidate events organized by business outcome, user journey, feature success, and friction.
3. **`amplitude:instrument-events`**: Given the candidate events, outputs exact insertion points in your code, recommended event names, descriptions, categories, and properties that meet Amplitude's AI-readiness guidelines.
The skills are open source: [Amplitude MCP Marketplace on GitHub](https://github.com/amplitude/mcp-marketplace/tree/main/plugins/amplitude/skills).
### Configure the instrumentation pipeline
Two repo-level files let you tailor the pipeline to your codebase and direct events to the correct Amplitude projects.
#### Project mapping (`.amplitude/instrumentation-agent.yaml`)
When your repo sends analytics to more than one Amplitude project, create a mapping file at the repo root so the `instrument-events` skill can route each event to the right project. Without this file, the skill pauses and asks you to create one, scan the repo to propose one, or continue with a single app ID.
```yaml
rules:
- pattern: "**" # catch-all — default project for all paths
app_ids: [4567]
- pattern: "src/web/**" # this directory and everything under it
app_ids: [1234]
- pattern: "packages/shared/**"
app_ids: [1234, 4567] # shared code goes to both projects
```
Rules apply last-match-wins. Find your app IDs in _Settings > Projects_ in Amplitude.
When the mapping file exists, the skill marks each event with a confidence level. Amplitude adds only high-confidence events (those whose file paths matched a rule) to the tracking plan automatically. The skill surfaces low-confidence events separately with an explanation so you can resolve the path and re-run.
#### Repo instrumentation context (`.amplitude/instrumentation-agent-context.md`)
Create an optional context file at the repo root to give the instrumentation agent your project's conventions. The `instrument-events` and `discover-analytics-patterns` skills read this file first, and anything it specifies takes precedence over conventions inferred from the codebase or the Amplitude MCP server.
Include any combination of:
- Event and property naming rules (for example, "Title Case, object-action: Checkout Completed")
- Required properties for every event
- SDK or analytics wrapper patterns to follow
- Domain terminology or a glossary
- Pointers to other reference files already in your repo
```markdown
# Instrumentation context
## Conventions
- Event names: Title Case, object-action ("Checkout Completed")
- Properties: snake_case
- Required properties: user_id, session_id, platform
## Reference files
- docs/analytics/taxonomy.md
- src/analytics/README.md
```
If the file is missing, the skill continues and notes that you can add it to improve future runs.
## Next steps
Refer to the steps in this playbook as you add new features or iterate on your product analytics. Amplitude Data provides ways to create and iterate on your plan directly in the product, or by importing a CSV file.
For more specific examples, go to the following industry-specific best practices guides for sample use cases, business questions, taxonomy recommendations, and complementary dashboards. Each guide addresses the specific needs of these sectors:
- [E-commerce](https://analytics.amplitude.com/share/8f32b20708e743e597b75c99b7a766d5).
- [Fintech](https://analytics.amplitude.com/share/cbb3827995aa4d03852a3cdf9a3c46b0).
- [Publications](https://analytics.amplitude.com/share/5940753342e04394bd0379cdd952cc18).
- [Streaming Media](https://analytics.amplitude.com/share/6f40a915c14144b8ac992a5a8d7cf7cb).
- [B2B](https://analytics.amplitude.com/share/0f7a78fadfc145d0b99e365eb41d9262).
- [Healthcare](https://app.amplitude.com/analytics/share/6e938acce69d459bbb81561b2f942079).
================================================================================
# Privacy and consent implementation guide
URL: https://amplitude.com/docs/data/privacy-and-consent-implementation
================================================================================
# Privacy and consent implementation guide
You can set up Amplitude in a privacy-friendly way. The right setup depends on your policy, your region, and how much data you want to collect before consent. Before you choose a method, align with your legal and privacy teams on what's allowed in your case.
A good way to think about this: first choose your consent model, then configure storage and access in Amplitude to match it.
## Using this guide
This guide helps you implement a privacy-conscious analytics setup in Amplitude. It doesn't replace legal advice. Your team decides which consent model, disclosures, and regional requirements apply to your business. This guide shows you practical ways to implement those choices in Amplitude.
There's no single setup that fits every company. Some organizations need strict opt-in before analytics starts. Others may use a more limited measurement-only approach in some regions. The right choice depends on your product, your data, and the rules that apply where you operate.
Use this guide as a decision and implementation framework:
1. Choose the consent method that fits your policy.
2. Configure Amplitude to match that method.
3. Add the governance, retention, and deletion controls you need.
4. Validate the setup before launch.
The guide covers common implementation patterns and the controls most teams need first. For complex use cases, use it as a starting point and identify the decisions to make with your legal, privacy, and security teams.
## Before you start
Before you configure anything, answer these three questions:
1. Do you need consent before analytics starts?
2. Do you want to collect no data, or limited anonymous measurement, before consent?
3. Which fields should reach Amplitude at all?
You're responsible for obtaining any required consent, making the right disclosures, and deciding how to classify Amplitude cookies in your policy.
A practical starting point is to write down:
- which events you want to collect.
- which identifiers you want to store.
- which properties are sensitive.
- what should happen when a user declines consent.
- what should happen when a user grants consent after an initial decline.
That one-page decision document makes the implementation much easier to review and test.
{% callout type="note" heading="How to classify Amplitude cookies in your CMP" %}
Most organizations classify Amplitude's analytics cookies as analytics or performance cookies, not marketing cookies. If your consent banner separates cookie categories, configure Amplitude under the analytics or performance category in your consent management platform.
In limited circumstances, such as when Amplitude is used only for feature flagging or for Session Replay in a security or debugging context, the relevant cookies may qualify as "necessary." Your legal team should confirm the correct classification for your specific use case.
{% /callout %}
## Choose the setup that fits your policy
### Method 1: Ask for consent and collect data only from users who consent
This is the clearest option if your policy requires consent before analytics begins. It's also the easiest model to explain to users and auditors because nothing starts until the user grants consent.
#### How it works
In Browser SDK 2, the SDK may create Amplitude cookies as soon as it initializes. If you need to avoid cookies before consent, don't initialize the SDK until the user has consented.
#### How to set it up in Amplitude
Only call `amplitude.init()` after consent is captured. Let your site load normally, and hold off on initializing until your consent tool confirms that analytics is allowed.
```javascript
import * as amplitude from '@amplitude/analytics-browser';
// User hasn't consented yet.
// Don't initialize the SDK here.
function onConsentGranted() {
amplitude.init('API_KEY');
}
```
If you need to anonymize a user after logout, call `amplitude.reset()`. This clears the `userId` and creates a new `deviceId`. The next activity appears as a new anonymous user until the user signs in again.
#### What to do outside Amplitude
Use your CMP to control whether initialization happens. Amplitude doesn't provide a default CMP integration, so your CMP needs to pass the consent outcome into your Amplitude implementation.
#### Centralize SDK initialization
Make `amplitude.init(...)` run from one place only. If several teams initialize the SDK in different parts of the site, proving that tracking is gated by consent becomes much harder.
When you test this setup, open your browser developer tools and confirm that no Amplitude cookies are present before consent.
### Method 2: Ask for consent, but collect limited anonymous measurement from users who don't consent
Some organizations want a middle ground: full analytics for users who consent, and very limited measurement for users who don't. This can be appropriate only when your legal team confirms that this kind of limited audience measurement is allowed in your jurisdictions.
#### How it works
Keep this method limited to anonymous or strongly minimized audience measurement, such as total traffic or page views. Don't let it turn into user-level behavioral analysis.
Rules can vary across Europe, so treat local regulatory guidance as part of the implementation decision. France is one well-known example: the [Cookies and consent management guide](https://amplitude.com/docs/sdks/analytics/browser/cookies-and-consent-management) describes the CNIL exemption as a narrow case for anonymous statistical audience measurement without consent, not full analytics. It's a useful reference point, but don't treat it as the default rule for every European market.
{% callout type="warning" heading="CNIL self-certification requirement" %}
Qualifying for the CNIL exemption requires completing a formal self-certification process with CNIL. If you're pursuing this route, work with your legal team to confirm your setup meets the certification criteria before relying on this exemption.
{% /callout %}
#### How to set it up in Amplitude
For the limited anonymous flow, reduce or remove persistent identity:
- Set `identityStorage` to `none` if you don't want persistent browser identity.
- Set `identityStorage` to `session` if you want to track users within a single session but not across sessions. This is a useful middle ground for some implementations.
- Avoid sending a stable `userId`.
- Keep the event set small and focused on aggregate traffic measurement.
```javascript
amplitude.init('API_KEY', {
identityStorage: 'none',
});
```
You can also shorten cookie duration if your policy allows cookies but you want a more conservative setup.
#### What to do outside Amplitude
Decide exactly which events belong in the anonymous flow. Keep that list short. For most teams, that means page views, traffic totals, and other high-level measurement only.
If you need stronger control, [send data through your own proxy before it reaches Amplitude](https://amplitude.com/docs/data/use-domain-proxy-to-relay-events). A domain proxy can help you filter, block, or anonymize data before forwarding it.
#### Keep the anonymous flow narrow
If you choose this method, be disciplined. Don't quietly turn a "limited anonymous measurement" flow into full behavioral analytics over time. The more your anonymous flow starts to look like user analysis, the weaker your privacy position becomes.
## Keep consented and non-consented data in separate projects
If you collect both consented analytics data and a limited non-consented measurement stream, always keep them in separate Amplitude projects. Mixing the two into a single project creates problems that are difficult to untangle later. Three reasons to be strict about this from the start:
- **Reporting integrity**: non-consented data uses minimized or rotating identifiers, so user-level metrics like uniques, funnels, and cohorts behave very differently from your consented data. Keeping them separate makes it clear which numbers mean what.
- **Risk of unintended user stitching**: Amplitude resolves identity at the organization level, not the project level. If the same user ID or device ID appears in both projects, Amplitude treats them as the same user. If your non-consented project wasn't designed with this in mind, you may inadvertently link anonymous data to identified users across projects.
- **Access control**: the non-consented project should have tighter controls. Disable individual user-level event lookup so analysis stays at the aggregate level. This is much easier to enforce when the data is already in its own project.
### Configure the non-consented project more strictly
[Separate projects](https://amplitude.com/docs/admin/account-management/manage-orgs-projects) let you configure the non-consented stream differently from the start. In practice, that usually means using the stricter setup in the non-consented project: no cookies, no persistent storage, no stable user ID, and a minimal event set.
### How to set it up
A common setup looks like this:
- one project for consented users, where full analytics begins after consent.
- one project for non-consented users, where you only send the limited anonymous measurement events your policy allows.
When a visitor hasn't consented, route the allowed events to the non-consented project. If the visitor later gives consent, initialize Amplitude with the consented project and begin normal tracking there.
If you use this approach, make sure your identity strategy is intentional in both projects. Across projects in the same organization, Amplitude assumes that the same user ID or device ID refers to the same user. That's useful for legitimate cross-project analysis, but it also means you should be careful not to reuse identifiers across consent states unless that matches your legal and implementation model.
### Restrict user-level access where appropriate
For some teams, separating projects isn't enough on its own. They also want the project that contains non-consented data to have tighter access to user-level views.
In those cases, review whether features such as [User Lookup](https://amplitude.com/docs/analytics/user-data-lookup), user profiles, user streams, or similar user-level surfaces should remain available for that project. This is especially relevant if the project contains anonymous or non-consented data and your privacy posture is meant to avoid individual-level exploration.
As a practical rule, many teams want a stricter setup for the non-consented project and a more standard setup for the consented one. If you need that kind of project-specific restriction, discuss it with your Amplitude team as part of the implementation design so they apply the right controls for your organization.
#### Disabling User Lookup at the project level
In addition to DAC and RBAC, Amplitude supports disabling the User Lookup feature at the project level. When your Amplitude team enables this setting, team members can't access individual user event streams from contextual menus in charts and dashboards (for example, the microscope icon that opens a user's event stream).
This control is especially relevant when your privacy posture requires analysis to happen at the aggregate level only, and you want to prevent access to raw individual-level user events. For example, to comply with CNIL requirements in France, the exemption for analytics without consent applies only to aggregate statistical measurement.
Your Amplitude team manages this setting at the project level. To apply it, contact your Amplitude team so they can enable it as part of your project configuration. You can also control broader user-level access using [RBAC](https://amplitude.com/docs/admin/account-management/roles-and-permissions), but the User Lookup control is separate and more targeted, specifically for disabling individual event stream access.
### Use Portfolios to combine top-line reporting
If you want to analyze consented and non-consented projects together, use a Portfolio view.
[Portfolio](https://amplitude.com/docs/analytics/portfolio) lets you combine multiple projects into one cross-project view so you can build charts across them. This is useful when you want a broader picture of traffic or activity across consent states without collapsing the underlying implementations into one project.
A good pattern is to:
- keep the data collection separate.
- use a Portfolio to report across both projects where that makes sense.
- set expectations clearly about what can and can't be combined.
For example, top-line event counts may be useful across both projects, while user-level metrics require more caution. If the non-consented project uses minimized identity, don't expect Portfolio reporting to recreate the same kind of user continuity you have in the consented project.
#### Document the routing rules
If you adopt the separate-projects pattern, document it clearly for both implementers and analysts. Teams should know:
- which events go to which project.
- when traffic moves from the non-consented project to the consented project.
- which identifiers are allowed in each project.
- which user-level features should be restricted in the non-consented project.
- which charts should use the Portfolio view versus a single source project.
This is one of the most practical ways to support privacy-sensitive measurement while keeping your analytics setup understandable and maintainable.
{% callout type="note" heading="When a non-consented user gives consent mid-session" %}
If a visitor initially arrives without consenting and later grants consent on the same visit, you need to handle the transition explicitly. The recommended approach is:
1. Stop sending to the non-consented project. After the user grants consent, stop routing events to the anonymous measurement project.
2. Initialize Amplitude with the consented project key. Call `amplitude.init()` with your consented project's API key and, if the user is now identified, set their `userId` at this point.
3. Don't attempt to retroactively link pre-consent activity to the now-identified user, unless your legal model explicitly allows it. The anonymous events from before consent should stay anonymous.
This ensures a clean boundary: pre-consent activity stays in the anonymous project with no stable identity, and post-consent activity begins fresh in the consented project under the user's real identity.
{% /callout %}
### Method 3: Don't ask for consent, but reduce identifiers and data collection where your policy allows it
In some regions or use cases, your legal team may decide that consent isn't required for your analytics setup. If so, you can still make that setup more privacy-friendly by limiting identifiers, shortening storage, and minimizing what you send.
#### How to set it up in Amplitude
Choose the storage mode that matches your policy:
- `cookie` for standard browser persistence.
- `localStorage` if you prefer browser storage without cookies.
- `none` if you want no persistent identity.
If you use `localStorage`, remember that it's limited by subdomain. A user on one subdomain won't automatically carry the same stored identity to another.
If you use `identityStorage: "none"`, Amplitude generates a new `device_id` on every page load (or app start), because there's no stored identity to reuse between loads.
{% callout type="note" %}
Amplitude generates a new `device_id` on each page load or app start, not on each individual event. All events fired within the same page load share the same `device_id`. As soon as the user closes the tab or restarts the app, the next page load generates a completely new `device_id` with no link to the previous one. You can't reconstruct cross-session user journeys, which is the intended behavior for strict anonymization.
{% /callout %}
#### What to do outside Amplitude
Make sure your privacy notice matches what you're actually doing. If you're not asking for consent, your policy should still explain what you collect, why, and how users can opt out if that applies to your model.
#### Minimize data by default
Even when consent isn't required, data minimization is still a good default. Collect what you need, not what happens to be available.
## Use a proxy when you want tighter control
A [domain proxy](https://amplitude.com/docs/data/use-domain-proxy-to-relay-events) is useful when you want more control over what reaches Amplitude. It lets you send tracking requests through your own domain and can help with filtering, blocking, debugging, audit logging, and anonymization before forwarding data to Amplitude.
This is especially helpful if you want to remove fields such as IP address, location, or `userId` before data leaves your environment. A proxy isn't the only way to do this. You can also exclude or suppress specific fields directly in the SDK at initialization time, which is easier when you only need to strip a small number of fields client-side.
{% callout type="note" %}
You can configure the Amplitude SDK at initialization time to suppress or exclude specific fields before any data leaves the client. For example, you can pass options in `amplitude.init(...)` to prevent IP address or user ID from being transmitted. The SDK config approach is simpler when you only need to strip a small number of fields client-side. A proxy is the better choice when you need centralized control, server-side enforcement, audit logging, or want the filtering to happen outside the client entirely, so that sensitive fields never leave your infrastructure at all.
{% /callout %}
If you build a proxy, involve your developer operations and information security teams early.
## Keep noisy traffic out of your data
Privacy settings work better when your data is also clean.
### Block bot traffic
If you track public web traffic, bot traffic can distort your metrics. Amplitude lets you create a [block filter](https://amplitude.com/docs/data/block-bot-traffic) so this data is never ingested in the first place.
To set it up:
1. Go to your project's *main* branch.
2. Open **Filters**.
3. Open the **Block Filters** tab.
4. Click **Create Block Filter**.
5. Select **Bot Traffic**.
6. Save the filter.
Amplitude blocks bots based on the User-Agent, using the IAB/ABC International Spiders and Bots List.
### Block internal traffic
If your team tests in production, [block internal IP addresses](https://amplitude.com/docs/data/block-internal-users) so employee traffic doesn't inflate your metrics. In Amplitude Data, create a block filter for **Events** where **IP Address** equals the addresses you want to block.
A good practice is to keep a separate development project for testing and only use production for final validation.
## Restrict who can see sensitive data
Collecting data responsibly is only half the job. You should also control who can see it.
Amplitude's [Data Access Control (DAC)](https://amplitude.com/docs/admin/account-management/data-access-control) lets you classify properties as **PII**, **revenue**, or **sensitive**, then grant or deny access to those classifications by group.
With DAC enabled:
- restricted users can't view charts, cohorts, dashboards, notebooks, or user sessions that contain restricted data.
- Amplitude hides classified properties from Event Stream and User or Account Lookup.
- restricted values appear as `[DAC Restricted]`.
To set it up:
1. Ask Amplitude Support to enable DAC for your organization.
2. In *Amplitude Data*, classify the properties you want to protect.
3. In *Settings > Organization settings > Groups*, open the group and configure access on the **Data Access** tab.
If you want broader role control beyond sensitive properties, use [RBAC](https://amplitude.com/docs/admin/account-management/roles-and-permissions) to define what users can do in each project and assign those roles through groups.
## Set a retention period
If you don't need to keep event data forever, set a retention period.
Amplitude's [Time to Live (TTL)](https://amplitude.com/docs/admin/account-management/time-to-live) lets you define event retention at the organization level and override it per project.
To configure it:
1. Ask Amplitude to enable TTL controls for your organization if they aren't already enabled.
2. Go to *Organization Settings*.
3. Open the **Time to Live (TTL)** tab.
4. Choose a retention period and confirm.
5. Add project-level overrides if some projects need a different retention policy.
Be careful here. TTL causes irreversible data loss, and existing charts zero out for periods outside the retention window.
A good rule is to set a shorter TTL for higher-risk datasets and a longer one only where there's a clear business need.
## Prepare for deletion requests
If a user asks you to delete their data, you need a process that covers both Amplitude and any upstream systems.
Amplitude's [User Privacy API](https://amplitude.com/docs/apis/analytics/user-privacy) lets you programmatically submit deletion requests for known Amplitude IDs or User IDs.
By default, deletions are project-based. If you want to delete the user across your organization, set `delete_from_org` to `true`.
Two things matter in practice:
- deleting a user doesn't block future tracking for that user.
- if the same user data still exists in your warehouse or another ingestion source, Amplitude may ingest it again on the next sync.
So your deletion workflow should be:
1. Receive the request.
2. Identify the correct user IDs.
3. Delete the user in Amplitude.
4. Delete the same user from the warehouse or any synced source.
5. Log completion for audit purposes.
## Validate your setup before launch
After your setup is live, test it with real scenarios.
At minimum, test:
- a visitor who hasn't consented.
- a visitor who grants consent.
- a signed-in user.
- a user who logs out.
- a user whose data is deleted.
In Amplitude, use [User Lookup](https://amplitude.com/docs/analytics/user-data-lookup) to inspect the event stream for a specific user and confirm what data was actually ingested.
For each test case, check:
- whether the SDK initialized.
- whether Amplitude cookies or storage were created.
- whether the expected events were sent.
- whether the expected identifiers were present.
- whether restricted data is visible only to the right users.
This step is worth the time. Most privacy issues come from small implementation gaps, not from the policy itself.
## Recommended rollout order
If you want a simple order of operations, use this:
1. Choose the consent method.
2. Decide what data is allowed.
3. Configure SDK initialization and storage.
4. Connect your CMP if needed.
5. Add filters for bots and internal traffic.
6. Classify and restrict sensitive properties.
7. Set data retention.
8. Document your deletion workflow.
9. Validate everything with end-to-end tests.
That sequence keeps the work manageable and makes it much easier to explain your setup to internal stakeholders and external auditors.
## Additional considerations
Depending on your implementation, you may need to configure more than cookies, storage, and access controls. The topics below are worth reviewing before you consider your setup complete.
### Session Replay
If you use Session Replay, review it separately from your core analytics setup. Replay can capture a richer set of user interactions, so it often requires its own privacy review, masking rules, and consent treatment.
In practice, this means you should:
- decide whether Replay is covered by the same consent choice as analytics or needs separate treatment.
- review masking and exclusion settings before rollout.
- make sure your privacy notice accurately describes the use of replay technology.
You can learn more in the [Session Replay documentation](https://amplitude.com/docs/session-replay).
### Access requests, not only deletion requests
Many privacy programs focus first on deletion, but customers may also need to respond to requests for access to personal data. If you support privacy requests, plan for both.
For deletion workflows, use the [User Privacy API](https://amplitude.com/docs/apis/analytics/user-privacy). If you also need to support data access requests, refer to the [DSAR API documentation](https://amplitude.com/docs/apis/analytics/dsar).
A good practice is to document one operational workflow that covers:
- request intake.
- identity verification.
- access or deletion in Amplitude.
- cleanup in upstream systems.
- audit logging.
### Privacy notices and disclosures
Your implementation and your privacy notice should stay aligned. If you collect analytics data, use Session Replay, or rely on a limited anonymous measurement flow, review your disclosures to make sure they still describe what you collect, why you collect it, and how users can exercise their choices.
This is especially important when teams change implementation details over time. A privacy issue is often caused not by the tool itself, but by a gap between what the product does and what the notice says.
### Hosting region and data residency
For some organizations, especially in Europe, hosting region is part of the privacy decision. Amplitude offers both US and EU data center options, and that choice may affect your internal review process.
If data residency matters to your business, confirm your hosting setup early and make sure it matches your internal requirements. You can learn more about [data residency options](https://amplitude.com/docs/admin/account-management/data-residency).
### Operational caveats after launch
Some privacy controls work exactly as expected, but still have practical consequences that teams should plan for.
A few important examples:
- deleting a user doesn't prevent Amplitude from tracking that user again.
- if deleted data still exists in a warehouse or synced source, Amplitude may reingest it.
- retention settings can permanently remove historical data and affect old charts.
- test privacy settings after every major instrumentation or tag-management change.
A good rollout doesn't end at launch. Re-test your setup periodically, especially after SDK updates, consent banner changes, new event launches, or changes to upstream pipelines.
### When to ask for help
If your setup includes regional legal complexity, multiple consent categories, sensitive personal data, or multiple downstream activation tools, involve your legal, privacy, and security teams early. It's much easier to design a privacy-conscious setup from the start than to retrofit one later.
In general, the safest approach is to keep the implementation simple, collect only what you need, and add complexity only when there's a clear business and legal case for doing so.
### Server-side tracking as an alternative for known users
For logged-in or identified users, server-side tracking offers an alternative that avoids some client-side consent constraints. If a user is authenticated, you can pass their user ID directly to Amplitude's HTTP API from your backend, bypassing the browser SDK entirely.
In many jurisdictions, server-side tracking of authenticated users doesn't trigger ePrivacy Directive requirements. ePrivacy applies to accessing or storing information on the user's device (cookies, localStorage, and so on), and server-side calls don't touch the device. For logged-in users, server-side Amplitude tracking may therefore not require consent under ePrivacy rules in some regions.
Important caveats:
- This only applies to known, logged-in users. For anonymous visitors, you still need a client-side identifier to track behavior across pages, even if your server generates that identifier (as with cookieless tracking approaches). As soon as you store or access any persistent identifier on the user's device, ePrivacy rules apply.
- Your legal team should confirm whether server-side tracking of identified users is sufficient for your jurisdiction and use case.
- Confirm with your privacy team that processing authenticated user data server-side aligns with your data processing agreements and your GDPR lawful basis.
## Why Amplitude doesn't generate modeled data for non-consenting users
Some analytics platforms fill in the gap left by non-consenting users by modeling estimated behavior, statistically inferring what those users might have done based on users who did consent. Amplitude doesn't take this approach. Here's why.
- Modeled data is inconsistent and hard to interpret. Platforms that offer modeling typically generate estimates only when they have enough activity volume to do so. Below certain thresholds, the platform produces no model at all, and coverage is uneven across segments, time periods, and properties. You can't easily tell when you're looking at real data and when you're looking at an estimate, and applying consistent analysis rules across your dataset becomes nearly impossible.
- Modeled data behaves differently depending on where you query it. If you export modeled event data to a warehouse and run the same analysis there, you often get different results than you do inside the analytics UI. Platforms typically apply this logic at query time in the UI, not at ingestion. This creates a split source of truth that is very difficult to reconcile, particularly for teams who rely on warehouse exports for reporting or compliance.
Amplitude's approach focuses on clear consent boundaries and accurate first-party data. It's better to know precisely what you measured and for whom than to fill gaps with estimates that are hard to validate or explain to auditors. If your organization uses Google services alongside Amplitude, you can configure Google Consent Mode for those tools independently. It doesn't affect how Amplitude processes data.
## Privacy and Amplitude AI features
{% callout type="note" %}
If your Amplitude account includes AI-powered features, such as Ask Amplitude, AI-generated insights, or other AI-assisted workflows, you may have questions about how your user data interacts with those features. For example, you may want to know whether event data is processed by third-party large language models (LLMs), and what data handling agreements apply.
Amplitude's [Trust Page](https://trust.amplitude.com) includes a dedicated AI FAQ that covers these topics, including questions about data sharing with AI providers.
For more detailed technical information, the [Amplitude AI privacy and security documentation](https://amplitude.com/docs/security-and-privacy/amplitude-ai-privacy-security) covers third-party LLM usage and related data handling practices.
Review these resources and align with your privacy team before enabling AI-powered features, particularly if you operate under GDPR or handle sensitive personal data.
{% /callout %}
## Final recommendation
If you want the safest and simplest default, start with **Method 1**: initialize Amplitude only after consent, keep your event schema tight, and add access controls and retention rules from day one.
If your policy allows more flexibility, you can still keep the setup privacy-friendly by reducing identifiers, using a proxy when needed, filtering bad traffic, and limiting access to sensitive data inside Amplitude.
================================================================================
# Planning and instrumentation workflow
URL: https://amplitude.com/docs/data/data-planning-workflow
================================================================================
# Planning and instrumentation workflow
Using Amplitude Data for planning helps ensure high-quality data from the start and reduces the need for clean-up later. This article describes the complete workflow in Amplitude Data.
## Plan your events
For most companies, the lifecycle starts when launching a product or feature.
Suppose the product team creates a new onboarding flow and wants to see how it performs. The first step is determining what to track in this onboarding flow. What metrics does your feature affect, and what does success look like?
After you identify the events and properties you want to track, create them on the _Events_ page. With Premium plans, you can create a branch to capture all your related changes without impacting anyone else. The Git branch in your code and the branch in Amplitude Data co-exist throughout the process. Engineering can pull analytics code from the Amplitude Data branch into their Git branch throughout the feature's development.
Branches are especially helpful when multiple teams work on the same project, or when teams work on various features simultaneously.
## Instrument events
If you haven't already, invite the developers working on the feature to Amplitude Data and ask them to review your proposed plan. If you work in a branch, send them a link to the _Activity_ page of your branch, which shows all the changes you want to make.
Next, engineers implement the updated tracking plan in their branch. They use the [Ampli CLI](https://amplitude.com/docs/sdks/ampli/ampli-cli) to generate a new tracking library that matches the changes in the Amplitude Data branch (`ampli pull -b {branch-name}`).
Iterating on your tracking plan with your developers is normal. You might respond to issues or challenges they encounter. Update your plan as your understanding evolves based on their feedback.
{% callout type="tip" title="Automate instrumentation planning with AI" %}
The Amplitude MCP plugin includes skills that automate event discovery and instrumentation planning directly in your editor. Use `amplitude:add-analytics-instrumentation` to analyze a PR or branch diff, generate a complete instrumentation plan, and add events and properties to your Amplitude tracking plan with rich metadata, including descriptions and categories, without leaving your editor.
For setup and the full list of available skills, refer to [Plan your taxonomy](https://amplitude.com/docs/data/data-planning-playbook#ai-assisted-taxonomy-planning).
{% /callout %}
## Request reviews
If you configured your project for team reviews, you might not have permission to merge directly. Instead, you first create a merge request. A merge request asks stakeholders outside your team to review your changes and give their explicit approval.
After the feature team is happy with the changes (the plan is comprehensive, and engineering implemented it correctly), your branch is ready for review by other stakeholders.
{% callout type="tip" title="" %}
Refresh your changes from main to get your branch up to date and resolve any potential conflicts. You might do this more than once as your developers refresh their branch (with `git merge` or `git rebase`).
{% /callout %}
Analytics changes often affect the broader organization, so getting feedback is essential. Typical stakeholders include the security and legal team, the growth team, and the data team.
Soliciting reviews starts with creating a merge request. When creating a merge request, describe the changes you're proposing and @mention any specific reviewers or approvers you want to include. An admin- or manager-level user can then approve changes.
## Merge
After the tracking plan changes are ready and everyone needed to approve has done so, you're ready to merge into main.
When the rest of the feature team is ready to merge in Git, merge your branch in Amplitude Data first. Merging creates a new official version of your tracking plan on main and assigns new versions to all new and changed events.
If your Git branch is already up to date with the merged Amplitude Data branch, you can now merge your Git branch as-is. Run `ampli status --is-merged` to check that your Ampli code is up to date with the merged Data branch. If the command returns an error, run [ampli pull](https://amplitude.com/docs/sdks/ampli/ampli-cli#pull) to update the generated library to the latest version.
After `ampli status --is-merged` succeeds, you can merge the Git branch.
================================================================================
# Create a tracking plan
URL: https://amplitude.com/docs/data/create-tracking-plan
================================================================================
# Create a tracking plan
A tracking plan defines every event and property you collect, why you collect each one, and which source emits it. Build one before you instrument code so analysts, PMs, and engineers work from one schema instead of arguing about field names after the data lands. In Amplitude Data, the plan lives next to your events and properties, so edits flow straight into instrumentation, governance, and the Ampli code generator.
This article covers how to build a tracking plan manually in Amplitude Data. For an automated path that proposes events from your codebase, use the [Amplitude Wizard CLI](https://amplitude.com/docs/get-started/setup-wizard-cli) instead. Refer to the [data planning playbook](https://amplitude.com/docs/data/data-planning-workflow) for the strategy behind designing a plan.
## Find your tracking plan
Each project in Amplitude has its own tracking plan. To find your plan, select the *Data* tab in the top navigation. Then, in the left navigation, select the project from the dropdown at the top.
The events and properties for your plan appear on the left.
## Update your tracking plan
You can update your plan in two ways:
* Proactively plan new events and properties before implementation, and use Amplitude Data to define details, work together with team members, and agree on what you want to track. (Recommended.)
* Reactively plan events and properties after Amplitude ingests for the first time. By default, these events and properties appear in your plan as "Unexpected." You can add them to your plan, or delete them to stop ingestion and remove them from your data catalog.
You can also create and update events, properties, and branches through the [Amplitude MCP Server](https://amplitude.com/docs/amplitude-ai/amplitude-mcp#tracking-plan-changes) from an AI coding client. MCP tools such as `create_events` and `create_properties` modify the same tracking plan you manage in Amplitude Data.
### Create a source
[Sources](https://amplitude.com/docs/data/sources/connect-to-source) represent the originating source of the data sent to Amplitude (for example, your iOS, Android, Web, and Backend). When using the [Ampli Developer experience](https://amplitude.com/docs/sdks/ampli), you need to create a source to generate the correct tracking library.
To create a source, follow these steps:
1. Navigate to *Data > Sources* and select *Add Source*.
2. Select the SDK source you want to add.
3. Name your new source and select *Create*.
### Create an event
An event is a distinct action that a user can take in your product. When you create an event, you can specify metadata about the event that helps with both implementation and discovery in Analytics after implementation.
To create an event, follow these steps:
1. Navigate to *Data > Events* and select *Create event*.
2. Give your event a name. Amplitude suggests any modifications to match your naming convention.
3. Add a source to specify where to instrument this event.
4. Add any relevant metadata, including:
* A description to help define when to send the event or important details about the event.
* A category to provide more context and group similar events.
* The active or inactive status of the event. An active event is one the user triggers. Inactive events relate to the user, but a direct user action doesn't initiate them (for example, receiving a push notification).
5. Add any relevant event properties to the event.
### Create an event property
Event properties describe the event and the context in which a user triggered it. For example, a `Song Played` event might contain a `Song Title` property. A name, description, examples, and rules define each property. Rules are specific to each data type. For example, property `Song Title` of type `String` can have the following rules: Min Length, Max Length, and Regex.
To create a new event property, follow these steps:
1. In Amplitude Data, navigate to *Data > Properties* and select the *Event Properties* tab.
2. Select *Create event property*.
3. Give your event property a name and add any relevant metadata to the property, including:
* A description. Including example values can be helpful.
* Whether this property is required on this event. If it is, and Amplitude receives an event that doesn't include it, Amplitude Data generates a warning.
* The data type (such as string or number) and any additional rules.
You can now add this property to your events.
To add an existing property, or create a new property within an event, follow these steps:
1. In Amplitude Data, navigate to *Data > Events* and select the event you want to add a property to.
2. In the event detail pane, select *Add property*.
3. Name your new property, or select an existing property to add to the event.
{% callout type="note" heading="" %}
If multiple events share similar properties, you can [create a property group](https://amplitude.com/docs/data/property-updates-property-groups). Property groups, which are distinct from group properties, make it easier to manage complex tracking plans because you don't have to keep adding the same properties repeatedly. When you update a property group, the update applies to all events associated with the group.
{% /callout %}
### Create a user property
User properties capture traits about the user. After you set a user property, it automatically applies to any subsequent events the user triggers, until its value updates.
To create a new user property, follow these steps:
1. In Amplitude Data, navigate to *Data > Properties* and select the *User Properties* tab.
2. Select *Create user property*. Give your new user property a name.
3. Add any relevant metadata to the property, including:
* A description. Including example values can be helpful.
* The data type (such as string or number) and any additional rules.
### Create a group with group properties
{% callout type="note" heading="" %}
This feature requires the [Accounts](https://amplitude.com/docs/analytics/account-level-reporting-setup) add-on.
{% /callout %}
Group properties make it easy to associate a user with a particular account (for example, name, industry, or employees) whenever the `group()` call runs. Group properties help when you want to track groups of users (for example, tracking events across an entire company, instead of specific users within that company).
To create a group, follow these steps:
1. In Amplitude Data, navigate to *Data > Groups* and select *Create group*.
2. Name your group and add any relevant metadata, including:
* A description. Including example values can be helpful.
* The data type (such as string or number) and any additional rules.
3. Add any group properties that apply to this group type.
To create a group property, follow these steps:
1. In Amplitude Data, navigate to *Data > Properties* and select the *Group Properties* tab.
2. Select *Create group property*.
3. Name your group and add any relevant metadata, including:
* A description. Including example values can be helpful.
* The data type (such as string or number) and any additional rules.
## Collaborate on your plan
If you want feedback on any changes you've made, you can @mention your colleagues in the rich text editor of any event or property to send them an email notification or Slack message. This approach helps when you're working on a branch and finalizing the event and property names you plan to use.
## Send your plan to your developers
Finally, send this plan to your developers.
If you're using the Ampli Developer Tools, it consumes your tracking plan and presents it to developers as type-safe autogenerated code. Amplitude Data can generate a tracking library for all popular platforms and programming languages. The autogenerated library is a lightweight wrapper over your analytics provider's SDK that provides type-safety, supports linting, and enables additional features like input validation. The code exactly replicates the spec in the tracking plan and enforces all its rules and requirements.
You can also send them a link to the branch or directly to Amplitude Data, where they can review the details you specified.
{% callout type="tip" %}
Developers can also use the [Amplitude Wizard CLI](https://amplitude.com/docs/get-started/setup-wizard-cli) to instrument events. The wizard reads your codebase, proposes tracking events, and writes the code with developer approval, all from the terminal.
{% /callout %}
================================================================================
# Work with branches
URL: https://amplitude.com/docs/data/work-with-branches
================================================================================
# Work with branches
If you've worked with Git, branches in Amplitude Data should look familiar. A **branch** is like a point-in-time snapshot of the tracking plan created for you and your team. You can make changes to it without those changes being immediately visible to everyone else, and only merge them back into the main tracking plan when you're ready.
When you first create your Amplitude Data account, Amplitude automatically creates a default branch called `main`. It includes a few sample events and properties to get you started. Think of the `main` branch as your production branch: it contains your latest official tracking plan and matches what's instrumented in your default branch in Git (typically `master` or `main`).
`main` is suitable for getting started in Amplitude Data, and you may find that it's the only branch you need for some time.
## Publish a version of your tracking plan
Changes you make on a branch are initially kept in the branch's staging area, where they remain **pending**. Pending changes are work-in-progress changes: visible to you and your teammates, but hidden from your production systems and not yet available for instrumentation by your engineering team.
When your pending changes are ready, **publish** them. Publishing your changes creates a new version of your tracking plan that includes those changes. Publishing also exposes that new version to your engineering team for instrumentation. If your new version is on the main branch, those changes also propagate to your production systems.
Every new version has a version number and an optional description, so you can tell versions apart later. Version numbers start at 1 and increment by 1 each time you publish a new one.
Every branch has its own tracking plan versions, which means it's possible to have two versions of the tracking plan with the same version number: one in `main`, and one in your own branch. When this happens, Amplitude Data always displays the name of the branch to avoid confusion.
## Create and delete branches
As you and your team ramp up your use of Amplitude Data, you may outgrow the `main` branch and need a more robust workflow. This usually happens when:
* Too many people are making changes to `main` at the same time, or
* Feature teams want their own separate copy of the tracking plan to collaborate in, review their work, and get stakeholder approval.
In Amplitude Data, all branches spawn from `main` and merge back into `main`.
To **create** a new branch, follow these steps:
1. Click *main* in the page's header.
2. Type the name of the branch you want to create.
3. Click *+*.
4. In the *Create branch* modal, confirm the name of your branch, add an optional description, and click *Create*.
If you have pending changes on `main`, you can either take those changes with you into your new branch, or leave them behind on `main`.
To **delete** a branch, follow these steps:
1. Click the X next to the branch name.
2. In the modal that appears, click *Delete* to confirm your choice.
## Work on a branch
After your branch exists, working with it is like working with `main`. You and your team can create and publish new versions, instrument those versions in the product, and report back to the branch on the status of the instrumentation.
This can all happen in parallel with other teams working in their own branches, without any impact on you.
From time to time, refresh your branch with any changes made to `main` since you created your branch. If Amplitude Data detects that your branch is out of date with `main`, you see a *Refresh* button in the page's toolbar. Click it to get caught up.
## Merge your branch back into main
When you're happy with the changes you've made on your branch, merge them back into `main`. This typically happens when your product team is also ready to merge their changes into the `main` branch in Git.
There are a few prerequisites to address before you can successfully merge:
* You must publish all pending changes on your branch.
* Your branch must be up to date with `main`.
* `main` must have all its pending changes published as well.
To publish your changes to a new version on your branch, follow these steps:
1. In the left sidebar, click *Save changes*.
2. In the *Save changes* modal, review the pending changes. If everything looks correct, click *Save*.
To merge, follow these steps:
1. Go to *Activity*. You may have to click *Refresh*.
2. Click *Approve*.
3. Click *Merge*.
If your account is configured for [team reviews](https://amplitude.com/docs/data/amplitude-data-settings), you may not have permission to merge directly. In this case, you must first create a merge request. A merge request is a way to ask stakeholders outside your team to review your changes and give their explicit approval. Only team members with Manager or Admin permissions can approve changes; do so by logging into Amplitude Data and clicking *Merge* in the page's toolbar.
An approved merge request is then ready to be merged by anyone on your team.
## Copy branch changes to testing environments
After you apply changes to a branch, you can copy those changes to other projects or environments for testing.
To copy branch changes, follow these steps:
1. Go to *Activity > Branch Changes* from the branch you want to copy.
2. Click *Copy Branch*.
3. In the modal that appears, select the testing projects to copy the branch to from the dropdown. Then click *Copy*.
4. After the copy completes, click the notification to review the copied branch.
5. Review changes to the testing project. If changes look as expected, click *Merge*.
Managers and Admins can also restrict which projects can accept copies of branch changes.
To restrict branch copying, follow these steps:
1. From the source project, go to *Settings > General*.
2. Select the checkbox next to *Restrict branch copying to specified testing projects*.
3. From the dropdown, select the checkbox next to the projects where other Amplitude users can save copies of branch changes.
================================================================================
# Ampli and developer tools
URL: https://amplitude.com/docs/data/use-ampli
================================================================================
# Ampli and developer tools
**Ampli** dynamically generates a lightweight wrapper for the **Amplitude SDK** based on your analytics tracking plan in **Amplitude Data**, making event tracking easier and less error-prone.
The **Ampli Wrapper** provides types and methods that prevent human error by strictly enforcing event names and property values. The wrapper code enables autocompletion for all events and properties in your tracking plan, plus static type checks at development and compile time.
To learn more about using Ampli, go to the [Amplitude Developer Center](https://amplitude.com/docs/sdks/ampli).
================================================================================
# Monitor your data with observe
URL: https://amplitude.com/docs/data/validate-events
================================================================================
# Monitor your data with observe
Observe continuously inspects, analyzes, and monitors your event stream against your tracking plan, surfacing invalid, missing, and out-of-date events as they occur. It needs no code changes and runs automatically in the background, keeping your tracking code in sync with your tracking plan. Observe assigns every event one of four statuses: unexpected, valid, invalid, or out of date.
Observe listens to your existing event stream and turns your tracking code into a living document, so you get a holistic view of your data collection across platforms.
You and your teams get immediate insight into anything broken or that needs attention. With an intuitive, collaborative workflow, your teams can work together to instrument fixes and keep your tracking plan in shape.
## View and update your event statuses
To access your event stream, go to *Data > Events*. This displays all your events.
The first time you view your tracking plan, Amplitude displays all events and properties received and processed. By default, Amplitude categorizes all events and properties as *Unexpected*. To add them to your tracking plan, check the box next to the event name and click **Add to plan**.
Do this anytime you want to add an unexpected event to your tracking plan. Click **Publish** to complete the process. From this point on, Observe alerts you about any changes to this event or any properties associated with it.
Your events always have one of four statuses:
* **Unexpected**: Any event or property not yet added to your tracking plan.
* **Valid** (and **Current**): Any event or property that matches (in name and schema) the latest version of an existing event. If Observe doesn't know the version of the event, it only ensures that the event shape matches your current tracking plan.
* **Invalid**: Any event or property that doesn't match your current tracking plan.
* **Out of Date**: Any event or property that matches a previous version of an existing event or property (only applicable when using Amplitude SDKs).
Observe only surfaces data as it occurs. If you have legacy tracking or events that fire infrequently, they may not appear in your tracking plan. If you know of events that Observe doesn't surface, you can add them manually to your plan, or trigger the events yourself.
{% callout type="note" heading="" %}
If you're blocking, filtering, or transforming your data upstream of Amplitude, Observe can't access this data. For this reason, ensure that you send all your data to Amplitude.
{% /callout %}
### Observe and the Ampli CLI
If you've instrumented all your event tracking using Amplitude's SDKs, you already benefit from type-safe analytics libraries, client-side validation, and continuous integration with [CI](https://amplitude.com/docs/sdks/ampli/validate-in-ci) for clean, accurate data you can trust.
Observe still adds value by surfacing and alerting you to runtime validation errors in the web app. This is specifically relevant for JavaScript, because it isn't a type-safe language, and checks only happen at runtime. Refer to the Amplitude Data developer documentation for more details.
## Overlay your tracking plan with observed events and issues
You can overlay your tracking plan with your event stream.
If you're using the Amplitude SDK, you also have the option to overlay your tracking plan with your event stream from an environment, but **only** data sent to the **specific branch** you're on. This is useful for debugging when multiple teams send data to the environment.
You can also **set a specific time range** to use for overlaying your event stream with your tracking plan. You can choose from:
* Five minutes.
* One hour.
* 12 hours.
* Seven days.
* 14 days.
Note that changing this range can determine whether Observe considers an event valid or invalid. For example, if you had a bug seven days ago, choosing *Last 7 days* causes the event to show up as invalid. If you fixed it at any point between seven days ago and 12 hours ago, and then choose *Last 12 hours*, Observe considers it valid.
## Act on your Observe insights
Observe surfaces missing and invalid properties on an event. The property rows show this information in a few ways:
* **Status tooltip**: Indicates if an event was invalid at the point Amplitude received it (if Observe receives the version, it compares the event to the version; otherwise, it compares the event to your current tracking plan).
* **% Seen indicator**: Red if the property is required (published or unpublished) and Amplitude received the event without the property within the selected timeframe. The indicator can be red while the status is green if you have unpublished changes, or if you recently modified the event.
* **Type indicator**: Red if Amplitude received the property with a type other than what's selected (published or unpublished) within the selected timeframe. The indicator can be red while the status is green if you have unpublished changes, or if you recently modified the event.
Observe automatically detects the source of each event (based on the library) and displays those sources in the event detail pane. This is especially helpful when you have multiple sources managed by different teams, because you can identify which source is sending invalid data.
The sparkline to the right of the source name shows both total and invalid event volume to quantify the amount of data with errors.
You can also create and assign multiple SDK sources with the same library. For example, if you have a marketing site and a web app that use the Browser SDK, you can create two different sources and assign the correct source to each event. Using Ampli also lets you see each source's volume and validation data separately. If you're not using Ampli, you see the volume for both sources rolled up into a single row with the library name (in this case, "Browser SDK".)
## Scope and limitations
Observe works by default if you're sending data to Amplitude. Observe is limited by how you're sending data to Amplitude. If you're using Amplitude's SDKs (current source support: JavaScript, Node.js, Android, and iOS), Observe can attribute your event stream to its respective source (web, iOS, backend, and so on).
{% callout type="note" heading="" %}
If Observe can determine the version of your event, it validates against that version's schema. When Observe doesn't know the version, it validates against the schema of the latest version in your tracking plan.
{% /callout %}
================================================================================
# Protect your schema from unexpected data
URL: https://amplitude.com/docs/data/configure-schema
================================================================================
# Protect your schema from unexpected data
Schema settings control how Amplitude handles data that violates your schema. A schema violation happens when Amplitude receives data that your schema doesn't account for, such as an event you didn't plan or a property value with an unexpected type. You configure a response to three types of schema violation: unplanned event types, unplanned event or user properties, and unplanned property values. For each type, Amplitude either marks the data as unexpected and ingests it, or rejects it.
Use schema settings when you want Amplitude to mark or reject data that violates your schema at ingestion. To monitor your event stream for invalid, missing, or out-of-date events without changing how Amplitude ingests data, use [Observe](https://amplitude.com/docs/data/validate-events) instead. Find your schema settings by going to Amplitude Data and navigating to *Settings > Schema Settings*.
## Unplanned event types
Sometimes, Amplitude may receive an event that isn't part of your schema, or that you didn't plan earlier. This is an **unplanned event type**. You can configure Amplitude to respond in these ways:
* **Mark As Unexpected**: Amplitude ingests the event, triggers a warning, and sends a notification to the designated subscribers. The event's category in drop-downs is "Unexpected" until you approve it.
* **Reject**: Amplitude rejects the event and sends a notification to the designated subscribers. Amplitude doesn't store the event or its properties.
## Unplanned event or user properties
When Amplitude encounters an event or user property that isn't part of your schema, or that you didn't plan earlier, it considers the property to be an unplanned event or user property. You can configure Amplitude to respond in the following ways:
* **Mark As Unexpected**: Amplitude ingests the property, triggers a warning, and sends a notification to the designated subscribers.
* **Reject**: Amplitude rejects the property and sends a notification to the designated subscribers. Amplitude stores the event, but not the properties.
## Unplanned event or user property values
When Amplitude receives an event property value that isn't part of your schema, or that you didn't plan earlier, it considers the value an unplanned property value. For example, an event property value arrives as a string, but your schema expected a number. You can configure Amplitude to respond to an unplanned property value in the following ways:
* **Mark As Unexpected**: Amplitude ingests the property, triggers a warning, and sends a notification to the designated subscribers.
* **Reject**: Amplitude rejects the property, triggers a warning, and sends a notification to the designated subscribers. Amplitude stores the event, but not the properties.
If Amplitude rejects your event data and you want to ingest it, add the events or properties to your schema by planning a new event or property.
## View validation errors
After you initialize your schema and define your expected events and event properties, your schema can validate live data coming into Amplitude. If you configured your schema to trigger a warning for unexpected events or properties, Amplitude logs an error in the validation errors panel.
View validation errors by going to Amplitude Data and navigating to *Settings > Schema Settings > Validation Errors*. Any errors triggered in the last 24 hours appear on this page, whether or not you've since approved or rejected the event or property. If no errors appear on the validation page, there haven't been any violations in the past 24 hours. This doesn't mean you've fixed every violation; it only means Amplitude hasn't encountered them in that time.
Select **Subscribe** to set up email alerts for validation errors.
## Manage subscribers
You can designate specific users to receive email notifications of any schema violations. Select **Manage Subscribers** at the top right of your schema options.
================================================================================
# Integrate Jira with Amplitude Data
URL: https://amplitude.com/docs/data/integrate-jira
================================================================================
# Integrate Jira with Amplitude Data
Amplitude Data lets you integrate with Jira to quickly create new Jira issues whenever you make changes to a feature branch. You can only create issues from within the feature branch, and you can only associate changes with a Jira ticket.
## Set up the integration
To set up and use the integration, follow these steps:
1. In Amplitude Data, navigate to *Settings > Integrations* and find the Atlassian Jira panel. Click *Add*, and in the modal that appears, click *Authenticate* to start the authentication flow.
2. Another modal appears asking you to authorize Jira access for your site. From the drop-down in the modal, select the site you want to authorize. Then click *Accept*.
## Create a Jira issue in Amplitude Data
To create a new Jira ticket from within Amplitude Data, follow these steps:
1. Create a feature branch and make your changes there. You can only use this integration from within a feature branch.
2. Your changes appear grouped by sources under the Home page. If you successfully integrate with Jira, you can create a Jira Issue for each source inside Amplitude Data.
Click *+Jira* to create a new issue or link an existing issue to current changes.
3. To unlink an issue from your feature branch, hover over the issue tag and click *Unlink Jira*. In the modal that appears, click *Unlink* to confirm the unlink action.
After you link an issue to a source, any subsequent published changes automatically leave a comment on the Jira issue.
================================================================================
# Manage access to sensitive data with Data Access Control
URL: https://amplitude.com/docs/data/data-access-control
================================================================================
# Manage access to sensitive data with Data Access Control
Data Access Control (DAC) restricts which users can access sensitive categories of event and property data, such as revenue data or personally identifiable information (PII), so unauthorized users can't view them. Enterprise organizations use DAC to classify this data and prevent inadvertent data leaks.
{% callout type="note" heading="Enable this feature" %}
Contact [Amplitude Support](https://gethelp.amplitude.com) to enable Data Access Controls for your organization.
{% /callout %}
## How Data Access Control works
DAC works within Amplitude's Groups framework. Admins grant or restrict access to PII, revenue data, and sensitive information for all members of a group. From there, admins can [add or remove users from these groups](https://amplitude.com/docs/admin/account-management/manage-permission-groups#edit-a-group) as access requirements change, either at the individual or organizational level.
For example, when an unauthorized user tries to view a chart that includes restricted information, Amplitude blocks the chart from loading. Those users also can't create new charts that might include restricted data. This applies to charts, cohorts, dashboards, notebooks, and user sessions.
{% callout type="note" %}
Organization admins always have access to all data classifications, regardless of any DAC restrictions.
{% /callout %}
When a user encounters a chart they can't view because of restricted data, Amplitude specifies the properties or cohorts that DAC blocked.
The user can then exclude the restricted data and view the chart (or cohort, dashboard, notebook, or user session) without it.
With DAC enabled, Amplitude hides classified properties from the Event Stream and User or Account lookup pages. When your project's users encounter classified data, Amplitude displays the value as `[DAC Restricted]`.
The same restrictions apply to Ask Amplitude.
## Set access for specific categories of sensitive data
Setting access levels is a two-stage process. First, classify your data. After that's complete, set up permissions.
{% callout type="note" %}
DAC applies only to properties. It doesn't apply to definitions or metadata.
{% /callout %}
### Classify properties
1. In Amplitude Data, go to *Properties* and select the tab that contains the properties you want to classify. DAC lets you classify User, Event, and Group properties in your tracking plan, except for Amplitude ID, Version, Platform, Group ID, and Group name.
{% callout type="note" heading="Properties not eligible for classification" %}
Amplitude doesn't support classifying transformed properties or unexpected properties.
Transformed properties inherit classification from their component properties.
To classify an unexpected property, add it to your tracking plan.
{% /callout %}
2. Select the name of the property you want to classify. You can manage event, user, and group properties directly. Derived properties inherit all the classifications of their parent properties.
3. In the details panel that opens, select the *Classification* drop-down and choose all relevant classifications for this property. Then select **Send**.
4. Repeat steps 2 and 3 for each property you want to classify.
{% callout type="warning" heading="Classifying the User ID property" %}
If you classify `user_id`, users without access to that classification can't use [Event Explorer](https://amplitude.com/docs/analytics/charts/event-explorer).
{% /callout %}
### Set up permissions
1. Go to *Settings > Organization settings > Groups* and select the name of the group you want to edit. You can also [create a new group](https://amplitude.com/docs/admin/account-management/manage-permission-groups#create-a-group).
2. Open the group's *Data Access* tab. Three controllable classifications appear here: PII, revenue, and sensitive.
3. For each classification, select *Yes* to allow members of the group to view this data, or *No* to deny access.
4. When you're done, select **Save**.
## Data Access Controls overview page
{% callout type="note" heading="" %}
This page is available to users with the Administrator role.
{% /callout %}
Go to *Organization Settings > Data Access Controls* to view the Data Access Controls overview page. There, find information about the following:
* The number of groups with access to data classified as `PII`, `Sensitive`, or `Revenue`.
* The number of users with access to data classified as `PII`, `Sensitive`, or `Revenue`.
* All event, user, and group properties classified as `PII`, `Sensitive`, or `Revenue`.
Drill into any cell in the table for a detailed view of the specific users or groups with access to each classification, or for more detailed information about the properties in each classification.
Update user and group access from the Overview page, or go to *Data* to update any property classification.
Use the project switcher to view classifications for each project, and select *Classify Data* to open that project's tracking plan, where you can manually classify properties.
To customize the error message that your internal users see when they try to access a restricted chart or cohort, select **Customize Restricted Access Message**. On the resulting modal, edit the error message and include any links to internal documentation that might help.
{% callout type="note" heading="" %}
When you customize the restricted message, the message applies to your organization, not just the project.
{% /callout %}
## Access request notifications
Users who go to a restricted chart or cohort can contact an administrator in their organization to request access. Amplitude sends this request to all organization administrators.
{% callout type="note" heading="Turn off access request notifications" %}
Administrators can deselect the `Someone requests access to a property classified by Data Access Controls` notification in *Personal Settings > Notifications* to opt out.
{% /callout %}
## Exports and subscriptions
DAC enforcement applies to all exports and subscriptions in Amplitude:
* If a user selects **Download Users** from the [microscope](https://amplitude.com/docs/analytics/microscope) in a chart, the CSV export excludes properties with classifications they can't access.
* If a user tries to export a CSV from a dashboard, the export excludes charts they can't access.
* If a user tries to export a PDF or PNG from a dashboard, the export obfuscates charts and cohorts they can't access.
* If a user tries to subscribe to a chart they can't access, Amplitude cancels the subscription and the user doesn't get a notification or email.
* If a user tries to subscribe to or create alerts for a dashboard, the email obfuscates the charts and cohorts they can't access.
## Manage classifications with the Taxonomy API
The [Taxonomy API](https://amplitude.com/docs/apis/analytics/taxonomy) lets you manage classifications for all your properties at scale.
================================================================================
# User properties and event properties
URL: https://amplitude.com/docs/data/user-properties-and-events
================================================================================
# User properties and event properties
User properties describe the person triggering an event (plan type, country, device). Event properties describe a single event instance (the song played, the button clicked, the checkout total). User properties persist across all of a user's events; event properties belong to one event each.
Attach an attribute as a user property when it describes the person and you'd want to filter or segment by it across their full activity. Attach it as an event property when the attribute only makes sense in the context of one specific action.
Amplitude supports both kinds:
1. **User properties**: Attributes of individual users. Common user properties include device type, location, User ID, and whether the user is a paying customer. A user property can reflect either current or previous values, depending on its nature and how often it updates.
2. **Event properties**: Attributes of a particular event. The values are current for the moment the event occurred. For example, the event `JoinCommunity` could have an event property `Type`, which denotes the kind of community joined **at the time** of that event.
This article describes what user and event properties do, how Amplitude updates and applies them, and how to hide individual properties in an Amplitude project.
{% callout type="info" heading="" %}
For more on events, users, and properties, take this course in [the Amplitude Academy](https://academy.amplitude.com/amplitude-getting-started-with-analytics/1092674/scorm/40m548g557cd).
{% /callout %}
## User properties
A user property is an attribute that describes a useful detail about the user it's attached to. Amplitude sends user properties with every event.
Amplitude's SDKs track these user properties by default:
- Platform.
- Device Type.
- Device Family.
- Country.
- City.
- Region.
- Start Version.
- Version.
- Carrier.
- OS.
- Language.
- Library.
- IP Address.
You can find definitions of each property in the [user property definitions](https://amplitude.com/docs/get-started/user-property-definitions).
You can also set up custom user properties. Choose characteristics and traits that are intrinsic to the user or to the device they're using; otherwise, the data you collect from your user properties isn't as useful. Common examples of custom user properties include referral source, plan type, number of friends, or current level in a game.
You can tell the difference between default Amplitude user properties and custom user properties by looking for the Amplitude logo. If you see it, the property is a default user property. The names of custom user properties aren't prefixed by that logo.
Amplitude customers typically implement up to 20 custom user properties, along with the default properties.
### How Amplitude updates user properties
When a user triggers an event that Amplitude captures, the event includes the current values for each user property, but these values can change over time. For example, a user might move from New York to Dallas, or convert from a free user to a paying one. When this happens, Amplitude updates the user properties and applies the new values to events the user sends from that point forward. Amplitude doesn't apply user property updates retroactively, and older values remain in your historical data. Property values reflect the values at the time of the event.
For example, this user viewed an article at 10:11 AM. The value for the `City` property was `San Francisco`.
This user also viewed an article about a week earlier. When you select that event, the `City` property displays as `New York`, which was the value at the time the user triggered the `view article` event.
The user properties displayed with each event in a user's [individual event stream](https://amplitude.com/docs/analytics/user-data-lookup) capture the value of the user property *at the time of the event*. Amplitude derives this information from the most recent event sent or an Identify call.
{% callout type="note" heading="" %}
You don't need to send custom user properties with every event. After you set a user property, the value persists, and Amplitude applies it to all subsequent events until the value changes. If you forget to apply custom user properties to your events, you can update user properties later through the [Identify API](https://amplitude.com/docs/apis/analytics/identify). If you query on this event in Amplitude later, the updated user property doesn't appear with the event and applies only to events from that point forward.
{% /callout %}
#### When old and new user property values overlap
When a user property's value changes, Amplitude charts can show the user in both the new and the old user property categories. This overlap applies only for the specific day on which the property value changed.
For example, on July 1st, a user logs into your game app at version 1.8 and plays a few games. Later that day, the user updates to version 2.0 and plays more. If you segment the daily active user chart by version, and compare version 1.0 and 2.0, that user appears in both segments for that day. Starting July 2nd, the user appears only in the version 2.0 segment until they update to a newer version.
Something similar can happen when you've applied a user segment to a chart. Amplitude shows `(none)` values if the user had no value for a user property at the time of the event. If a user initially had `isPaying` = `(none)` for their first `PlaySong` event, but then had `isPaying` = `True` for the next `PlaySong` event, the user shows up in both buckets. If you go to the [User Activity](https://amplitude.com/docs/analytics/user-data-lookup) page for that user, only their most recent value for that property appears in the top section of their profile.
### How Amplitude applies user properties to events
You can apply user properties to events in three ways:
1. Update the user property before you send an event. Update the property's value in the user property table and apply it to the next event you send to Amplitude. This is the recommended method for updating user properties so that Amplitude correctly applies the updated value to the event.
2. Update the user property after you send an event. You send an event to Amplitude, then update the property's value in the user property table. The updated value doesn't appear in the user interface until you send another event.
- If you send an Identify call after the event, the updated value doesn't appear with the event. It displays at the top of the user's profile, but doesn't appear in chart results until you send another event after the Identify call.
3. Send a user property with an event. For events sent through the [HTTP API](https://amplitude.com/docs/apis/analytics/http-v2), you can include user properties with the server-side call. The updated property appears in the user interface as soon as Amplitude receives the event. The user property table also updates after Amplitude ingests the event. Future events have the updated property value until it updates again.
Send an event with, or directly after, a new property value to ensure the value displays in the UI. You can update user properties with the [Identify API](https://amplitude.com/docs/apis/analytics/identify). Read and understand the Identify API documentation fully before using it.
## Event properties
Event properties are attributes of the events your users trigger and that you send to Amplitude. Each event has its own set of event properties. The nature of these properties depends on the type of product you have and the specific information you want to discover. For instance, if `Swipe` is an event you're tracking, the event property `Direction` could have the values `Left` or `Right`.
Example event properties include description, category, type, duration, level, percent completed, count, source, status, number, lives, authenticated, error number, rank, action, and mode. Use event properties to reduce the number of events you're tracking and to better analyze your events.
{% callout type="note" heading="" %}
Amplitude is an event-based platform. As a result, Amplitude logs events with event and user properties at the time a user triggers an event. Amplitude's charts reflect this. If your chart doesn't return the expected results, your query may reference the wrong property type.
{% /callout %}
For example, if you have a user property and an event property both called `email`, verify which property you query on in a chart. Otherwise, your chart returns data that you may not expect.
## Hide properties
You can [hide old or buggy properties as needed](https://amplitude.com/docs/data/remove-invalid-data). Hiding event or user properties only hides them from the platform UI and doesn't delete them. You can unhide the properties if you change your mind.
## Automatic deletion of user properties
Amplitude automatically deletes user properties for users with no event data in the last 14 months. As long as a user has activity in your application or website over the last 14 months, Amplitude retains user properties associated with them.
================================================================================
# Event and property descriptions
URL: https://amplitude.com/docs/data/event-property-descriptions
================================================================================
# Event and property descriptions
You can add or edit the description for an event or property to help other members of your organization understand what an event or property represents.
{% callout type="note" heading="" %}
This only applies to active events and properties included in your tracking plan. It also doesn't apply to custom events.
{% /callout %}
## Add a description to an event
To add a description to an event, follow these steps:
1. Go to *Events* and click the name of the event you want to add a description to.
2. In the flyout that appears, click *Add a description* (under *Details*).
3. Type a description of the event and click *Apply*.
## Add a description to an event property
You can change the description for an event property in two ways. Because the same event property can apply to multiple event types, you can add a description for the global event property and for the specific event-to-event property pair. If the event property description specific to an event doesn't exist, the description defaults to the global event property description.
* To change the description for an event property specific to an event, navigate to *Events* and click the event name to open the *Details* panel. Type a description where it says *Add a description*, and click *Apply* to save.
* To change the global description for an event property, navigate to *Properties > Event Properties* and click the event property name to open the *Details* panel. Type a description where it says *Add a description*, and click *Apply* to save.
## Add a description to a user or group property
You can change the description for a user property or a group property by navigating to *Properties > User Properties* or *Properties > Group Properties*. Click the property name to open the *Details* panel. Type a description where it says *Add a description*, and click *Apply* to save.
================================================================================
# Event and property display names
URL: https://amplitude.com/docs/data/display-names-in-amplitude-data
================================================================================
# Event and property display names
By default, an event's display name in Amplitude data matches the ingested name. These names can be difficult to read, understand, and incorporate directly into your analyses. To address this, you can give your events and user properties new display names that offer an easy-to-read description of their purpose and content.
{% callout type="note" heading="" %}
This only applies to active events and user properties added to your tracking plan, and doesn't apply to custom events. It changes the display name of the event or property within the Amplitude UI and doesn't change the raw data.
{% /callout %}
## Change the display name for an event
You can update an event type's display name directly from the *Events* screen. To do so, follow these steps:
1. Click *Events* in Amplitude Data’s left-hand rail.
2. Click the event name.
3. Type the new display name for the event.
## Change the display name for a user property
You can update a user property's display name from the *User Properties* tab on the *Properties* screen. To do so, follow these steps:
1. Click *Properties* in Amplitude Data’s left-hand rail and open the *User Properties* tab.
2. Click the property name to open the details panel.
3. Click the property name in the panel and enter a display name.
## Update an event's visibility
Hide events from appearing in areas of Amplitude where you don't want them. For example, you can hide noisy events from your user stream to make the data that appears more useful.
Support for updating an event's visibility depends on the event type.
| Event type | Editable? | Where to edit |
| ------------------ | -------------------------------------------------------- | ---------------------------------- |
| Default events | Must be in the tracking plan, and have `Modify` enabled. | Table menu, table row, side panel. |
| Transformed events | Yes. Hiding from event streams isn't supported. | Side panel |
| Live events | Yes | Table menu, table row, side panel. |
| Planned events | No | |
| Unexpected events | No | |
| Blocked events | Yes | Table menu, table row, side panel. |
| Deleted events | No | |
To update an event's visibility:
1. Navigate to *Data > Events*.
2. Select the events you want to update.
3. In the menu that appears at the top of the table, click **Edit visibility** and select the areas where you don't want the selected events to appear.
================================================================================
# Event categorization
URL: https://amplitude.com/docs/data/change-event-category
================================================================================
# Event categorization
You can update an event type's category directly from the _Events_, _Custom Events_, or _Labeled Events_ tab. To do so, follow these steps:
1. Go to the _Events_ page and select the _Events_, _Custom Events_, or _Labeled Events_ tab.
1. Click the checkbox next to the event name.
1. From the _Categorize_ drop-down, select the category to which this event belongs.
{% callout type="note" heading="" %}
For events within _Events_, this only applies to **active** events **included in your tracking plan**.
{% /callout %}
You can also change the event's category from the *Category* column in the *Events*, _Custom Events_, or *Labeled Events* tables, or from inside its right-hand fly-out panel. From a table, change the status from the *Category* column's drop-down menu. Click the event name to open its _Details_ panel, then navigate to _Category_ and select the new category from the drop-down menu.
================================================================================
# Official events and properties
URL: https://amplitude.com/docs/data/official-events-and-properties
================================================================================
# Official events and properties
Mark the events and properties your team trusts as *official* to show that they're vetted, authoritative, and safe to use in analyses. Official designations help analysts and product managers build charts on reliable data, and Amplitude's AI agents favor official events and properties when they answer questions. Tracking-plan owners and data governors manage these designations as part of taxonomy maintenance.
Use official designations for the events and properties in your tracking plan. To endorse reusable analysis objects like metrics, custom events, cohorts, and segments instead, use [Object management](https://amplitude.com/docs/data/object-management).
## How official designations work
An official event or property is one a tracking-plan owner reviewed and endorsed as a source of truth. Marking an item official doesn't change the underlying data or how Amplitude ingests it. Instead, it adds a trust signal across Amplitude:
- Event and property selectors show an **Official** filter, so you can narrow long lists to endorsed items.
- Amplitude's AI agents weigh official events and properties more heavily when they choose data for an answer.
## Mark an event or property as official
Changing an event or property's official status requires the *Manage tracking plans* permission. Members without it can view which items are official but can't change the designation.
1. In Amplitude Data, go to *Events* or *Properties*.
2. Click the event or property name to open its details panel.
3. Click the **Official** control to mark the item official. Click it again to remove the designation.
To update several items at once, select them in the *Events* or *Properties* table, then set their official status from the menu at the top of the table.
## Find official events and properties
- In a chart's event or property selector, apply the **Official** filter to choose only endorsed items.
- In Amplitude Data, filter the *Events* or *Properties* table by official status to review which items your team endorsed.
{% callout type="note" heading="" %}
Marking an event or property official is a trust signal only. It doesn't block, hide, or transform data. To control which data Amplitude ingests, use blocking and [transformations](https://amplitude.com/docs/data/transformations).
{% /callout %}
================================================================================
# Set an event's activity status
URL: https://amplitude.com/docs/data/change-event-activity-status
================================================================================
# Set an event's activity status
You can specify whether Amplitude considers an event to be **active** or **inactive**. An active event is one the user actively engaged with, like clicking the Add to Cart button. An **inactive** event is one that happened to the user without any specific action on their part. Good examples include events like `Push Notification Sent` or `Message Received`.
Setting an event as inactive removes that event from any dashboard metrics counting active users and active events. Users who only trigger inactive events **don't count** as active users for that day, though they **do** count towards Amplitude's new user definitions.
{% callout type="note" heading="" %}
When you change an event's activity status from active to inactive, Amplitude applies that change **immediately and retroactively**, so expect to see changes in your historical data. Inactive events still count against your event volume.
{% /callout %}
To change the activity status, follow these steps:
1. Click the checkbox next to the event name. You can select more than one event to change the status of multiple events at once.
2. Click the *Edit Activity* drop-down menu.
3. Select the new event status.
{% callout type="note" heading="" %}
This only applies to **active** events and event properties **included in your tracking plan**. It also **doesn't** apply to custom events.
{% /callout %}
You can also update the Activity status from the *Activity* column in the *Events* table, or the *Details* flyout of a specific event. From the *Events* table, change the status from the *Activity* column's drop-down menu. Click an event's name to access the *Details* flyout, and change the *Activity* status from the drop-down menu.
================================================================================
# Property types
URL: https://amplitude.com/docs/data/update-property-data-type
================================================================================
# Property types
Amplitude uses type checking for event and user property values, so it can detect when event data doesn't match the specified type. You can set and edit the data type of an event or user property, for example, from a string to a Boolean. This helps as your data and analysis needs shift and expand over time.
To edit the data type of a user property, follow these steps:
1. Click the property's name to open the details panel.
2. Select the property's new data type from the *Type* drop-down. Options include:
* `String`: A string value.
* `Number`: Numerical values (like 12345).
* `Boolean`: Values representing Boolean states ("true"/ "false", "yes" / "no", "0" / "1").
* `Array`: A collection of values stored in a single property (for example, ["apple", "banana", "strawberry"] or [1, 2, 3]).
* `Enum`: One of a set of possible values (for example, property fruit is one of [apple, banana, strawberry]).
* `Const`: Set as a constant.
* `Any`: Any value.
================================================================================
# IP address, location, user agent, and device properties
URL: https://amplitude.com/docs/data/understand-ip-address-and-location
================================================================================
# IP address, location, user agent, and device properties
Amplitude derives a user's location, device, and platform properties from data that arrives with each event, rather than requiring you to set those properties yourself. It looks up city, region, and country from the event's IP address with the MaxMind GeoIP database, and parses the user agent string that client-side SDKs send to set device, operating system, and browser properties. You can override the location values server-side through the HTTP API, or stop Amplitude from using the IP address by disabling IP tracking in the SDK or dropping IP addresses after ingestion.
## How Amplitude tracks location properties
Amplitude uses the [MaxMind](https://www.maxmind.com/en/home) database to look up location information from the user's IP address. Even though MaxMind data is reliable, the [accuracy and availability of city and region information can vary by country](https://www.maxmind.com/en/geoip2-city-accuracy-comparison?country=&resolution=50).
By default, Amplitude uses GeoIP to gather location property values based on `location_lat` and `location_long`. You can explicitly define how Amplitude tracks a user's location properties server-side. Amplitude's [HTTP API](https://amplitude.com/docs/apis/analytics/http-v2) lets you send your own `[Amplitude] City`, `[Amplitude] DMA`, `[Amplitude] Region`, and `[Amplitude] Country` values with your events.
{% callout type="note" heading="" %}
If you send these values, Amplitude doesn't modify them to reflect GeoIP. Always update all four fields together, because setting any one of the fields resets the others.
{% /callout %}
## How Amplitude determines location properties when IP address is unavailable
Amplitude supports both disabling IP address tracking in the SDK configuration and dropping IP addresses after ingestion. The method you choose affects how Amplitude can determine location properties.
### Disable IP address tracking in the SDK
When you disable IP address tracking in the SDK configuration (for example, [Browser SDK](https://amplitude.com/docs/sdks/analytics/browser/browser-sdk-2#optional-tracking), [Android-Kotlin SDK](https://amplitude.com/docs/sdks/analytics/android/android-kotlin-sdk#disable-tracking), [iOS Swift SDK](https://amplitude.com/docs/sdks/analytics/ios/ios-swift-sdk#disable-tracking)), Amplitude never receives the IP address. Amplitude's back-end services can't reconcile the user's location, and any location properties remain empty.
### IP address filtering
If you request [Amplitude Support](https://gethelp.amplitude.com) to drop IP addresses after ingestion, Amplitude's back-end services process the IP address to determine location, but the IP address itself doesn't persist in Amplitude. Location properties on an event are filled, but the IP address remains empty.
## How Amplitude parses user agent and device information
Amplitude automatically parses the user agent string from client-side SDKs to extract device and platform information. Amplitude adds this information to your events as properties, letting you segment and analyze user behavior across different devices and platforms.
### User agent parsing
When client-side SDKs (for example, Browser, iOS, Android) send events, Amplitude automatically captures and parses the user agent string to find:
1. **Device model**: the specific device model (for example, `iPhone 13`, `Samsung Galaxy S21`).
2. **Operating system**: the OS and its version (for example, `iOS 15.4`, `Android 12`).
3. **Browser**: for web traffic, the browser and its version (for example, `Chrome 98.0.4758.102`).
4. **Platform**: the general platform category (for example, `iOS`, `Android`, `Web`).
5. **Manufacturer**: the device manufacturer (for example, `Apple`, `Samsung`).
### Device properties
Amplitude automatically adds the following device-related properties to events:
| Property | Description | Example Values |
| --------------------- | ------------------------------------------------------------------ | ----------------------------------- |
| `device_brand` | The manufacturer of the device. | "Apple", "Samsung", "Google" |
| `device_manufacturer` | Like `device_brand`, but may contain more specific information. | "Apple Inc.", "Samsung Electronics" |
| `device_model` | The specific model of the device. | "iPhone13,2", "SM-G998U" |
| `device_type` | The type of device. | "iPhone", "Android" |
| `os_name` | The name of the operating system. | "iOS", "Android", "Windows" |
| `os_version` | The version of the operating system. | "15.4", "12.0", "11" |
| `platform` | The platform category. | "iOS", "Android", "Web" |
| `browser` | For web traffic, the browser used. | "Chrome", "Safari", "Firefox" |
| `browser_version` | For web traffic, the browser version. | "98.0.4758.102", "15.3" |
### How user agent parsing works
1. **Client-side collection**: the SDK automatically collects the user agent string from the client device.
2. **Server-side parsing**: when Amplitude receives the event through the [HTTP V2 API](https://amplitude.com/docs/apis/analytics/http-v2) or other ingestion paths, Amplitude parses the user agent string using a combination of regular expressions and user agent parsing libraries. If `os_name`, `os_version`, or `device_model` appear on the request, then those values appear on the final event. If not provided, Amplitude parses the `user_agent` field to set those values on the event. Fields such as `device_family` and `device_type` come from a combination of `device_brand`, `device_manufacturer`, and `device_model`. `device_manufacturer` and `device_brand` are expected to be top-level fields on the event, but can be null.
3. **Property assignment**: Amplitude adds the parsed information to the event as properties.
4. **Analysis availability**: these properties are then available for segmentation, filtering, and analysis in Amplitude.
### Controlling device property tracking
To disable automatic tracking of certain device properties, use the `trackingOptions` configuration in the SDK. For example, in the Browser SDK:
```javascript
amplitude.init(AMPLITUDE_API_KEY, {
trackingOptions: {
platform: false,
language: false
}
});
```
### Mobile-specific device information
For mobile SDKs (iOS, Android), Amplitude collects additional device information:
1. **iOS**: device model, OS version, and carrier information when available.
2. **Android**: device model, manufacturer, OS version, carrier, and screen dimensions.
This information can help you understand how your app performs across different device types and OS versions.
### Custom device properties
If you need to track additional device information that Amplitude doesn't automatically capture, you can add custom properties to your events:
```javascript
// Example of adding custom device properties
amplitude.track('Button Clicked', {
'screen_resolution': '1920x1080',
'connection_type': 'wifi',
'battery_level': 85
});
```
================================================================================
# Override a property definition
URL: https://amplitude.com/docs/data/override-property
================================================================================
# Override a property definition
Overriding property details is helpful when you want to customize the property for a specific event or property group, without updating the original version or creating an entirely new event property.
Each property in the properties table represents the original version, which can be shared across multiple events and property groups. Amplitude Data applies changes to the details of any property to all events and property groups that share the original details. When you override a property on an event or property group, any changes to that property apply only to that event or property group.
## Override a property
To override a property on a specific event, follow these steps:
1. Navigate to the *Events* table and click an event's name.
2. In the event details panel that opens, navigate to *Details > Properties*. Then click the property you want to override.
3. In the event property details panel that opens, click **Override**. A message confirms that any changes to the property apply only to that event.
To override a property on a property group, follow these steps:
1. From within *Properties*, open the *Event Properties* tab to view the event properties table.
2. Click **Property Groups** to switch to the property groups table view. Then click a property group name.
3. In the property details panel that opens, navigate to *Details > Properties*, and click the property you want to override.
4. In the event property details panel that opens, click **Override**.
{% callout type="note" heading="" %}
Any changes to a property that's overridden on a property group apply to all events that use that property group.
{% /callout %}
You can always [revert an overridden property](https://amplitude.com/docs/data/override-property) when you no longer need the override.
================================================================================
# Revert an overridden property definition
URL: https://amplitude.com/docs/data/revert-overridden-property
================================================================================
# Revert an overridden property definition
Reverting an [overridden property](https://amplitude.com/docs/data/override-property) to its original version is a quick way to retroactively clean up your tracking plan and maintain consistency across your event properties. Doing so tells Amplitude Data to update the property to match the latest state of the original version listed in the event properties table. After reverting, any changes to the property also apply to any events or property groups that use the original version of that property.
## Revert an overridden property
To revert an overridden property on a specific event, follow these steps:
1. Navigate to the *Events* table and click an event's name.
2. In the event details fly-out, navigate to *Details > Properties* and click the event property you want to revert.
3. In the event property details panel that opens, click **Manage Override**.
4. From the dropdown menu that opens, select **Revert To Original**.
{% callout type="note" heading="" %}
Event rows that include "via property group…" appear in the list because those events use a property group that includes this event property. Reverting the property on any one of those events reverts the property on all of them.
{% /callout %}
To revert an event property on a property group, follow these steps:
1. From within *Properties*, open the *Event Properties* tab to open the event properties table.
2. Click **Property Groups** to switch to the property groups table. Then click a property group name.
3. In the property group details panel, navigate to *Details > Properties* and click the property you want to revert.
4. In the event property details panel, click **Manage Override**.
5. From the dropdown menu that opens, select **Revert To Original**.
{% callout type="note" heading="" %}
To see how the details change after a revert before starting the process, click **Compare To Original**. The original values appear under any overridden values. Turn off this view by clicking *Manage Override > Hide Comparison*.
{% /callout %}
To review and revert any overrides for a specific property, follow these steps:
1. From within *Properties*, open the *Event Properties* tab to open the event properties table, and then click a property name.
2. In the event property details panel, open the *Used By* tab. Any events or property groups labeled as overridden use an overridden version of that event property.
3. Hover over the overridden event or property group row you're interested in and click the three-dot icon on the right.
4. From the dropdown, select **Revert To Original**.
You can bulk revert all overrides from the *Used By* tab. Click **Manage**, and a modal opens that lets you review and bulk revert your overrides.
================================================================================
# Using property groups
URL: https://amplitude.com/docs/data/property-updates-property-groups
================================================================================
# Using property groups
With property groups, you can define groups of properties so Amplitude Data can apply them to events quickly.
Property groups make it easier to manage complex tracking plans, because you don't have to keep adding the same properties to events multiple times. When you update a property group, Amplitude Data applies the changes to all events that use the group.
For example, a music app's tracking manager might need a way to streamline creation of events relating to songs. Each of these events includes the following properties:
* `albumName`
* `artistName`
* `genre`
* `recordLabel`
* `releaseDate`
* `songDuration`
* `songTitle`
Instead of individually adding properties to every one of these events, the tracking plan manager can add these properties to their own property group. Whenever they create a new song-related event that includes these properties, they only have to add the entire group to the event.
Another benefit is that whenever they edit or update a property (but not a property value), that edit carries over to all events that include the group to which the property belongs.
For example, imagine the tracking manager wants to change the `recordLabel` property from a text string to a numeric code to align with a standardized database of record labels. As soon as they make the change in Amplitude Data, that property updates for every event that uses the `Songs` property group.
Using property groups also makes sure you use the same iteration of a property with your events. In Amplitude Data, you can have multiple iterations of a property, which can sometimes be confusing when adding properties to events.
## Create a property group
To create a property group, follow these steps:
1. Navigate to *Properties > Event Properties* and click **Property Groups**.
2. Click **+ Create property group**.
3. In the flyout window, enter a name for the group. Then add a description and any tags, if needed.
4. Click **+ Add property** to begin adding properties to this property group.
5. Select an event property from the dropdown menu. You can either scroll until you find it, or you can begin typing its name in the search box until it appears.
6. Repeat the previous step until you've added all the properties you want to include in the property group. Amplitude saves your progress automatically.
## Add a property group to an event
To add a property group to an event, follow these steps:
1. In *Events*, click the name of the event you want from the list. The event's flyout window opens.
2. In the *Details* tab, find the *Properties* section and click **+ Add property**.
3. In the dropdown list that appears, any existing property groups appear first. Find the one you want and click it.
If any property in the group already exists as a direct property on the event, Amplitude Data shows a confirmation dialog listing the affected properties and events. Confirm to remove the direct mappings and serve those properties through the group instead. The properties stay live on all affected events. This is a reorganization, not a deletion.
To modify the properties for a property group, follow these steps:
1. Navigate to *Properties* and click **Property Groups**.
2. Scroll until you find the group you want to modify and click it. Its flyout window appears.
3. Make your changes. The changes apply across all events or sources.
If you add a property to the group that already exists as a direct property on an event where this group is used, Amplitude Data shows a confirmation dialog listing the affected events. Confirm to remove the direct mapping and serve the property through the group instead.
{% callout type="note" heading="" %}
This only applies to active events and event properties included in your tracking plan. It also doesn't apply to custom events.
{% /callout %}
================================================================================
# Cross-project analysis with Portfolios
URL: https://amplitude.com/docs/data/cross-project-analysis
================================================================================
# Cross-project analysis with Portfolios
Amplitude Data's portfolio feature lets you create cross-product analyses by combining multiple source projects into a single view.
With this feature, you can create portfolios in Analytics and build charts using data aggregated across all the source projects in your portfolio. To learn more, refer to [Portfolio: Conduct cross-project analysis in Amplitude](https://amplitude.com/docs/admin/account-management/portfolio).
Portfolios managed in Amplitude Data behave differently from legacy portfolios managed in the Govern section of Amplitude Analytics. Legacy portfolios didn't let users rank source projects, or show event or property metadata from the source projects in the portfolio by default.
This article covers portfolios editable only from within Amplitude Data. Portfolios you manage in Analytics or Data return the same aggregated data when queried through charts.
{% callout type="note" heading="Portfolio project limits" %}
Portfolios support up to five projects. If your use case requires more, contact your account team to unlock up to 10 projects in a portfolio.
{% /callout %}
## Create a portfolio
To create a portfolio in Amplitude Data, follow these steps:
1. From the project selector in Amplitude Data, select *+Create new Portfolio*.
2. In the modal that appears, name your portfolio and select the projects to include. When you're done, select *Next*.
3. Next, rank the schemas of the source projects you included. Ranking handles instances where Amplitude Data encounters conflicts or differences in the schemas. The order in which you rank them determines which schemas Amplitude Data regards as the source of truth. If an event or property name exists in multiple source projects, Amplitude Data uses and displays the metadata from the prioritized project in this portfolio.
To rank the schemas, drag the project names into your preferred prioritization order.
{% callout type="note" heading="" %}
The metadata for an event or property from the source project (description, category, display name, activity, visibility) is in the Data-managed portfolio by default.
{% /callout %}
4. Select *Create Portfolio* to finish the creation process.
Customize events and property metadata in the portfolio.
You can customize event and property metadata in your portfolio by using an [override](https://amplitude.com/docs/data/override-property).
## Import existing portfolios into Amplitude Data
You can import existing Analytics-managed portfolios into Amplitude Data. To do so, select the project selector and find the portfolio you want to import, either by searching for it or locating it under "Projects (managed in Analytics)".
After Amplitude imports your portfolio, you can view the existing aggregated list of events and properties.
{% callout type="note" heading="" %}
Amplitude Data creates overrides in the imported portfolio for all events and properties. This approach maintains the existing schema for users of the Analytics-managed portfolio.
{% /callout %}
================================================================================
# Data Assistant Overview
URL: https://amplitude.com/docs/data/use-ai-data-assistant
================================================================================
# Data Assistant Overview
A clean, organized tracking plan helps you get the most value from Amplitude Data. When you have hundreds or thousands of events and properties, maintaining the plan can be difficult, especially when identifying what to fix in messy data.
Amplitude's AI Data Assistant helps you maintain your tracking plan by showing a short list of suggested modifications whenever you visit the Data home page. Amplitude's internal AI generates these suggestions automatically. Any changes you apply through Data Assistant post directly to your tracking plan, with no other action required.
## Update your tracking plan with Data Assistant
To update your tracking plan using Data Assistant, follow these steps:
1. Open Amplitude Data. Data Assistant appears at the top of the home page, displaying a list of top suggestions.
Data Assistant orders suggestions by priority, which it determines by looking at event volume, query counts, and other signals.
2. Select a specific suggestion to review by clicking *Review*, or review all suggestions by clicking *Review All*. The Assistant page opens.
3. The left sidebar lists all suggested modifications for your tracking plan. Click any suggestion to see the events the suggestion affects.
Data Assistant groups similar suggestions together to rank the most important issues and make the update process easier.
For more detail on why Data Assistant made a specific suggestion, hover over the Info icon.
You can apply the suggestion to all, some, or none of the events listed. To apply them all, click *Apply All*. To apply none, click *Reject All*.
To apply (or reject) the suggestion for only certain events, check the boxes for those events and click *Apply Suggestions* (or *Reject Suggestions*), or click *Apply* (or *X*) next to each event you want to update.
## Automated tasks in Data Assistant
Data Assistant provides automated tasks to help you clean up your data. Automated tasks let data governors define conditions and actions that the system performs automatically. Automated tasks automate repetitive clean-up workflows by turning Data Assistant recommendations into automatic actions.
For more information, go to [Automated Tasks](https://amplitude.com/docs/data/automated-tasks-in-data-assistant).
{% callout type="note" heading="" %}
Data Assistant is one of several AI tools in Amplitude. For analytics insights, chart creation, and natural-language data exploration, refer to [Global Agent](https://amplitude.com/docs/amplitude-ai/global-agent-overview). For automated dashboard analysis and session replay insights, refer to [AI Agents](https://amplitude.com/docs/amplitude-ai/setup-and-onboarding).
{% /callout %}
================================================================================
# Automated Tasks
URL: https://amplitude.com/docs/data/automated-tasks-in-data-assistant
================================================================================
# Automated Tasks
Automated Tasks are part of Amplitude's [Data Assistant](https://amplitude.com/docs/data/use-ai-data-assistant) feature. Automated tasks let data governors define conditions and actions that Amplitude then performs automatically. Automated tasks turn Data Assistant recommendations into automatic actions and streamline repetitive clean-up workflows. For example, an automated task can delete events that have gone unused for 90 days.
After you create an automated task, it runs daily.
{% callout type="note" heading="" %}
Automated tasks are only available to users with manager or admin permissions. Contact your administrator if you can't access Automated tasks as an option for Data Assistant.
{% /callout %}
Access your automated tasks from the Data Assistant by going to *Data > Assistant > Automated Tasks*.
If you have active automations, Amplitude displays them with a current count of the affected events. If you don't have any active automations, you can create one.
By default, automated tasks operate across all projects within a workspace. You can specify for the automation to only search through a single project.
## Types of automated tasks
You can select any of the following types of tasks to automate:
- Clean up stale events.
- Clean up single-day events.
- Clean up unused events.
### Clean up stale events
This task removes events that haven't had any recent volume. Low volume indicates that Amplitude isn't ingesting the events and they're no longer of value. The task inspects your organization for events that have a `last seen` date within a configurable number of days. For example, events that haven't been ingested in 90 days.
When the automated task finds events that match those criteria, it schedules them for deletion. Amplitude notifies all people using those events through email or Slack about the impending deletion. Anywhere the events appear (for example, in a chart), a banner notifies users about the upcoming deletion. If anyone wants to keep the event, they can do so through the email or banner notification. If no one elects to keep the event within 30 days, Amplitude deletes the event. The 30-day timeframe to delete events isn't configurable. Deleted events no longer appear in the event drop-down menu, and Amplitude blocks them from future ingestion.
Historical charts and data aren't affected.
### Clean up single-day events
This task removes accidental or one-time test events that can negatively affect or clutter your taxonomy. The task inspects your organization for events that:
- Have the same first seen and last seen dates.
- Have that date more than a configurable number of days before the inspection date. For example, 90 days before the inspection date.
When the automated task finds events that match those criteria, it schedules those events for deletion. Amplitude notifies all people using those events through email or Slack about the impending deletion. Anywhere the events appear (for example, in a chart), a banner notifies users about the upcoming deletion. If anyone wants to keep the event, they can do so through the email or banner notification. If no one elects to keep the event within 30 days, Amplitude deletes the event. The 30-day timeframe to delete events isn't configurable. Deleted events no longer appear in the event drop-down menu, and Amplitude blocks them from future ingestion.
Historical charts and data aren't affected.
### Clean up unused events
{% callout type="tip" heading="Manually enabled" %}
The Clean up unused events automated task can affect events that you want to keep. The task must be manually enabled for each account. Reach out to your Amplitude representative or [Amplitude Support](https://gethelp.amplitude.com/hc/en-us/requests/new) for more information or to get this task enabled.
{% /callout %}
This task optimizes your event volume by making sure that all your ingested events are actively used. The task inspects your organization for events that haven't been queried in 90 days. When it finds those events, it can notify you about them, schedule those events for deletion within 30 days, and notify you when Amplitude deletes them.
Your users can save events through the notification from the automated task or through the Data Assistant. Amplitude doesn't delete saved events, even if no one queries them during the time window.
If the task deletes an event, the deletion also blocks future ingestion of that event. Any data that Amplitude doesn't collect because of an event's deleted status isn't recoverable. Historical charts and data aren't affected. The deleted event still appears in them.
You can manually recover a deleted event at any time.
## Set up an automated task
You can manually set up an automated task. Alternately, the [Data Assistant](https://amplitude.com/docs/data/use-ai-data-assistant) can proactively identify tasks for you.
##### To manually set up an automated task
1. Go to *Data > Assistant > Automated Tasks tab*.
2. Click **Get Started**.
3. Complete the set up prompts. This includes:
- Setting the threshold (in days). By default, the threshold is 30 days for single-day events and 90 days for stale events.
- Specifying any event tags that the automation rule should ignore. For example, if you never want to remove creation events, add a `create` tag to the ignore field. Review your events to make sure you specify the exact tag applied to your event.
4. Click **Set Up Automation**.
##### To set up an automated task through the Data Assistant
If Amplitude detects events that meet a task's criteria, those suggested tasks appear in the Suggestions view under *Data > Assistant*. If automation is available for that task, a banner appears above the suggestion.
Click the banner to turn on automation for future matching events. Amplitude takes you to the window to complete the task set up.
## Remove an automation
You can remove any current automation. When removing an automation, you can specify whether you want to affect any pending changes or to only affect future changes.
##### To remove an automated task
1. Go to *Data > Assistant > Automated Tasks*.
2. Click **View Automation**.
3. In the automated task window, click the **three-dot** option menu.
4. Click **Remove Automation**.
5. Confirm whether you want to also remove any pending changes from the task, then click **Remove**.
## Recover deleted events
You can recover any deleted event at any time.
##### To recover a deleted event
1. Go to *Data > Events*.
2. Click **Deleted Events**.
3. Select the event you want and click **Restore**.
================================================================================
# Remove invalid or incorrect data
URL: https://amplitude.com/docs/data/remove-invalid-data
================================================================================
# Remove invalid or incorrect data
To remove invalid or incorrect data from your Amplitude analyses, use one of four Amplitude Data methods: create a drop filter, create a block filter, block events and properties, or delete events and properties. Drop filters hide events from queries and stay reversible. Block filters and blocking stop Amplitude from ingesting matching data going forward. Deleting removes an event or property from your plan but keeps historical data. Data is immutable after ingestion, so none of these methods change data that Amplitude already stored.
To permanently delete data, use [Amplitude's self-service data deletion feature](https://amplitude.com/docs/admin/account-management/self-service-data-deletion-in-amplitude).
## Create a drop filter
You may find you've loaded incorrect data and want to filter it out from queries. Amplitude Data's drop filters feature lets you remove specific event data from your charts at query time. Amplitude doesn't delete these events, and you can restore them to your charts by editing or deleting the drop filter. Drop filters don't apply to data exports.
{% callout type="note" heading="" %}
As query-side filters that aren't applied during data ingestion, drop filters don't affect your event volume limit.
{% /callout %}
To create a drop filter, follow these steps:
1. Make sure you're on `main`, as filters aren't accessible from any other branch.
2. In the left-hand sidebar, click **Filters**, then select the *Drop Filters* tab.
3. Click **+ Create Drop Filter** to open the Filter Configuration fly-out panel.
4. Click **Select event ...** to choose the event you want to filter on.
5. Optionally, click **+ where** to include any relevant properties that refine your filter. For example, perhaps you want to filter out all purchase events that come from a specific geographical location. Select that location from the list of properties and set the evaluation to `is not equal`.
6. Specify the time range for the events you want Amplitude Data to drop-filter out.
7. When you're ready, click **Drop Data** to initiate the drop filter.
To edit or delete a drop filter, click its name in the drop filter list. In the fly-out panel that appears on the right, make your edits and click **Update Drop Filter**.
{% callout type="note" heading="Drop filter details" %}
Note the following about drop filters:
* Drop filters don't affect event streams.
* You must use the same operator across all selected properties.
* You can mix and match event and user properties.
* You can have a maximum of three properties.
* You can't use any property more than once.
{% /callout %}
## Create a block filter
Block filters let you stop data ingestion for events and properties that you specify based on criteria you define. Blocking Amplitude from ingesting data can help when you need to act quickly before you update your code.
Block filters let you:
- Block events based on an event property or Amplitude property. For example, events from a specific data source.
- Block events from a specific IP address or set of IP addresses. Use this to block traffic from a test server or bad actor.
- Block events from a specific version of your application to help find and fix instrumentation issues.
- Block event or user properties that start with a particular string, or properties with numeric names to help uncover instrumentation issues.
- Block bot traffic from websites.
When you add or remove a block filter, allow up to 10 minutes for the change to take effect. As soon as the filter is active, it blocks Amplitude from ingesting matching data.
{% callout type="warning" heading="" %}
Amplitude doesn't collect data for blocked events or properties. As a result, you can't recover information about blocked data at a later time, because Amplitude never ingests it. If you think you may need data at some point in the future, consider hiding the event or property instead.
{% /callout %}
To create a block filter:
1. Make sure you're on your project's `main` branch in Data.
2. Click **Filters** in the side navigation.
3. Click **+ Create Block Filter**.
4. Specify the project and data type (Events, Event properties, User properties, or Bot traffic). If applicable, use the available filtering parameters.
5. Click **Block Data** to initiate the block filter.
### Block events based on property values
Block events based on the value of up to three event properties.
When you block events based on property values, Amplitude compares your filter against the raw stringified values sent to Amplitude. Knowing the data type is important in the following scenarios:
- Boolean values: If you send a property as `true` or `false`, Amplitude displays the value as "True" or "False". To use this in a Block filter, specify the exact value sent as a string. In this case, `true` or `false`.
- Array values: Amplitude splits arrays into separate values for querying. Block filters compare against the stringified raw value.
To find raw property values, use the [Event Explorer](https://amplitude.com/docs/analytics/charts/event-explorer) to view an example of the event you want to block.
### Block events and properties from your plan
Create Block filters from your Events or Properties list.
1. Make sure you're on your project's `main` branch.
2. In Data, navigate to the Events or Properties tab.
3. Select the Events or Properties you want to block.
4. After selecting, click **Block** to create the filter, and confirm the block.
5. To unblock a blocked event, repeat the previous steps and click **Unblock**.
{% callout type="note" heading="" %}
Custom events are a virtual grouping of your ingested events and aren't blockable. Instead, block the individual events that make up the custom event.
{% /callout %}
## Block events and properties
You can prevent Amplitude Data from ingesting data on a specific event, event property, or user property by blocking it. Amplitude Data immediately stops processing data for that event or property until you decide to unblock it.
{% callout type="warning" heading="" %}
Because Amplitude Data doesn't ingest any data for blocked events or properties, you can't recover any information about them at any future date. If you don't want to display a specific event or property but think you may someday need this data, consider hiding the event or property instead.
{% /callout %}
To block an event or property, follow these steps:
1. Make sure you're in the `main` branch. You can only block events and properties from there.
2. Navigate to *Events* or *Properties*, depending on which one you want to block.
3. Find the event or property you want to block and click the checkbox next to its name.
4. If blocking an event, click the **Block** dropdown menu, and choose either **Block now** or **Schedule for blocking**. If blocking a property, click **Block**.
5. A confirmation modal appears. If you still want to block the event or property, click **Block**.
6. To unblock a blocked event, follow steps 1-5 and click **Unblock** instead of **Block**.
{% callout type="note" heading="" %}
You can't block custom events.
{% /callout %}
## Delete events and properties in Amplitude Data
If you ingest events or properties that you no longer need, you can delete them from your plan.
When you delete an event or property, Amplitude blocks it from future ingestion and removes it from chart dropdowns to prevent future querying. The event or property doesn't count toward your monthly event volume or instrumentation limit.
Deleting an event or property doesn't remove historical data. Charts that reference a deleted event load with data from before you deleted the event and indicate the event is deleted.
Deleted user properties still appear on events that are already ingested, and you can still see them in historical user stream data.
To delete an event or property:
1. Navigate to the Events or Properties section of Amplitude Data.
2. Find the events or event properties you want to delete and click the checkboxes next to their names.
3. Click **Delete**.
4. Complete the verification modal.
You can undelete a deleted event or property.
1. From the status filter dropdown, select **Deleted** to find your deleted events or properties.
2. Find the items you want to restore and click the checkboxes next to their names.
3. Click **Restore**.
## Delete an entire user
To delete a user entirely, use the [User Privacy API](https://amplitude.com/docs/apis/analytics/user-privacy). This API lets you delete a user, their events, and any associated data, and helps you keep compliant with data laws and regulations.
================================================================================
# Block bot web traffic
URL: https://amplitude.com/docs/data/block-bot-traffic
================================================================================
# Block bot web traffic
If you track events on public, unauthenticated websites, bot web traffic from crawlers, scrapers, and similar tools can affect your metrics. Amplitude Data lets you use a **block filter** to prevent that data from being ingested.
## How bot blocking works
Amplitude blocks bot traffic based on User-Agent, as identified by the [IAB/ABC International Spiders and Bots List](https://www.iab.com/guidelines/iab-abc-international-spiders-bots-list/). Blocking applies by default to data sent through the [legacy JavaScript SDK](https://github.com/amplitude/Amplitude-JavaScript) or the [TypeScript Browser SDK](https://github.com/amplitude/Amplitude-TypeScript/tree/main/packages/analytics-browser) (version 1.10.0 and later). You can also provide the `user_agent` field directly on events sent through the HTTP API or Batch API. Be careful when doing this, because the value **must represent a valid browser** or Amplitude drops the event.
You can't recover data that a block filter removes, because Amplitude never ingests it.
## Create a block filter for bot web traffic
To create a block filter for bot web traffic, follow these steps:
1. Make sure you're on `main`. Filters aren't accessible from any other branch.
2. In the left-hand sidebar, click *Filters*, then select the *Block Filters* tab.
3. Click *+ Create Block Filter* to open the Filter Configuration fly-out panel.
4. Select *Bot Traffic* from the *Block* drop-down.
5. When you're ready, click *Block Data* to start the block filter.
## Related resources
- [Block and filter internal users](https://amplitude.com/docs/data/troubleshooting/instrumentation-issues#block-and-filter-internal-users): Learn how to exclude internal user data from your metrics.
- [Winsorization in Experiment](https://amplitude.com/docs/feature-experiment/advanced-techniques/winsorization-in-experiment): Find and resolve outliers that may skew your experiment results.
================================================================================
# Change the description of an event or property
URL: https://amplitude.com/docs/data/change-event-description
================================================================================
# Change the description of an event or property
You can change the description for an **event** to help other members of your organization understand what an event represents. To do so, follow these steps:
1. Click the event name to open the fly-out panel on the right side.
2. Click the *Description* field.
3. Type in a description of the event.
You can change the description for an **event property** in two different ways. Because the same event property can apply to multiple event types, you can either add a description for the **original** event property, or for an event property overridden for a specific event or property group. If no override exists, the description defaults to the global event property.
{% callout type="note" heading="" %}
Event properties that aren't overridden share the same **original** event property details.
{% /callout %}
To change the description for an overridden event property **specific to an event**, follow these steps:
1. Navigate to the *Events* table and click the event name.
2. In the event details panel that opens, navigate to *Details > Properties*, then click the property you want to update.
3. Make sure the event property is overridden. If it is, *Manage Override* appears in the blue box within the details panel, and you can skip to step 4. Otherwise, click *Override* to apply the change only to a specific event or property group.
4. Click the field directly below the property name and type in a description of the property.
To change the **original** description for an event property, follow these steps:
1. Navigate to *Event Properties* and click the property you want to update.
2. In the event property details panel that opens, click the field and type in a description of the property.
================================================================================
# Fix your data with transformations
URL: https://amplitude.com/docs/data/transformations
================================================================================
# Fix your data with transformations
Transformations in Amplitude Data rewrite event data at query time to correct instrumentation mistakes without touching your code. They apply retroactively across all historical data, so a single rule fixes affected events both before and after you create it. Common fixes include merging duplicate events, consolidating property names, renaming property values, and hiding values from the UI.
Use a transformation when you need to fix data retroactively across historical and future events without redeploying instrumentation. Use a custom event instead when you want to group existing events into a new analytical event while keeping the originals queryable.
You can only create transformations on a project's `main` branch with the *Show transformations* toggle set to `ON`, and you can't transform Amplitude's default user properties.
{% callout type="note" heading="" %}
Transformations occur at query time when a chart or cohort generates results. This doesn't affect the raw data. Transformations don't affect raw data on Snowflake or Redshift.
{% /callout %}
## Merge events, event properties, and user properties
Many Amplitude users need to merge superfluous or duplicate events, event properties, or user properties. Transformations make this process easy.
### Merge events
This transformation lets you merge events together. Use it if you're tracking two or more events that you want to track as one single event instead. For example, you can merge the events `comment_reply_like` and `comment_share` into a single event, `comment`.
When merging events, you can also add a property that helps distinguish between the two original events after you merge them. This transformation can help if you're logging data into two events with similar syntax when you could log this information as one event with different property values instead. For example, you could transform the events `comment_reply_like` and `comment_share` into one event, `comment`. The event `comment` then has a new event property `comment type` with values `reply like` and `share`.
To merge events, follow these steps:
1. In Amplitude Data, navigate to *Events*.
2. Find the events you want to merge together and click the checkbox next to their names.
3. After you've selected the events, the *Transform* option appears in the menu bar above the events list. Click **Transform**.
4. Choose whether you want to merge the events you selected into a single event, or into a single event with an extra distinguishing property. Then click **Next**.
5. Use the dropdown in the *Transform & Merge Events* modal to tell Amplitude Data whether you want to merge the selected events into a new event, or whether you want to merge them into a different, already existing event. If you're merging into a new event, name it here. Then click **Preview**.
6. In step 5, if you aren't adding the extra distinguishing property to your merged event, skip to step 9.
Otherwise, select the event property you want to use as a differentiator from the *Select Property* dropdown. Then click **Next**.
7. Next, map the events you selected with new values for the property you selected. Enter the new value in the *Property Value…* field and click **Preview**.
8. Review your changes and click **Merge** to complete the transformation.
### Merge event properties or user properties
This transformation lets you merge properties, either for events or for users. Use it if you have two properties that track the same information but use different naming syntax.
For example, imagine an event property is called `title` in some cases, and in others, it's called `TITLE`, but they represent the same thing on all events. You can clean things up by transforming `title` and `TITLE` into `Title`, combining the data.
Similarly, a user property called `name` in some cases and `NAME` in others, even though they represent the same thing for all users, could be unclear. Transforming `name` and `NAME` into `Name` is a good way to resolve any potential confusion.
You can merge event properties only with other event properties, and user properties only with other user properties.
To merge event properties or user properties, follow these steps:
1. In Amplitude Data, navigate to *Properties*, then click either the *Event* or *User* tab, depending on which type of properties you want to merge.
2. Find the properties you want to merge together and click the checkbox next to their names. After you've selected the event properties, the *Transform* option appears in the menu.
3. From the *Transform* dropdown, select **Merge Property**.
4. The *Merge Properties* modal appears. Type a new event property name or type the name of the event property you want to merge the selected event properties into. Click **Next**.
5. Review your changes and click **Merge** to complete the transformation.
## Rename property values
This transformation lets you reassign event and user property values. Use this transformation if a property has misspellings or nonsensical values in dropdowns. It lets you hide them from the UI or turn them into another value.
For example, you can reassign the values of `true` and `TRUE` to `True`.
To rename a property value, follow these steps:
1. Navigate to *Properties* and open either the *Event* or *User* tab, depending on the type of property you want to rename.
2. Find the property with the property value you want to rename and click the checkbox next to its name.
3. From the *Transform* dropdown, select **Rename Value**.
4. The *Edit Renamed Values* modal appears. Under *Current Property Value*, click **Select value(s)...**.
5. From the list, select the value you want to rename and click **Apply**.
6. Under *Derived Value*, click **Select value...** to set a new value.
7. Click **New Value** and enter the new value in the field that appears.
8. Repeat steps 4 through 7 for every value you want to rename. Then click **Next**.
9. A confirmation modal appears. Click **Rename**.
## Hide property values
Setting a property value's visibility status to hidden is helpful for values you want to track but don't want to appear on the dashboard in any charts. Hiding a property value doesn't delete its raw data, and the value is still visible in the user's individual event stream.
To hide a property value, follow these steps:
1. Find the event or user property with the value you want to hide. Check the box next to its name.
2. From the *Transform* dropdown, select **Hide Values**.
3. Select the value or values you want to hide from Amplitude and click **Next**.
4. A confirmation modal appears. Click **Hide**.
## Edit and delete transformations
Transformations aren't permanent. You can reverse them, and you can edit or delete them at any time.
To edit your transformation, follow these steps:
1. Find the transformed event, event property, or user property you're interested in.
2. Click the transformation's name to open the details panel. Click **Transformed Values** to see the transformations tab.
3. Click **Edit** next to the transformation you want to edit, make the necessary changes, and save.
To delete your transformation, follow these steps:
1. Find the transformed event, event property, or user property you're interested in.
2. Click the checkbox next to the transformation you want to delete.
3. Click **Undo Transformation**.
4. A confirmation modal appears. Click **Undo Transformation**.
Deleting a transformation doesn't delete the original events.
## Use transformed properties for targeting
Transformed user properties are available as targeting criteria in Experiment, Feature Flags, and Guides & Surveys. At evaluation time, Amplitude applies your project's transformation configuration before evaluating targeting rules, so the same merge and rename rules that clean up your Analytics data also govern who gets targeted and exposed.
You don't need to reimplement transformation logic in your SDK or backend. Define the rules once in Amplitude Data and they apply consistently across Analytics, Experiment, Feature Flags, and Guides & Surveys.
For more details, refer to [Remote evaluation](https://amplitude.com/docs/feature-experiment/remote-evaluation#transformed-properties) and [Setup and targeting](https://amplitude.com/docs/guides-and-surveys/setup-and-target#targeting).
## Transformed events and custom events
| Topic | Custom Events | Transformed Events and Properties |
| --- | --- | --- |
| Analysis of individual components | Can perform analysis on the individual events used in the custom event. | Can only perform analysis on the transformed event. |
| Use case | Augment and group existing events into new events you can analyze. | Clean up events and fix instrumentation issues. |
| Drop and block filters | Not available to block and drop filters. | Transformed entities aren't available to block and drop filters. |
| Chart UI limitations | Limited availability in Funnels, but can't group by event name. | Available to most charts. |
| User lookup | Shows raw event data only. | Shows raw event data only. |
| Event type limit | Don't count toward the event limit. | Don't count toward the event limit. |
## Common questions
### I merged event A and event B together to create event C. What happens to saved charts that were querying on event A?
Any saved chart querying on event A continues to do so after the merge. The chart doesn't automatically switch from event A to event C. For charts created after the merge, neither event A nor event B appears in the chart dropdown; only event C appears.
### I merged event A and event B together to create event C. How do I bulk update the existing saved charts to now use event C?
You can't bulk update charts in Amplitude. Try adding all charts that still use the old events (in this example, events A and B) to a dashboard. Use **Find & Replace** to swap those events for event C, then click *Save onto Charts > Update existing charts*.
### I merged event property A and event property B together to create event property C. What happens to saved charts that were querying on event property A and event property B?
Saved charts don't automatically switch to a different event property after a transformation. Each chart keeps querying the property you saved with it until you edit the chart.
After the transformation, chart dropdowns only show the merged or target property. You can't create new charts that still query the old, untransformed property names.
How you update existing charts depends on how you merged properties:
* **You merged into a new event property C:** Update every saved chart that still queries event property A or B. For example, edit each chart and select event property C in the chart controls. You can also add those charts to a dashboard, use **Find & Replace** to swap the old properties for property C, then click *Save onto Charts > Update existing charts*.
* **You merged into an existing event property** (for example, you map both A and B into property A instead of creating a new name): Update any saved chart that still queries a source property you dropped. Charts that already query the target property don't need changes, because they already use the merged property.
### I want to unmerge event C. What happens to the charts that use this merged event?
The result depends on how you created event C in the first place.
* If you merged event A and event B into event C: after refresh, the chart's user/event totals drop to zero.
* If you merged event A and event C into event C: after refresh, the chart queries the source event C.
### Can I create a new transformation from an existing transformation?
Amplitude doesn't support transformations on transformations. To request this capability, submit a feature request.
### Event C is a merged event composed of source events A and B. Can I view event A and event B separately, then event C starting at the date of the transformation?
Transformations apply retroactively, so that isn't possible.
### Which value takes priority in a property merge?
Use this example: for one instance of event A, you send the event property `event prop` = `true`; for another instance of event A, you send the event property `event_property` = `false`. You then merge both event properties into `EVENT_PROPERTY`.
When you query on event A and group by `EVENT_PROPERTY`, this user appears twice. You see one data point for the `true` value and one for `false`.
================================================================================
# Time to Live (TTL)
URL: https://amplitude.com/docs/data/time-to-live
================================================================================
# Time to Live (TTL)
Amplitude Data's Time-to-Live (TTL) feature lets you control how long event data lives in your Amplitude instance. Set the retention period for event data at the organization level, and override it at the project level. When you enable TTL, a job runs daily to make sure that Amplitude retains your event data according to your TTL policy.
## Considerations
{% callout type="warning" heading="TTL causes irreversible data loss" %}
After you enable TTL, Amplitude deletes data outside of the retention period.
{% /callout %}
- Amplitude uses the date the event data reaches the Amplitude server when determining the retention period. Any backfill or migration of event data may affect the retention period for that event data.
- When you enable TTL and set a retention period, Amplitude deletes all event data sent to Amplitude outside of your retention period.
- Enabling TTL affects existing Amplitude reports. After you enable TTL, Amplitude zeros out charts that query data outside the set retention period. The charts appear as if the data for that period never existed within Amplitude.
- The initial deletion may take longer than daily deletions. Depending on an organization's historical event volume, it may take up to 30 days.
## Enable TTL
To enable TTL controls for your organization, contact your Account Manager at Amplitude or fill out a [support request](https://help.amplitude.com/hc/en-us/requests/new).
## Configure TTL for your organization
Amplitude Admins can configure TTL.
1. Navigate to *Organization Settings* and click the *Time to Live (TTL)* tab.
2. Choose the retention period.
3. Confirm your changes.
After you confirm, deletion of your event data starts in 24 hours. The initial deletion may take up to 30 days.
{% callout type="warning" heading="Canceling TTL" %}
To cancel TTL, an admin can rescind the request in the 24-hour period before data deletion begins. After 24 hours, the deletion begins and is irreversible.
{% /callout %}
### Add a project-level TTL override
Amplitude Admins can add overrides.
1. Navigate to *Organization Settings* and click the *Time to Live (TTL)* tab.
2. Click **Add Project TTL Override**.
3. Search for and select the project, and set the retention period.
4. Click **Save** to update the project's retention.
================================================================================
# Custom events
URL: https://amplitude.com/docs/data/custom-events
================================================================================
# Custom events
A custom event is a saved, reusable event that combines two or more existing events with an `OR` clause, so any of those events counts as the same step in an analysis. For example, a custom event can show users who, after receiving a push notification, either played a song or searched for one as their next step.
You can also [combine multiple events in-line](https://amplitude.com/docs/analytics/charts/event-segmentation/event-segmentation-in-line-events) through the Events Module, but an in-line event applies only to the chart where you create it. Save it as a custom event when you want to reuse the same combination across other charts.
You create a custom event in the _Events_ panel from one or more pre-existing events. Doing so tells Amplitude to combine those pre-existing events and count any user activity for them as activity for the new custom event. This approach helps when you want an easy way to track activity on related or similar events, like whether a visitor has fired either the `view_landing_page_1` or `view_landing_page_2` events.
For example, `Play or Search Song` is a custom event consisting of the `Play Song` event, the `Search Song` event, and an `OR` clause to connect the two. Any user who triggers either the `Play Song` event or the `Search Song` event has converted that second step.
Another method is conditioning an added event with an [event property or user property](https://amplitude.com/docs/data/user-properties-and-events). This is the primary method for analyzing whether a user performed one of many events.
## Before you begin
- Only admins, managers, and members can create custom events.
- You can use custom events in Event Segmentation, Funnel Analysis, Retention Analysis, Lifecycle, Stickiness, Impact Analysis, Journeys, Pathfinder, Conversion Driver, Experiment Results, and Compass charts.
- You can't query on custom events in Redshift.
- All custom events have the prefix `[Custom]` before the event name in your charts.
- Editing or renaming custom events used in other charts breaks those charts. Amplitude continues to query the named value until you manually change it on any charts that use it. Amplitude displays a warning when you make any edits to custom events.
- Querying event properties on custom events is possible only if the property applies to all events. If you try to create a custom event with five different events and want to see the location values from all those events, you need to instrument the location event property to all the individual events making up the custom event.
## Group two existing events into a single custom event
To group two events, follow these steps:
1. In Amplitude Data's left-hand rail, select **Events**. Then select **Create Custom Event**.
2. In the modal that appears, select the events you want to analyze as a single event. You can set different filters on these events, in case the analysis requires a more granular view of the selected events.
At this point, you can use this event for further analyses in Amplitude. Select the new event in the _Custom_ category in the appropriate chart drop-down menus.
## Custom events and transformed events
| Topic | Custom Events | Transformed Events and Properties |
| --------------------------------- | ------------------------------------------------------------------------ | ---------------------------------------------------------------- |
| Analysis of individual components | Can perform analysis on the individual events used in the custom event. | Can only perform analysis on the transformed event. |
| Use case | Augment and group existing events into new events which you can analyze. | Clean up events and fix instrumentation issues. |
| Drop and block filters | Not available to block and drop filters. | Transformed entities aren't available to block and drop filters. |
| Chart UI limitations | Limited availability in Funnels, but can't group by event name. | Available to most charts. |
| User lookup | Shows raw event data only. | Shows raw event data only. |
| Event type limit | Don't count toward the event limit. | Don't count toward the event limit. |
================================================================================
# Object management
URL: https://amplitude.com/docs/data/object-management
================================================================================
# Object management
Amplitude's object management feature lets you centrally manage analysis objects. Analysis objects are the reusable building blocks of your analyses, including [custom events](https://amplitude.com/docs/data/custom-events), [metrics](#metrics), and [segments](https://amplitude.com/docs/analytics/behavioral-cohorts).
With object management, you can:
* Create and update analysis objects.
* Remove duplicate analysis objects.
* View an analysis object's definition, and the charts it's used in.
* Bulk delete analysis objects.
## Common use cases
* Look for similar metrics, custom events, or segments during object creation to decide if any existing objects work, instead of creating another duplicate.
* Use the metadata (for example, sorting by L30D query volume) to identify the most underutilized objects and remove them from the system.
* Filter by object owner to find your own content quickly, or find objects created by experts and power users in your organization.
* Admins can designate metrics, custom events, segments, and cohorts as "official," so users know which objects are safe to use.
## Manage your analysis objects
Access Object Management from the left nav.
From the *Object Management* page, click **+ Create New** and select the type of object you want to create. Follow the prompts in the modal that appears (it's different for each type).
{% callout type="note" heading="" %}
A metric is an event-and-measurement pairing saved as a single block, which you can reuse across charts and experiments. A custom metric is an event object made up of a user-defined combination of events and filters.
{% /callout %}
As you define the object (by adding events for custom events and metrics, or by specifying users to include in your cohorts or segments), Amplitude Analytics shows you a list of similar objects at the bottom of the modal. Check your new object against this list to avoid creating unnecessary duplicate objects.
Designate the object as "official" by clicking the checkmark next to the title. Designating the object validates it for use in charts and analyses, and Amplitude Analytics considers it to be a source of truth.
After you create an analysis object, edit it by clicking its name in the list. The object's drawer opens. Click **Edit**.
To find which charts a metric or custom event appears in, click the *Charts* tab.
To create a new chart from an analysis object, click **Open in Chart** from within the object's drawer. You can change the chart type if needed.
To duplicate, delete, or copy a link to the analysis object, click `...` and select the appropriate choice from the dropdown.
To bulk-delete analysis objects, navigate to the appropriate tab (*Custom Events*, *Metrics*, *Segments*, or *Cohorts*) and click the checkboxes of each object you want to delete. Then click **Delete**.
## Permissions
Amplitude users with the Organization-level role of [Member](https://amplitude.com/docs/admin/account-management/user-roles-permissions#member) or higher can create analysis objects, and update or delete analysis objects they own. Only administrators can delete objects created by anyone. Object management doesn't support permissions at the project level.
================================================================================
# Currency Conversion
URL: https://amplitude.com/docs/data/currency-conversion
================================================================================
# Currency Conversion
Currency conversion lets you analyze multi-currency revenue data in Amplitude. With currency conversion, you can:
- Send Amplitude transaction data with local currency codes.
- Use revenue data for insight generation or decision making without manually pre-converting data into a single currency.
- Run queries based on a series of lookup tables connected to daily exchange rates to convert transaction amounts based on transaction dates and daily exchange rates. You can use the primary currency set at the project level (for example, convert all global currencies to USD).
{% callout type="note" heading="" %}
Amplitude performs currency conversion using the exchange rates from the preceding day for consistency in reporting. Amplitude sources exchange rates daily from [ExchangeRate API](https://www.exchangerate-api.com/).
{% /callout %}
You can control where you view currency-converted data throughout Amplitude. You can configure target currencies at the project level through project settings, which means you can use both converted and non-converted values for `$revenue` and `$price` fields. You can also:
- Send standard `$revenue` and `$price` fields or map your own custom fields (or cart properties) into the conversion logic.
- View original, non-converted values in user timelines. This view aligns with the original data and avoids confusion when comparing information against chart data.
## Enabling conversion
To enable currency conversion, send the `$currency` property as a 3-character [ISO 4217](https://www.iban.com/currency-codes) code such as USD or EUR alongside your revenue-related data.
## OOTB derived properties
Amplitude provides two OOTB derived properties that let you view currency-converted data. These OOTB derived properties are:
- Currency Converted Revenue.
- Currency Converted Price.
These derived properties apply only to events containing both `$currency` and either `$revenue` or `$price` fields.
You can find these properties by going to *Data > Properties > Derived*. They appear as read-only fields, and you can use them for filtering, grouping, and aggregations.
### Currency Converted Revenue
Converts the `$revenue` field into the project's target currency using the `$currency` field as the original currency code for the received `$revenue`.
```typescript
CURRENCY_CONVERT(PROPERTY("$currency", "event"), PROPERTY("$revenue", "event"))
```
### Currency Converted Price
Converts the `$price` field into the project's target currency using the `$currency` field as the original currency code for the received `$price`.
```typescript
CURRENCY_CONVERT(PROPERTY('$currency', 'event'), PROPERTY('$price', 'event'))
```
## Custom derived properties
If you use `$Cart Properties`, or if you don't use `$revenue`, `$price`, or `$currency` fields, you can create custom derived properties to apply currency conversion. Custom derived properties require project-level currency configuration.
For example, add a derived property to currency convert the custom `$revenue` or `$currency` field:
```typescript
CURRENCY_CONVERT(PROPERTY("_currency_", "event"), PROPERTY("_revenue_", "event"))
```
Then add the derived property to currency convert cart properties:
```typescript
CURRENCY_CONVERT(PROPERTY("_currency_", "event"),PROPERTY("products.revenue", "event"))
```
## Project settings
You can configure the target currency for derived property revenue fields in the project settings.
##### To configure currencies
1. Open your project and go to *Organization Setting > Projects > General*.
2. Select the currency you want from the **Which currency should your values be converted to?** dropdown menu.
All options are in standard [ISO 4217](https://www.iban.com/currency-codes) 3-digit format.
## Property selectors
You can select both OOTB and custom derived properties when [building charts](https://amplitude.com/docs/get-started/create-a-chart).
##### To select currency conversion properties in a chart
1. Go to an existing chart or go to *Create > Chart* to create a new one.
2. In the Events modal, select **Any Active Event**, then select **Select property**.
3. In the search field, find **Derived Properties**.
4. Select the properties you want. You can select any of:
- Currency Converted Revenue.
- Currency Converted Price.
- Custom derived properties.
## Currency converted revenue in charts
When viewing the chart, both the original revenue value and the currency-converted value are available.
================================================================================
# Derived properties
URL: https://amplitude.com/docs/data/derived-properties
================================================================================
# Derived properties
Derived properties create new event and user properties retroactively from existing properties, using functions and operators in Amplitude Data. Amplitude computes them dynamically at query time and doesn't change your raw data. Use them to run analyses on values you didn't send in the original event payload.
Use a derived property when you need a value computed from existing properties and don't want to re-instrument or re-ingest data. If you need a value sent at event time from the client, use a regular event property instead. If you need a curated, named event built from multiple raw events, use a custom event instead.
For example, create a derived property whose value is a boolean based on whether a cart item's price exceeds a threshold.
## Create a derived property
You need to be on your project's `main` branch to create a derived property.
To create a derived property, follow these steps:
1. In Amplitude Data, go to *Tracking Plan > Properties* and select the **Derived Properties** tab.
2. Select **Add Derived Property**.
3. Give your derived property a name.
4. Add any relevant metadata to your property, including a description (optional, unless you want to use the Suggest feature) and the visibility of the property in charts within this project.
5. Enter your formula. Review the list of valid functions and operators below.
6. Select **Save**.
## Preview your results
As long as the formula you entered is valid, you can test the results in the space below the formula editor. Test by selecting existing values for properties used in the formula, or by entering free-form values. You can test from either the *Create/Edit* modal or from the side panel for a saved derived property.
## Derived property use cases
Using the referrer URL example, you can write a formula using string operators such as:
`SPLIT(PROPERTY('referrer_url','event'), "/", 2)`
This formula converts a value like "https://www.google.com/search?q=amplitude" into the value "www.google.com." To strip this down further to "google", wrap the result of a SPLIT function inside another SPLIT function. The resulting formula looks like this:
`SPLIT(SPLIT(PROPERTY('referrer_url','event'), "/", 2), ".", 1)`
Amplitude also supports math operators. For example, if you have events that contain subtotal and tip properties and want to run analyses based on the total amount, use this formula:
`SUM(PROPERTY('subtotal','event'), PROPERTY('tip','event'))`
To determine whether a particular order receives a discount when the total order size exceeds $50, use this formula:
`IF(SUM(PROPERTY('subtotal','event'), PROPERTY('tip','event')) >= 50, 'true')`
{% callout type="note" heading="" %}
Queries using derived properties might experience longer query times depending on the complexity of the formulas. A limit of up to 10 property references per derived property also applies.
{% /callout %}
## Functions and operators
### String functions
- **`REGEXEXTRACT (text_property, regular_expression)`**
- **Description**: Extracts substrings matching the regular expression.
- **Example**: `REGEXEXTRACT("shirt-150", "[0-9]+")`
- **Result**: `150`
- **`REGEXREPLACE (text_property, regular_expression, replacement_text)`**
- **Description**: Replaces the property's values with text matching the regular expression with replacement text.
- **Example**: `REGEXREPLACE("en-US", "-.*", "")`
- **Result**: `en`
- **`CONCAT(property1, property2)`**
- **Description**: Concatenates a property with another property or text value.
- **Example**: `CONCAT("firstName", "lastName")`
- **Result**: `firstName lastName`
- **`LOWERCASE (text_property)`**
- **Description**: Lower cases all characters in property's values.
- **Example**: `LOWERCASE("John")`
- **Result**: `john`
- **`UPPERCASE (text_property)`**
- **Description**: Upper cases all characters in property's values.
- **Example**: `UPPERCASE("John")`
- **Result**: `JOHN`
- **`SPLIT (property, separator, [index])`**
- **Description**: Split a property based on a delimiter and return an array of split elements. Takes an optional index that returns the element at that index.
- **Example**:
- `SPLIT("a_b_c", "_")
- SPLIT("john@example.com", "@", 0)`
- **Result**:
- `["a", "b", "c"]
- "john"`
- **`REMOVE (property, text)`**
- **Description**: Remove all occurrence of text in property.
- **Example**: `REMOVE("en-US", "en-")`
- **Result**: `US`
- **`EXTRACT_FROM_DICT (property, text)`**
- **Description**: Extract a value from a dictionary string based on a specific key.
- **Example**: `EXTRACT_FROM_DICT("{'id': 1, 'name': 'John', 'country': 'US'}", "name")`
- **Result**: `John`
### Math functions
| Function | Description | Example | Result |
| ----------------------------------------- | ----------------------------------------------------------------------------------------------------------------------- | ------------------------------------------------------------ | ------ |
| `SUM(num_property1, num_property2)` | Adds a property with other properties or with numbers. Equivalent to the `+` operator. Use `ADD` as an alias. | `SUM(subtotal, tip) >>> SUM(10, 2)` | 12 |
| `MINUS(num_property1, num_property2)` | Subtracts a property with other properties or with numbers. Equivalent to the `-` operator. Use `SUBTRACT` as an alias. | `MINUS(total, tip) >>> MINUS(12, 2)` | 10 |
| `MULTIPLY (num_property1, num_property2)` | Multiplies a property with other properties and/or with numbers. Equivalent to the `*` operator. | `MULTIPLY(price, quantity) >>> MULTIPLY(2.50, 4)` | 10 |
| `DIVIDE(numerator, denominator)` | Divides a property by another property or number. Equivalent to the `/` operator. | `DIVIDE(calorie_intake, calorie_goal) >>> DIVID(1000, 2000)` | 0.5 |
| `POWER(num_property, exponent)` | Takes the property's values to the exponent power. | `POWER(property, 3) >>> POWER(2, 3)` | 8 |
| `MIN(num_property1, num_property_2)` | Returns the minimum value between two numbers. | `MIN(5, 10)` | 5 |
| `MAX(num_property1, num_property_2)` | Returns the maximum value between two numbers. | `MAX(5, 10)` | 10 |
| `CEIL(num_property)` | Rounds up to the nearest integer. | `CEIL(3.8)` | 4.0 |
| `FLOOR(num_property)` | Rounds down to the nearest integer. | `FLOOR(3.8)` | 3.0 |
### Object functions
| Function | Description | Example | Result |
| ------------------------------------ | ----------------------------------------------------------------- | ------------------------------------------------------------------------- | ------ |
| `EXTRACT_FROM_DICT (property, text)` | Extract a value from a dictionary string based on a specific key. | `EXTRACT_FROM_DICT("{'id': 1, 'name': 'John', 'country': 'US'}", "name")` | `John` |
### Date/ time functions
Amplitude requires all Unix timestamps to be in milliseconds.
| Function | Description | Example | Result |
| ----------------------------------------------------------------- | ------------------------------------------------------------------------------------------------------------------------------------------------------------------------------- | ------------------------------------------------------------------------------------------ | ------------------- |
| `DATE_TO_LONG (date_property)` | Convert date into Unix timestamp | `DATE_TO_LONG("2020-12-01")` | 1606780800000 |
| `TIME_TO_LONG (time_property)` | Convert date time (YYYY-MM-dd[T]HH:mm:ss) into Unix timestamp | `TIME_TO_LONG("2020-12-01 12:00:00")` | 1606780800000 |
| `LONG_TO_TIME (number_property)` | Convert Unix timestamp into date-time (local to user's timezone) | `LONG_TO_TIME (1606780800000)` | 2020-12-01 12:00:00 |
| `LONG_TO_DATE (number_property)` | Convert Unix timestamp into date (local to user's timezone) | `LONG_TO_DATE (1606780800000)` | 2020-12-01 |
| `DATE_TIME_FORMATTER (datetime_property, old_format, new_format)` | Convert format of a datetime property to a new format. See [Java SimpleDateFormat](https://docs.oracle.com/javase/7/docs/api/java/text/SimpleDateFormat.html) for more details. | `DATE_TIME_FORMATTER ("05.01.2021 12:00:00:000", "MM.dd.yyyy hh:mm:ss:SSS", "yyyy/MM/dd")` | 2021/05/01 |
| `TODAY()` | Current day represented as a long in epoch time in UTC. | `TODAY() - start_date_in_ms >>> 1609459200000 - 1577836800000` | 31622400000 |
| `EVENT_HOUR_OF_DAY()` | Get hour of day (0-23) from the event's timestamp. | `EVENT_HOUR_OF_DAY()` | 10 |
| `EVENT_DAY_OF_WEEK()` | Get day of week from the event's timestamp as string. For example, Monday. | `EVENT_DAY_OF_WEEK()` | Monday |
### Array functions
When performing computations on derived properties created from array properties, Amplitude assumes that only the first child is an array property. Amplitude only considers the first value of the other children, even when those other children are also array properties. Here are some illustrative examples:
```
Example 1
propA = [1,2,3], propB = [a,b,c]
CONCAT(propA, propB) = [1a, 2a, 3a]
Example 2
propA = [1, 2, 3], propB = [a]
CONCAT(propA, propB) = [1a, 2a, 3a]
Example 3
propA = [1], propB = [a, b, c]
CONCAT(propA, propB) = [1a]
```
| Function | Description | Example | Result |
| ----------------------- | ------------------------------------------------------------------- | ---------------------- | ------------ |
| `ITEM_COUNT (property)` | Length of array property; defaults to 1 for non-arrayed properties. | `ITEM_COUNT(products)` | 3 |
| `GREATEST(property)` | Get max value of the array. | `GREATEST(prices)` | 10 |
| `LEAST(property)` | Get min value of the array. | `LEAST(prices)` | 2 |
| `COALESCE(property)` | Get the first non-null value of the array | `COALESCE(locations)` | 'California' |
### Property functions
When you select a property from the *Insert Property* dropdown, Amplitude inserts a property function referencing that property directly into the editor. You can also manually insert this function wherever you want to reference a different Amplitude property.
These functions are available inside other functions.
| Function | Description | Example | Result |
| ---------------------------------------------- | -------------------------------------------------------------------------------------------------------------- | -------------------------------------- | --------------------------------------------------------------------------------------------------------------------------------------------------------------------- |
| `PROPERTY(property_name, property_type)` | Reference to property within Amplitude. Possible property types: "user", "event", "derived", "lookup", "group" | `PROPERTY("first name","user")` | A reference to the user property "first name" in your project. This is how derived properties communicate with Amplitude’s query service. |
| `PROPERTY(property_name, "group", group_type)` | Reference to group property within Amplitude. Group type is required for group properties. | `PROPERTY("name","group", "business")` | A reference to the group property "name" in the group type "business" within your project. This is how derived properties communicate with Amplitude’s query service. |
#### Reference Event Time
To use an event's timestamp in a derived property formula, select **Event Time** from the *Insert Property* dropdown in the derived property builder.
Inside a derived property formula, **Event Time** is a long value in epoch milliseconds. To display it as a readable date, wrap it in `LONG_TO_TIME` or `LONG_TO_DATE`. Don't wrap **Event Time** in `TIME_TO_LONG` or `DATE_TO_LONG`, because the value is already a long and the conversion returns `none`. To compare **Event Time** against a date or datetime property, convert the other property to a long with `TIME_TO_LONG` or `DATE_TO_LONG` instead.
### Conditional operators
| Operator | Description | Example |
| ----------------------------------------------------------------------- | ------------------------------------------------------------------------------------------------------------------------------------------ | --------------------------------------------------------------------- |
| `IF(logical_expression, value_if_true, value_if_false)` | Returns `value_if_true` if `logical_expression` is true, otherwise returns `value_if_false`. | `IF(property == "(none)", "Property wasn't set", "Property was set")` |
| `AND(logical_expression_1, logical_expression_2)` | Returns True if both logical expressions are true, false otherwise. | `AND(is_subscribed == "true", has_valid_promo == "true")` |
| `OR(logical_expression_1, logical_expression_2)` | Returns True if any logical expression is true, false otherwise. | `OR(has_email == "true", has_phone == "true")` |
| `SWITCH(expression, case_1, value_1, [case_2, value_2 ...], [default])` | Evaluates an expression and returns values based on defined cases. Returns a default value if no cases are met if defined, otherwise null. | `SWITCH(tier, "gold", 2, "silver", 2, "bronze", 1, 0)` |
### String/numerical operators
| Operator | Example |
| --------------------- | ----------------------------------------- |
| `==` | `action == "purchase" ` |
| `!=` | `item_count != 0 ` |
| `contains` | `email contains "@gmail.com"` |
| `does not contain` | `title does not contain "officer" ` |
| `<`, `<=`, `>`, `>=` | `duration >= 60` |
| `glob match` | `url glob match "https://www.google.*/*"` |
| `glob does not match` | `query glob does not match "*/query=*"` |
| `has prefix` | `title has prefix "sir" ` |
| `does not have prefix` | `title does not have prefix "sir"` |
### Set operators
Set literals ("apple", "orange") must appear on the right hand side of the operator.
- **`==`**
- **Example**:
- `IF(product == ("apple","orange"), "true", "false")`
- *product = "apple", Returns "true"*
- **`!=`**
- **Example**:
- `IF(product != ("apple","orange"), "true", "false")`
- *product = "banana", Returns "true"*
### Parallel operators
Perform operations on arrays of data to help perform cart analysis.
| Operator | Description |
| ------------------ | ------------------------------------------------------------------------------------------------------------------------------------------------------------------------------------------------------------------------- |
| `PARALLEL_SUM` | Adds corresponding values from two arrays at each position. |
| `PARALLEL_PRODUCT` | Multiplies corresponding values from two arrays at each position. Use this operator to calculate revenue for each item in a cart. For example, `PARALLEL_PRODUCT(PROPERTY('Products.price', 'event'), PROPERTY('Products.quantity','event'))` |
| `PARALLEL_MAX` | Returns the larger of the corresponding values from two arrays at each position. |
| `PARALLEL_MIN` | Returns the smaller of the corresponding values from two arrays at each position. |
| `SUM_ARRAY` | Sums all numeric elements in a single array property. Use this operator to calculate total cart value for filtering or grouping. For example, `SUM_ARRAY([1, 2, 4])` returns `7`. |
Parallel operators require at least one property to be a child cart property, and both properties must be under the same parent property.
For example, `products.price` and `products.quantity` are compatible. `products.price` and `shoppinglist.quantity` aren't compatible because they have different parent properties.
When you use a parallel operator with two arrays, it adds, multiplies, or compares corresponding values at each position. For example, `PARALLEL_SUM([1, 3, 5], [2, 4, 6])` returns `[3, 7, 11]`.
When one input is an array and the other is a scalar (single number), the scalar broadcasts to match the array's length. For example, `PARALLEL_SUM([1, 3, 5], 1)` returns `[2, 4, 6]`, and `PARALLEL_PRODUCT(2, [4, 5, 6])` returns `[8, 10, 12]`.
The derived property that a parallel operator creates becomes a child property of the parent cart property used in the formula. For example, creating a `revenue` derived property with `PARALLEL_PRODUCT(PROPERTY('products.price', 'event'), PROPERTY('products.quantity', 'event'))` makes `revenue` a child property of `products`.
{% callout type="note" heading="" %}
To use a derived property created with a parallel operator in a chart, first select the parent cart property (marked with `{:}`). The derived property then appears in the child property selection list.
{% /callout %}
#### Parallel operator example
You have a purchase event with the following cart property:
```json
"Products": [{
"brand": "Apple","categories": "Digital Content","department": "Electronics",
"price": 24.99,"quantity": 1
}, {
"brand": "Adidas","categories": "Newsletter","department": "Electronics",
"price": 24.99,"quantity": 1
}, {
"brand": "Fossil","categories": "Digital Content","department": "Women's Clothing",
"price": 24.99,"quantity": 2
}]
```
| Brand | Price | Quantity |
| ------ | ----- | -------- |
| Apple | 24.99 | 1 |
| Adidas | 24.99 | 1 |
| Fossil | 24.99 | 2 |
Use `PARALLEL_PRODUCT` to create a `Revenue` derived property:
```
PARALLEL_PRODUCT(
PROPERTY('Products.price', 'event'),
PROPERTY('Products.quantity','event')
)
```
If you add this property to a chart, group by `Brand` to view revenue by brand.
You can also use `SUM_ARRAY` on the `Revenue` derived property to calculate total cart value:
```
SUM_ARRAY(PROPERTY('Revenue', 'derived'))
```
This returns the sum of all revenue values across items in the cart, which is useful for filtering or grouping by total cart value.
## Common derived properties formulas
This section describes several common use cases for derived properties formulas.
### Calculate the age of a customer
```
CEIL(
DIVIDE(
MINUS(
PROPERTY('server_upload_time', 'amplitude_user'),
TIME_TO_LONG(PROPERTY('Created At', 'user'))
),
86400000
)
)
```
Use this formula when tracking a user property with a date-time data type, and you want to calculate the age of that user (how long that user has existed in your system) since the time of the event that triggered when this user property was set.
### Calculate days since registration
Use **Event Time** with a date or datetime property to calculate how many days passed between an event and a fixed date, such as a user's registration date. In the derived property builder, select **Event Time** from the *Insert Property* dropdown, then build a formula like this:
```
DIVIDE(
MINUS(
PROPERTY('Event Time', 'event'),
TIME_TO_LONG(PROPERTY('registration_date', 'user'))
),
86400000
)
```
This example assumes `registration_date` is a datetime string (for example, `"2023-08-18 17:37:39"`). Inside a formula, **Event Time** acts as a long in epoch milliseconds. The formula converts the registration date to a long with `TIME_TO_LONG`, subtracts it from **Event Time**, and divides by 86400000, the number of milliseconds in one day.
### Get the difference between two dates
```
DIVIDE(
MINUS(
DATE_TO_LONG(
PROPERTY(
'start_date', 'user'
)
),
DATE_TO_LONG(
PROPERTY(
'end_date', 'user'
)
)
),
86400000
)
```
Sample output.
In the derived property above, Amplitude converts the properties `end_date` and `start_date` into UNIX timestamps to calculate the difference between them. Amplitude then divides that result by 86400000, the number of milliseconds in one day.
{% callout type="note" heading="" %}
This output is a double type (for example. 2.0).
{% /callout %}
### Output a standardized date format
```
IF(
DATE_TIME_FORMATTER(
PROPERTY(
'publishDate',
'event'
),
"yyyy-MM-dd'T'HH:mm:ssX",
'yyyy-MM-dd'
)
contains '-',
DATE_TIME_FORMATTER(
PROPERTY(
'publishDate',
'event'
),
"yyyy-MM-dd'T'HH:mm:ssX",
'yyyy-MM-dd'
),
IF(
DATE_TIME_FORMATTER(
PROPERTY(
'publishDate',
'event'
),
"yyyy-MM-dd HH:mm:ss",
'yyyy-MM-dd'
)
contains '-',
DATE_TIME_FORMATTER(
PROPERTY(
'publishDate',
'event'
),
"yyyy-MM-dd HH:mm:ss",
'yyyy-MM-dd'
),
DATE_TIME_FORMATTER(
PROPERTY(
'publishDate',
'event'
),
"yyyy-MM-dd",
'yyyy-MM-dd'
)
)
)
```
Sample output.
One way to format dates to Standard Date Format is to use a series of IF statements. Make sure the higher specificity conditional comes first. Replace the `$<number>` here with the actual properties.
### Get the month and year a customer signed up
```
CONCAT(
REGEXEXTRACT(
PROPERTY(
'start_date',
'user'
),
'dddd-dd'
), "-01"
)
```
In this example, the derived property pulls the sign-up month and year from a property that contains a more detailed value, then appends "-01" to set it to the beginning of the month. Use `REGEXEXTRACT()` to pull the year and month from the value, and use `CONCAT()` to append "-01". Replace the `$<number>` here with the actual properties.
### Replace existing property values
```
IF(
OR(
REGEXEXTRACT(
PROPERTY(
"package",
"event"
),
'Casual'
) =='Casual',
REGEXEXTRACT(
PROPERTY(
"package",
"event"
),
'1 Job Posting'
)=='1 Job Posting',
REGEXEXTRACT(
PROPERTY(
"package",
"event"
),
'1 Basic'
)=='1 Basic'
),
'Casual',
'False'
)
```
Sample output.
To replace multiple property values, use `REGEXEXTRACT()` to pull the string from the property, and use OR statements inside an IF statement to check whether the value pulled from the properties contains any of the values you want to replace. In this example, if the property value matches any of the specified values, the formula replaces the value with `Casual`. Otherwise, the formula replaces the property with `False`. Replace the `$<number>` here with the actual properties.
### Count length of an array that was accidentally ingested as a string
Convert the string to an array format by using SPLIT:
```
SPLIT(
PROPERTY('color', 'event'),
','
)
```
Sample output:

The property color was ingested as a string into Amplitude "Red, Green, Blue". After using SPLIT, the resulting value is `[Red, Green, Blue]`.
Use the above derived property within a new derived property that uses `ITEM_COUNT`.
```
ITEM_COUNT(
PROPERTY("Transform into Array", "derived")
)
```
Sample output:

Now the underlying data is an array. `ITEM_COUNT` counts the number of items that make up the array.
================================================================================
# Lookup Tables
URL: https://amplitude.com/docs/data/lookup-tables
================================================================================
# Lookup Tables
With Amplitude's Lookup Table feature, you can import your own data and map it to ingested properties to create an enhanced set of event and user properties.
## Lookup table benefits
- **Enrich data using ingested property values**: Say you've captured an event called `Purchased` with an event property named `SKU`. The `SKU` value itself doesn't inherently hold a lot of meaning. With your list of all the SKUs and their corresponding product names, you can use this feature to create a new property called `Product Name` that populates automatically based on that list.
- **Bulk change or fix property values**: Imagine you've captured a user property called `Language Code` and passed in language codes (`en_US`, `fr_FR`, `de_DE`, and so forth). These codes are difficult to read, so you want a `Language` property that maps to friendlier values like `English`, `French`, and `German`. Use this feature to create a new property called `Language` that maps the language codes to the language names.
- **Bulk filter long lists**: To analyze user behavior for a specific region when you have a list of all customers and their regions, use this feature to map each customer to a region, creating a new `Region` property. You can then filter to each region in a chart.
{% callout type="note" heading="" %}
Lookup Tables can't exceed 100MB or 1 million rows. Contact your Amplitude CSM if you have data that exceeds this limit.
{% /callout %}
## Find lookup properties in charts
After you create a lookup property, it appears in chart dropdowns alongside the source property you mapped it from.
{% callout type="note" heading="Lookup properties based on child (cart) properties" %}
If you create a lookup property that maps from a child (cart) property (a property nested inside an object array), the lookup property doesn't appear in the main property list in charts. Instead, it appears under its parent cart property. To find it, first select the parent cart property (marked with `{:}`) in the property dropdown, then look for the lookup property as a nested option in the second-level dropdown. For more on cart properties, refer to [Cart analysis](https://amplitude.com/docs/analytics/charts/cart-analysis).
{% /callout %}
## Create a Lookup Table
Before you can start using Lookup Tables, you need:
- An event property or user property to create a mapping from.
- A .CSV that has the data you want to map to. The first column data must correspond to the mapping property value and must contain unique values.
{% callout type="note" heading="" %}
Lookup Tables look for exact matches, and are case-sensitive.
{% /callout %}
To create a new Lookup Table in Amplitude Data, follow these steps:
1. Navigate to _Sources_ in the project you want to import the .CSV data to.
2. Click **+ Add Source**. Search for _CSV_, then click it.
3. Navigate to your .CSV file and upload it. Then click **Next**.
4. Map your event property by selecting it from the dropdown. When you're done, click **Finish**.
{% callout type="note" heading="" %}
You must be an Admin or Manager of the project to add or manage a source.
{% /callout %}
## Update a Lookup Table
To create a new lookup property or fix an incorrectly mapped property, update the lookup table by following these steps:
1. In Amplitude, navigate to _Sources_, find the Lookup Table in the _Sources List_. Click it to open its _General_ tab.
2. Open the _Edit Lookup Table Configuration_ tab.
3. Make your changes. You can change the mapping, or replace the .CSV by uploading a new file.
4. When you're finished, click **Update your lookup table configuration**.
## Delete a Lookup Table and its properties
To delete a Lookup Table you no longer need, follow these steps:
1. In Amplitude, navigate to _Sources_, then find the Lookup Table in the _Sources List_.
2. Open the _Edit Lookup Table Configuration_ tab.
3. Click the trash can and follow the on-screen instructions.
================================================================================
# Channels
URL: https://amplitude.com/docs/data/channels
================================================================================
# Channels
Amplitude channels classify acquisition traffic into named groups (Paid Search, Organic Social, Direct, and so on) by applying rules to [UTM parameters](https://amplitude.com/docs/get-started/analyze-acquisition-channels), referrer data, or any other event or user property. Channels store the result as a new property computed dynamically at query time, so they don't touch your raw data and you can change a definition without re-ingesting events. Update a rule (for example, add a new social domain) and every existing chart that groups by that channel reflects the change on the next refresh.
Use a channel classifier when you want to bucket traffic into reusable acquisition groups across every chart and Marketing Hub view. If you only need a one-off derived field for a single chart, use a [derived property](https://amplitude.com/docs/data/derived-properties) on that chart instead.
## Amplitude Default Channels
Every new Amplitude org and project gets a pre-built classifier called *[Amplitude] Default Channels* automatically. You don't need to configure anything to get started.
Amplitude creates the classifier when you first open *Data > Properties > Channels*. It maps UTM parameters and referrer data into 29 GA4-aligned marketing channels, including:
- **Paid Search** and **Organic Search**.
- **Paid Social** and **Organic Social**.
- **Paid Video** and **Organic Video**.
- **Partner** and **External Referral**.
- **LLM Search** and **Paid LLM Search** (AI-assisted referrals from tools like ChatGPT and Perplexity).
- **Email**, **Display**, **Affiliates**, and **Referral**.
- **Audio**, **SMS**, and **Mobile Push**.
- **Direct**.
- **Other** (traffic that doesn't match any rule).
The classifier gives Marketing Hub and the Global Agent useful channel breakdowns from day one, without requiring you to build a classifier from scratch.
The classifier is fully editable and deletable. You can rename it, modify rules, change conditions, or remove it entirely.
{% callout type="note" heading="Best results with the browser SDK" %}
The *[Amplitude] Default Channels* classifier works best with the Amplitude Browser SDK when you carefully manage `set()` and `unset()` calls on UTM properties. Inconsistent property handling can classify traffic as "Other" even when UTM values are present.
{% /callout %}
### Upgrade to GA4-aligned defaults in an existing org
If you created your org before Amplitude introduced the GA4-aligned [Amplitude] Default Channels, you receive an upgrade prompt when you open *Data > Properties > Channels*. Click **Build with the new logic** to open the classifier builder pre-filled with the updated GA4-aligned rule set. Review the rules, rename the classifier if you like, then click **Save** to add it alongside your existing classifiers.
Amplitude never overwrites your existing classifiers. Your current channel definitions remain unchanged until you modify or delete them yourself.
You can also add the default classifier at any time without the upgrade prompt:
1. Navigate to *Data > Properties > Channels*.
2. Click **+ Add Channel Classifier**.
3. The *[Amplitude] Default Channels* template opens automatically. Rename it if you like.
4. Customize the rules or click **Save** to add it as-is.
Amplitude adds the new classifier without changing any of your existing ones.
## Create a channel
You must be an Admin or Manager to create a channel.
To create a channel, follow these steps:
1. Navigate to the *Properties* section of Amplitude Data and open the *Channels* tab.
2. Click **+ Add Channel Classifier**. A pre-built, default channel definition screen opens. Optionally, click the default channel title (*Channel*) to edit the name. You can also add a description below it.
3. To begin creating the channel definition, start from the default template or click **Clear Table** to clear the table's contents. The default template uses the same GA4-aligned rule set as *[Amplitude] Default Channels*, covering 27 channels including LLM Search, Paid LLM Search, Audio, SMS, and Mobile Push.
You can add multiple properties to a row to create a more complex classifier.
{% callout type="tip" %}
Amplitude recommends using user properties rather than event properties for channels, because Amplitude applies user properties to future events that a user triggers. For more information, go to [About user properties and event properties](https://amplitude.com/docs/data/user-properties-and-events#how-amplitude-updates-user-properties).
{% /callout %}
4. Add one row for each channel you'd like to define. For example, you can add rows labeled `Paid`, `Organic`, `Referral`, and `Direct` to create a high-level channel definition.
5. Fill in the values for each row. Each cell must evaluate to `True` for an event to classify to that channel.
If you can define a channel as `row A OR row B`, add one row for A and one for B, then set the channel name to the same value for both rows.
6. Click **Save**.
Amplitude labels channels in property dropdowns under the *Channels* category.
{% callout type="note" heading="Channel classifier limits" %}
Channel classifiers have two limits:
- **Maximum rows**: 149 rows for each classifier.
- **Maximum cells**: 1,000 total cells (rows × columns).
Amplitude restricts adding rows when either limit is reached. The effective maximum number of rows depends on the number of columns in your classifier. For example, with 10 columns, you can create approximately 100 rows before reaching the 1,000-cell limit.
{% /callout %}
## Compare metrics between channels with Data Tables
Amplitude's [Data Tables](https://amplitude.com/docs/analytics/charts/data-tables/data-tables-multi-dimensional-analysis) let you define metrics critical to your bottom line, such as CPA, AOV, and ROAS. Evaluate how these metrics perform between different channels by grouping by your channel on the left-hand column. Add other core dimensions like campaigns to break down these channels further.
Amplitude attributes metrics in different ways if a user has multiple touch points with different channels before converting. Amplitude has built [attribution modeling](https://amplitude.com/docs/analytics/charts/data-tables/data-tables-attribute-credit) into data tables to enable defining user attribution in your channels.
{% callout type="tip" %}
Applying a channel classifier before an attribution model can attribute values in potentially unexpected ways. For example, in a sequence consisting of:
`CPC --> email --> website`
Applying a channel classifier of `CPC only` filters out `email` and `website`. In this case, the attribution model attributes to CPC.
{% /callout %}
## Use cases
- **Blended views**: Create top-level blended views of all paid and all organic traffic to review how efficiency and performance have changed over time.
- **High-level channels**: Break down your core metrics using the channel definitions you already use in [Google Analytics](https://support.google.com/analytics/answer/6010097?hl=en#zippy=%2Cin-this-article) and [Adobe](https://experienceleague.adobe.com/docs/analytics/components/marketing-channels/c-getting-started-mchannel.html?lang=en).
- **Channels with campaigns**: Add a property denoting a campaign as a column in your channel definitions to break down metrics by campaign channel.
- **Attribution**: Use channels with attribution models in data tables to evaluate the breakdown of a metric by first touch, last touch, or a custom attribution definition.
## Special values
Amplitude evaluates these special values on events:
| **Value** | **Description** |
| --------- | --------------- |
| ANY | Captures explicitly set `none` values, or any other value set on the property. |
| (none) | Captures both explicitly and implicitly set `none` values. |
| blank | Captures both explicitly and implicitly set `none` values, or any other value set on the property. |
{% callout type="note" heading="Explicit and implicit none values" %}
`None` values set both explicitly and implicitly appear as `none` in any Analytics chart.
Explicitly set `none` values appear when Amplitude receives the property with a value of `null`.
Implicitly set `none` values appear when Amplitude receives a property with no value.
{% /callout %}
## Common questions
Amplitude's channel classifier lets you define acquisition channels to efficiently track your traffic sources. This section covers frequent questions about the channel classifier.
### Who can create and modify channel definitions?
The channels classifier is only available to Growth and Enterprise users. You must be an org admin or manager to create a channel and modify channel definitions.
### Are users notified if channel classifiers change?
Amplitude doesn't notify users and other admins when channel classifiers change. Any reports sourced from the channel classifier automatically update to reference the most recent definition the next time someone loads or refreshes a report.
### Where can users use these acquisition channels after defining them?
Channels are stored as properties, which you can query through any analytics chart type (including Data Tables). Find your channels by navigating to *Properties* in Amplitude Data.
### What kind of properties can you use when configuring a channel?
You can use, mix, and match any (event, user, group) property in the definition. The channel classifier inherits the combination of the property types.
### Are properties defined retroactively when a channel is created?
Yes. All existing charts update retroactively to reflect the new definition the next time someone refreshes the report.
### How can I upload a channel definition?
You can't upload a channel classifier definition. To create a channel classifier, manually create a column for every individual property you want to include in the definition.
### Why can't I see my channels in a Data Table?
If you use the pre-defined sample Channel Classifier, make sure you track the *utm\_medium* and *referring\_domain* properties to generate results in your Data Table. If you don't track these, either remove the column containing them from the Channel Classifier, or instrument them as properties to start tracking them.
### Is the referring domain captured by Amplitude, or do I have to pass this value?
You must send Referring Domain, as well as any other properties you track for attribution purposes (like UTM parameters, for example), to Amplitude.
### Should I set channel classifiers to include *initial_utm* and *utm_ properties* so that initial and most recent campaign traffic gets bucketed correctly?
Unless you want to create a specific "Initial Channel", don't use or mix any of the *initial\_{} properties*. Focus on the standard/non-initial ones.
### Can I input a regex formula when creating a channel classifier?
You can enter the regex as free-form text when creating a channel classifier.
### Why am I seeing '(none)' values when grouping by my channel in a Data Table?
You see '(none)' values because you're querying on an event that occurred before Amplitude received that user property. When using Amplitude, you query on the value of a user or event property at the time of the event. The '(none)' value showing for the property in the Data Table when grouping by your channel means there's no value for that property.
### Why can't I add more rows to my channel classifier?
Channel classifiers have two limits that restrict adding rows:
- **Maximum rows**: 149 rows for each classifier.
- **Maximum cells**: 1,000 total cells (rows × columns).
Amplitude restricts adding rows when either limit is reached. The UI tooltip shows the 149-row limit, but the 1,000-cell limit may prevent you from reaching that number. For example, with 10 columns, you can create approximately 100 rows before reaching the cell limit.
To add more rows, reduce the number of columns in your classifier, or simplify your channel definitions to use fewer cells.
================================================================================
# Persisted Properties
URL: https://amplitude.com/docs/data/persisted-properties
================================================================================
# Persisted Properties
Property persistence keeps an event property's value, such as page path or search term, attached to a user's later events for a set period. That way, context like which campaign, channel, or merchandising asset drove engagement stays available across the entire user journey and gives teams consistent, reliable reporting across Amplitude. Go to the [Verify persisted properties](https://amplitude.com/docs/data/persisted-properties/verify-persisted-properties) page to confirm that your persisted properties are working correctly.
For example:
- Marketing teams can persist page path values across multiple sessions to understand campaign effectiveness over time.
- Merchandising teams can use [item-level attribution](#advanced-item-level-attribution) to attribute revenue to the search term, recommendation, or promo that drove each item in a cart.
## Persisted properties operate on event properties
Persisted properties only persist event properties. They don't read user properties, and they don't update the user profile. Amplitude evaluates them at query time and applies allocation and expiration rules to event-level data for analysis.
That distinction matters when you instrument tracking. If the data you want to persist arrives only as a user property, for example, marketing attribution that some integrations only set at the user level, Amplitude can't use it as an input to a persisted property. To make a value available, capture it as an event property on the events you care about. As of Browser SDK version 2.45.0, the Amplitude Browser SDK does this automatically for marketing attribution by default. Refer to [Capture event properties from the SDK](#capture-event-properties-from-the-sdk).
## What persisted properties are and aren't
Persisted properties aren't user properties and don't represent long-lived user state. Amplitude evaluates them at query time and applies allocation and expiration rules to event-level data for analysis. Persisted properties don't update the user profile, don't mutate user state, and don't replace core event or user properties. Their purpose is to control how Amplitude applies context such as marketing or merchandising data during analysis.
### What property persistence does
Property persistence defines which property values "stick" beyond the event where they were first experienced and how long they remain valid.
Instead of requiring every event to include its own source or merchandising data, Amplitude can remember the property value and apply it automatically to later events until it expires or Amplitude replaces it.
Property persistence is especially useful in marketing and merchandising analysis, where you want to connect early engagement with later outcomes.
## User properties compared to persisted properties
| User properties | Persisted properties |
|-----------------|----------------------|
| Amplitude stores them on the user profile. | Amplitude doesn't store them on the user profile. |
| Amplitude sets them at ingest time. | Amplitude evaluates them at query time (for example, when you use a chart). |
| Represent user level state. | Apply allocation and expiration rules to event properties. |
| Examples include device type, location, or User ID. | For session or time-bounded analysis context. |
## Key concepts
### Allocation types
Allocation decides which property value should "stick" across a series of events for the same user. Amplitude provides the following allocation types:
- **Original:** The property value Amplitude captures when it first creates the entity. Typically, the original value occurs at the point of account creation or initial identification. The original value persists and never changes.
- **Most recent:** Always the latest value of a property within a defined or active tracking window. Typically, the most recent value is the most recent event or session. Most recent data values are dynamic and shift as Amplitude collects new data.
- **First known:** The earliest value recorded for that property, regardless of the entity's creation date. If data collection starts after the creation date, the first known value can come from a later point in time than the Original value. Applies to all events before and after.
- **Last known:** The most recent value of a property at any given point in time. Last known values are dynamic and shift as Amplitude collects new data. However, if Amplitude can't collect data, the Last known value may differ from the true state of the property. Applies to all events before and after.
{% callout type="note" heading="Differences between allocation types" %}
The Original value is the true first value and occurs as soon as Amplitude creates the entity. The First Known value is the earliest recorded value. These values can be the same if tracking begins at entity creation. However, if tracking begins later, these values may differ.
The Most recent value is the most recent value and occurs every time Amplitude collects new data about the property. The Most recent value always reflects the most recent state of the property. The Last known value is the last recorded value of the property. If tracking doesn't occur or Amplitude stops collecting data, the Last known value may not be the current state of the property. If tracking and data collection are current, the Most recent and Last known values are identical.
{% /callout %}
The table below displays an example of a user's activity, from sign-up through page views to purchase. The first column shows the events and property values as they exist in the dataset. The remaining four columns show different allocation methods and how property values change under each method.
| Event | Dataset Value | Original | Most Recent | First Known | Last Known |
|---|---|---|---|---|---|
| Sign up | page path: not captured | - | - | /gift_guide ◌ | /best_seller ◌ |
| Page View | page path: /gift_guide | /gift_guide ● | /gift_guide ● | /gift_guide ● | /best_seller ◌ |
| Page View | page path: /flash_sale | /gift_guide ◌ | /flash_sale ● | /gift_guide ◌ | /best_seller ◌ |
| Purchase | page path: not captured | /gift_guide ◌ | /flash_sale ◌ | /gift_guide ◌ | /best_seller ◌ |
| Page View | page path: /best_seller | /gift_guide ◌ | /best_seller ● | /gift_guide ◌ | /best_seller ● |
● = Property value present on the event ◌ = Property value filled by allocation
### Expiration
Expiration defines when a persisted property value stops applying.
| Expiration type | What it means | Example use case |
|-----------------|---------------|------------------|
| Session | Value resets when the session ends. | Attribute product engagement per browsing session. |
| Custom time | Value expires after a chosen duration. | Maintain campaign context for 7 days or a maximum 30 days. |
## Common use cases
Persisted properties make sense any time you want analysis to reflect context from earlier (or later) events than the one being measured. The patterns below come up repeatedly across marketing, merchandising, experimentation, and media analytics.
- **Entry-page attribution.** Group conversions by where the session originally started, even when the conversion event doesn't carry Page Path. Config: `Page Path` + Original + Session.
- **Campaign attribution across sessions.** Connect early marketing touchpoints to later conversions without forcing every event to carry UTMs. Pairs well with [Browser SDK event-property attribution tracking](#marketing-attribution-browser-sdk-2) (on by default as of version 2.45.0). Config: `utm_campaign` (or similar) + Original + Custom time, for example 30 days.
- **Item-level discovery attribution.** Each item in a cart keeps its own discovery source — search, recommendation, or homepage hero — so revenue attributes to the right surface per product. Refer to [Advanced: Item-level attribution](#advanced-item-level-attribution). Config: `discovery_method` + Most recent + Session + item-level binding.
- **A/B test exposure persistence.** Carry the variant a user saw forward to all downstream events, even when the experimentation platform only stamps the variant on the exposure event itself. Config: `experiment_variant` + Original or Most recent + Session or User.
- **Channel attribution that ignores internal navigation.** Persist the channel that brought a user in without letting internal page-to-page clicks overwrite it. Refer to [Filter internal referrers from attribution](#filter-internal-referrers-from-attribution). Config: channel property + Most recent + Session + Excluded values.
- **Retroactive attribution when properties arrive late.** **First known** and **Last known** apply values to events that already happened, not just events going forward. Useful when the trigger event and its attribution data don't arrive together:
- Mobile install attribution. `New User` and install events often land in Amplitude before the MMP (AppsFlyer, Adjust) sends the attribution event. A persisted property with Last known allocation attaches the source back to the install, so you can measure which campaign drove each install.
- Streaming and media metadata. Real-time play events fire during a session, but properties like `program`, `genre`, or `content_id` are often only sent at session close. A persisted property with Last known allocation applies that metadata backwards to every play event in the session.
Config: attribution or metadata property + Last known (or First known) + Session or a longer window.
## Capture event properties from the SDK
Persisted properties read from event properties, so the upstream question is making sure the values you want to persist arrive as event properties in the first place.
### Marketing attribution (Browser SDK 2)
As of Browser SDK version 2.45.0 and GTM template version 5d7e5, attribution tracking via event properties is on by default. UTM parameters, referrer, referring domain, and click identifiers (for example `gclid`, `fbclid`) automatically attach to every event as event properties. Attribution event properties arrive immediately on Browser SDK 2.45.0+ and GTM template 5d7e5+.
For details about what event property tracking captures and how to configure it, refer to [Event property tracking](https://amplitude.com/docs/sdks/analytics/browser/browser-sdk-2#event-property-tracking) in the Browser SDK 2 documentation.
{% callout type="note" heading="SDK versions below 2.45.0 or GTM template versions below 5d7e5" %}
On older SDK or GTM template versions, event property tracking is opt-in. Enable it by setting `trackingMethod`.
**SDK (direct installation)**
```js
import * as amplitude from '@amplitude/analytics-browser';
amplitude.init('AMPLITUDE_API_KEY', {
autocapture: {
attribution: {
trackingMethod: ['userProperty', 'eventProperty'],
},
},
});
```
**Google Tag Manager**
Set the tracking method through a configuration variable:
1. Update your **Amplitude Analytics Browser SDK** tag to the latest version when GTM shows the update. Event-property attribution requires Browser SDK 2.40.0 or later.
2. Go to *Variables > User-Defined Variables > New*, search the Community Template Gallery for **Amplitude Browser SDK Configuration Variable**, and install it.
3. Create a variable from that template and set **Tracking method** to `eventProperty`. To keep user-property attribution as well, set both `userProperty` and `eventProperty`. Amplitude recommends this while migrating.
4. In the Amplitude `init` tag, set **New configuration options** to your variable (`{{Your Variable}}`).
5. Publish the container.
**New configuration options** replaces the entire `autocapture` object (shallow merge), so list the autocapture features you use, not just `trackingMethod`. Otherwise the tag drops those features. For more information, refer to [New configuration options](https://amplitude.com/docs/data/source-catalog/google-tag-manager#new-configuration-options).
For example, mirroring a typical setup:
```js
{
autocapture: {
pageViews: true,
sessions: true,
formInteractions: true,
attribution: {
trackingMethod: ["userProperty", "eventProperty"]
}
}
}
```
{% /callout %}
### Auto-captured page and interaction properties
When you enable [Autocapture](https://amplitude.com/docs/get-started/autocapture), Amplitude automatically captures event properties such as Page Path, Page URL, Page Title, Element Text, and File Name on the relevant events. Any of these can become an input to a persisted property — for example, persisting Page Path with `Original` allocation captures the entry page that started the session.
### Custom event properties
You can persist any event property your team sends, including custom properties such as `discovery_method`, `experiment_variant`, or `internal_search_term`. As long as the value travels on at least one event for the user, persisted properties can carry it forward.
## Set up persisted properties
The following section contains examples for using the *Persistence and Advanced settings*. Review each one as they apply to different ways you can implement persisted properties.
1. Navigate to the *Properties* section of Data Settings and then click to create a new persisted property. Give this persisted property a name, such as `Entry Page`. In the description, provide additional information such as the allocation method and expiration. The description helps make sure that anyone using this property in a chart or data table understands the configuration.
2. Select the event property you want to persist. For this example, use `Page Path`.
3. Choose an **Allocation** method. In the example, because you want to identify the `Entry Page`, select **Original**. Selecting **Original** makes sure you include the first touchpoint.
4. Set the **Expiration**. By default, the persisted property expires at the end of the session.
5. (*Optional*) Configure **Excluded values**. Add any property values you want the persisted property to ignore — for example, internal traffic markers, test values, or specific channels you don't want to overwrite the persisted source. Amplitude doesn't treat excluded values as new property values during allocation, so a previously valid value continues to persist through them. For a common use case, refer to [Filter internal referrers from attribution](#filter-internal-referrers-from-attribution).
If your analysis involves merchandising (item-level attribution), refer to the [Advanced: Item-level attribution](#advanced-item-level-attribution) section. Otherwise, go to [Use persisted properties across analyses](#use-persisted-properties-across-analyses).
## Filter internal referrers from attribution
When a user navigates within your own site, the referrer is your own domain. If you classify referrers into channels and persist that channel with **Most recent** allocation, every internal page-to-page click can overwrite the original marketing source — attribution flips to "internal" or "direct" the moment the user moves to a second page.
Use **Excluded values** on the persisted property to skip internal navigation during allocation. The previously valid value — the campaign or external referrer that originally brought the user in — continues to apply through any internal events.
### set up a filter for internal referrers:
1. **Create a channel** in *Data → Channels* that classifies your traffic sources. Add a definition that maps your own domain (in the `referrer` event property) to a channel value such as `internal`.
2. **Create a persisted property** in *Data → Properties* that uses your channel as the event property. Set **Allocation** to **Most recent** and **Expiration** to match your analysis (commonly **Session**).
3. In the persisted property's **Excluded values** field, add the channel value you want to ignore — for example, `internal`. Persisted properties treat excluded values as if the property weren't on the event at all, so allocation rolls forward from the previous valid value.
4. Use the persisted property in your charts. Internal navigation no longer resets the persisted source; the original campaign or referrer continues to attribute downstream events such as `Add to Cart` or `Purchase`.
The same pattern works for any value you want allocation to ignore — internal QA traffic, bot signatures, or test events — not just internal referrers.
## Achieve last non-direct touch attribution
Last non-direct touch attribution assigns credit to the most recent marketing channel a user engaged with before converting, skipping over direct visits. Persisted properties can replicate this model.
This is the attribution model used for user-scoped and session-scoped dimensions in Google Analytics.
Attribution event properties such as `referrer` and UTM parameters attach to every event by default on Browser SDK 2.45.0+ and GTM template 5d7e5+. You don't need to change your SDK or GTM configuration before following these steps.
### How it works
Persisted property allocation automatically skips events where the property has no value, so direct visits with no channel value don't overwrite the persisted source. If a user enters through Paid Search, browses, returns directly later, and converts, the conversion event still attributes to Paid Search.
The setup combines two configurations:
- A channel classifier that doesn't assign "Direct" as a catch-all fallback. Direct sessions arrive without a channel value rather than with a Direct value.
- A persisted property that renames `(none)` to "Direct" for display, so genuinely unattributed users still appear under a named value rather than blank.
### Set up the persisted property
1. Go to *Data → Properties* and create a new persisted property.
2. Select your channel classifier output (for example, `Marketing Channel`) as the event property.
3. Set **Allocation** to **Most recent**.
4. Set **Expiration** to a window that matches your business cycle, such as 7 days.
5. In **Rename (none) values**, enter `Direct`. Users with no attributed channel display as "Direct" rather than blank.
### Configure the channel classifier
In *Data → Channels*, make sure your classifier defines explicit rules for each channel — Paid Search, Organic Social, Email, and so on. Don't add a catch-all rule that assigns Direct to everything else. With no catch-all, direct sessions arrive without a channel value, and the persisted property carries the most recent non-direct channel forward.
### Supported metrics
This approach works with **Event Totals**, **Session Totals**, and **Unique counting** mechanisms in Data Tables. Amplitude doesn't support changing the attribution method within data tables when you use a persisted property as a group-by, so multi-touch attribution models don't apply.
### Related pattern: Excluded values for named traffic
If you want to skip specific *named* values during allocation — for example, an "internal" channel for same-domain referrers, QA traffic, or bot signatures — use **Excluded values** on the persisted property. Refer to [Filter internal referrers from attribution](#filter-internal-referrers-from-attribution). The Rename `(none)` approach above is the right tool when direct visits arrive as fully unattributed sessions; Excluded values is the right tool when allocation needs to skip a specific value the classifier emits.
### Verify the setup
After you configure the property and the classifier, follow the [verify persisted properties guide](https://amplitude.com/docs/data/persisted-properties/verify-persisted-properties) to confirm direct visits don't overwrite the persisted channel for users who arrived through marketing.
## Advanced: Item-level attribution
Item-level attribution typically powers merchandising analyses. It ties a persisted property to a specific item inside a cart event, rather than to the user or the session as a whole. When a cart contains multiple items, each item keeps its own persisted context (the search term, recommendation, or promo that influenced that specific item). Metrics such as `Revenue` reflect the source that drove each item individually.
This is the configuration that powers the [Product Discovery hub](https://amplitude.com/docs/analytics/ootb-ecommerce-analytics#product-discovery) in Out-of-the-box E-commerce Analytics.
For example, a single cart contains three items, and the user discovered each one a different way:
* The user discovered Item 1 through Search.
* The user discovered Item 2 from the Popular Products display.
* The user discovered Item 3 from Recommendations.
Without item-level attribution, Amplitude credits all conversion events for the entire order to a single discovery method. With **Original** allocation, on-site Search receives all the credit. With **Most Recent**, Recommendations receives the credit.
Item-level attribution instead credits the correct discovery method to each item in the cart.
### Set up the persisted property
1. Create a new persisted property called `Most recent Finding Method`.
2. Select the event property you want to persist. For this example, use `discovery_method`.
3. Choose an **Allocation** method. Because you want the last touchpoint, select **Most Recent**.
4. To credit the first touchpoint instead, select **Original**.
5. Set the **Expiration**. By default, the persisted property expires at the end of the session.
After you create the property, configure item-level attribution.
### Configure item-level attribution
1. Select the product identifier you use. Ideally, use an item property in an `Object Array` such as `product.item_id`. For more on object arrays, refer to [Cart Analysis](https://amplitude.com/docs/analytics/charts/cart-analysis).
2. Select one or more **linking events**. These are events that carry both the persisted property value (such as `discovery_method`) and the item identifier (`product.item_id`). These are typically the events where the user interacts with an item, such as `View Item Details`, `Home Hero Clicked`, `Promotion Clicked`, `Recommendation Clicked`, or `Add to Cart`. Linking events let Amplitude tie the engagement signal to the specific item.
Amplitude then carries the persisted value forward to cart events (`Add to Cart`, `Remove from Cart`, `Purchase`) per item, using the product identifier as the join key.
### Verify the setup
After you save the property, the persisted value appears as a column on the linking and cart events. Use the [Verify a property with item-level attribution](https://amplitude.com/docs/data/persisted-properties/verify-persisted-properties#verify-a-property-with-item-level-attribution) section of the verify guide to confirm each item shows the expected value.
## Use persisted properties across analyses
After you define a persisted property (such as `Entry Page` or `Most Recent Finding Method`), Amplitude automatically applies it to upstream/downstream events based on the allocation and expiration rules you've configured. You don't need to manually re-attribute or make sure the original property exists on every event.
You can use persisted properties anywhere you select event properties in Amplitude:
- **Data Tables**: Group, filter, and break down rows by persisted properties.
- **Event Segmentation**: Segment, group by, or filter charts using persisted properties.
- **Funnels**: Apply persisted properties to funnel steps or as group-bys for downstream conversion analysis.
- **Cohorts**: Define audiences using persisted property values, including in inline cohorts.
Persisted properties appear in property selectors alongside standard event properties under the name you gave them in Data Settings (for example, `Entry Page`).
You can access the context you captured earlier wherever you analyze outcomes.
For example:
- **Entry Page (Original, Session)**: A user lands on `/mens-shoes`, browses several pages, then completes a purchase. Even though the `Purchase` event doesn't include `Page Path`, your persisted `Entry Page` still displays `/mens-shoes`, letting you group purchases by where sessions originally started.
- **Most recent Finding Method (Most recent, Session)**: A user first discovers a product through `Search`, later clicks a `Recommendation`, and finally adds the item to cart. Because you set the allocation to `Most recent`, the persisted value on `Add to Cart` and `Purchase` is `Recommendation`, reflecting the last touchpoint before conversion.
For merchandising teams using the advanced setup:
- Amplitude carries product-level context (such as `Finding Method` or `homepage module`) forward to cart and purchase events using the product identifier you configured.
- If a cart contains multiple items, each item keeps its own persisted value. Amplitude attributes revenue, AOV, and add-to-cart metrics to the correct source for each product.
This lets you:
- Group or filter outcome events (`Add to Cart`, `Purchase`, or `Revenue`) by persisted properties in data tables.
- Measure which entry pages, homepage modules, or recommendation zones drive conversions.
- Analyze results consistently across charts without rebuilding attribution logic each time.
## Product Discovery hub
The [Product Discovery hub](https://amplitude.com/docs/analytics/ootb-ecommerce-analytics#product-discovery) in E-comm Analytics uses persisted properties to power its **Which properties describe how users discover your product?** breakdown. The hub lets you attribute purchases and revenue to the discovery method that influenced each item in the cart.
For example, if a user discovers one product through on-site search and another through a homepage recommendation, item-level attribution assigns revenue to the correct discovery source for each product individually.
To configure a persisted property for Product Discovery:
1. Create a persisted property that captures your discovery context. For example, `Most Recent Finding Method` using the `discovery_method` event property.
2. Set **Allocation** to **Most Recent** to capture the last discovery action before the cart event.
3. Set **Expiration** to **Session** so discovery context resets at the end of each session.
4. Enable **Item-level attribution** and select your product identifier (for example, `product.item_id`).
5. Select the events where both your discovery property and product identifier are present (for example, `View Item Details` or `Add to Cart`).
After you configure the property, select this persisted property in the Product Discovery hub under **Which properties describe how users discover your product?**. Amplitude uses item-level attribution to credit each item's revenue to the correct discovery source.
For a detailed walkthrough of setting up item-level attribution, refer to [Advanced: Item-level attribution](#advanced-item-level-attribution).
## Multiple groupbys
You can group by more than one property in the same data table to combine persisted context with regular event data.
For example, you can group purchases by `Entry Page` and `Most Recent Finding Method` to understand how session entry points and discovery behavior work together.
Add additional groupbys by clicking **Add top-level group-by** at the top of a data table column.
When you include multiple properties in the same analysis, Amplitude evaluates each property independently.
**If both properties are persisted:**
- Amplitude populates each property using its own allocation and expiration rules.
- For example, `Entry Page` reflects where the session started (`Original`, `Session`), while `Most recent Finding Method` reflects the last discovery action before conversion (`Most recent`, `Session`).
- Both values appear on outcome events such as `Add to Cart` or `Purchase`, even if those events didn't originally contain them.
**If only some properties are persisted:**
- Persisted properties retain their computed values based on their configuration.
- Amplitude takes non-persisted properties directly from the outcome event being analyzed. For example, `Entry Page` comes from persistence, while `Device Type` comes from the `Purchase` event itself.
**If none are persisted:**
- All property values come as-is from the outcome events, with no carryover from earlier interactions.
You can combine journey context and event-level attributes in a single table, knowing that persisted properties keep their defined behavior while regular properties reflect what happened at the moment of conversion.
## Availability and limitations
- You can use persisted properties in Data Tables, Event Segmentation, Funnels, and Cohorts.
- Support in Stickiness, Composition, Growth Accounting, Revenue LTV, Impact, and Customer Journeys is coming soon.
- Persisted properties don't appear on the user profile.
- Raw data exports such as BigQuery don't include persisted property values. Amplitude computes them at query time, not at ingest, so they aren't materialized on the underlying events.
- Data tables support a 6-month time range when you select a persisted property.
## Attribution compared to persistence
Persistence controls how long property context remains available, while attribution controls how Amplitude assigns conversion credit. They solve related, but distinct, problems. You configure them independently.
If, after reading this article, the difference between attribution and persistence in Amplitude still isn't clear, review the following summary:
| Concept | Attribution | Property persistence |
|---------|-------------|----------------------|
| Scope | Metric-level (applies across properties) | Property-level (applies across Metrics). |
| What it does | Assigns conversion credit to a campaign, product, or channel. | Keeps those property values active across time. |
| Where defined | In Data Tables. | In project-level data settings. |
| Where it's used | In Data Tables. | In Data Tables, Event Segmentation, Funnels, and Cohorts. |
| Used for | Deciding who gets credit. | Making sure the right context exists for that credit. |
| Example | "Which campaign drove this purchase?" | "Which campaign or product should this purchase be associated with?" |
| Supported Allocation Models | Linear, Participation, U-shaped, J-shaped, Inverse J-shaped, Data driven, Custom. | Original (First touch), Most recent (Last touch), First known, Last known. |
| Multi-property semantics (Data tables) | Amplitude applies attribution only to the outermost groupby property. The rest of the properties follow the attributed event: [attribution with multiple properties](https://amplitude.com/docs/analytics/charts/data-tables/data-tables-attribute-credit#attribution-with-multiple-properties). | If there are multiple persisted properties, Amplitude persists each property individually. The persisted property also doesn't have to be the outermost [groupby property](#multiple-groupbys). |
================================================================================
# Verify persisted properties
URL: https://amplitude.com/docs/data/persisted-properties/verify-persisted-properties
================================================================================
# Verify persisted properties
Persisted Properties carry a property value forward from an earlier source event to a later target event at query time. After you set up a persisted property, it starts enriching your target event immediately. This guide shows you how to confirm they are working, using your own live data.
The pattern this guide covers:
**An event that fires your property → an event you want to analyze**
For example, "Item Viewed" fires `brand` and you want to see that brand carried forward to "Purchase Completed". Or "Search Performed" fires `search_term` and you want it on "Signup". Substitute your own events and properties throughout.
The verification process consists of:
1. Confirm the property is firing on the event that should carry it.
2. Confirm the right users are in scope.
3. Validate persistence in a Data Table.
## Before you start
Before running any checks, make sure you have [created the persisted property](https://amplitude.com/docs/data/persisted-properties) in **Data > Properties** and noted down:
- The event that fires the property you want to carry forward.
- The property name as it appears on that event.
- The event you want to analyze. This is the one you want enriched with the persisted value.
Also note the allocation method you chose, either **Original** (first touch) or **Most Recent** (last touch). The allocation determines which value gets carried when a user fires the source event more than a single time before reaching the target.
## Step 1: Confirm the property is firing on the event that should carry it
Before checking whether values are being persisted, confirm the property actually arrives on the source event in the first place. A high `(none)` rate on your target event is often traced back here.
### Check User Profiles
1. Go to *Users & Groups > [User Profiles](https://amplitude.com/docs/analytics/user-data-lookup)*.
2. Use the search bar to filter by name, email, or user ID if you have a specific user in mind.
3. Click **Add Filter** and choose **Performed event**. Select your source event. This narrows the list to users who have fired it at least once.
4. Click into any user in the results. In their event timeline, find an instance of the source event and expand it. You should see the property you're persisting listed alongside its value.
{% callout type="note" heading="What to look for" %}
The property appears with a non-null value on the source event for the majority of users. Occasional nulls are normal. Some sessions may not hit that code path. A null rate above 30% suggests an instrumentation gap that needs fixing before persisted properties can work.
{% /callout %}
### Narrow to users who have the source but not yet the target
A useful diagnostic is to isolate users who fired the source event but haven't fired the target event in the same period. These users let you inspect the source property in isolation, without the complexity of a full journey.
1. Add a filter: `Performed event = your source event`.
2. Add a second filter: `Did not perform = your target event`.
3. Browse these users' timelines. Every source event should carry the property with a non-null value. This group is your cleanest signal that the upstream data is healthy.
After you're satisfied the source property is arriving reliably, proceed with the verification process.
## Step 2: Confirm the right users are in scope
Review the users who have fired both events. These are the users who carry the persisted value from the source to the target, and they're the population that appears in the [Data Table](#step-3-validate-persistence-in-a-data-table).
1. In User Profiles, add a filter: `Performed event = your source event`.
2. Add a second filter: `Performed event = your target event`.
3. Note the user count. This is the population you expect to see in the Data Table you'll build next.
4. Click into a few users. In each timeline, find a source event followed by the target event. Confirm the source event carries the property, and verify the event ordering matches what you'd expect for your allocation method.
{% callout type="note" heading="Allocation method affects directionality" %}
**Original** (first touch) locks in the first value Amplitude ever recorded for the user. It can attribute that value even if the source event fired after the target event within the expiration window.
**Most Recent** works in a strictly forward direction, using the latest value recorded before query time. When reviewing timelines, keep your method in place: for **Original**, find the chronologically earliest source event. For **Most Recent**, find the one closest to the target.
{% /callout %}
## Step 3: Validate persistence in a Data Table
The [Data Table](https://amplitude.com/docs/analytics/charts/data-tables/data-tables-attribute-credit) chart is the most powerful verification tool because it shows you the distribution of persisted values at scale, and lets you drill into the users behind any cell to close the loop.
### Build the table
1. Go to *Create > Data Table*.
2. Set the metric event to your target event (for example, "Purchase Completed"). Use **Event Totals** as the metric.
3. In the **Group-by** field, add your persisted property. It appears alongside standard event properties in the dropdown. Find the name you gave it in *Data > Properties*.
4. Set the date range to the last 7 days, or any window where you know both events have fired.
### Read the results
After the table loads, find the rows for each distinct value of the persisted property. The values are carried forward from the source event to the target. A healthy setup shows most of your target event volume attributed to a named value, with a small `(none)` row.
| What you see | What it means | What to do |
|---|---|---|
| Named values appear with volume; `(none)` is a small fraction | Persistence is working. The property is being carried forward successfully. | Setup is correct. Tune your allocation method or expiration if needed. |
| `(none)` dominates the table | Many target events lack a persisted value. The source event may not be firing the property reliably, or the event ordering doesn't match your allocation method. | Return to the [Step 1](#step-1-confirm-the-property-is-firing-on-the-event-that-should-carry-it) step and audit source event instrumentation. Confirm both events fall within the expiration window. For **Most Recent**, the source should precede the target; for **Original**, the first-ever occurrence is used regardless of ordering. |
| Persisted property doesn't appear in Group-by | The property definition may not yet be saved, or it targets a different event. | Go to **Data > Properties**, open the persisted property, and confirm the source event and property name are correct. |
### Drill into users from the table
Clicking any cell in the Data Table opens a list of users behind that number. This is the most direct way to close the loop between your aggregate picture and real individual journeys.
1. Click on the count in a cell. For example, the number of target events associated with a specific persisted value.
2. In the panel that opens, click to create a cohort. Cross-reference these users against the users you identified in the [Confirm the right users are in scope](#step-2-confirm-the-right-users-are-in-scope) step. They should largely overlap.
3. Click into one of those users and open their event timeline. Find the target event and confirm it shows the persisted property with the expected value. Then trace back to the source event and confirm the value matches.
4. *(optional)* Compare allocation methods side by side. If you set up two persisted properties with different allocation methods (Original and Most Recent), add both as group-bys in the same table. Rows where they agree represent single-source sessions. Rows where they differ reveal multi-source journeys. Both values are correct, they just answer different questions.
{% callout type="note" heading="" %}
The loop is closed when:
1. The user appears in your [filter](#step-2-confirm-the-right-users-are-in-scope) (performed both events).
2. They appear in the Data Table under a named persisted value, not `(none)`.
3. Their event timeline shows the source and target events within the same expiration window, with the persisted property value matching what you'd expect given your allocation method.
{% /callout %}
## Verify a property with item-level attribution
If your persisted property uses [item-level attribution](https://amplitude.com/docs/data/persisted-properties#advanced-item-level-attribution), verification groups events by **item identifier** (such as `product.item_id`) rather than by user or session. Each item in the cart can carry a different persisted value, so checks happen for each item.
For each item, confirm:
- The first-touch and last-touch candidate values from your linking events.
- Which value Amplitude persists onto each cart event, based on the property's allocation method.
- Whether the persisted value matches what you expect. A mismatch points to an instrumentation gap on the source event or the linking event.
### Spot-check a single item
1. In *Users & Groups > [User Profiles](https://amplitude.com/docs/analytics/user-data-lookup)*, open a user who completed a `Purchase` (or `Add to Cart`) event.
2. Expand the cart array on that event. Note the item identifier (such as `product.item_id`) for one item.
3. In the same user's timeline, find the [linking events](https://amplitude.com/docs/data/persisted-properties#configure-item-level-attribution) you selected when configuring the property — for example, `View Item Details` and `Add to Cart`. Confirm each linking event carries both the source property and the item identifier.
4. Compare the persisted value on the cart event for that item against your allocation method:
- **Original**: the value from the earliest linking event for that item.
- **Most Recent**: the value from the latest linking event for that item before the cart event.
### Validate at scale in a Data Table
Build a [Data Table](https://amplitude.com/docs/analytics/charts/data-tables/data-tables-attribute-credit) with your cart event grouped by both the persisted property and the item identifier. Rows with `(none)` are candidates to investigate — either the source event didn't fire the property for that item, or the linking events don't capture the item identifier reliably.
## Troubleshoot common issues
| Symptom | Likely cause and fix |
|---|---|
| High `(none)` rate on the target event | The source event isn't firing the property on most instances, or users are reaching the target event outside the expiration window. Audit source event instrumentation first. If the journey spans multiple sessions, switch expiration from **Session** to **User**. |
| Persisted property missing from Group-by | The property definition may not yet be saved or is pointing at the wrong event. Go to **Data > Properties**, open the persisted property, and confirm the source event and property name exactly match your taxonomy. |
| Values don't match what you see in the user timeline | Likely an allocation mismatch. If **Original** is set, the value locked in is from the first source event in the session, not the one closest to the target. Re-read the timeline in session order. |
| Users in Step 2 don't appear in the Data Table | The session or user expiration window may have ended between the two events. Extend the expiration, or filter the Data Table to the same date range you used in User Profiles. |
================================================================================
# Environment settings for projects (legacy feature)
URL: https://amplitude.com/docs/data/environment-settings
================================================================================
# Environment settings for projects (legacy feature)
{% callout type="warning" title="Legacy feature" %}
This article describes an unsupported **legacy feature**. It's still available for a small number of Amplitude customers, but isn't accessible for customers who don't already have access.
{% /callout %}
In Amplitude Data, the **project** is where you configure events, properties, sources, and destinations. It's also called the **tracking plan**. This is distinct from an **environment**.
Amplitude Analytics also uses projects, but it does so differently. Setting up a project in Amplitude Analytics is a prerequisite for receiving data from your product. The project is where the data flows to, and where you conduct your analyses.
It's best practice to have at least two projects in Amplitude Analytics: one for production, and one for development. This way, you can validate against the development project first, and then roll out approved changes to production.
In Amplitude Data, the environment is **another name** for a specific project in Amplitude Analytics.
Each project in Amplitude Data can have up to two environments. Use one for debugging and the other for clean production data.
In Amplitude Data, the **Environments tab** is where you manage the mapping between your two environments (production and development) and your Amplitude projects. Amplitude Data uses the information you enter here to configure sources and destinations, validate data in the tracking plan page, and sync schemas on the *Integrations* tab.
For each environment, select the project name from the drop-down list. When you're finished, click *Save*.
## Environments in the tracking plan
You can make modifications to your tracking plan in any filtered environment (*Production*, *Development*, or *Staging*), or an environment further segmented by status and filters, as seen in the image below. Understand which changes sustain when working in environments where the action wasn't taken.
Any creation, update, or deletion of events, properties, or groups applies to all environments that the object is present in. All other actions, like blocking or transformations, are environment-specific.
The following table highlights actions that sustain across all environments versus actions that sustain only in the filtered environment where you performed the action.
Actions that sustain across all environments are:
- Creating events, properties, or groups.
- Updating events, properties, or groups (includes visibility and activity status changes).
- Deleting events, properties, or groups.
Actions that sustain only in the filtered environment where you performed the action are:
- Applying block or drop filters.
- Blocking events, properties, or groups.
- Any action involving custom events.
- Any action involving derived properties.
- Any action involving lookup properties.
- Any action involving transformations.
{% callout type="note" %}
The branch and settings you're working with dictate how Amplitude saves, approves, or merges changes. For example, changes allowed on a main branch depend on your settings but Amplitude applies them automatically when saved. Read more about [working with branches](https://amplitude.com/docs/data/work-with-branches).
{% /callout %}
================================================================================
# Aggregated Metrics (fka Warehouse Metrics) Overview
URL: https://amplitude.com/docs/data/warehouse-metrics
================================================================================
# Aggregated Metrics (fka Warehouse Metrics) Overview
Aggregated Metrics (formally known as Warehouse Metrics) import precomputed metric values directly from your data warehouse into Amplitude, so your analyses use the same numbers as your warehouse source of truth.
Unlike event-based metrics that Amplitude calculates from behavioral data, Aggregated Metrics (fka Warehouse Metrics) sync pre-calculated values from your warehouse. You can use business metrics like revenue, customer lifetime value, health scores, and financial KPIs alongside behavioral data in Amplitude's analytics and experimentation tools.
Use Aggregated Metrics when you need numeric, time-series values that you can aggregate, set as experiment goals, or chart over time. If you only need the most current user attributes from your warehouse, use [Profiles](https://amplitude.com/docs/data/profiles) instead.
{% callout type="note" %}
To gain access, contact your Amplitude Client Success Manager.
{% /callout %}
## How Aggregated Metrics (fka Warehouse Metrics) work
Aggregated Metrics (fka Warehouse Metrics) sync on a recurring schedule from tables in your data warehouse. Each row should include the following:
- **Time**: When the metric value is valid.
- **User identifier**: The `user_id` or `device_id` to which the metric applies.
- **Insert identifier**: An optional unique identifier for deduplication.
- **Metric values**: Numeric values (like revenue: 13423, count: 50).
- **Dimensions** (optional): Categorical attributes (like `health_score`: `"green"`, or `paid: true`).
## Requirements
- An Amplitude project.
- Read access to your Snowflake instance.
- A table or view that contains metric values with timestamps and user identifiers.
- Change Data Capture (CDC) enabled for your metrics table.
{% callout type="note" heading="Anonymous user support" %}
Aggregated Metrics (fka Warehouse Metrics) support both identified users (`user_id`) and anonymous users (`device_id`).
{% /callout %}
## Metric types
Aggregated Metrics (fka Warehouse Metrics) supports these aggregation types on values:
- **Sum**: Total of all values.
- **Average**: Mean value across per-user sums.
- **Min**: Minimum value.
- **Max**: Maximum value.
For more information, refer to [Warehouse Metric Calculations](https://amplitude.com/docs/data/warehouse-metric-calculations).
## Data types
- **Metrics**: Numeric values only (integers, decimals).
- **Dimensions**: String, number, or boolean values for grouping and filtering.
{% callout type="note" heading="" %}
Metrics require the source data to be numeric.
{% /callout %}
## Common use cases
Aggregated Metrics (fka Warehouse Metrics) solve challenges where business metrics are difficult or impossible to calculate natively in Amplitude:
### Revenue and financial metrics
- **Average Order Value (AOV)**: Precomputed.
- **Credits Remaining/Used**: Account balance tracking.
These metrics often require data that's too high-volume, sensitive, or non-event-based to send to Amplitude efficiently.
### Customer health metrics
- **Customer Lifetime Value (LTV)**: Forward-looking revenue projections.
- **Health Scores**: Composite metrics from multiple data sources.
- **Churn Risk**: Machine learning predictions from your warehouse.
These metrics require modeling and forecasting that happens in your data warehouse.
### State metrics
- **Activation Status**: User onboarding state.
- **Subscription Tier**: Current plan level.
- **Beta Group Membership**: Feature access flags.
- **Experiment Exposure**: Assignment tracking.
These metrics track current user state rather than discrete events.
## Import metric data
Aggregated Metrics (fka Warehouse Metrics) supports Snowflake.
### Enable change tracking
If this is your first time importing from this table, enable change tracking in Snowflake:
```sql
ALTER TABLE YOUR_DATABASE.YOUR_SCHEMA.YOUR_METRICS_TABLE
SET DATA_RETENTION_TIME_IN_DAYS = 7;
ALTER TABLE YOUR_DATABASE.YOUR_SCHEMA.YOUR_METRICS_TABLE
SET CHANGE_TRACKING = TRUE;
```
{% callout type="note" heading="Snowflake Standard Edition" %}
On Snowflake Standard Edition, the maximum retention time is one day. Set your sync frequency to 12 hours.
{% /callout %}
### Connect and configure
Follow the instructions in [Snowflake Data Import](https://amplitude.com/docs/data/source-catalog/snowflake#add-and-configure-the-snowflake-source) to connect to your Snowflake instance.
## Data specifications
Your metrics table must include specific required fields and can optionally include additional fields. You must include at least one metric or dimension field.
### Required fields
| Field | Description | Example |
| ------------------------ | ----------------------------------------- | ------------ |
| `time` | When the metric value is valid | `1762813185` |
| `user_id` or `device_id` | A unique identifier for a user or device. | `user_12345` |
{% callout type="note" heading="Time conversion" %}
Amplitude requires the incoming time in milliseconds from the Unix epoch. Use Snowflake’s built-in conversion functions or other tooling in your data pipeline to convert to this format before Amplitude ingests the data.
{% /callout %}
### Optional fields
| Field | Description | Example |
| ----------- | -------------------------------------- | -------------------------------------- |
| `insert_id` | A unique identifier for deduplication. | `51a87950-b35d-4a2f-b919-af92f00f75dd` |
### Metric fields
Your metrics table must include at least one metric or dimension field.
| Field Type | Description | Example |
| ---------- | :------------------------------------------------ | ------------------------ |
| Metric | Numeric value (integer or decimal) | `150.25` |
| Dimension | String, boolean, or number for filtering/grouping | `"active"`, `true`, `10` |
### Example
```json
{
"time": "1762813185",
"user_id": "user_12345",
"total_revenue": 1543.5,
"order_count": 12,
"ltv": 15430.0,
"health_score": "green",
"is_paid": true
}
```
## Query template
```sql
SELECT
event_date AS "time",
user_id AS "user_id",
total_revenue AS "total_revenue",
order_count AS "order_count",
ltv AS "ltv",
health_score AS "health_score",
is_paid_customer AS "is_paid"
FROM DATABASE_NAME.SCHEMA_NAME.METRICS_TABLE
WHERE event_date >= CURRENT_DATE - INTERVAL '30 days'
```
## Add your metric to an experiment
Use Aggregated Metrics (fka Warehouse Metrics) in end-to-end experiments or experiment results as:
- **Goals**: Measure impact on business metrics.
- **Analysis metrics**: Understand how experiments affect revenue, LTV, and other KPIs.
When you create or edit an experiment, select metrics from the Warehouse source in the metrics picker.
{% callout type="note" heading="Last synced information" %}
Aggregated Metrics (fka Warehouse Metrics) display when they were last synced and the next scheduled sync.
{% /callout %}
### Creating a warehouse metric in your experiment
1. In the experiment, navigate to the **Metrics** panel.
2. Click **Create a custom metric**.
3. Enter a **Name** and **Description** for the metric.
4. Click the **Warehouse** tab.
5. Select the table you specified during data import.
6. Define the metric. Choose **Sum**, **User Average**, **Min**, or **Max**.
7. Select the column in the table you want to combine using the definition you selected.
8. Preview the results and click **Save**.
{% callout type="tip" heading="" %}
Aggregated Metrics (formally known as Warehouse Metrics) you created before appear in the **Add Metric** dialog. You don't need to recreate them.
{% /callout %}
## Best practices
1. **Define metrics once**: Create metrics in your warehouse and reference them everywhere in Amplitude.
2. **Use descriptive names**: Name metrics clearly (like "Average Order Value" not "metric_1").
3. **Include descriptions**: Add descriptions in the Metrics creation flow to help users understand what each metric measures.
4. **Start with key metrics**: Begin with 5-10 critical metrics before expanding.
## Troubleshooting
If you encounter issues with Aggregated Metrics (fka Warehouse Metrics), these common problems and solutions can help you resolve them.
### Sync failures
- Ensure data retention period is at least seven days, unless you use Snowflake Standard Edition, then set it to one day.
- Verify warehouse credentials haven't expired.
- Check that the table structure hasn't changed.
- Ensure Change Data Capture (CDC) is enabled in your Snowflake table or view.
- Verify the sync completed successfully in the activity log.
## Limitations
- Aggregated Metrics (fka Warehouse Metrics) require a unique user identifier per row.
- Metric values can only be numeric (dimensions can be strings, numbers, or booleans).
- Each metric represents a point-in-time value, not an event stream.
- Amplitude doesn't support rollup or combined tables without unique user identifiers.
- Aggregated Metrics (fka Warehouse Metrics) don't support CUPED or group by.
## Frequently asked questions
### Using Aggregated Metrics (fka Warehouse Metrics) without sending events to Amplitude
Yes, but Aggregated Metrics (fka Warehouse Metrics) are most powerful when combined with behavioral events. You can create metric-only charts if needed.
### Differences between Aggregated Metrics (fka Warehouse Metrics) and profiles
Profiles sync current user attributes. Aggregated Metrics (fka Warehouse Metrics) sync time-series numeric values that you can combine, use as experiment goals, and visualize over time.
================================================================================
# Aggregated Metric Calculations
URL: https://amplitude.com/docs/data/warehouse-metric-calculations
================================================================================
# Aggregated Metric Calculations
When you create an Aggregated Metric, Amplitude provides calculation definitions (Sum, User Average, Min, and Max) that determine how numeric values aggregate from your connected warehouse table.
These calculation types help you choose the right measurement for your business or product question.
## Sum calculation
Use the Sum calculation to measure total values, for example, total revenue, total purchases, or total number of sign-ups during a period.
This option adds up all numeric values from the selected column (such as `revenue` or `count`) across all rows returned from your warehouse query.
### Definition
Adds all numeric values from newly imported rows.
Amplitude doesn't apply per-user grouping. Each row contributes its full value to the total.
### Example
| User ID | Daily Spend | Timestamp |
| ------- | ----------- | ----------- |
| U1 | 2 | 01 Jan 2025 |
| U1 | 5 | 06 Jan 2025 |
| U2 | 3 | 01 Jan 2025 |
| U3 | 10 | 03 Jan 2025 |
| U3 | 0 | 04 Jan 2025 |
| U3 | 5 | 06 Jan 2025 |
$$
\text{Sum of Daily Spend = } 2 + 5 + 3 + 10 + 0 + 5 = 25
$$
### When to use Sum
| Use Case | Description |
| -------------------------- | ---------------------------------------------------------- |
| Revenue and spend tracking | Measure total revenue or spend from all users. |
| Event counts | Count total events (such as purchases or sessions). |
| Operational totals | Aggregate numeric values like impressions or transactions. |
Example question:
> What's the total revenue generated this month?
## User Average calculation
Use the User Average calculation to measure average user-level behavior, for example, the average weekly spend per user or average number of sessions per user.
### Definition
Amplitude first aggregates data per user (summing values such as daily spend to get weekly totals), then computes the average of those per-user totals across all users. Each user contributes equally to the final metric.
### Example
| User ID | Daily Spend | Timestamp |
| ------- | ----------- | ----------- |
| U1 | 2 | 01 Jan 2025 |
| U1 | 5 | 06 Jan 2025 |
| U2 | 3 | 01 Jan 2025 |
| U3 | 10 | 03 Jan 2025 |
| U3 | 0 | 04 Jan 2025 |
| U3 | 5 | 06 Jan 2025 |
Step 1: Per-user roll-up (SUM)
| User | User Sum |
| ---- | -------- |
| U1 | 7 |
| U2 | 3 |
| U3 | 15 |
Step 2: Average across users
$$
\frac{7 + 3 + 15}{3} = 8.33
$$
Each user contributes one aggregated value (sum) to the final average.
### When to use User Average
| Use Case | Description |
| ------------------- | ------------------------------------------------------------------ |
| Experiment metrics | Align with Experiment's User Average computation for A/B testing. |
| Per-user KPIs | Measure average user engagement, revenue, or behavior. |
| Behavioral analysis | Understand what a *typical* user does, rather than total activity. |
Example question:
> What's the average total spend per user this week?
## Min calculation
Use the Min calculation when you need to find the lowest value observed within the selected time window or user group.
Min answers questions like "What's the minimum purchase amount a user made this week?" or "What's the lowest daily spend among all users?"
### Definition
Amplitude first determines each user's minimum value within the selected column and time bucket, then selects the lowest value overall.
### Example
| User ID | Daily Spend | Timestamp |
| ------- | ----------- | ----------- |
| U1 | 2 | 01 Jan 2025 |
| U1 | 5 | 06 Jan 2025 |
| U2 | 3 | 01 Jan 2025 |
| U3 | 10 | 03 Jan 2025 |
| U3 | 0 | 04 Jan 2025 |
| U3 | 5 | 06 Jan 2025 |
Per-user minimums:
| User | Min Spend |
| ---- | --------- |
| U1 | 2 |
| U2 | 3 |
| U3 | 0 |
$$
\text{Overall Min} = 0
$$
### When to use Min
| Use Case | Description |
| --------------------- | ----------------------------------------------------------------- |
| Performance baselines | Track the lowest measured metric (such as minimum daily revenue). |
| Data quality checks | Identify outliers or unexpected zeros. |
| Threshold analysis | View the minimum observed value across users or segments. |
Example question:
> What's the minimum spend any user recorded this month?
## Max calculation
Use the Max calculation to find the highest value observed within the selected time window or user group.
Max answers questions such as "What's the maximum amount a user spent in a day?" or "What's the peak Lifetime Value (LTV) achieved so far?"
### Definition
Amplitude first finds each user's maximum value within the selected column and time bucket, then returns the highest value overall.
### Example
| User ID | Daily Spend | Timestamp |
| ------- | ----------- | ----------- |
| U1 | 2 | 01 Jan 2025 |
| U1 | 5 | 06 Jan 2025 |
| U2 | 3 | 01 Jan 2025 |
| U3 | 10 | 03 Jan 2025 |
| U3 | 0 | 04 Jan 2025 |
| U3 | 5 | 06 Jan 2025 |
Per-user maximums:
| User | Max Spend |
| ---- | --------- |
| U1 | 5 |
| U2 | 3 |
| U3 | 10 |
$$
\text{Overall Max} = 10
$$
### When to use Max
| Use Case | Description |
| -------------------- | --------------------------------------------------- |
| Performance tracking | Track the highest spend, usage, or value recorded. |
| Capacity analysis | Monitor peak activity levels or spikes. |
| Goal attainment | Identify the best performing users or time periods. |
Example question:
> What's the maximum amount a single user spent in one day?
## Summary: Choose between calculation types
| Calculation | Aggregation Logic | Use When You Want to Measure… | Example Metric |
| ------------ | ---------------------------------------------- | ----------------------------- | ----------------------------- |
| Sum | Adds all numeric values (no per-user grouping) | Total activity or revenue | Total Purchases |
| User Average | Sum per user, then average across users | Typical user behavior | Average Weekly Spend per User |
| Min | Minimum per user, then select lowest value | Minimum observed value | Lowest Daily Spend |
| Max | Maximum per user, then select highest value | Maximum observed value | Peak Daily Spend |
================================================================================
# Data Mutability Features
URL: https://amplitude.com/docs/data/data-mutability
================================================================================
# Data Mutability Features
Data mutability applies `INSERT`, `UPDATE`, and `DELETE` operations from your warehouse to event data already in Amplitude, so corrections, late-arriving rows, and deletions in your source of truth propagate to your analytics. Mirror Sync delivers these operations from Snowflake, Databricks, Google BigQuery, and Amazon S3.
Turn on Mirror Sync when your warehouse is the source of truth and rows there change after first write, such as GDPR or CCPA deletions, backfilled corrections, or late-arriving updates. Stay on standard append-only ingestion when events never change after they land.
This functionality is especially valuable for organizations that need to:
- Correct historical data errors.
- Adhere to data privacy regulations (GDPR, CCPA).
- Maintain data consistency across systems.
- Handle late-arriving or corrected data.
## Supported data sources
Data Mutability is available through the following warehouse integrations.
### Snowflake
- **Mirror Sync** strategy with Change Data Capture (CDC).
- Supports `INSERT`, `UPDATE`, and `DELETE` operations.
- Requires Change Tracking enabled on source tables.
- [Learn more about Snowflake integration →](https://amplitude.com/docs/data/source-catalog/snowflake).
### Databricks
- **Mirror Sync** strategy with Change Data Feed (CDF).
- Supports `INSERT`, `UPDATE`, and `DELETE` operations.
- Requires Change Data Feed enabled on Delta tables.
- [Learn more about Databricks integration →](https://amplitude.com/docs/data/source-catalog/databricks).
### Google BigQuery (Beta)
- **Mirror Sync** strategy with BigQuery's `CHANGES()` change history.
- Supports `INSERT`, `UPDATE`, and `DELETE` operations for the Event data type.
- Requires change history enabled on source tables (`enable_change_history = TRUE`).
- [Learn more about BigQuery integration →](https://amplitude.com/docs/data/source-catalog/bigquery#mirror-sync-with-change-data-capture-cdc).
### Amazon S3
- **Mirror Sync** strategy for file-based mutations.
- Supports `INSERT`, `UPDATE`, and `DELETE` operations.
- Requires structured mutation metadata in your data files.
- [Learn more about Amazon S3 integration →](https://amplitude.com/docs/data/source-catalog/amazon-s3).
## How Mirror Sync works
When you enable Mirror Sync with data mutability:
1. **Change detection**: The integration monitors your warehouse for data changes using native change tracking features (CDC for Snowflake, CDF for Databricks, `CHANGES()` change history for BigQuery, or file metadata for S3).
2. **Operation processing**: Amplitude processes three types of operations:
- `INSERT`: Adds new events to Amplitude.
- `UPDATE`: Modifies existing events in Amplitude.
- `DELETE`: Removes events from Amplitude.
Amplitude finds matching events based on the combination of `user_id`, `insert_id`, and `event_time`. All three fields must match before Amplitude can identify and modify the correct event.
3. **Data synchronization**: Changes apply to keep consistency between your warehouse and Amplitude.
## Enrichment services
{% callout type="warning" heading="Enrichment Services Disabled" %}
When using Mirror Sync with data mutability, Amplitude disables enrichment services, including:
- ID resolution and user merging.
- Property and attribution syncing.
- Location resolution.
- Taxonomy validation.
Disabling enrichment ensures your data remains exactly as it exists in your source of truth.
{% /callout %}
## General requirements
- **User ID required**: All events must contain a user ID. Mirror Sync doesn't support anonymous events.
- **Unique Insert ID**: Each event should have a unique and immutable `insert_id` to prevent duplication.
- **Chronological order**: Process events in chronological order when possible.
## Event volume considerations
{% callout type="note" heading="Event Volume Impact" %}
Data mutations count toward your event volume:
- **Warehouse sources (Snowflake, Databricks, BigQuery)**: Multiple operations on the same event within a sync window count as one event.
- **File sources (S3)**: Each operation counts separately toward your event volume.
Monitor your usage and contact sales if you need additional event volume.
{% /callout %}
### Data retention
- **Snowflake**: `DATA_RETENTION_TIME_IN_DAYS` must be ≥ 1 (recommended: ≥ 7 days).
- **Databricks**: Change Data Feed retention must cover your sync frequency.
- **BigQuery**: The table's time-travel window must cover your sync frequency (default seven days, configurable from two to seven days).
- **S3**: Files must remain accessible throughout processing.
## Best practices
Keep the following best practices in mind as you enable data mutability.
### Plan your implementation
1. **Start with a test project**: Create a dedicated test environment to validate your mutation logic before implementing in production.
2. **Design for idempotency**: Ensure your mutation operations can be safely retried without causing data inconsistencies.
3. **Monitor data quality**: Implement validation checks to ensure mutations apply correctly.
### Data privacy compliance
When using data mutability for privacy compliance:
1. **Stop data flow first**: Before you delete user data, ensure you send no new data about that user to Amplitude.
2. **Use User Privacy API**: For complete user deletion, use the [User Privacy API](https://amplitude.com/docs/apis/analytics/user-privacy) with warehouse deletions.
3. **Verify deletion**: Confirm that deleted data no longer appears in your analytics.
### Performance optimization
- **Batch operations**: Group related mutations together when possible.
- **Optimize sync frequency**: Balance data freshness needs with processing overhead.
- **Monitor resource usage**: Track warehouse compute costs associated with change tracking.
## Migrate to data mutability
If you're migrating from a standard ingestion strategy to Mirror Sync, follow these steps.
### Recommended migration steps
1. **Create cutoff strategy**:
- Modify the existing connection with a time filter (for example, `WHERE time < {cutOffDate}`).
- Set the cutoff date to tomorrow in milliseconds since epoch.
2. **Wait for cutoff**: Allow the cutoff date to pass and verify no new data flows through the old connection.
3. **Create new Mirror Sync source**:
- Configure the new source with a complementary filter (for example, `WHERE time >= {cutOffDate}`).
- Enable Mirror Sync with the mutation settings you want.
4. **Clean up**: Remove the old source connection after verifying the new one works correctly.
## Common issues
**Events don't update**
- Verify that change tracking is enabled on source tables.
- Check that events contain required user IDs.
- Confirm sync frequency settings.
**Missing deletions**
- Ensure DELETE operations are properly configured in your source.
- Verify that deleted events had valid user IDs.
- Check that change retention periods haven't expired.
**Data inconsistencies**
- Review mutation operation ordering.
- Verify that Amplitude disabled enrichment services as expected.
- Check for timing issues between warehouse changes and sync execution.
================================================================================
# Source catalog
URL: https://amplitude.com/docs/data/source-catalog
Updated: 2024-07-25
================================================================================
# Source catalog
{% catalog-grid type="source" / %}
================================================================================
# Connect to a source
URL: https://amplitude.com/docs/data/sources/connect-to-source
================================================================================
# Connect to a source
Amplitude Data lets you configure third-party platforms as data **sources**. Data sources bring data from other tools into Amplitude.
## Understand the interface
The _Sources_ panel includes two tabs, _Sources List_ and _Ingestion Debugger_.
The _Sources List_ tab shows the active data sources for a project, the activity status of each source, and the event volume each source sent in the last 30 days.
The Ingestion Debugger tab shows three charts: successful requests, event and identify counts, and error requests for the endpoints you specify. You can view the last 3 hours or the last 90 days.
Below the Ingestion Debugger, the throttled users and devices list shows which users and device IDs Amplitude has throttled in the last 30 minutes, plus any silenced device IDs.
{% callout type="note" %}
Only users with Manager permissions or higher can view throttled user IDs and device IDs in the Ingestion Debugger. Members and Viewers can't access the throttled users and devices list.
{% /callout %}
## Set up ingestion error alerts
Configure email alerts to notify you when ingestion errors occur. Ingestion error alerts help you identify and resolve data quality issues before the issues affect your analysis.
To set up ingestion error alerts, follow these steps:
1. Navigate to **Data** > **Sources**.
2. Select the **Ingestion Debugger** tab.
3. Select **Create A New Alert**.
4. Configure your alert settings:
- **Ingestion Path**: Select the source of the error. For example, SDK or HTTP API.
- **Error type**: Select the type of error that triggers the alert.
- **Threshold**: Set the error rate or count that triggers an alert.
- **Evaluation Window**: Set the frequency with which Amplitude checks for alerts.
- **Recipients**: Add email addresses for notification recipients.
- **Alert frequency**: Choose how often Amplitude sends alerts (for example, immediate, hourly, or daily).
5. Enable the alert and select **Create Alert**.
After you set up alerts, Amplitude monitors ingestion error rates and sends email notifications when errors exceed your configured thresholds. Use these notifications to address data quality issues and maintain reliable analytics.
{% callout type="tip" heading="Best practices" %}
- Set up alerts for critical data sources that power key dashboards or reports.
- Include multiple team members as recipients so one person doesn't receive all alerts.
- Review and adjust thresholds periodically based on your typical error patterns.
{% /callout %}
## Add a data source
To add a new data source, follow these steps:
1. In the left navigation, select **Catalog**.
2. Select the tile for the source you want to add.
3. Complete the setup for the source. Some sources redirect you to log in to your source account. Other sources show setup instructions on the source's _Set Up Connection_ tab.
## Source notifications
Notifications alert you when a source has an issue. By default, new sources notify the creator and Admins.
### Edit source notifications
1. In the left navigation, select **Sources**.
2. Select the source whose notifications you want to configure.
3. On the right side of the screen, select the email icon. The email icon tooltip says _Manage Notifications_.
4. Select **Subscribe** or **Unsubscribe** to change your notification subscription. To add or remove other email addresses, select **Manage Notifications**.
### Add source notifications to Slack
1. Follow [Slack's email guide](https://slack.com/help/articles/206819278-Send-emails-to-Slack#h_01F4WDZG8RTCTNAMR4KJ7D419V) to set up an email address for your Slack channel or DM.
2. Use the steps in _Edit source notifications_ to add that email address to the source notifications.
================================================================================
# Understand the data differences between Amplitude, Snowflake, and the Export API
URL: https://amplitude.com/docs/data/sources/export-api-differences
================================================================================
# Understand the data differences between Amplitude, Snowflake, and the Export API
Amplitude charts, Snowflake data, Redshift data, and Export API results can show different data for the same date range. These differences often relate to the [event time](https://amplitude.com/docs/analytics/user-data-lookup) that each platform uses. [Snowflake](https://amplitude.com/docs/data/destination-catalog/snowflake) and the [Export API](https://amplitude.com/docs/apis/analytics/export) use UTC event time. Amplitude charts use the project's configured time zone.
## Why Amplitude and Snowflake data can differ
If the Amplitude project time zone differs from UTC, Amplitude charts and Snowflake can show different data.
When you compare data, compare equivalent queries. For example, if you query event totals in Snowflake, compare those results to the event totals tab in the Event Segmentation chart.
## Why Amplitude and Export API data can differ
The date range in an Export API query uses the time when Amplitude servers received the event data. This time corresponds to the `server_upload_time` field.
Because Export API queries use `server_upload_time`, Export API results can differ from the data shown in Amplitude charts.
================================================================================
# Profiles
URL: https://amplitude.com/docs/data/profiles
================================================================================
# Profiles
Profiles join customer profile data from your data warehouse with the behavioral product data already in Amplitude.
Profiles act as standalone properties. Each one attaches to a user profile instead of to a specific event, so it differs from a traditional user property and supports more expansive analyses.
Profiles always display the most current data synced from your warehouse.
Use Profiles when you need the current value of a user attribute, such as a propensity score or account tier. To import precomputed metric values that change over time, such as revenue or health scores, use [Aggregated Metrics](https://amplitude.com/docs/data/warehouse-metrics) instead.
## Before you begin
Regardless of whether you're using Snowflake or Databricks, Change Data Capture (CDC) doesn't support replacing existing tables. Instead, you must use incremental modeling. If the table you integrate with drops and replaces data, the connection breaks.
### Profiles limits
| Plan | Limits |
| ---------- | ----------------------------------------------------------- |
| Enterprise | 1 billion operations (insert / update / delete) per month |
| Growth | 300 million operations (insert / update / delete) per month |
Each profile must reference a `user_id`.
### Snowflake users
If this is your first time importing data from this table, set a data retention time and enable change tracking in Snowflake with the following commands:
```sql
ALTER TABLE DATAPL_DB_STAG.PUBLIC.PROFILES_PROPERTIES_TABLE_1 SET DATA_RETENTION_TIME_IN_DAYS = 7;
ALTER TABLE DATAPL_DB_STAG.PUBLIC.PROFILES_PROPERTIES_TABLE_1 SET CHANGE_TRACKING = TRUE;
```
On Snowflake Standard Edition plans, the maximum retention time is one day. If you're on this plan, set the frequency to 12 hours in later steps.
### Databricks users
Follow these instructions to [enable change tracking](https://docs.databricks.com/en/delta/delta-change-data-feed.html#enable):
* If you're working with a new table, set the table property `delta.enableChangeDataFeed = true` in the `CREATE TABLE` command:
`CREATE TABLE student (id INT, name STRING, age INT) TBLPROPERTIES (delta.enableChangeDataFeed = true)`
Also set `spark.databricks.delta.properties.defaults.enableChangeDataFeed = true` for all new tables.
* If you're working with an existing table, set the table property `delta.enableChangeDataFeed = true` in the `ALTER TABLE` command:
`ALTER TABLE myDeltaTable SET TBLPROPERTIES (delta.enableChangeDataFeed = true)`
Set a [data retention period](https://docs.databricks.com/en/delta/history.html#configure-data-retention-for-time-travel-queries). The period must be at least one day, but in most cases set this period to seven days or longer. If your retention period is too short, the import process can fail.
## Set up a profile (Snowflake users)
To set up a profile in Amplitude, follow these steps:
1. In Amplitude Data, navigate to *Connections Overview*. Then in the *Sources panel*, click **Add More**. Scroll down until you find the Snowflake tile and click it.
2. On the *Set Up Connection* tab, connect Amplitude to your data warehouse by filling in all the relevant fields under *Snowflake Credentials*, which the [Snowflake Data Import guide](https://amplitude.com/docs/data/source-catalog/snowflake#add-and-configure-the-snowflake-source) outlines. You can either create a new connection, or reuse an existing one. Click **Next** when you're done.
3. You can find a list of your tables under *Select Table*. To begin column mapping, click the table you want.
4. In the list of required fields under *Column Mapping*, enter the column names in the appropriate fields to match columns to required fields. To add more fields, click **+ Add field**.
5. On the *Select Data* tab, select the `profiles` data type. Amplitude pre-selects the required change data capture import strategy for you, which appears under the *Select Import Strategy* dropdown:
* **Insert**: Always on, creates new profiles when added to your table.
* **Update**: Syncs changes to values from your table to Amplitude.
* **Delete**: Syncs deletions from your table to Amplitude.
6. When you're done, click **Test Mapping** to verify your mapping information. Then click **Next**.
7. Name the source and set the frequency at which Amplitude refreshes your profiles from the data warehouse. Set the frequency to 12 hours if you're on Snowflake Standard Edition.
## Set up a profile (Databricks users)
To set up a profile in Amplitude, follow these steps:
1. In Amplitude Data, navigate to *Connections Overview*. Then in the *Sources* panel, click **Add More**. Scroll down until you find the Databricks tile and click it.
2. In the *Set Up Connection* tab, connect Amplitude to your data warehouse. Have the following information ready:
* **Server hostname**: The hostname of your Databricks cluster. You can find it in your cluster configuration by navigating to *Advanced Options > JDBC/ODBC > Server Hostname*.
* **HTTP path**: The HTTP path of the cluster you want to connect to. You can find it in your cluster configuration by navigating to *Advanced Options > JDBC/ODBC > HTTP Path*.
* **Personal access token**: Use the personal access token to authenticate with your Databricks cluster. [Learn how to create them here](https://docs.databricks.com/en/dev-tools/auth/index.html#common-tasks-for-databricks-authentication).
Click **Next** when you're done.
3. You can find a list of your tables under *Select Table*. To begin column mapping, click the table you want.
4. In the list of required fields under *Column Mapping*, enter the column names in the appropriate fields to match columns to required fields. To add more fields, click **+ Add field**.
5. In the *Data Selection* tab, select the `profiles` data type.
6. When you're done, click **Test Mapping** to verify your mapping information. Then click **Next**.
7. Name the source and set the frequency at which Amplitude refreshes your profiles from the data warehouse. The default frequency is 12 hours, but you can change it.
## Set up a profile (S3 users)
To set up a profile in Amplitude:
1. In Amplitude, navigate to *Data > Sources* and click **+ Add Source**. Find and click Amazon S3.
2. Connect Amplitude to your S3 bucket. For more information about granting Amplitude access to your S3 bucket, refer to [Amazon S3](https://amplitude.com/docs/data/source-catalog/amazon-s3#limits). Additionally, have the following information ready for the *Verify Instrumentation* tab:
* Bucket Name and Prefix where your profiles are stored.
* AWS Role ARN, AWS External ID, and AWS Region.
Click **Test Credentials** to confirm Amplitude can access your S3 bucket, then click **Next** and name your source.
3. In the *Select File* tab, select the file type and click **See Preview** to confirm the files to import, then click **Next**.
4. On the *Configure Converter* tab, select the *Profiles* data type. Complete source fields for `user_id` and `mutation_type`, and add additional properties if needed. The *Data Preview* section shows an example of what Amplitude is set to ingest.
* `mutation_type` must be exactly one of the following strings, or Amplitude won't ingest the profile:
* `INSERT` when creating new files.
* `UPDATE` when syncing new values.
* `DELETE` to remove profiles.
5. When you're done, click **Save and Enable** to enable the import and refresh of profiles.
## Data specifications
| Field | Description | Example |
| -------------------- | ------------------------------------------------------------------------------------------------------------------------ | ------- |
| `user_id` | Identifier for the user. Must have a minimum length of 5. |
| `Profile Property 1` | Profile property set at the user level. The value of this field is the value from the customer's source since last sync. |
| `Profile Property 2` | Profile property set at the user level. The value of this field is the value from the customer's source since last sync. |
Example:
```json
{
"user_id": 12345,
"number of purchases": 10,
"title": "Data Engineer"
}
```
Refer to [this article for information on Snowflake profiles](https://amplitude.com/docs/data/source-catalog/snowflake#select-the-data-type).
## SQL template
```sql
SELECT
AS "user_id",
AS "profile_property_1",
AS "profile_property_2"
FROM DATABASE_NAME.SCHEMA_NAME.TABLE_OR_VIEW_NAME
```
## Clear a profile value
When you remove profile values in your data warehouse, those values sync to Amplitude during the next sync operation. You can also use Amplitude Data to remove unused property fields from users in Amplitude.
## Sample queries
```sql
SELECT
user_id as "user_id",
upgrade_propensity_score as "Upgrade Propensity Score",
user_model_version as "User Model Version"
FROM
ml_models.prod_propensity_scoring
```
```sql
SELECT
m.uid as "user_id",
m.title as "Title",
m.seniority as "Seniority",
m.dma as "DMA"
FROM
prod_users.demo_data m
```
================================================================================
# Amplitude Wordpress plugin
URL: https://amplitude.com/docs/data/amplitude-wordpress-plugin
================================================================================
# Amplitude Wordpress plugin
The [Amplitude Wordpress Plugin](https://wordpress.org/plugins/amplitude/) instruments your Wordpress site with an advanced version of Autocapture.
The Amplitude Wordpress plugin installs a version of the [Browser SDK](https://amplitude.com/docs/sdks/analytics/browser/browser-sdk-2) and adds the script before the `</head>` tag on each of your site's pages. The plugin enables an [advanced](https://github.com/amplitude/Amplitude-TypeScript/tree/v1.x/packages/plugin-default-event-tracking-advanced-browser) version of Autocapture that tracks the following events and associated properties:
- Page viewed.
- Form started.
- Form submitted.
- File downloaded.
- Start session.
- End session.
- Element clicked (new in advanced DET).
- Element changed (new in advanced DET).
If you enable Session Replay in the plugin's settings, the plugin also initializes and adds the [Session Replay Browser SDK Plugin](https://amplitude.com/docs/sdks/session-replay/session-replay-plugin).
## Install the plugin
Follow these instructions to install the Amplitude Wordpress plugin.
1. Log in to Wordpress and open your site's dashboard.
2. Click **Plugins** in the sidebar.
3. Click **Add New Plugin**.
4. Search for `Amplitude`.
5. Click **Install Now** on the Amplitude plugin.
6. When installation completes, click **Activate Plugin**.
## Configure the plugin
With the Amplitude Wordpress plugin settings page open:
1. Enter your Amplitude project's [API key](https://amplitude.com/docs/apis/authentication).
2. (Optional) Enable Session Replay and set the [Sample Rate](https://amplitude.com/docs/sdks/session-replay/session-replay-plugin#sampling-rate) with the slider.
3. Click **Save**.
After you enable the plugin, confirm in Amplitude that your project receives data from the plugin.
## Session Replay
If you enable Session Replay in the plugin, replays may not appear in Amplitude. This can happen for a few reasons:
- Users must complete their interaction with the site, which happens when they close the browser or leave the site. Wait at least five minutes after a session ends before attempting to view the replay in Amplitude. You may need to refresh the Amplitude page you're on.
- The sample rate you select determines the percentage of sessions that Session Replay captures. If you set the sample rate below `1`, Amplitude may not capture the specific session in question.
- You don't have Session Replay enabled on your account.
## Autocapture
The Wordpress plugin installs a version of the Browser SDK that enables a version of Autocapture that tracks two extra events:
- `[Amplitude] Element Clicked`.
- `[Amplitude] Element Changed`.
These are high-volume events with a high degree of cardinality in the property values. However, Amplitude limits the "noise" to these two events and a specific set of properties, limiting the impact on your taxonomy.
This approach differs from auto track or auto capture because it targets two specific interactions and a small set of elements to limit the impact of any noise in your data.
### Impact on event volume
Autocapture impacts event volume because it adds new tracking, which results in more captured events. The amount of this increase depends on your organization. If you start with few precisely tracked events, expect a large increase in event volume. If your organization has an extensive tracking plan with many precisely tracked events, the impact is lower.
For help or support with this plugin, contact [plugins@amplitude.com](mailto:plugins@amplitude.com).
================================================================================
# Amplitude Shopify Plugin
URL: https://amplitude.com/docs/data/amplitude-shopify-plugin
================================================================================
# Amplitude Shopify Plugin
[Shopify](https://www.shopify.com/) is a commerce platform that lets businesses of any size create, customize, and manage online stores. Shopify offers tools for product listings, payments, shipping, and customer engagement, streamlining the selling process online, across social media, and in person.
The [Amplitude Shopify Plugin](https://apps.shopify.com/amplitude) brings data from your Shopify store into Amplitude, unlocking insights from funnel analytics, user behavior trends and charts, ROI analysis, Session Replay, and more.
## How the Shopify plugin works
The Shopify plugin installs a version of the [Amplitude Browser SDK](https://amplitude.com/docs/sdks/analytics/browser/browser-sdk-2) and adds the script before the `</head>` tag of your site's pages. The script includes [Session Replay](https://amplitude.com/docs/session-replay) and [Web Experiment](https://amplitude.com/docs/web-experiment/set-up-a-web-experiment).
{% callout type="note" heading="Guides and Surveys" %}
The Shopify plugin doesn't include [Guides and Surveys](https://amplitude.com/docs/guides-and-surveys). To use Guides and Surveys on your Shopify store, install the [Guides and Surveys Web SDK](https://amplitude.com/docs/guides-and-surveys/sdk) separately.
{% /callout %}
{% callout type="warning" heading="Shopify and flickering" %}
The method Shopify uses to load Amplitude's Shopify app causes flickering. To avoid this, add the [asynchronous web script with the anti-flicker snippet](https://amplitude.com/docs/web-experiment/implementation#async-script-with-anti-flicker-snippet) to your `theme.liquid` file.
{% /callout %}
The Shopify plugin captures Amplitude's default events, including [marketing attribution](https://amplitude.com/docs/sdks/analytics/browser/browser-sdk-2#track-marketing-attribution) and Shopify's standard [events](https://shopify.dev/docs/api/web-pixels-api/standard-events).
{% accordion title="Shopify plugin events and event properties" %}
| Event | Source | Properties |
| -------------------------------- | --------- | ------------------------------------------------------------------------------------------------------------------------------------------------------------------------------------------------------------------------------------------------------------------------- |
| Page viewed | Amplitude | Page counter, Page domain, Page location, Page path, Page title, Page URL, Session Replay ID (if enabled), Referrer, [Attribution](https://amplitude.com/docs/sdks/analytics/browser/browser-sdk-2#track-marketing-attribution), [User properties](https://amplitude.com/docs/sdks/analytics/browser/browser-sdk-2#user-properties). |
| Start session | Amplitude | Session Replay ID (if enabled), [User properties](https://amplitude.com/docs/sdks/analytics/browser/browser-sdk-2#user-properties). |
| End session | Amplitude | [User properties](https://amplitude.com/docs/sdks/analytics/browser/browser-sdk-2#user-properties). |
| Form started | Amplitude | Form destination, Session Replay ID (if enabled), [User properties](https://amplitude.com/docs/sdks/analytics/browser/browser-sdk-2#user-properties). |
| Form submitted | Amplitude | Form destination, Session Replay ID (if enabled), [User properties](https://amplitude.com/docs/sdks/analytics/browser/browser-sdk-2#user-properties). |
| File downloaded | Amplitude | File extension, File name, Link text, Link URL, Session Replay ID (if enabled), |
| Element clicked | Amplitude | Element Aria Label, Element Class, Element Hierarchy, Element href, Element ID, Element Parent Label, Element Position Left, Element Position Top, Element Selector, Element Tag, Element Text, Page Title, Page URL, Session Replay ID, Viewport Height, Viewport Width. |
| Element changed | Amplitude | Element Class, Element Hierarchy, Element ID, Element Parent Label, Element Position Left, Element Position Top, Element Tag, Page Title, Page URL, Session Replay ID, Viewport Height, Viewport Width. |
| Collection viewed | Shopify | Collection title |
| Product viewed | Shopify | Quantity, SKU, Price, Currency Code, Type, Variant Title, Title, Vendor, Products |
| Product added to cart | Shopify | Quantity, SKU, Price, Currency Code, Type, Variant Title, Title, Vendor, Products |
| Product removed from cart | Shopify | Quantity, SKU, Price, Currency Code, Type, Variant Title, Title, Vendor, Products |
| Checkout started | Shopify | Discounted amount, Total price, Currency code, Products |
| Checkout contact info submitted | Shopify | -- |
| Checkout address info submitted | Shopify | -- |
| Checkout shipping info submitted | Shopify | -- |
| Checkout completed | Shopify | Total tax, Discount amount, Subtotal price, Currency code, Customer id, Products |
| Order created | Shopify | Customer, Products |
| Search submitted | Shopify | Search query |
{% /accordion %}
In most scenarios, when a customer completes the checkout flow, Shopify sends the Checkout complete event, then the Order created event. If you create an order manually from your store's Admin page, only the Order created event sends. The Checkout complete event is specific to a customer completing the checkout flow.
Amplitude sets User ID using the email address or phone number the customer enters in the Contact section of the checkout.
{% callout type="note" heading="Shopify checkout page" %}
Shopify prevents third-party packages from loading on your store's checkout page. As a result, Amplitude doesn't receive events from the checkout page, and you can't run experiments on it.
{% /callout %}
### Performance impact
The packages that Amplitude adds to your Shopify pages weigh approximately 167kb. Internal testing showed Lighthouse performance reports averaging 98 without the plugin and 96 with the plugin.
## Install the plugin
The method you use to install the Shopify plugin depends on whether you have an existing Amplitude organization.
### Install without an existing Amplitude organization
1. Find the [Amplitude Shopify plugin](https://apps.shopify.com/amplitude) in the Shopify App Store.
2. Click **Install** and confirm access to add it to your Shopify store.
3. Navigate to the [Amplitude Get Started page](https://analytics.amplitude.com/login?utm_source=shopify_app) and click to create your Amplitude account. Complete the form, agree to terms, and click **Continue**.
{% callout type="note" heading="Data Storage Location" %}
Amplitude provides data storage in the US and EU. Choose the appropriate option based on your location.
{% /callout %}
4. After you create your account, on the Amplitude setup page, click **Shopify** in the *Other ways to install* section.
5. In the modal, copy your Amplitude project's API key.
6. Return to the Amplitude Settings screen in Shopify, enter the API key, and click **Connect**.
### Install into an existing Amplitude organization
1. Log in to Amplitude and navigate to your organization's settings.
2. Select the project within your organization that you want to connect to Shopify.
3. Find the project's API key and copy it.
4. Return to the Amplitude Settings screen in Shopify, enter the API key, and click **Connect**.
### Configure Session Replay sample rates
1. Log in to Amplitude as a manager and navigate to your organization's settings.
2. Click **Session Replay & Heatmaps** in the sidebar.
3. Select the project that matches the API key you used to install the Shopify app.
4. Input the sample rate you want under the Sampling section.
5. Save the settings.
================================================================================
# Converter configuration reference
URL: https://amplitude.com/docs/data/converter-configuration-reference
================================================================================
# Converter configuration reference
This reference covers examples and operators for the Amazon S3 Import and Google Cloud Storage (GCS) converter configuration. Read the [S3 guide](https://amplitude.com/docs/data/source-catalog/amazon-s3) or the [GCS guide](https://amplitude.com/docs/data/source-catalog/google-cloud-storage) for more information.
## skip_user_properties_sync
Because many cloud storage source imports are batch uploads of historical data, syncing the latest user properties for historical events might not make sense. For this reason, Amplitude sets `$skip_user_properties_sync` to `true` by default. To include user properties with your events, set it to `false` in the converter.
For more information about `$skip_user_properties_sync`, refer to the [Data Backfill Guide](https://amplitude.com/docs/data/data-backfill).
## ignoreEventFlag
Use `ignoreEventFlag` to selectively skip events from ingestion based on a computed boolean condition. Set `ignoreEventFlag` to a field name (for example, `"$ignore"`), then define that field in `convertToAmplitudeFunc` using any DataLang boolean expression. When the field evaluates to `true` for a given event, Amplitude skips the event without counting it as an error. When it evaluates to `false` or is absent, Amplitude ingests the event normally.
This option is useful when your source data contains events you want to filter, such as internal test events, bot traffic, or specific event types, without preprocessing the files upstream.
### Example: filter out specific event types
The following example skips any event where `event_type` is `page_view` or `session_start`:
```json
{
"converterConfig": {
"ignoreEventFlag": "$ignore",
"convertToAmplitudeFunc": {
"event_type": "event_type",
"user_id": "user_id",
"$ignore": ["or",
["equals", ["path", "event_type"], ["value", "page_view"]],
["equals", ["path", "event_type"], ["value", "session_start"]]
]
}
}
}
```
In this example:
- `"ignoreEventFlag": "$ignore"` tells Amplitude to look for a field named `$ignore` in the converted event.
- `"$ignore"` in `convertToAmplitudeFunc` defines a boolean expression using the [`or`](#boolean-operators) and [`equals`](#boolean-operators) operators.
- If `event_type` is `page_view` or `session_start`, `$ignore` evaluates to `true` and Amplitude skips the event.
- Amplitude ingests all other events normally.
You can use any [boolean operator](#boolean-operators) or combination of operators to build the condition.
## convertToAmplitudeFunc
Conversion rules in `convertToAmplitudeFunc` instruct the ingestion service on how to construct events in Amplitude.
### Example converter with `convertToAmplitudeFunc`
```json
{
"config_name": ["Event sample converter"],
"converterConfig": {
"fileType": "parquet",
"compressionType": "none",
"convertToAmplitudeFunc": {
"event_type": "action",
"user_id": "user",
"device_id": "device",
"event_properties": {
"business_id_encid": "business_id"
},
"user_properties": {
"utm_channel_category": "utm_channel_c",
"utm_channel_source": "utm_channel_s"
},
"time": "epoch",
"session_id": "session_id",
"app_version": "app_version"
}
},
"keyValidatorConfig": {
"filterPattern": "folder1/folder2/ds=202011[1-2][0-9]/.*\\.parquet"
}
}
```
### Example constructed event
```json
{
"event_type": "watch tv",
"user_id": "john",
"device_id": "host1",
"event_properties": {
"business_id_encid": "123"
},
"user_properties": {
"utm_channel_category": "discovery",
"utm_channel_source": "network"
},
"time": "1645066434189",
"session_id": "1",
"app_version": "1"
}
```
Values in the event come from the fields specified by `convertToAmplitudeFunc`. For example, the value `watch tv` in field `event_type` comes from field "action" in ingested data files. Because the `event_type` value isn't `["value":"$identify"]` or `["value":"$groupidentify"]`, Amplitude ingests events the same way it ingests events with the HTTP V2 API.
## Operators
### List operators
#### Use list operators
If the source description is a list, the first item in the list must be a string specifying the function. The rest of the list are the parameters to the function. The "|" character separates non-repeating and repeating arguments. Any arguments after "|" are repeatable, and you can specify them any number of times. The entire list of arguments must be present in any multiple-argument operator (you can't specify just one of three arguments, you must include all three).
| Operator | Description | Syntax |
| -------------------- | ---------------------------------------------------------------------------------------------------------------------------------------------------------------------------------------------------------------------------------------------------------------------------------------------------------------------------------------------------------- | ------------------------------------------------------------------------------------------------------ |
| `path` | Evaluates each SourceDescription sequentially on the returned JsonElement. Equivalent to evaluating a specific path when chaining BasicPaths. This also works with indexing into an array, for example `["path", "foo", "1"]` chooses the element at index 1 (second element) in the array at "foo".**The index must be provided as a string.** | `["path",\| SOURCE_DESCRIPTION...]` **Example**: `["path", "foo", "bar"] => obj['foo']['bar'].` |
| `any` | Returns the first value returned by SOURCE_DESCRIPTION in the list. | `["any", SOURCE_DESCRIPTION, \| SOURCE_DESCRIPTION...] ` |
| `value` | Escapes a single JSON value so you can create a static value. | **Example**: `["value", "amplitude-vacuum"...` |
| `dict` | Creates a dictionary (object) where the raw_strings are keys and values are the evaluated SOURCE_DESCRIPTIONS. | `["dict", "raw_string", SOURCE_DESCRIPTION, \|"raw_string", SOURCE_DESCRIPTION...]` |
| `array` | Returns an array, where elements are the values returned by evaluating SOURCE_DESCRIPTIONS. If a SOURCE_DESCRIPTION fails to evaluate, it will be skipped | `["array", SOURCE_DESCRIPTION, \SOURCE_DESCRIPTION...] ` |
| `condition` | Determines the first true BooleanCondition and returns the result of the following SOURCE_DESCRIPTION. Throws a NoValueFoundAtSource exception if nothing evaluates to true. | `["condition"\| "cond", BOOLEAN_SOURCE, SOURCE_DESCRIPTION, \| BOOLEAN_SOURCE, SOURCE_DESCRIPTION...]` |
| `ifelse` | If the BOOLEAN_SOURCE evaluates to true, returns the first SOURCE_DESCRIPTION. Otherwise returns the second SOURCE_DESCRIPTION. | `["ifelse", BOOLEAN_SOURCE, SOURCE_DESCRIPTION, SOURCE_DESCRIPTION]` |
| `sample_md5` | Evaluates the given sampleKey (second arg) with the samplePercent (first arg) to determine whether it should be in the sample. Returns boolean | `["sample_md5", SOURCE_DESCRIPTION, SOURCE_DESCRIPTION] ` |
| `iso_time_to_ms` | Assumes the string returned by SOURCE_DESCRIPTION is an ISO datetime string, for example, `YYYY-MM-DDTHH:MM:SS`, and converts to milliseconds since epoch | `["iso_time_to_ms", SOURCE_DESCRIPTION] ` |
| `ms_to_iso_time` | Assumes the string returned by SOURCE_DESCRIPTION is milliseconds since epoch and converts to ISO datetime string, for example, `YYYY-MM-DDTHH:MM:SS ` | `["ms_to_iso_time", SOURCE_DESCRIPTION]` |
| `iso_time_now` | Generates an ISO datetime string for right now | `["iso_time_now"]` |
| `ms_time_now` | Generates the milliseconds since epoch for right now | `["ms_time_now"]` |
| `int96_time_to_ms` | Assumes the string returned by SOURCE_DESCRIPTION is a base64-encoded INT96, for example, `AP6qCz41AAAwhCUA`, and converts to milliseconds since epoch | `["int96_time_to_ms", SOURCE_DESCRIPTION]` |
| `parse_time_to_ms` | Takes in a RAW_STRING time format, for example, `M/d/yyyy H:mm:ss`, and a `SOURCE_DESCRIPTION` that returns a string in that format, for example, '1/1/2021 5:06:07', and converts to milliseconds since epoch | `["parse_time_to_ms", RAW_STRING, SOURCE_DESCRIPTION]` |
| `parse_json_element` | Assumes the value returned by SOURCE_DESCRIPTION is a string json blob and returns the parsed json value | `["parse_json_element"\| "parse_json_object", SOURCE_DESCRIPTION] ` |
| `merge_dicts` | Merges the json objects that each SOURCE_DESCRIPTION evaluates to | `["merge_dicts", SOURCE_DESCRIPTION, \| SOURCE_DESCRIPTION...] ` |
| `flatten_dict` | Flattens a nested json object into a single layer json object | `["flatten_dict", "raw_string", INTEGER_SOURCE, SOURCE_DESCRIPTION]` |
| `exclude_keys` | Evaluates the specified SourceDescription the returned JsonElement without the requested fields | `["exclude_keys", SOURCE_DESCRIPTION, \| "raw_string"...] ` |
| `concat` | Treats the results of each SOURCE_DESCRIPTION as a string and returns the concatenated string | `["concat", SOURCE_DESCRIPTION, \| SOURCE_DESCRIPTION...] ` |
| `replace_with` | Replace all old_string within the value returned by SOURCE_DESCRIPTION with new_string. Returns a string or raises a NoValueException if SOURCE_DESCRIPTION can't be evaluated to a string. The old_string supports Java's regex syntax for matching patterns, more details at https://docs.oracle.com/javase/7/docs/api/java/util/regex/Pattern.html | `["replace_with", "old_string", "new_string", SOURCE_DESCRIPTION]` |
| `split` | Splits the value returned by SOURCE_DESCRIPTION by the specified character sequence. Returns a jsonArray or raises a NoValueException if SOURCE_DESCRIPTION can't be evaluated to a string | `["split", "raw_string", SOURCE_DESCRIPTION] ` |
| `lowercase` | Returns the lowercase string | `["lowercase"\| "lower", SOURCE_DESCRIPTION] ` |
| `typeof` | Returns type of the source description as a string: 'string', 'list', 'dict', 'bool', 'number', 'null' | `["typeof", SOURCE_DESCRIPTION] ` |
### Boolean operators
These operators return a JsonPrimitive of type Boolean, so they're valid to use with `cond` and `ifelse`.
| Operator | Description | Source |
| ------------ | ----------------------------------------------------------------------------------------------------------------------------------------- | -------------------------------------------------------------- |
| `bool` | Evaluates as a static boolean value. Throws an exception during initialization if RAW_JSON isn't a boolean value. | `["bool", any_json] ` |
| `not` | Return whether both arguments are true. Null values are treated as false, string 'true' or 'false' is cast to a boolean. | `["not"\|"!", SOURCE_DESCRIPTION] ` |
| `and` | Return whether all arguments are true. Null values are treated as false, string 'true' or 'false' is cast to a boolean. | `["and"\|"&&", SOURCE_DESCRIPTION, \| SOURCE_DESCRIPTION...]` |
| `or` | Return whether at least one argument is true. Null values are treated as false, string 'true' or 'false' is cast to a boolean. | `["or"\|"\|\|", SOURCE_DESCRIPTION, \| SOURCE_DESCRIPTION...]` |
| `equals` | Evaluates to `true` if and only if the two args are equal. | `["equals"\|"eq"\|"=", SOURCE_DESCRIPTION, SOURCE_DESCRIPTION]` |
| `contains` | True if the evaluated SourceDescription (second arg) contains the given raw string. If the SourceDescription is null, evaluates to false. | `["contains"\|"is_substring", "raw_string", SOURCE_DESCRIPTION]` |
### Integer and float operators
The following Operators return a JsonPrimitive of type Integer, barring the `add` Operator which returns JsonPrimitive of type Float.
| Operator | Description | Syntax |
| ------------ | ------------------------------------------------------------------------------------------------------------------------------------ | ---------------------------------------------------------------- |
| `int` | Evaluates as a static int value. Throws an exception during initialization if RAW_JSON is not an int value. | `["int", RAW_JSON]` |
| `round` | Round the argument to the nearest integer. Amplitude attempts to convert strings to integers and treats null values as zero. | `["round", SOURCE_DESCRIPTION] ` |
| `add` | Return the sum of the arguments as an integer. Amplitude attempts to convert strings to integers and treats null values as zero. | `["add"\|"+", SOURCE_DESCRIPTION, \| SOURCE_DESCRIPTION...]` |
| `subtract` | Subtracts the second argument from the first one. Amplitude attempts to convert strings to integers and treats null values as zero. | `["subtract"\|"-", SOURCE_DESCRIPTION, SOURCE_DESCRIPTION]` |
| `multiply` | Return the product of the arguments as an integer. Amplitude attempts to convert strings to integers and treats null values as zero. | `["multiply"\|"*", SOURCE_DESCRIPTION, \| SOURCE_DESCRIPTION...]` |
| `divide` | Divides the first argument by the second one. Amplitude attempts to convert strings to integers and treats null values as zero. | `["divide"\|"/", SOURCE_DESCRIPTION, SOURCE_DESCRIPTION]` |
### JSON operator
| Operator | Description | Syntax |
| ------------ | -------------------------------------------------------------------------- | ----------------------------------------------------------------------------------------------------------------------------------------------------------------------------------------- |
| N/A | As syntactic sugar, Amplitude converts an object to a "dict" LIST_OPERATOR | *The following two descriptions are equivalent: `{"key1": SOURCE_DESCRIPTION,"key2", SOURCE_DESCRIPTION,…}` `["dict","key1", SOURCE_DESCRIPTION,"key2", SOURCE_DESCRIPTION,...]` |
### User property operations
The converter supports the same user property operators as the Identify API. Refer to [the Identify documentation](https://amplitude.com/docs/apis/analytics/identify#userproperties-supported-operations) for details.
================================================================================
# Track sessions
URL: https://amplitude.com/docs/data/sources/instrument-track-sessions
================================================================================
# Track sessions
A session is a continuous span when a user has your app in the foreground or your website open. Amplitude groups events into sessions by session ID, derives Start Session and End Session events, and exposes session counts and durations to the [User Sessions chart](https://amplitude.com/docs/data/user-properties-and-events).
Use the default session tracking when you want Amplitude SDKs to manage session boundaries automatically. If you need session boundaries tied to specific events or a different timeout, configure a custom session definition instead.
## How Amplitude defines sessions
Session behavior differs between mobile and browser applications:
- For **mobile**, a session begins when the app moves into the foreground. A mobile session ends when the app goes into the background and sends no events for at least five minutes. Events sent within five minutes of each other count toward the current session. You can define a custom session expiration time with `setMinTimeBetweenSessionsMillis(timeout)`, where `timeout` is in milliseconds.
- On a **browser**, a session begins when the website loads and the SDK initializes. A browser session ends when the last event occurs. Web sessions time out after 30 minutes by default. Events sent within 30 minutes of each other count toward the same session. You can customize the browser timeout window with the [Browser SDK configuration options](https://amplitude.com/docs/sdks/analytics/browser/browser-sdk-2).
Amplitude automatically generates a session ID for each new session. The session ID is the session's start time in milliseconds since **epoch** (also known as the [Unix timestamp](https://en.wikipedia.org/wiki/Unix_time)). All events within the same session share the same session ID. Amplitude SDKs manage session IDs automatically. If you send data to Amplitude through the HTTP API, explicitly set the [session ID](https://amplitude.com/docs/apis/analytics/http-v2) field to track sessions.
### How Amplitude counts sessions
To count sessions, Amplitude filters for events marked as "active," applies the project's session definition, groups the filtered events into sessions, and counts the grouped sessions.
For more information about setting a project's session definition, review [Manage Organizations and Projects](https://amplitude.com/docs/admin/account-management/manage-orgs-projects#view-and-edit-your-project-information).
## How Amplitude groups events into sessions
By default, Amplitude uses session ID as the session property. Amplitude groups all events with the same session ID and the same user ID into the same session. The session ID doesn't need to be unique across multiple users. You can change the property you use to group sessions.
Amplitude SDKs automatically generate and manage session IDs for events. For events sent through the [HTTP API](https://amplitude.com/docs/apis/analytics/http-v2), Amplitude defaults to a session ID of `-1`. A session ID of `-1` excludes the event from all session metrics.
{% callout type="note" %}
A session ID of `-1` commonly occurs when data comes to Amplitude from Segment through a cloud-mode connection. As with data sent through the HTTP API, you need to explicitly set a session ID to track sessions.
{% /callout %}
In a user's event stream, a blue line connects events in the same session.
Amplitude assigns a session to a specific date based on its actual start time. The start time must fall within a chart's selected date range for Amplitude to include the session on that chart.
For example, a session begins on May 17 at 8:00 PM and ends on May 18 at 1:30 AM. The session appears on charts where the selected date range includes May 17, the date when the session began. The date range for the example session can start on or before May 17 and end on or after May 17. If the chart's date range starts on May 18, the session doesn't appear on the chart, even though the session was still active on May 18.
### Start Session and End Session events
By default, Amplitude derives `Start Session` and `End Session` events from each session's session ID. Amplitude also uses session ID to calculate session lengths. If you use session IDs, Amplitude doesn't add extra events to your monthly event volume limit.
If you need `Start Session` and `End Session` events for analysis beyond session lengths, enable `Start Session` and `End Session` event tracking by adding the following code before initializing the SDK:
For Android:
```java
Amplitude amplitude = new Amplitude(new Configuration(apiKey = AMPLITUDE_API_KEY, context = applicationContext, trackingSessionEvents = true, ));
```
For iOS:
```objc
[Amplitude instance].trackingSessionEvents = YES;
```
For Browser:
```js
amplitude.init(API_KEY, OPTIONAL_USER_ID, {
defaultTracking: {
sessions: true,
},
});
```
### Start Session and End Session limitations
- Session event tracking applies only to Amplitude's [Android](https://amplitude.com/docs/sdks/analytics/android/android-kotlin-sdk), [iOS](https://amplitude.com/docs/sdks/analytics/ios/ios-swift-sdk), and [Browser](https://amplitude.com/docs/sdks/analytics/browser/browser-sdk-2) SDKs.
- `Start Session` and `End Session` events count toward your monthly [event volume limit](https://amplitude.com/docs/faq/limits-and-quotas).
- Amplitude sends the `End Session` event at the start of the user's next session.
- By default, you can't add extra event properties to automatically generated `Start Session` and `End Session` events. To send event properties for session start and end events, you have two options:
- Implement your own custom `Open App` and `Close App` events.
- Use an [Enrichment Plugin](https://amplitude.com/docs/sdks/sdk-plugins#enrichment-plugins) to add properties to the generated session events. Enrichment plugins let you modify properties in Event objects.
### Out-of-session events
You can log events outside a session by setting the session ID to `-1`. Out-of-session events aren't part of the current session and don't extend the current session. Out-of-session events are useful for events triggered by push notifications.
Out-of-session events are usually server-side events received by Amplitude. For more information, refer to the [HTTP API](https://amplitude.com/docs/apis/analytics/http-v2) documentation. Out-of-session events appear in a user's event stream as disconnected green squares.
### Configure a custom session definition
By default, Amplitude sorts events into sessions by session ID. You can define sessions without adding instrumentation. A custom session definition can use a constant property, a custom timeout window, or beginning and ending events.
You need Admin or Manager privileges to edit session definitions.
{% callout type="note" %}
Custom session definitions are only available in the User Sessions and Pathfinder charts and user timelines. Sessions only include **active** events.
{% /callout %}
To configure a custom session definition:
1. From the left sidebar, navigate to _Settings > Projects_.
2. Select the project you want to work with.
3. Select **Session Definitions**. The _Session Definitions_ modal appears.
4. Select **Custom Session Definition**.
5. Configure one or more conditions:
- **Session property**: Select _Select property..._ and choose the event or user property for grouping sessions.
- **Starting Event and Ending Event**: Select **Starting Event** or **Ending Event** and choose the events that mark the beginning and end of a session. The ending event ends a session if the ending event occurs before the timeout interval elapses.
- **Session timeout**: Enter the default timeout interval in minutes. Amplitude counts events from the same user that occur within the specified timeout interval as part of one session. Amplitude recommends a default of 30 minutes.
6. Enter the confirmation phrase and select **Save**.
{% callout type="note" %}
Changing the session definition applies to all User Sessions, Funnel Analysis, and Journeys charts, and to the session metric in your project. Review the impact before you configure or change a custom session definition.
{% /callout %}
Amplitude combines conditions with **and** logic. A session must meet all configured conditions to count. If you don't configure any conditions, Amplitude uses session ID as the session-defining property.
To require all events in a session to come from the same source, use session property and timeout window together:
- Session property = `device ID`
- Session timeout = `30 min`
To define sessions based on in-app usage, use starting event and timeout window:
- Start event = `app open`
- Session timeout = `5 min`
================================================================================
# Destination catalog
URL: https://amplitude.com/docs/data/destination-catalog
Updated: 2024-08-14
================================================================================
# Destination catalog
{% catalog-grid type="destination" / %}
================================================================================
# Connect to a Destination
URL: https://amplitude.com/docs/data/destinations
================================================================================
# Connect to a Destination
Amplitude Data makes it easy to set up third-party platforms as data export destinations. You can share data generated in Amplitude with other tools and stakeholders in a variety of contexts.
## Add a destination
To add a new data destination, follow these steps:
1. From Amplitude Data, open the **Destinations** tab in the Connections section.
2. Click **Add Destination**.
3. Look for the tile or search for the name of the destination you want to add and click to select it.
4. Enter the requested information into the pop-up modal. The specific information required varies from destination to destination.
5. Click **Save**.
## Destination notifications
Notifications alert you when you have an issue with your destination. By default, new destinations notify the creator and your Admins.
### Edit your notifications
1. Click **Destinations**.
2. Find the destination you want to configure notifications for, then click to select it.
3. Hover over the **Notifications Button** with an email icon on it. Click the **Manage Notifications** button when it appears.
4. From the Manage Notifications settings, you can **Subscribe** or **Unsubscribe** yourself. You can also manage notifications to add or remove other email addresses.
### Add notifications to Slack
1. Follow [this guide](https://slack.com/help/articles/206819278-Send-emails-to-Slack#h_01F4WDZG8RTCTNAMR4KJ7D419V) to set up an email for your Slack channel or DM.
2. After your Slack/email integration is complete, edit your [notifications](#edit-your-notifications) to add that email to your destination's notifications.
================================================================================
# Destination event streaming overview
URL: https://amplitude.com/docs/data/destination-event-streaming-overview
================================================================================
# Destination event streaming overview
Event streaming sends your Amplitude event data in real time to downstream marketing, sales, and infrastructure tools, with filtering to control what each destination receives and monitoring to track delivery. Use this behavioral data to enhance customer profiles in those tools.
With event streaming, you get configuration-based tools that offer precise control over the data you send. Filter data by user, group, and event properties to send only relevant information to your downstream tools. You can also monitor key metrics like event volume, latency, and detailed delivery status to assess the performance and reliability of your streaming integration.
## Warehouse and batch event streaming
Amplitude streams events from both real-time and warehouse or batch sources to your configured destinations.
Events imported from your data warehouse or batch sources (such as warehouse imports, Cargo syncs, or file-based ingestion) are eligible for outbound event streaming. After Amplitude ingests these events, Amplitude streams them to your configured destinations alongside real-time events.
For your destination, you can expect:
- **Complete event coverage**: Your downstream systems receive events from all sources, not just real-time ingestion.
- **No additional configuration**: Warehouse and batch events stream to your existing destinations automatically.
- **Same delivery guarantees**: Warehouse and batch events follow the same retry and latency targets as real-time events.
## Debug event streaming with Live Log
Live Log gives you a real-time, sampled view of events as Amplitude processes them for an Event Streaming sync. Use it to confirm the right events flow through a sync, inspect how Amplitude transforms payloads, and review destination responses.
To open Live Log, follow these steps:
1. Navigate to _Data > Destinations_.
2. Select an Event Streaming sync.
3. Select the **Live Log** tab.
For each event, Live Log shows three stages side by side:
- **Input**: The raw Amplitude event.
- **Dispatched**: The transformed payload Amplitude sends to the destination.
- **Response**: The status code and body the destination returns.
Use the stream controls to pause or resume the feed, clear loaded events, and filter by status (**All**, **Success**, **Destination errors**, or **Processing errors**). Search across loaded events, or filter the stream to events where a specific field in the **Input**, **Dispatched**, or **Response** stage matches a value.
Live Log provides a sampled, real-time view for debugging. Amplitude doesn't store Live Log data, so you can't use it for historical analysis. For retry and delivery status monitoring, use the **Debugger** tab on the same sync.
## Considerations
- **Billing efficiency:** Amplitude tracks event volume based on distinct events sent. If you send the same event to multiple event streaming destinations, Amplitude counts it only once for billing. When you use all your contracted event volume for the billing period, Amplitude pauses all streams until the next billing cycle. Wait until the next billing cycle or upgrade your plan to restart streaming.
- **What counts toward Event Streaming Usage:** Only near real-time streaming destinations count toward your Event Streaming Usage. This includes destinations such as Amazon Kinesis Data Stream and Amazon Kinesis Firehose, even though Amplitude groups them under the **Warehouse Destination** section in the UI. Scheduled batch export destinations such as Amazon S3, Google Cloud Storage, Google BigQuery, Snowflake, and Amazon Redshift export data on a recurring schedule, so they don't count toward Event Streaming Usage.
- **Identify events count toward limits:** When you enable the **Send Users** option in your event streaming destination, Amplitude triggers an `Identify` event each time a selected user property changes. Amplitude sends these `Identify` events to your event streaming destinations, and they count toward your event streaming volume limit. Monitor your `Identify` event volume to avoid exceeding your contracted limits, especially if you have frequently updated user properties.
- **Latency target:** Amplitude aims for an end-to-end p95 latency of 60 seconds, monitored and supported by alerts.
- **Retry mechanism:** Amplitude addresses intermittent errors using in-memory retries with exponential backoff for initial sends. The retry pipeline attempts up to 10 times within a 4-hour window. This mechanism applies to all event streaming destinations.
- **Monitoring and management:** Use the **Live Log** tab on an Event Streaming sync to inspect events in real time as Amplitude processes them. The **Debugger** tab lets you monitor pending retries, progress, and expired payloads. Analyze failed payload samples to gain insight into error categories.
## Limitations
- **Format for user properties:** Amplitude sends all forwarded user properties as strings except for [Braze streaming](https://amplitude.com/docs/data/destination-catalog/braze) and [Iterable streaming](https://amplitude.com/docs/data/destination-catalog/iterable) destinations.
- **Reserved keywords:** You can't use specific keywords, including `_all` and `_identify`, as event names when streaming events from Amplitude.
- **Historical data:** Amplitude streams events ingested after you configure a destination. Amplitude doesn't retroactively send events ingested before you set up the streaming destination. Warehouse and batch events ingested after configuration stream alongside real-time events.
- **Unsupported Amplitude properties:** Ingestion and streaming pipelines handle some Amplitude properties differently. If so, streaming might not support them. Properties handled differently are `Version` and `Device Family`.
## FAQs
### What's the difference between cohort syncing and event streaming?
- **Cohort syncing:** Cohort syncing automatically maintains lists of user IDs based on specific criteria or behaviors. This feature transfers a list of user IDs from Amplitude to third-party tools like SFMC or Braze. Cohort syncing lets you explore behavioral targeting and analyze the impact of your targeting strategies in downstream destinations. Cohort syncing simplifies the management and updating of these lists, supporting actions based on user behavior without manual effort.
- **Event streaming:** Event streaming offers more than cohort syncing. Event streaming simplifies your data setup by letting you use a single Amplitude configuration to send data to various platforms, removing the need for constant technical adjustments. With event streaming, you have precise control, choosing which events, users, or properties to send to each platform so only important data reaches its destination. Event streaming also supports real-time conversion events, triggering actions in tools like Braze, Customer.io, or SFMC to optimize your targeting and improve the effectiveness of your initiatives.
### What are some examples of how customers use event streaming?
1. **Marco Polo:** Used event streaming to power a real-time 'Welcome' email campaign by streaming sign-up events from Amplitude to Braze.
2. **Invoice Simple:** Used event streaming for a robust engagement campaign, customizing messaging based on a series of events to improve engagement effectiveness.
### What happens if I don't see an event streaming destination on Amplitude Catalog?
1. **Webhook streaming:** You can use [Webhook Event streaming](https://amplitude.com/docs/data/destination-catalog/webhooks) integration to send your Amplitude events and user data to custom webhooks. This integration sends data to a URL of your choice for various use cases.
2. **Vendor switch:** Consider switching to a vendor already integrated with Amplitude, which offers similar functionalities. Find more information in the [Amplitude Catalog](https://amplitude.com/integrations).
3. **Self-build or vendor request:** You can build the integration yourself using the Amplitude Integration Portal, or request the vendor to create it through the integration portal. Learn more about the [Amplitude Integration Portal](https://amplitude.com/docs/partners/create-an-event-streaming-integration/).
### What's the IP range of your service?
Amplitude data centers use the following IP addresses, depending on their region:
- Amplitude US IP addresses
- 52.33.3.219
- 35.162.216.242
- 52.27.10.221
- Amplitude EU IP addresses
- 3.124.22.25
- 18.157.59.125
- 18.192.47.195
================================================================================
# Syncs
URL: https://amplitude.com/docs/data/destinations/syncs
================================================================================
# Syncs
Amplitude supports three types of syncs for cohorts, properties, computations, and predictions: **on-demand syncs**, **automated syncs**, and **real-time syncs**.
On-demand syncs are useful for audience testing and one-off campaigns. Automated syncs run on a daily or hourly schedule. As cohort audience membership or user predicted probabilities change, Amplitude automatically adjusts cohort membership in connected destinations. Real-time syncs update each minute and work best for interactive use cases that require rapid updates.
You don't need CSV downloads or manual syncs. When users take an action in your app, Amplitude automatically syncs them to the relevant ad, email, or testing platform.
## Feature availability
- Users on Free, Plus, Growth, and Enterprise plans can use **on-demand syncs**.
- Users on Growth, Enterprise, and Plus plans can use **automated syncs**.
- Users on Growth and Enterprise plans can use **real-time syncs**.
## Real-time syncs
With real-time syncs, Amplitude sends updates to a partner destination almost as soon as a user enters or exits a cohort. This unlocks additional uses for cohort sync, such as timely and contextual messaging to end users. When you create a real-time sync, Amplitude first sends the initial population to the destination. This can take several hours if the sync is large. After this initial sync, Amplitude sends updates every minute as users enter and exit the cohort.
Most destinations and cohorts support real-time cohort syncs. When partners fail or reject API requests, or when network delays and errors occur, Amplitude sends any changes once the issue clears.
Real-time sync doesn't support select destinations that aren't designed for frequent updates, such as ad destinations and S3, or destinations with strict integration limits that prevent frequent syncing.
Real-time sync doesn't support some complex or very large cohorts because of high computation cost. Real-time sync can send cohort membership to destinations, but not computations, properties, or predictions.
## Create a new sync
To create a new sync, follow these steps:
1. Click _+ New_ and click the _Sync_ tile. The _Create New Sync_ modal appears.
2. Select the sync type to create: cohort, recommendation, user property, or computation sync. Then click _Next_.
3. From the drop-down list, select the specific item you want to sync. Then click _Next_.
4. Choose the destination to sync to. If the destination doesn't appear, click _+ Add_ or _Manage Destinations_ and configure the destination there. Then click _Next_.
5. Choose whether to create an on-demand sync, recurring sync, or real-time sync. Recurring syncs run on an hourly or daily schedule, while real-time syncs update each minute.
Depending on your choice in step 4, you may also need to specify a customer account or API target to sync to.
6. Click _Sync_. Your sync is active.
## Email notifications
Amplitude automatically sends email alerts for cohort sync jobs:
- **Success notifications**: Receive confirmation when your cohort sync completes successfully.
- **Failure notifications**: Receive an alert when a sync job fails, so you can address issues quickly.
These notifications help you monitor cohort sync status without manually checking the platform.
## View sync details
After you create a sync, click the sync name in the _Syncs_ panel to view its details.
The _Details_ tab provides basic information about the sync. The example above is a cohort sync, so the _Details_ tab provides a definition of the cohort, as well as a chart detailing its population over time. The _Syncs_ tab shows each destination that receives this sync.
On the _Comparisons_ tab, you can view a head-to-head comparison between this synced cohort and another cohort of your choosing. You can break down the results of the User Composition chart by user property using the _Composition by_ drop-down.
To view a list of your synced cohorts from within Amplitude Analytics, click _Cohorts_ and open the _Synced Cohorts_ tab.
## Understanding cohort sync discrepancies
When syncing cohorts from Amplitude to a third-party destination, you may notice differences between the user numbers in Amplitude and on the partner's platform. Understanding why these differences occur and how to check which users transferred successfully can help you fix these issues.
Amplitude lets you choose any user properties to sync. This aids in customization, but it also requires careful planning to minimize discrepancies during a cohort sync.
Common reasons for differences in cohort syncs include:
- **Unresolved mapping**: If a user property isn't set, or is `NULL`, Amplitude can't sync the user attached to the property. For example, if you're syncing a cohort of 100 users to a platform using email as the `User_ID`, but only 50 users provided an email, only those 50 users sync. Check and fix your data at the source, update it in Amplitude, and then run another sync.
- **Invalid mapped properties**: Properties that don't conform to the expected format in third-party destinations can cause partial or failed syncs. For example, the downstream destination may not accept a particular identifier format, such as email or phone number.
{% callout type="note" %}
If a sync is partially successful, Amplitude still marks the entire cohort sync as successful, regardless of whether individual users are valid.
{% /callout %}
## Warning when updating cohort mapping
Amplitude issues a warning if you attempt to modify the Amplitude user property mapping, because modifying the mapping can affect active cohort syncs. Click _View Syncs_ to view the syncs that the change could affect. From there, decide if you want to turn off the sync.
Even if you **don't** receive a warning, be careful when modifying mapping properties. Mapping changes can cause unexpected changes in the number of users tracked.
For example, if you stop mapping by email addresses and switch to phone numbers, users previously synced with their emails don't receive updates. Your change **only affects new users**. Amplitude syncs new users based on phone numbers, while previously existing users still sync based on email addresses. Over time, this can lead to data discrepancies.
If your cohort sync process has been in place for some time and you're considering changing the mapping, create a new sync destination first. Then proceed with the sync using this new target.
## View sync history
The cohort sync history page provides a detailed breakdown of cohort syncs over the last 14 days. Each cohort sync provides a list of skipped, added, or removed users. To access the page, follow these steps:
1. Click the _Cohorts_ tab.
2. Choose the specific cohort of interest.
3. Click the _Syncs_ tab.
4. If the cohort sync includes multiple destinations, select the appropriate cohort destination.
5. Click the _History_ tab.
{% callout type="note" %}
The detailed cohort sync history page supports all cohort sync destinations except for [Amazon S3](https://amplitude.com/docs/data/destination-catalog/amazon-s3) and [TradeDesk](https://amplitude.com/docs/data/destination-catalog/thetradedesk). These destinations continuously perform a full sync of users, not just an initial sync followed by incremental changes. This sync behavior makes CSV exports impractical.
{% /callout %}
## Inspect exported cohorts using CSV export
To find out which users and how many users Amplitude exported from your cohort to your third-party destination, export a CSV containing all exported users.
The CSV export includes the following columns:
- **Amplitude_id**: Displays the unique Amplitude ID associated with each user.
- **Operation**: Indicates whether Amplitude added or removed a user from cohort membership.
- **Mapped properties**: This column shows the mapped user identifier for the cohort sync.
- **Skip_detected**: Shows if Amplitude skipped a user during the cohort sync process.
- **Skip_reason**: High-level categorization of why Amplitude skipped a user.
- **Unresolved mapping**: Amplitude skipped this user during the cohort sync because the mapped property used to identify the user is missing or has no value.
- **Rejected by partner**: The third-party destination rejected this user because the mapped property doesn't adhere to the required format. For example, if data fields aren't in the correct numeric or email format, the destination excludes the user from the cohort sync.
Some user properties may be incomplete or out of compliance with the target platform's criteria. A cohort sync success rate over 80% is often acceptable for advertising campaigns. For email campaigns or A/B testing, use a rate above 95%.
If there are many skipped entries, there may be a data quality issue at the source. To resolve this issue, review the CSV file to pinpoint discrepancies. Then make appropriate corrections to the user data when you're importing it into Amplitude. After you make corrections, launch the cohort sync process again to confirm the accuracy and consistency of your data.
## Additional considerations
- **Real-time cohort sync**: With Amplitude's Real-Time Sync (RTS) feature, the cohort sync history page doesn't allow you to export a CSV for users skipped during the sync. For detailed tracking of skipped users, use hourly or daily syncs instead of real-time syncs.
- **Users are silently dropped upon reaching destination**: Some destinations may return a 2XX response to indicate a successful cohort sync from Amplitude, even though the destination silently dropped users who didn't meet its criteria. In these cases, confirm that Amplitude exported a specific user by checking the CSV file.
{% callout type="note" %}
Amplitude uses response codes to detect when third-party destinations don't include users. In some cases, Amplitude can't identify these users. If you have questions, post in the [Amplitude community](https://community.amplitude.com/) or contact the [Support team](https://help.amplitude.com/hc/en-us/requests/new) for assistance.
{% /callout %}
## Supported destinations
Refer to the [Destination Catalog](https://amplitude.com/docs/data/destination-catalog).
================================================================================
# Client-side vs Server-side
URL: https://amplitude.com/docs/data/client-side-vs-server-side
================================================================================
# Client-side vs Server-side
Client-side and server-side describe where an app's code runs: either on the user's device (client-side), or on a server (server-side). Amplitude has several types of sources to cover each of your needs. This doc primarily describes the differences between client-side and server-side sources, and gives a brief overview of third-party sources.
Both Amplitude client-side SDKs and server-side SDKs use API endpoints. These endpoints offer flexibility for implementing custom solutions without relying on Amplitude's SDKs, especially for programming languages Amplitude's SDKs don't support, like PHP.
| Name | API endpoints |
| ------------------------------------------------------------------ | ----------------------------------------------------------------------------------------------------------------------------- |
| [Analytics and Data SDKs](https://amplitude.com/docs/sdks/analytics) | [HTTP V2 API](https://amplitude.com/docs/apis/analytics/http-v2) and [Batch event upload](https://amplitude.com/docs/apis/analytics/batch-event-upload) |
| [Experiment SDKs](https://amplitude.com/docs/sdks/experiment-sdks) | [Evaluation API](https://amplitude.com/docs/apis/experiment/experiment-evaluation-api) |
## Client-side sources
Use client-side sources in apps that your users run on their own devices, like mobile, web browser, and desktop apps. In these types of sources, code runs on the user's device.
Amplitude's client-side sources include these SDKs:
- Web: Browser, Marketing Analytics Browser, React Native.
- Mobile: Android, iOS, Unity Plugin, Flutter, React Native.
- Game engine: Unity Plugin, Unreal.
## Server-side sources
Use server-side sources in secure, multi-user environments like web servers and services that you run on your own servers. In these types of sources, code runs on the server.
Amplitude's server-side sources include these SDKs and APIs:
- Node.js SDK.
- Go SDK.
- Python SDK.
- Java SDK.
## Third-party sources
Third-party is another kind of source. These sources let you import data from other platforms into Amplitude. Third-party sources all require that you have an account with the third-party source, and each has different setup requirements. You can find all third-party sources in the [Source catalog](https://amplitude.com/docs/data/source-catalog).
## How to choose
Choosing the kinds of sources you need to use can be daunting, so here's a basic guide to help you make a decision.
- **Client-side**: Choose client-side sources for the simplest initial instrumentation.
- **Server-side**: Choose server-side sources if you want to track server-side events and use existing user data tracking workflows.
- **Hybrid**: Choose a hybrid approach that includes both client-side and server-side sources to get the benefits of simpler implementation and the ability to track server-side events.
- **Third party**: Choose third-party sources if you already have a third-party data layer such as ad networks or marketing automation tools.
================================================================================
# Streaming transformations
URL: https://amplitude.com/docs/data/streaming-transformations
================================================================================
# Streaming transformations
Streaming transformations send transformed data from your Amplitude taxonomy, including custom events, derived properties, transformed events, and transformed properties, to your event streaming destinations, so downstream tools receive cleaned and enriched data instead of raw events. Select any transformation when you configure event streaming. You must define the transformation in Amplitude Data before you can stream it. Refer to [Transformations](https://amplitude.com/docs/data/transformations) to create custom events, derived properties, and other transformation types.
## Setup
1. In Amplitude Data, click **Catalog** and select the **Destinations** tab.
2. In the Event Streaming section, click on any streaming destination tile.
3. Enter a sync name, then click **Create Sync**.
4. Toggle *Status* from **Disabled** to **Enabled**.
5. Paste your destination's Server Secret Key.
6. Toggle **Send events** to enable event streaming.
7. In *Select and filter events*, choose which events to send. Select only the events needed for your downstream destination. The dropdown includes any transformed events from your taxonomy.
8. (*optional*) In *Select additional properties*, select any event properties (including transformed event properties) to include. By default, Amplitude doesn't send any additional properties unless you explicitly select them.
9. (*optional*) In *Select additional user properties*, select any user properties to include. By default, Amplitude doesn't send any additional user properties unless you explicitly select them.
10. When satisfied with your configuration, click **Save**.
## Example use cases
### Streaming renamed events to AppsFlyer
AppsFlyer requires unique event names for attribution and doesn't support event properties. Previously, you had to create custom events in your backend and resend them to Amplitude. You can now use Amplitude Data to rename events before streaming them to AppsFlyer, which reduces duplicate ingestion.
### Streaming derived properties to Braze
To improve campaign effectiveness, you can stream derived properties from Amplitude to Braze. Select derived properties in your sync filters and include them when configuring additional properties. This enables more targeted campaigns using enriched event data from Amplitude.
## Considerations
Note the following when streaming transformations from Amplitude:
* Amplitude sends selected event and user properties along with the event.
* Amplitude targets an end-to-end p95 latency of 60 seconds. Amplitude streams 95% of events within 60 seconds. Amplitude has internal processes, monitors, and alerts in place to meet this target.
## Transformation payload structure
The streaming payload includes transformations as nested JSON fields. Understanding this structure is essential when using custom FTL (FreeMarker Template Language) templates or configuring how your destination receives data.
### Selection requirement
You must explicitly select transformations in your sync configuration to include them in the streaming payload. You can select transformations in:
* *Select and filter events*: For example, filtering events where a derived property isn't `null`.
* *Select additional properties*: To include specific transformed properties.
* *Map properties to destination*: When mapping properties to your destination's schema (if applicable).
The streaming payload only includes transformations you explicitly select.
### JSON structure
The payload includes transformations as nested JSON objects. The top-level field name depends on the transformation type:
| Transformation Type | Top-level JSON Field Name |
|---------------------|---------------------------|
| Merged properties | N/A (replaced in original field) |
| Derived properties | `derived_properties` |
| Channel properties | `derived_properties` |
| Lookup properties | `lookup_properties` |
Field names within these objects match the transformation names displayed in the Amplitude UI.
### Example payload
If you select a derived property called `sample_derived_property_key1`, the streaming payload looks like this:
```json
{
"event_type": "Button Clicked",
"user_id": "12345",
"derived_properties": {
"sample_derived_property_key1": "whatever_value"
}
}
```
### Using transformations with custom FTL
If your destination uses custom FTL templates, you can access transformation data using these patterns.
**Example 1: Using FtlUtils to serialize derived properties**
```ftl
<#assign UtilClass=statics['com.amplitude.integrations.connector.utils.FtlUtils']>
{
"version": "derived_properties_sample_ftl1",
"derived_properties": ${UtilClass.toJson(input.derived_properties)}
}
```
**Example 2: Manually iterating over derived properties**
```ftl
<#assign UtilClass=statics['com.amplitude.integrations.connector.utils.FtlUtils']>
{
"version": "derived_properties_sample_ftl2",
"derived_properties": {
<#list input.derived_properties?keys as key>
"${key}": "${input.derived_properties[key]}"<#sep>,</#sep>
</#list>
}
}
```
## Customize payloads with FreeMarker (FTL)
Event streaming destinations that expose a custom payload editor use [Apache FreeMarker](https://freemarker.apache.org/) (FTL) to turn the Amplitude event into the JSON body your destination expects. The editor in the connector builder provides autocomplete, hover documentation, and inline validation for the fields and helpers below. For the FreeMarker language itself, refer to the [guide to creating templates](https://freemarker.apache.org/docs/dgui.html).
### The input object
`input` is the event (or user) Amplitude forwards. Access its fields with dot notation, wrapped in `${ }` to output the value:
```ftl
"${input.user_id}"
"${input.event_type}"
"${input.event_time}"
```
Commonly available fields include `event_type`, `user_id`, `device_id`, `time`, `event_time`, `session_id`, `platform`, `event_properties`, `user_properties`, `group_properties`, and `groups`, plus any transformations you select (`derived_properties`, `lookup_properties`). For the complete shapes, refer to the [event format](https://amplitude.com/docs/apis/analytics/export) and [user (Identify) format](https://amplitude.com/docs/apis/analytics/identify).
{% callout type="warning" title="Fields aren't guaranteed" %}
`input` fields depend on how each user instruments events, and a selected event property might not be present on every event you stream. Reference fields defensively (refer to [Handle missing fields](#handle-missing-fields)), and keep required-field usage to common fields like `user_id`, `event_type`, and `event_time`. The payload editor flags a referenced property that isn't present on all of the events you selected.
{% /callout %}
### Dot and bracket notation
Use dot notation when a property name is a valid identifier, and bracket notation when the name contains spaces or other special characters:
```ftl
${input.event_properties.plan}
${input.event_properties["Plan Type"]}
```
### Handle missing fields
Because fields aren't guaranteed, guard against missing values:
* `??` tests whether a value exists: `<#if input.user_id??>…</#if>`.
* `!` supplies a default when a value is missing: `${input.user_properties.email!}` (empty string) or `${input.revenue!0}`.
```ftl
{
<#if input.user_id??>
"external_id": "${input.user_id}",
</#if>
"email": "${input.user_properties.email!}"
}
```
### Useful built-ins
FreeMarker built-ins (`?name`) transform values. Common ones for JSON payloads:
| Built-in | Use |
|----------|-----|
| `?c` | Format a number for computers, with no locale grouping or scientific notation. Use for numeric JSON values: `${input.revenue?c}` |
| `?json_string` | Escape a string for safe use inside a JSON string: `"${value?json_string}"` |
| `?keys` | Get an object's keys to iterate with `<#list>` |
| `?is_number`, `?is_boolean`, `?is_string` | Test a value's type before serializing it |
### Iterate over properties
Use `<#list>` with `?keys`, and `<#sep>` to place commas between items only:
```ftl
"user_properties": {
<#list input.user_properties?keys as key>
"${key}": ${UtilClass.toJsonString(input.user_properties[key])}<#sep>,</#sep>
</#list>
}
```
### Helper methods (FtlUtils)
Amplitude exposes helper methods for serializing values and other common transforms, so you don't have to hand-write the logic. Assign the helper once at the top of the template, then call its methods:
```ftl
<#assign UtilClass=statics['com.amplitude.integrations.connector.utils.FtlUtils']>
{
"user_properties": ${UtilClass.toJson(input.user_properties)}
}
```
| Method | Returns | Description |
|--------|---------|-------------|
| `toJson(value)` | string | Serializes a value to JSON. Maps, lists, and JSON values become JSON; scalars become a quoted JSON string (for example, `42` becomes `"42"`). |
| `toJsonString(value)` | string | Alias of `toJson`. |
| `dateStringToIso(dateTime)` | string | Converts an Amplitude datetime string to ISO 8601. |
| `dateStringToEpochSeconds(dateTime)` | number | Converts an Amplitude datetime string to epoch seconds. |
| `dateStringToEpochMillis(dateTime)` | number | Converts an Amplitude datetime string to epoch milliseconds. |
| `epochSecondsToIso(seconds)` | string | Converts epoch seconds to ISO 8601. |
| `epochSecondsTextToIso(text)` | string | Converts epoch seconds provided as text to ISO 8601. |
| `epochMillisToIso(millis)` | string | Converts epoch milliseconds to ISO 8601. |
| `isValidEmail(value)` | boolean | Returns whether the value is a valid email address. |
| `sha256(value)` | string | Returns the SHA-256 hash of the value. If the value is already a 64-character hash, returns it unchanged. |
| `cleanJsonPropertyName(name)` | string | Replaces whitespace with underscores and removes other non-alphanumeric characters. |
| `getDisjointMap(source, filter)` | map | Returns the entries of `source` whose keys aren't present in `filter`. |
{% callout type="note" title="Destination-specific helpers" %}
Some destinations provide additional helper methods tailored to that destination. You can use those helpers only in that destination's template.
{% /callout %}
### Examples
Each example shows the **input** event Amplitude forwards, the **template** you write, and the **result** Amplitude sends to your destination.
#### Simple: rename and pick fields
Map a few input fields into the shape your destination expects.
Input event:
```json
{
"event_type": "Song Played",
"user_id": "user-123",
"event_time": "2024-01-15T09:30:00.000",
"event_properties": {
"song_id": "abc-987"
}
}
```
Template:
```ftl
{
"external_id": "${input.user_id}",
"name": "${input.event_type}",
"song": "${input.event_properties.song_id}"
}
```
Result:
```json
{
"external_id": "user-123",
"name": "Song Played",
"song": "abc-987"
}
```
#### Complex: guards, bracket notation, and iteration
Guard an optional field with `??`, read a property whose name has a space with bracket notation, format a number with `?c`, and serialize all user properties by looping with `<#list>`, emitting numbers and booleans raw and everything else through `toJsonString`.
Input event:
```json
{
"event_type": "Purchase Completed",
"user_id": "user-123",
"revenue": 12.5,
"event_properties": {
"Item Name": "Pro Plan"
},
"user_properties": {
"email": "alex@example.com",
"plan": "pro",
"age": 30
}
}
```
Template:
```ftl
<#assign UtilClass=statics['com.amplitude.integrations.connector.utils.FtlUtils']>
{
"event": "${input.event_type}",
<#if input.user_id??>
"user_id": "${input.user_id}",
</#if>
"item": "${input.event_properties["Item Name"]}",
"revenue": ${input.revenue?c},
"traits": {
<#list input.user_properties?keys as key>
<#assign value = input.user_properties[key]>
"${key}": <#if value?is_number || value?is_boolean>${value}<#else>${UtilClass.toJsonString(value)}</#if><#sep>,</#sep>
</#list>
}
}
```
Result:
```json
{
"event": "Purchase Completed",
"user_id": "user-123",
"item": "Pro Plan",
"revenue": 12.5,
"traits": {
"email": "alex@example.com",
"plan": "pro",
"age": 30
}
}
```
## Supported custom events
Amplitude supports streaming custom events that meet specific criteria. When you create custom events in the Amplitude taxonomy, you can select them for event streaming if they have:
* **Supported properties**: User properties and event properties only.
* **Supported operators**: `is`, `is not`, `contains`, and `does not contain`.
Custom events that use other property types or operators aren't available for selection in event streaming configurations.
## Limitations
Streaming transformations from Amplitude has some limitations:
* When you rename custom events or derived properties, update any existing sync configurations that reference them. Syncs require current event and property names to work properly. Note that changing the underlying definition of a transformation doesn't affect syncing. Only name changes require sync updates.
* **Lookup properties**: You can stream lookup properties by requesting access from Amplitude. Lookup properties map existing event or user properties to new properties using a CSV file upload and can enrich already-ingested events at query time.
* Lookup property files with over 1000 rows don't display in the streaming setup.
* After you save a lookup property file, it can take up to one hour to populate into the streaming system.
* **Channel classifiers**: To stream channel classifiers, request access from Amplitude. Channels act like derived properties applied in real time during queries. Marketers primarily use channels to define acquisition channels based on UTM and referrer data. By default, you can't select channel properties in sync configuration (event filters or additional properties) unless Amplitude has already enabled this feature for your organization.
* You can stream transformations to all streaming destinations except Data Warehouse destinations.
* The streaming setup doesn't support the following transformation types:
* Custom events that don't meet the criteria in the [Supported custom events](#supported-custom-events) section.
* Group properties.
* Cart properties.
* Nested properties (for example, derived properties that rely on other derived properties). Exception: the UI allows selecting nested properties based on merged or cart properties, but they don't work in practice.
## FAQ
{% accordion title="Does this impact my event volume streaming limit?" %}
Yes, streaming transformations count towards your existing event streaming volume limit. Check your event streaming limit by navigating to *Settings > Plans & Billing*.
{% /accordion %}
{% accordion title="Can I select both raw and transformed events/properties?" %}
Yes, you can select both raw and transformed versions in your streaming sync. For example, if a transformation merges three event types into one transformed event, all four event types (the three originals plus the merged version) appear in the selection dropdown.
{% /accordion %}
{% accordion title="How does Amplitude handle custom events and transformed properties during streaming?" %}
Custom events and transformed properties follow the configurations set in your Amplitude Data taxonomy. Amplitude applies transformations before it streams the data to the destination.
{% /accordion %}
{% accordion title="How can I enable channel classifiers for my event stream?" %}
Amplitude can enable channel classifier selection in event streaming sync configurations on request. Email integrations@amplitude.com with your organization ID and app IDs to request access.
{% /accordion %}
================================================================================
# Sync Cohorts with Destinations
URL: https://amplitude.com/docs/data/sync-cohorts-with-destinations
================================================================================
# Sync Cohorts with Destinations
Cohort sync pushes Amplitude cohorts to third-party [destinations](https://amplitude.com/docs/data/destination-catalog) such as ad networks, attribution providers, and marketing automation platforms. Amplitude offers three cadences: a one-time export, a scheduled hourly or daily refresh, and a real-time stream that checks for updates every minute. The cadence you pick also determines which destinations accept the sync.
## One-time sync
Use a one-time sync to send a cohort to your destination once. Use this option if you need to export a cohort to the destination and don't require continuous updates.
## Scheduled sync
Use a scheduled sync to send cohort updates to your destination on an **hourly** or **daily** basis. Amplitude queues sync jobs throughout the hour or day, depending on your selection. You can't select the time of day that a sync occurs.
{% callout type="note" heading="Scheduled sync timing" %}
Amplitude schedules a time to sync the cohort as soon as you create a new cohort or update the sync details.
The first sync occurs right after Amplitude schedules it. The first two syncs may occur more frequently than every 24 hours.
If you don't update the sync, future sync jobs run around the same time within the time period.
{% /callout %}
## Real-time sync
Use a real-time sync to keep the destination updated with the most recent cohort information. Real-time sync checks for updates and sends them to the destination every minute.
Amplitude recommends real-time syncs for cohorts that require minute-by-minute precision and don't change by a large number of users from minute to minute. If you choose real-time syncing and notice in the sync history that most syncs update `0` users, hourly sync may work better for your use case.
{% callout type="warning" heading="Real-time sync limitations" %}
Real-time sync supports cohorts of 1,000,000 users or fewer, and all cohort types except:
* Funnel
* Retention
* Stickiness
* Nth time event
* Event within
* Distinct interval
Real-time sync supports all cohort destinations except:
* [Facebook Ads](https://amplitude.com/docs/data/destination-catalog/facebook-ads)
* [Google Ads](https://amplitude.com/docs/data/destination-catalog/google-ads-cohort-syncing)
* [Twitter (X) Ads](https://amplitude.com/docs/data/destination-catalog/twitter-ads-cohort)
* [Hubspot](https://amplitude.com/docs/data/destination-catalog/hubspot-cohort-sync)
* [Qualtrics](https://amplitude.com/docs/data/destination-catalog/qualtrics)
* [S3 cohort sync](https://amplitude.com/docs/data/destination-catalog/amazon-s3-cohort)
* [TikTok Ads](https://amplitude.com/docs/data/destination-catalog/tiktok-ads)
* [Enterpret](https://amplitude.com/docs/data/destination-catalog/enterpret)
* [SFMC](https://amplitude.com/docs/data/destination-catalog/salesforce-marketing-cloud-v2)
* [The Trade Desk](https://amplitude.com/docs/data/destination-catalog/thetradedesk)
{% /callout %}
================================================================================
# Integration Portal
URL: https://amplitude.com/docs/partners/integration-portal
================================================================================
# Integration Portal
The Amplitude Integration Portal helps partners build data connections for Amplitude customers and simplify the integration process.
With the Integration Portal, partners gain access to tools and resources such as documentation, code samples, and best practices.
## Start with the Integration Portal
The Integration Portal lets partners define and add the contextual information for their integration tile in the Amplitude app. Using the Integration Portal, you can:
- Add a brief overview of your integration.
- Add a display name for your integration tile in Amplitude.
- Choose an integration category (for example, Messaging, Attribution, Ad Network).
- Upload your company logo for your integration tile.
- Verify that Amplitude successfully receives your data payload.
The Integration Portal supports these integration types:
- [Cohorts](https://amplitude.com/docs/partners/create-a-cohort-sync-integration): Build your own Amplitude Data Destination cohort tile to enable users to sync cohorts, or audiences, from Amplitude to your platform through a series of REST API calls.
- [Event Streaming](https://amplitude.com/docs/partners/create-an-event-streaming-integration): Build your own Amplitude Event Streaming tile to let your users forward events in real time from Amplitude.
### Before you use the Integration Portal
To get started, complete this prerequisite:
1. [Sign up](https://amplitude.com/get-started) or have an existing Plus or Greater Amplitude plan.
### High-level process to list an integration in Amplitude
Follow these high-level steps to list your integration in the Amplitude app.
1. **Go to the Integration Portal**: In Amplitude, navigate to the **My Settings** page and click **Integration Portal**. If this option isn't available, send an email to [integrations@amplitude.com](mailto:integrations@amplitude.com) with your [Org ID](https://amplitude.com/docs/admin/account-management/account-settings), and the Amplitude Product Development team can provide access.
2. Create your partner information and enter the following information:
- **Display Name**: The display name of the integration. This is the name that appears in the Integration Catalog and on your integration tile. This name must be globally unique.
- **Category**: Choose a category. The Integration Catalog uses the category in filters.
- **Summary**: A brief overview of your product.
- **Full Description**: Detailed description of your integration. Include common use cases so users understand why they should use the integration.
- **Integration Logo**: Upload your integration logo in PNG format.
3. **Configure your integration**: After you finalize testing, click **Submit** from the Integration Portal. After you submit your integration, Amplitude engineers review it. Click **Release internally** to make the integration available to members of your organization.
4. **Amplitude Engineering team reviews integration**: During the review process, the Amplitude team validates the integration. During this process, Amplitude may contact you if the team has questions.
- **Cohort destination integration:** Provide a test account to integrations@amplitude.com. Typically the Amplitude team syncs a test cohort from Amplitude to your platform as part of the validation process.
- **Streaming destination integration:** Provide a test account to integrations@amplitude.com. Typically the Amplitude team sends a test event from Amplitude to your platform as part of the validation process.
5. **Integration goes live in Amplitude**: After Amplitude approves the integration, Amplitude automatically deploys and enables the integration for your organization. You can then view a tile in the Amplitude app on the source or destination page, depending on the integration type.
6. **Get listed on Integrations Catalog**: Amplitude includes your logo on the [Integration Catalog](https://amplitude.com/integrations) page to improve discoverability and promote your integration.
7. **Co-marketing opportunities**: Click the [Amplitude Technology Partner Overview doc](https://info.amplitude.com/rs/138-CDN-550/images/Amplitude_Tech_Partner_Overview.pdf) to learn more about the benefits and requirements associated with each partnership tier: Integration, Advanced, and Premier.
## Give feedback
To share your experience and give feedback on the Integration Portal, fill out this [short survey](https://docs.google.com/forms/d/e/1FAIpQLScdj-pbOK5EbItwBNgF7KF9pBjeJZNzXNkqZ1ARJLm-Z3q1_Q/viewform?usp=sf_link). If you run into issues using the Integration Portal, email questions to <integrations@amplitude.com>.
================================================================================
# Create an Event Ingestion Integration
URL: https://amplitude.com/docs/partners/create-an-event-ingestion-integration
================================================================================
# Create an Event Ingestion Integration
{% callout type="note" heading="Prework requirements" %}
This guide assumes that you've completed the prerequisites for building partner integrations listed in [Amplitude Integration Portal](https://amplitude.com/docs/partners/integration-portal). Amplitude disables event ingestion integration creation by default. To create an event ingestion integration, send an email to [integrations@amplitude.com](mailto:integrations@amplitude.com) with your [Org ID].
{% /callout %}
This guide walks through the basics of creating an event ingestion integration in Amplitude. This guide doesn't cover how to build your integration or send events to Amplitude. For information about sending events to Amplitude, refer to the [HTTP v2 API](https://amplitude.com/docs/apis/analytics/http-v2) documentation.
1. Navigate to **Settings > Developer Portal**.
2. Click **Add Connection Info**.
3. Enter the connection information:
- **Display Name**: The display name of the integration. This is the name that appears in the Integration Catalog and on your integration tile.
- **Category**: Choose a category. The Integration Catalog uses the category in filters.
- **Summary**: A brief overview of your product.
- **Full Description**: Detailed description of your integration. Include common use cases so users understand why they should use the integration.
- **Integration Logo**: Upload your integration logo in PNG format.
## Integration setup
Configure the integration tile that appears on the **Sources** page in Amplitude after Amplitude validates your integration.
The page has two sections:
**Left Panel**: The _Configuration_ section on the left is where you create the setup instructions for your data source and configure your integration tile.
**Right Panel**: The _Preview Data Source Setup Page_ section shows what your setup instructions look like for a user.
1. From the Integration Portal page (**Settings > Developer Portal**), click **Add New Source**.
2. The Connection Information section controls the Display Name.
3. Enter a subtitle. This appears under the title when the user sets up the integration.
{% callout type="example" heading="Example subtitles" %}
- If you use Braze, you can now send events to Amplitude.
- If you use RudderStack to ingest data, you can import events into Amplitude with a few steps.
- If you use Split for feature flagging and experimentation, you can track data into Amplitude with a simple configuration.
{% /callout %}
4. Add as many setup steps as you need, but aim for no more than 5 to 8. You can include images that orient your users. Mark **Show Project API Key** to automatically pull the relevant Project API on behalf of the user. You configure all sources and destinations for Amplitude on the [project level](https://amplitude.com/docs/admin/account-management/manage-orgs-projects), not the organization level.
{% callout type="example" heading="View example setup steps in Amplitude" %}
Navigate to **Data Sources** and click **I want to import data into Amplitude**. From there, click any integration tile to view its setup instructions.
{% /callout %}
5. In **Additional Resources**, add a link to your documentation. For example: `Refer to the Amplitude [documentation](https://amplitude.com/docs/) for more details and instructions.`
6. When finished, click **Next** to go to the testing tab.
## Test and submit the integration
After you configure your source information, you can test it and submit it for review.
1. From the **Test Source** tab, select the Amplitude project to test the integration with.
2. Copy the value in **Assigned Partner ID for this Source Integration**. You must include this value in a `partner_id` parameter when sending events to Amplitude. Amplitude needs this to track events coming from partners and validate the number of integration users.
3. Send a test event from your system.
{% callout type="example" heading="Example payload" %}
```json
{
"api_key": "2a0d30356cbb278eee1a69b2bbe81c37",
"events": [
{
"user_id": "test@example.com",
"partner_id": "integration_name",
"event_type": "Product Viewed",
"time": 1663940508564,
"event_properties": {
"message_type": "push",
"message_title": "Sample Message title",
"message_id": "68b32868-b6ab-4511-b552-cf668a1c0e59",
"message_contents": "Sample message content"
}
}
]
}
```
{% /callout %}
4. Wait for Amplitude to verify the event.
After you finish testing, click **Submit** to submit your integration to the Amplitude team. The review process takes about one week. When Amplitude approves your integration, Amplitude notifies you by email and your integration tile appears in the Sources section of Amplitude.
================================================================================
# Create an Event Streaming Integration
URL: https://amplitude.com/docs/partners/create-an-event-streaming-integration
================================================================================
# Create an Event Streaming Integration
{% callout type="note" heading="Prework requirements" %}
This guide assumes that you've completed the prerequisites for building partner integrations listed in [Amplitude Integration Portal](https://amplitude.com/docs/partners/integration-portal).
{% /callout %}
This guide walks through the basics of creating an Event Streaming tile in Amplitude. Event Streaming lets your users forward events from Amplitude in real time.
## Event streaming considerations
### Supported features
- **Event Forwarding**: Event forwarding sends Amplitude Track calls to a destination. Amplitude forwards both the raw event and merged or [transformed events](https://amplitude.com/docs/data/transformations). Amplitude also sends the `event_name` and `created_at` to your destination.
- **Event Filtering**: Amplitude has fine-grained filtering options that let the user choose which events to send based on selected event types and property conditions.
- **Event Selective Property Forwarding**: The user can select which event, user, or group properties to include in the payload of forwarded events.
- **Regular User Identify Forwarding (creating and updating a user)**: Enable the Identify Forwarding feature for your destination. This feature lets the destination send users and their properties created under the Identify API in real time. For more information, refer to the [Identify documentation](https://amplitude.com/docs/apis/analytics/identify).
- **User Property Mapping**: The user can select an Amplitude user property to map to a field in your destination. This configuration also supports custom user identifiers.
### Event streaming limitations
- **User selective property forwarding**: Forwarding certain event, group, or user properties from an event based on an allow list isn't supported.
- **Forwarding arrays or object type properties**: You can't forward arrays or object type properties. For example, you can't forward a property called cities, which is an array of cities.
- **Change-based user Identify Forwarding**: Amplitude doesn't automatically generate and forward an identify event when a user property changes during event ingestion.
- **Property Value Transformation**: You can't transform a property value or type to another value or type if the original event type isn't known.
- **Selective Property Forwarding Type**: Amplitude sends all custom properties forwarded by the user as strings.
- **OAuth Authentication**: Amplitude doesn't support OAuth, so partners need to generate their API key.
- **Event Category name**: Amplitude doesn't send the Event Category name.
## Prepare an event streaming endpoint
1. **Freemarker**: Familiarize yourself with [Freemarker](https://freemarker.apache.org/), the template engine that Amplitude uses to send events.
2. **Rate limits**: Make sure your rate limits are as high as possible to minimize throttling. For example, Amplitude respects the rate limit that [Braze](https://amplitude.com/docs/data/destination-catalog/braze) communicates: 50,000 requests per minute for event tracking. Amplitude has a retry mechanism with exponential backoff that tries 9 times over 4 hours. This process should resolve temporary throttling.
3. **Event limits**: Make sure your event size limit is flexible enough for customer use cases.
{% callout type="example" heading="Example event limits" %}
For example, [Customer.io](https://amplitude.com/docs/data/destination-catalog/customer-io) events have the following limits:
- Maximum length of Customer ID: 150 bytes
- Maximum number of Unique Identify attributes: 300
- Maximum size of event data: 100K bytes
For example, [Intercom](https://amplitude.com/docs/data/destination-catalog/intercom) has a limit of 120 Event Types and 20 meta properties per event type. You must use the event filter to select the specific events users want to forward from Amplitude to Intercom.
{% /callout %}
4. **Authentication method**: Amplitude doesn't support OAuth, so partners need to generate their API key.
5. **Endpoint flexibility**: Amplitude generates a list of objects in a specific format. Make sure your endpoint handles this payload structure. Refer to the next section for a payload example.
## Integration setup
Configure the integration tile that appears on the Destinations page in Amplitude.
1. From the Integration Portal page (**Settings > Developer Portal**), click **Add New Destination**.
2. Under **Select Destination Type**, choose **Event Streaming**.
### Example setup modal
To view an example of a finished setup modal in Amplitude, navigate to **Data Destinations** in Amplitude, and add any integration marked with Event Streaming.
## Configure the event streaming integration
The configuration page has two sections.
- The **Configuration** tab is where you configure your payload and what you expect to receive from Amplitude.
- The **Testing** tab summarizes your configurations, including your setup modal screen for your integration, parameters, and payload. The tab also lets you test your configuration using a custom payload.
## Integration name
The integration name appears on the catalog page. The name must be globally unique across event streaming integrations.
## Create parameters
This section lets you define the parameters that the URL, headers, and event body can use.
- **Parameter Display Name**: This is fully customizable, so use something descriptive. This value is the display name in Amplitude. For example, "REST API Endpoint & REST API Key."
- **Parameter Name**: The payload, URL, or header uses this ID for the corresponding parameter.
## Customize user properties mapping
This section lets you define fields in the payload that the user can populate with an Amplitude user property of their choice.
For example, most destinations use a field here for their user identifier and set it as required.
- **Destination Property Name**: This acts as both the field name and display name.
- **Required Checkbox**: If you check this option, the user can't forward events to your destination until they configure this field.
## Customize events payload
Use the Customize Events Payload section to customize what's included in your payload.
- **URL Endpoint**: Depending on your endpoint, you can choose PUT, POST, or PATCH.
- **REST API Headers**: You can customize the API headers type to suit your use case. Some examples include:
- **Authorization**: Contains the authentication credentials for HTTP authentication.
- **Content-Type**: Tells the client the response media type, such as `application/json` or `application/javascript`. This header helps the client process the response body correctly.
- **WWW-Authenticate**: The server may send this header as an initial response if it needs authentication before responding with the requested resource. Often this header appears with the 401 response code, which means "unauthorized."
- **Accept-Charset**: The request sets this header and tells the server which character sets, such as UTF-8, ISO-8859-1, or Windows-1251, are acceptable by the client.
- **Cache-Control**: The server defines the cache policy for this response. The client stores a cached response and reuses it until the Cache-Control header expires.
- **Header Key & Header Value**: This is fully customizable, so use something descriptive. For example, "API Key." This isn't included in the payload.
### Example payload structure
```json
{
"external_id": "some user id",
"app_id": "some app id",
"name": "test_event_type",
"time": "2022-01-06T17:29:04Z",
"optional_property": "some Amplitude property",
"optional_property_again": "some Amplitude property again",
"properties" : {
"test_nested_property": "some nested property",
"library": "some library",
"user_property_1": "some user property value 1"
},
},
```
## Event body editor
This section is a Freemarker template that lets you construct the payload sent to your destination.
The template in the screenshot can correspond to the example payload structure, depending on how the user configures their sync and the _Customize user properties mapping_ section.
- **Input**: This object includes the forwarded event and its fields. Amplitude enriches the object with the user's other events and user properties. These fields aren't guaranteed and depend on how each user instruments events. Amplitude suggests keeping input field usage to a minimum and using common fields such as `user_id`, `event_type`, and `event_time`.
- **Parameters**: A key-value pair where the key is a _Parameter Name_ defined in the **Create Parameters** section. The value corresponds to the value that the user provided when setting up their sync.
- **MappedProperties**: A key-value pair of event, user, or group properties that the customer might want to forward to your destination. For example, a customer may track an `email: example@example.com` property and may want to forward that property to your platform. Amplitude forwards these properties only if the user selects them in the UI under **Specify event properties to send**.
- **MappedFields**: A key-value pair where the key is a _Destination Property Name_ specified in the **Customize user properties mapping** section. The value corresponds to the value of an Amplitude property that the user selects in the UI under the **Mappings** tab. For example, you may have specified `external_id` as a field, and the user may have selected the Amplitude property `email: example@example.com` in the UI. Then _MappedFields_ is a key-value pair: `{external_id: example@example.com}`.
## Preview and test
1. Before you submit your configuration for review, test the mock payload that you expect to receive from Amplitude on the Testing tab. The Destination Preview form matches what users of the integration view. Enter the parameters you defined in this form to use as test values. You can also configure mapped properties and filters on this form.
2. Click **Test Connection** to open the testing modal. **Test Connection** appears after you enter all required parameters. This lets you customize your payload. Click **Send Test Event**. Any responses from the endpoint you specified appear on the right.
3. If errors appear, check the parameters table to make sure all declared parameters have corresponding uses.
- **DECLARED**: All declared parameters in the _Create Parameters_ section.
- **USED**: All parameters used in the URL, headers, and event body.
## Release internally
To test in your org, click **Release Internally**. This enables anyone within your org to use the integration you defined. Allow up to 5 minutes for changes to take effect.
## Submit the integration
After you finish testing, click **Submit** to submit your integration to the Amplitude team. The review process takes about one week. When Amplitude approves your integration, Amplitude notifies you by email and your integration tile appears in the Destination section of Amplitude.
================================================================================
# Create a Cohort Syncing Integration
URL: https://amplitude.com/docs/partners/create-a-cohort-sync-integration
================================================================================
# Create a Cohort Syncing Integration
{% callout type="note" heading="Prework requirements" %}
This guide assumes that you've completed the prerequisites for building partner integrations listed in [Amplitude Integration Portal](https://amplitude.com/docs/partners/integration-portal).
{% /callout %}
This guide walks through the basics of creating a cohort sync integration with Amplitude.
This guide uses a list-based integration in its examples. If you create a property-based cohort sync integration, some steps may differ.
## Integration setup
Configure the integration tile that appears on the Amplitude **Destinations** page after Amplitude validates your integration. You also need to decide between a list-based cohort integration and a property-based cohort integration. For details about each integration type, refer to [Receiving behavioral cohorts](https://amplitude.com/docs/partners/receiving-behavioral-cohorts/).
1. From the Integration Portal page (**Settings > Developer Portal**), click **Add New Destination**.
2. Choose the target connection from the _Select Connection Information_ dropdown.
3. Choose whether you are building a list-based or property-based cohort integration:
- **List-based cohort integration**: A list-based cohort integration works best if the target system represents a cohort as a list of user identifiers. The first sync requires a call to a list creation API, then subsequent calls to the add API and remove API keep the list membership up to date.
- **Property-based cohort integration**: A property-based cohort integration works best with systems that represent cohort membership as a custom user property, such as a boolean flag or a tag. Amplitude invokes the update API when cohort membership changes to update the user property. Although you don't need to use the list creation API, you may need to manually create the custom user property.
4. Click **Next** to configure the destination.
## Integration name
The integration name appears on the catalog page. The name must be globally unique across cohort sync integrations.
## Configure the cohort sync integration
The configuration page has two sections.
- The **Configuration** tab is where you configure your payload and what you expect to receive from Amplitude.
- The **Testing Integration** tab summarizes your configurations, including the **Destination Settings** form, which previews your integrations, variables, and payload. You can also test your integration functionality from this tab.
The next several sections walk through configuration and testing options.
### Set authentication method
Determine how you plan to authenticate the API call between Amplitude and your company.
Click **Custom Headers**, and choose from the following options:
- **No authentication**: This option doesn't require an authentication header.
- **Basic Authentication**: Use API key and API Secret (optional) as authentication headers.
- **Authentication Header**: Authenticate with API key.
- **Bearer Token**: Use Bearer Token as an Authorization header.
### Create custom fields
These fields collect and replace the `$variable` declared in the API call payloads. They also build the modal customers use to enable your integration. Fields you add here become required fields when users set up the integration.
- **Field Type**: Specify the field type, such as String, Single Select, or Button Group.
- **Field variable name used in the payload**: By default, this matches your authentication choice. For example, if you choose Bearer Token as the authentication method, it's "bearer_token."
- **Display name**: The name your users view in the setup modal for your integration. By default, this matches your authentication choice. For example, if you choose Bearer Token as the authentication method, it has a placeholder display name called "Bearer Token."
- **Add New Custom Field**: If you need to add another identifier required for the payload, you can add custom fields such as String, Single Select, and Button Group.
{% callout type="note" heading="" %}
Amplitude recommends using an underscore "\_" instead of a dash in header values. For example, use `$api_key` instead of `$api-key`.
{% /callout %}
### Map fields
Map fields to specify how Amplitude fields connect to the fields in your system. The value of the mapping replaces `item_template` in the payloads.
When you configure Mapping Fields in the Integration Portal, users of your integration view a **Mappings** section in their Destination Settings. This section lets users select any Amplitude user property to map to a field in your destination system. This configuration also supports custom user identifiers.
- **Mapping Field Display Name**: Amplitude recommends setting this as "Key," "Identifier," or "User ID Mapping."
- **Amplitude Mapping Field**: The field name in Amplitude. For example, `user_id_field_amplitude`.
- **Field Type**: Either "String" or "Single Select."
- **Display name**: This is fully customizable, so use something descriptive. For example, User ID or Email.
- **Add New Mapping**: Add more mappings if required, such as String, Single Select, or Button Group.
### Slugify Amplitude cohort name
You can slugify cohort names to standardize them. This option helps if your system doesn't support special or non-ASCII characters. Slugification converts your cohort name to a URL slug by replacing Unicode special characters and spaces with ASCII characters and hyphens. This feature works only when the `$amplitude_cohort_name` variable appears in the endpoint payload. The slugify rule is as follows:
- Convert the original cohort name to normalization form KD (NFKD), which is compatibility decomposition.
- Substitute hyphens for the characters except for the alphabets (a-z, A-Z), the numbers (0-9) and the underscores (\_).
- Limit the slug to 100 characters.
{% callout type="example" heading="" %}
This option turns a cohort named `Saturday's cohort & héllo` into `Saturday-s-cohort-he-llo`.
{% /callout %}
### List creation endpoint
You need to call three APIs for a list-based integration. The first API is the list creation endpoint. When a cohort syncs for the first time, Amplitude calls this API and creates a list on your platform. Amplitude expects your app to send a response with the unique identifier for `listID`. Amplitude stores the `listID` from that response and uses the ID as part of the payload for list updates.
- **URL Endpoint**: Define the endpoint, such as `https://api.yourapp.com/list`. Choose which method to use in the call.
- **API payload to send to the destination**: Customize this payload to fit your needs.
- **Path to List ID in the response**: N/A
{% callout type="note" heading="Payload editor" %}
The payload editor is a developer-friendly JSON editor tool. Type `$` to find created variables easily.
{% /callout %}
#### Errors for the list creation endpoint
Add error status codes and error messages for every endpoint so end users can debug and get faster help.
Expand **Error Classifications**, and click **Add New Error** to add more status codes. Amplitude recommends including as many status codes and sub-error codes as you need. These codes and messages make debugging faster for your end users.
1. Amplitude recommends using sub error codes if you use the same status code for multiple errors.
Here are some common examples of status codes that most partners include:
- 200: Success
- 400: Invalid request
- 401: Unauthorized (bad api_key)
- 404: Invalid User ID
- 429: Throttling/rate limiting
Amplitude suggests giving a clear Failure Reason (Description) and Error Message in case cohort sync fails. Clear messages improve your end user's experience and can help reduce support issues.
{% callout type="note" heading="How Amplitude handles undefined status codes" %}
For any error response code that's "undefined" at the point of configuration, without a failure reason or status code, Amplitude shows an "unclassified" error type with the following error message:
"This cohort sync has encountered an unidentified kind of error for this integration. Please contact support or your CSM to create a ticket and ask for help in solving this issue."
{% /callout %}
### Add users endpoint
Amplitude calls the add users API every time a cohort syncs from Amplitude to your app. This sync can run hourly or daily. The call calculates the difference between the current cohort size and the last successful sync.
- **URL Endpoint**: The URL can include a `$list_Id` placeholder, but this placeholder isn't required. You can design your API to place the list ID in the payload instead. Example: `https://your.domain/lists/$listId/add`.
- **API payload to send to the destination**: Customize this payload and define whether the payload is a batch. The `$items` variable is the important key. The contents of _An array of items that replaces the $items variable in the payload_ replace this variable.
The `$items` variable usually identifies every user in a cohort. For example, a sync may add 20 new users to an existing cohort. The Batch object contains a collection, such as a list of 20 users, and Amplitude sends those 20 objects to your endpoint. Your payload might look like this:
```json
{
"userIds": $items,
"context": {
"integration":{
"name": "Amplitude Cohort Sync",
"version": "1.0.0"
}
}
}
```
- **Maximum number of items in each API call (batch size)**: The default is 10,000, but you can specify this. Amplitude's recommendation is to have a 10,000 user per cohort batch.
- **An array of items that replaces the `$items` variable in the payload**: Specify the format of object that replaces the `$item` variable in the payload. For example, `"$user_id_field_amplitude"`.
Avoid rate limiting if possible. If you have rate limits, such as 90 requests per second, make them explicit in your user documentation. Amplitude sends 4 requests in parallel, with each request containing up to 10,000 users.
#### Errors for add users endpoint
Instead of creating every status code, failure reason, error message, and sub-error code again, Amplitude recommends using the same set of error codes from your list creation endpoint. Select **Copy errors from other endpoints** and select an endpoint with configured errors.
### Remove users endpoint
Amplitude calls the remove users API every time a cohort syncs from Amplitude to your app. This sync can run hourly or daily. The call calculates the difference between the current cohort size and the last successful sync.
- **URL Endpoint**: The URL can include a `$listId` placeholder, but this placeholder isn't required. You can design your API to place the list ID in the payload instead. Example: `https://your.domain/lists/$listId/remove`.
- **API payload to send to the destination**: Customize this payload and define whether the payload is a batch. The `$items` variable is the important key. The contents of _An array of items that replaces the $items variable in the payload_ replace this variable.
The `$items` variable usually identifies every user in a cohort. For example, a sync may remove 20 users from an existing cohort. The Batch object contains a collection, such as a list of 20 users, and Amplitude sends those 20 objects to your endpoint. Your payload might look like this:
```json
{
"userIds": $items,
"context": {
"integration":{
"name": "Amplitude Cohort Sync",
"version": "1.0.0"
}
}
}
```
- **Maximum number of items in each API call (batch size)**: The default is 10,000, but you can specify this. Amplitude's recommendation is to have a 10,000 user per cohort batch.
- **An array of items that replaces the `$items` variable in the payload**: Specify the format of object that replaces the `$item` variable in the payload. For example, `"$user_id_field_amplitude"`.
#### Errors for remove users endpoint
Instead of creating every status code, failure reason, error message, and sub-error code again, Amplitude recommends using the same set of error codes from your list creation endpoint. Select **Copy errors from other endpoints** and select an endpoint with configured errors.
### Preview & test endpoint
Before submitting your configuration for review, test the mock payload that you expect to receive from Amplitude. In the Testing tab, follow these steps to preview and test your configuration.
In the Testing tab, the Destination Settings form matches what users of your integration view. This form controls the parameters you've defined in the payload headers.
{% callout type="note" heading="Mappings don't work in the Testing tab" %}
The **Mappings** section doesn't function in the Testing tab because the tab uses CSV input with pre-defined variables (like `user_id_field_amplitude`). In production, user-selected mappings replace these values, but in testing, the CSV values take precedence.
{% /callout %}
To generate users, upload a CSV or click **Regenerate** to generate users based on your configuration. The CSV must have an Operation column with either `add` or `remove`. Any parameters used in the List Creation payload must be the same across all rows in the CSV. The CSV must also have columns for each parameter used.
Here is a sample CSV for the default configuration:
```csv
operation,user_id_field_amplitude,amp_cohort_name,amp_cohort_id
add,user123,Unified Cohort,unified_cohort_001
add,user456,Unified Cohort,unified_cohort_001
remove,user789,Unified Cohort,unified_cohort_001
add,john.doe@example.com,Unified Cohort,unified_cohort_001
```
Check the parameters table to make sure the configuration accounts for all variables and resolve any errors. Ensure that all declared fields are non-empty.
- **DECLARED**: All declared variables in the "Authentication calls, Custom Fields and Mapping Fields section."
- **USED**: All variables used in the list users endpoint, add users endpoint, and remove users endpoint.
- **PRE-DEFINED**: Pre-defined variables that Amplitude replaces values for.
To modify the headers, use the **Destination Settings** form on the **Configuration** and **Testing** tabs.
Check your headers and payloads. When ready, click **Test Endpoint** to send a test API call to the predefined endpoint. The response or error appears for debugging.
After you click **Test Endpoint**, you should get a success response. Retrieve the `$list_id`; Amplitude uses the `$list_id` for the "Add Users Endpoint."
The `{listId: $list_id}` is the expected response for list creation API call. To change the structure, change the _Path to List ID in the response_ value in the list creation configuration.
Use the `$list_id` you retrieved to test the add users and remove users endpoints.
You can also test end to end with the **Test Endpoint** button in the Test Integration section. This button automatically runs all necessary tests.
## Release internally
To test in your org, click **Release Internally**. This enables anyone within your org to use the integration you defined. The integration becomes available immediately.
### Submit your integration
After you finalize your testing, click **Submit** to submit your integration to the Amplitude team. The review process takes about one week. When Amplitude approves your integration, Amplitude notifies you by email and your integration tile appears in the Destination section of Amplitude.
================================================================================
# Receiving Behavioral Cohorts
URL: https://amplitude.com/docs/partners/receiving-behavioral-cohorts
================================================================================
# Receiving Behavioral Cohorts
Amplitude syncs behavioral cohorts to partner platforms through a series of REST API calls. In a list-based integration, Amplitude creates and updates lists of cohort memberships. In a property-based integration, Amplitude sets a user property or trait.
A behavioral cohort is a group of users who take similar actions, such as those who downloaded a song in a music app or added an item to a cart. You can also define a behavioral cohort as users who don't take a specific action, such as those who downloaded an app but never finished signing up for a subscription.
## Authenticate REST API requests
The REST API uses basic authentication. The partner must send the `api_key` as the username and an empty password.
```bash
curl -u api_key https://[ INSERT URL ]
Setting traits/properties on user:
JSON_HEADERS = {
'Content-Type': 'application/json',
}
Auth: ($api_key, '')
```
## Behavioral cohort considerations
- Amplitude uses a bulk API and batches multiple users in a single API request. By default, batches have 1000 users, but the batch size is configurable.
- You can schedule syncs to export as a one-time sync, or to export hourly or daily.
- The first sync is a full sync of the entire cohort. Subsequent syncs include only the users who have moved in or out of the cohort's definition.
- During the cohort sync, Amplitude sends a separate request for each cohort a user belongs to.
- There aren't explicit rate limits. By default, Amplitude uses 4 threads to make requests to the downstream platform.
- There's no limit to the number of cohorts you can create in Amplitude.
- If a request fails, Amplitude retries eight times with exponential backoff. Retries start with a one-second delay and increase to more than two minutes for the last retry.
## List-based cohort integration
A list-based cohort integration works best if the target system represents a cohort as a list of user identifiers. You must call a list creation API on the first sync. Make subsequent calls to the add API and remove API to keep the list membership up to date.
### List creation
```bash
POST https://your.domain/lists
{
'name': [Amplitude] {$cohort_name}: {$cohort_id},
'context': {
'integration': {
'name': 'Amplitude Cohort Sync',
'version': '1.0.0'
}
}
}
```
### Add users to a list
```bash
POST https://your.domain/lists/$listId/add
{
'userIds':[$userId, $userId, ...]
'context': {
'integration': {
'name': 'Amplitude Cohort Sync',
'version': '1.0.0'
}
}
}
```
### Remove users from a list
```bash
POST https://your.domain/lists/$listId/remove
{
'userIds':[$userId, $userId, ...]
'context': {
'integration': {
'name': 'Amplitude Cohort Sync',
'version': '1.0.0'
}
}
}
```
## Property-based cohort integration
A property-based cohort integration works best with systems that represent cohort membership as a custom user property, such as a boolean flag or a tag. When cohort membership changes, Amplitude invokes the `updateAPI` to update the user property. Although you don't need a list creation API here, you may need to manually create the custom user property.
### Single update
```bash
POST https://your.domain/lists/$listId/remove
{
'type': 'identify',
'traits': {
'[Amplitude] {$cohort_name}: {$cohort_id}': True / False
},
'userId': '$user_id',
'context': {
'integration': {
'name': 'Amplitude Cohort Sync',
'version': '1.0.0'
}
}
}
```
### Batch update
```bash
POST https://your.domain/lists/$listId/remove
{
'batch': [{
'type': 'identify',
'traits': {
'[Amplitude] {$cohort_name}: {$cohort_id}': True / False
},
'userId': '$user_id',
'context': {
'integration': {
'name': 'Amplitude Cohort Sync',
'version': '1.0.0'
}
}
}, {
'type': 'identify',
'traits': {
'[Amplitude] {$cohort_name}: {$cohort_id}': True / False
},
'userId': '$user_id',
'context': {
'integration': {
'name': 'Amplitude Cohort Sync',
'version': '1.0.0'
}
}
}]
}
```
**Responses**:
- **200**: Success
- **400**: Invalid request
- **401**: Unauthorized (bad `api_key`)
- **404**: Invalid User ID
- **429**: Throttling/rate limiting
Amplitude sets the property for cohort members to `true` when a user becomes part of the cohort. Amplitude sets the property to `false` when a user leaves the cohort.
## Test a behavioral cohort integration
To test, Amplitude recommends creating a mock payload that you expect to receive from Amplitude. For cohort integrations, the typical payload structure is as follows:
```bash
curl --location --request POST 'https://app.staging-01.TEST_COMPANY_NAME.com/api/v1/integration/amplitude/cohort \
--header 'api_key: TEST_API_KEY' \
--header 'app_id: TEST_APP_ID' \
--header 'Content-Type: application/json' \
--data-raw '
{
"traits": {
"cohort name:123": true
},
"type": "identify",
"userId": "test.user@email.com"
}
'
```
================================================================================
# DataGrail
URL: https://amplitude.com/docs/data/pii/datagrail
================================================================================
# DataGrail
{% callout type="note" %}
For feedback on this integration or documentation, contact [support@datagrail.io](mailto:support@datagrail.io).
{% /callout %}
[DataGrail](http://www.datagrail.io) is a privacy management platform for system detection and automated data subject request (DSR) fulfillment. DataGrail supports compliance with privacy laws and regulations such as GDPR, CCPA, and CPRA.
The Amplitude integration helps privacy owners identify, retrieve, and delete PII from Amplitude.
## Before you begin
- If you don't have admin rights in Amplitude, you can't complete the DataGrail integration. Contact your Amplitude Admin for help.
- You need a paid DataGrail plan.
## Copy Amplitude credentials
Copy the Amplitude API key and Secret Key for your project. Amplitude doesn't require other setup steps.
## Configure DataGrail
For detailed setup information, refer to the help documentation while logged in to DataGrail.
1. Log in to the DataGrail Portal.
2. Select **Integrations** on the navigation bar, then select **Configure New Integration**.
3. Search for Amplitude by name, then select **Configure**.
4. Enter the API Key and Secret Key.
5. Select **Save Connection** to complete the setup.
Your Amplitude integration is now active. Contact DataGrail's support team (<support@datagrail.io>) with questions.
================================================================================
# Osano
URL: https://amplitude.com/docs/data/pii/osano
================================================================================
# Osano
[Osano](https://www.osano.com/) is a data privacy platform that helps you manage website compliance with laws such as GDPR and CCPA. Osano monitors the vendors that receive your data.
Osano connects to Amplitude with a one-click integration. Osano then discovers and automatically classifies the personal data that Amplitude stores. After Osano finishes discovery and classification, you can include Amplitude in subject rights request searches.
{% callout type="note" heading="" %}
For feedback on this integration or documentation, contact [Osano's support team](https://www.osano.com/company/contact).
{% /callout %}
## Before you begin
- The Osano integration requires an Osano Enterprise plan.
## Copy Amplitude credentials
Copy the Amplitude API key and Secret Key for your project. Amplitude doesn't require other setup steps.
## Configure Osano
1. Log in to the Osano Portal.
2. From the **Data Discovery** menu, open the **Data Stores** page.
3. Select **+** to add a new data store.
4. Select **Connect to third-party vendors to enable automated data discovery**.
5. Select **Amplitude** from the dropdown menu.
6. Paste the Amplitude API key into **API Key**.
7. Paste the Amplitude Secret Key into **Secret Key**.
8. Select a **Data Store Owner** from the dropdown menu.
9. Save your changes.
When you save, Amplitude and Osano immediately begin syncing to detect PII. Manage PII detection results from Osano.
================================================================================
# Transcend
URL: https://amplitude.com/docs/data/pii/transcend
================================================================================
# Transcend
[Transcend](https://transcend.io/) is a privacy platform for data transparency, consent, and control.
Transcend lets you programmatically access and erase user device activity in Amplitude to comply with data privacy regulations such as GDPR and CCPA.
{% callout type="note" heading="Partner-maintained integration" %}
For feedback on this integration or documentation, contact [Transcend's support team](https://transcend.io/integration/amplitude/).
{% /callout %}
## Configure Transcend
For setup instructions, refer to the [Transcend documentation](https://transcend.io/integration/amplitude/).
================================================================================
# Missing or unexpected data
URL: https://amplitude.com/docs/data/troubleshooting/missing-data
================================================================================
# Missing or unexpected data
This page diagnoses three common data problems: a chart that shows fewer events than you expect, user counts that look inflated or too small, and Amplitude numbers that don't match another platform. Each section below covers a common cause and how to fix it.
## Why an event or property is missing
Even when you successfully send data to Amplitude, the event or property may not appear in analysis. The following sections cover common causes.
## The instrumentation limit has been met
If your project hits its [instrumentation limit](https://amplitude.com/docs/faq/limits-and-quotas), Amplitude can't query data for any event types and event or user properties that exceed the limit. You can only access this data by exporting raw data through a CSV file or Amplitude's [Export API](https://amplitude.com/docs/apis/analytics/export).
To get back under the limit, [delete unneeded event types in Amplitude Data](https://amplitude.com/docs/data/remove-invalid-data). After you're under the limit, the new event types, event properties, and user properties take approximately 24 hours to appear in Amplitude.
## Data has been hidden, blocked, or deleted
Someone may have hidden, blocked, or deleted the expected data. Review the [differences between those actions](https://amplitude.com/docs/data/remove-invalid-data) from your `main` branch so Amplitude ingests the data properly.
{% callout type="note" %}
Hidden or blocked events and properties still count toward your project's [instrumentation limit](https://amplitude.com/docs/faq/limits-and-quotas). Deleted events and properties don't.
{% /callout %}
The data may also have a name you don't expect, or have a [display name](https://amplitude.com/docs/data/display-names-in-amplitude-data) you're not familiar with. To adjust the name, refer to the article on [making retroactive changes to your data](https://amplitude.com/docs/data/transformations).
### Hidden events
An event may appear in an event stream but not in a chart. The cause is usually a filter (such as a drop filter) or someone hiding the event from view in Amplitude Data.
{% callout type="note" %}
You can also [hide](https://amplitude.com/docs/data/troubleshooting/instrumentation-issues#hide-block-or-delete-an-event-or-property) events and properties from drop-downs, Pathfinder results, and Personas charts.
{% /callout %}
## Schema doesn't include unplanned data
The missing data might count as unplanned. Unplanned data conflicts with your current schema settings, so Amplitude doesn't know how to handle it. Verify that your project's tracking plan accepts [unplanned events or properties](https://amplitude.com/docs/data/configure-schema). If it doesn't, Amplitude doesn't store the event or its properties.
## Data ingestion or access is delayed
If event or property data appears for some users but not others, ingestion may be delayed. For example, when a [Mobile SDK](https://amplitude.com/docs/sdks/sdk-maintenance-and-support) sends data to Amplitude, events may not appear immediately. The user may not have an internet connection, or the SDK may not have reached its event upload threshold.
{% callout type="note" %}
By default, Amplitude's Mobile SDKs have an event upload threshold of 30 seconds or 30 events. The SDK doesn't send event data until it reaches the threshold.
{% /callout %}
New or modified user properties sent through the [Identity API](https://amplitude.com/docs/data/user-properties-and-events) can also experience ingestion delays.
## Unexpected values in user counts
When you group events by an event or user property, some results may appear in a group called `(none)`. In Amplitude, `(none)` represents a null value.
The following sections explain why users have null or unexpected property values.
### Why does my event property appear in the `(none)` bucket?
Amplitude is an event-based analytics platform, and all charts and cohorts query at the event level. Charts return the event property value at the time of an event.
Because an event property is a component of an event, event property values can be unique at the event level. If you send an event with a null value at the time of the event, grouping by that event property places some events or users in the `(none)` bucket.
For example, User A triggered `Send Message` once on January 1st and once on February 1st. You instrumented the `Audience` event property on January 15th, so the property wasn't available when User A triggered `Send Message` on January 1st. The `Audience` property accepts only `Default` and `Mentioned_Contacts`. When User A sent `Send Message` on February 1st, the event had `Audience = Default`.
Amplitude counts User A once in the `Default` bucket and once in the `(none)` bucket. User A had `Audience = Default` at the time of the February 1st event, and `Audience = (none)` at the time of the January 1st event.
Amplitude sorts events and users according to the property value sent at the time of the event.
### Why doesn't my user property show an expected value?
Like event properties, charts return the user property value at the time of an event.
Amplitude stores user properties in a separate table, then applies them to events. When a user's property values update, the user property values attached to historical events don't change.
### Why does my custom property show a null value?
Custom user properties attached to events reflect the user property values present at the time of the event.
For example, you instrumented a user property called `Account_Type` on January 15th. User A is a registered user with an account type of `Shopper`. User A triggered `Add Item to Cart` once on January 1st and once on February 1st.
Because you didn't instrument `Account_Type` until January 15th, all events triggered before January 15th have a null value for `Account_Type`. Amplitude counts User A once in the `(none)` bucket and once in the `Shopper` bucket.
When measuring Uniques, Amplitude deduplicates users within each unique bucket. If User A triggered `Add Item to Cart` with their `Shopper` account type on both February 1st and February 2nd, Amplitude still counts User A only once in the `Shopper` bucket.
The same logic applies for non-null user property values. Amplitude sorts events and users by the property value applied at the time of the event.
Amplitude uses this logic because user attributes can change over time. `City`, for example, can change by the hour as users travel and send events from different cities. Knowing where the user was at the time of the event can be more valuable than knowing where the user is now.
### My location property shows a `(none)` value. How do I fix it?
Amplitude determines location user properties (such as `[Amplitude] City`, `[Amplitude] DMA`, `[Amplitude] Region`, and `[Amplitude] Country`) by GeoIP. Amplitude uses the [MaxMind](https://www.maxmind.com/en/home) database to look up location information from the user's IP address.
For client-side events, location properties can have `(none)` values when MaxMind returns null for that IP address. The accuracy and availability of city and region information varies by country. For details, refer to [MaxMind's accuracy comparison](https://www.maxmind.com/en/geoip2-city-accuracy-comparison?country=&resolution=50).
For server-side events, Amplitude determines location property values either by GeoIP (which falls back on `location_lat` and `location_long` if unavailable) or by explicit definition in your API call. Amplitude's [HTTP API](https://amplitude.com/docs/apis/analytics/http-v2) lets you send custom `City`, `DMA`, `Region`, and `Country` values with your events. Amplitude doesn't modify these values to reflect GeoIP. Update all four fields together: setting any one of these fields automatically resets all others.
### Why does my device property show a `(none)` value?
Amplitude determines `[Amplitude] Device family` and `[Amplitude] Device type` by reading `device_brand`, `device_manufacturer`, and `device_model` strings from the user's device, then mapping these strings to Amplitude's repository of device types.
When a new phone model launches, Amplitude may not have mapped some device types yet. In these cases, `[Amplitude] Device type` is `(none)`.
Server-side events can also have null device information when you don't update these fields together: `platform`, `os_name`, `os_version`, `device_brand`, `device_manufacturer`, `device_model`, and `carrier`. Setting any of these fields resets all other property values to null unless you set them explicitly for the same event.
## User counts from past events
The user count for an earlier date can fluctuate over time. When you view data on different days, the number of users for an earlier date may increase or decrease.
The user count can increase when Amplitude later ingests events that occurred in the past. Common reasons:
* Amplitude's mobile SDKs batch events with a threshold of every 30 seconds, or every 30 events. When users don't meet the threshold, the SDK may not send their events until they return to your product and trigger more events.
* To resolve this, adjust the event upload frequency. For [Android Kotlin SDK](https://amplitude.com/docs/sdks/analytics/android/android-kotlin-sdk#configure-the-sdk), configure `flushIntervalMillis` or `flushQueueSize`. For [iOS SDK](https://amplitude.com/docs/sdks/analytics/ios/ios-swift-sdk#configure-the-sdk), configure `eventUploadPeriodSeconds` or `eventUploadThreshold`. For other SDKs, refer to the [SDK documentation](https://amplitude.com/docs/sdks/analytics).
* Amplitude's Batch API and server-side integrations have inherent delays.
* To resolve this, schedule batches more frequently.
* If the user's cellular or Wi-Fi connection wasn't strong enough when they triggered events, the SDK holds those events until the connection is stronger.
* There's no remedy for this issue.
The user count can decrease when Amplitude merges user records.
Amplitude uses a system of user IDs, device IDs, and Amplitude IDs to [track unique users](https://amplitude.com/docs/data/sources/instrument-track-unique-users). If some users don't have user IDs, or if you have many anonymous events, Amplitude first assigns these anonymous events to an anonymous profile, then later merges them into a known profile.
Your data stabilizes over time as anonymous users return and merge into existing profiles. The time this takes depends on user behavior (how often they return to your product) and your settings (how often you batch events). Users who interact with your product every day have shorter merge delays. Users who return less frequently have longer delays.
## Data discrepancies with other platforms
Amplitude's numbers may differ from what other vendors report. The cause can vary.
Before you compare numbers, review how Amplitude tracks users and sessions. Refer to [tracking unique users](https://amplitude.com/docs/data/sources/instrument-track-unique-users) and [the definition of a session in Amplitude](https://amplitude.com/docs/data/sources/instrument-track-sessions).
## Data discrepancy checklist
Use the following questions as a troubleshooting checklist for data discrepancies. If you can answer "yes" to a question, that factor is probably not the cause.
### Do the time zones between Amplitude and the other platform align?
If not, align the time zones before comparing numbers. Amplitude timestamps the data it ingests in UTC, but you can customize the time zone [within the Amplitude UI](https://amplitude.com/docs/admin/account-management/manage-orgs-projects#view-and-edit-your-project-information).
### Do the events you currently track in Amplitude match what you're tracking in the other platform?
If not, a discrepancy in users and sessions numbers becomes more likely, because both depend on the events tracked.
### Do Amplitude and the other platform block the same web bots and scrapers?
If not, a discrepancy in users and sessions numbers becomes more likely.
### Do both platforms define the metric of interest the same way?
If not, a discrepancy is more likely.
### Does the other platform merge users the way Amplitude does?
If not, you may see a discrepancy in users and sessions numbers, depending on the identifiers the other platform uses to merge users.
### Is the session timeout window the same between Amplitude and the other platform?
If not, you're more likely to see a discrepancy in sessions numbers.
{% callout type="note" %}
For Amplitude SDKs, the default session timeout windows are 30 minutes for web and 5 minutes for mobile. These thresholds are customizable, so confirm with your developer whether they've been changed.
{% /callout %}
## Sessions in Google Analytics
Google Analytics and Amplitude track sessions similarly, but certain common events can cause a discrepancy in session numbers.
| **Scenario** | **Amplitude** | **Google Analytics** | **Source** |
| --- | --- | --- | --- |
| Time hits midnight | Session continues | The current session ends at 11:59 PM and the new session starts at 12:00 AM. | [Refer to "Time Based Expiration"](https://support.google.com/analytics/answer/2731565#time-based-expiration) |
| Campaign source changes | Session continues | New session begins even if it is within the 30-minute threshold. | [Refer to "Campaign Based Expiration"](https://support.google.com/analytics/answer/2731565#campaign-based-expiration) |
| Session Event Limit | No limit | After the first 10 events, tracking is limited to 1 event per second. | [Refer to "Events Per Session Limit"](https://support.google.com/analytics/answer/1033068) |
================================================================================
# Instrumentation and governance issues
URL: https://amplitude.com/docs/data/troubleshooting/instrumentation-issues
================================================================================
# Instrumentation and governance issues
Answers to common instrumentation and governance questions: how Amplitude treats hidden, blocked, and deleted events, how to filter internal and bot traffic, how to modify historical data, and how the date picker handles offsets and exclusions.
## Instrumentation basics
### Can you delete or alter values after ingestion?
After Amplitude ingests data, you can't alter it. Amplitude's architecture uses pre-aggregated sets by the hour, day, week, and month, for both users and events. This approach supports large-scale queries, but requires immutable data.
You can delete data at the individual user level in compliance with GDPR and other privacy laws through the [User Privacy API](https://amplitude.com/docs/apis/analytics/user-privacy).
### How does Amplitude set Device ID?
Amplitude sets Device IDs differently for client-side events (using Amplitude's SDKs) versus server-side events (HTTP API).
* SDKs
* For Android, the Device ID defaults to a randomly generated UUID, unless you opt to use Google's Advertising ID as the Device ID.
* For iOS SDK, Device IDs default to the Identifier for Vendor (IDFV) if available; otherwise the SDK generates them randomly. You can choose instead to use the Advertising Identifier (IDFA), if available.
* Server-side (HTTP API)
* For server-side events, you must manually send Device ID in the event. If no Device ID is available, Amplitude sets the Device ID to a randomly-generated hashed version of the `user_id`. For more details, refer to the [HTTP V2 API](https://amplitude.com/docs/apis/analytics/http-v2).
* If you don't maintain the same Device ID setup for server-side and client-side events, the same user has different Device IDs even when the device model, language, and carrier are the same.
### Can two different events have the same name?
No. Each event name must be unique across an entire project. Amplitude treats two events with the same name as the same event. If you notice two events in a project with the same name, the display name for one of them may have been set to the same name as another event. You can confirm by expanding the event in Amplitude Data to see more details.
### Can you send array values into Amplitude?
Yes. However, Amplitude doesn't support exact matching on array properties. You can use the `contains` operator to filter for values within an array.
* SDK
* [User Property Array](https://amplitude.com/docs/sdks/analytics/browser/browser-sdk-2#arrays-in-user-properties)
* [Event Property Array](https://amplitude.com/docs/sdks/analytics/browser/javascript-sdk#arrays-in-event-properties)
* [HTTP API Array](https://amplitude.com/docs/apis/analytics/http-v2)
### Why does device information (like Device Type or Device Family) return 'null' in my project?
Amplitude returns a null value when it can't parse device information from the device or browser, or when the device isn't mapped in Amplitude's system. To map new device values, contact Amplitude's support team with the following information:
* Manufacturer (for example, samsung).
* Model (for example, sm-g930u).
* Device Family (for example, Samsung Galaxy Phone).
* Device Type (for example, Samsung Galaxy S7).
### Why do my sessions generate new Session ID values?
Events ingested through Amplitude's SDK maintain the same session *if* the events come from the same device. Session ID changes every time the Device ID changes.
The default session timeout for JavaScript SDK is 30 minutes. For iOS/Android, it's five minutes.
### How do you send recurring revenue subscription events?
After the first subscription-related revenue event, Apple or Google must validate whether the subscription is active. If the subscription is active, Amplitude receives the subscription revenue event at the time interval of that subscription.
### How do I filter out bot traffic users?
Amplitude SDKs use the User Agent to populate some user properties (such as device type), but don't collect or store the User Agent itself. Some customers implement logic to store User Agent as a custom user property and remove bot users that way.
Alternatively, if you can determine the IP address of a suspected bot user, you can use Data Filters to block events from that IP address. To learn more, refer to Amplitude's help center article on [blocking bot web traffic](https://amplitude.com/docs/data/block-bot-traffic).
## Block and filter internal users
To keep data clean, Amplitude recommends setting up a development project alongside your production project, and sending test data to the development project only. Testing your production environment can still send internal data into your production project. Because internal user events can falsely inflate your product's metrics, you must block or filter out these events for accurate reporting.
### How do I block specific users?
You can block all internal event data originating from your organization's IP address from ingestion into Amplitude Analytics. Use your project's Data Filters page to set up filters.
To set up a filter to block events from a specified IP address, follow these steps:
1. From Data, navigate to Filters and click *+Create Block Filter*.
2. In the fly-out panel that appears, choose which environment to apply the filter to.
3. Select *Events* from the *Block* drop-down menu.
4. Choose *IP Address* and *equal to* from the two other drop-down menus. Then enter the IP address to block.
5. Click *Block Data*.
6. Repeat steps 4 through 6 for each IP address to block.
{% callout type="note" %}
You must be a manager or admin of your organization to add a data filter.
{% /callout %}
After you set up this filter, Amplitude drops all events sent from your list of IP addresses on ingestion.
This filter doesn't work if you've modified Amplitude's SDK configurations to prevent the collection of IP addresses. The filter only drops events whose collected IP address matches the IPs you've blocked.
### How do I filter out specific users?
You can always segment out internal user events using the Segmentation Module of any Amplitude chart. Segment out users by user ID, device ID, Amplitude ID, IP address, or an identifiable user property (for example, username or email).
### How do I save user segments?
You can save user segments and pin them to your charts so you don't have to recreate filters every time. When you set a saved segment as your default, Amplitude applies that segment to all new charts you create through the *Create Chart* or *New* button. The applied filter then appears on your chart.
### How do I maintain user lists?
Your list of internal users can change over time, and maintaining this list takes effort when your users don't share a common attribute. In these cases, use Amplitude's [behavioral cohorts](https://amplitude.com/docs/analytics/behavioral-cohorts) feature and import a cohort of internal users to block on Amplitude.
You can apply this cohort to charts the same way you apply user properties. After you create a user segment that excludes your internal cohort, save and pin the segment for easy access.
You can also update behavioral cohorts programmatically to maintain your cohort of internal users. Review the [Behavioral Cohorts API](https://amplitude.com/docs/apis/analytics/behavioral-cohorts) for more details.
## Related resources
- [Block bot web traffic](https://amplitude.com/docs/data/block-bot-traffic): Prevent bot traffic from affecting your metrics.
- [Winsorization in Experiment](https://amplitude.com/docs/feature-experiment/advanced-techniques/winsorization-in-experiment): Find and resolve outliers that may skew your experiment results.
## Hide, block, or delete an event or property
The differences between hiding, blocking, and deleting an event or property aren't immediately clear. Hidden and blocked events and properties still count towards your project's instrumentation [limit](https://amplitude.com/docs/faq/limits-and-quotas); deleted events and properties don't.
{% callout type="note" %}
These options only appear in the menu at the top of [Amplitude Data](https://amplitude.com/docs/data) after you select an event or property.
{% /callout %}
### What is a hidden event or property?
Hide an event or property when you don't want users to query on it in Amplitude charts, but still want to collect data for it.
You can hide an event or property from drop-downs, Pathfinder results, and Personas charts:
* Hiding from drop-downs means you can't select that event or property from drop-down lists in any Amplitude chart.
* When you hide the event or property from Pathfinder or Personas results, those charts' calculations exclude that event. Amplitude still ingests the data, and the event or property becomes queryable again after you unhide it.
### What does blocking an event or property do?
Block an event or property when you want to continue querying historical data, but want to stop collecting new data. Blocking helps when a particular event is causing you to hit your monthly event volume limit.
When you block an event or property, Amplitude stops ingesting and processing it. Blocked events and properties that Amplitude ingested before the block remain selectable in drop-downs and usable in charts. Data sent after you create a block doesn't appear in user streams or chart results.
Blocking doesn't stop you from sending that data to Amplitude, so you still receive a success response. Amplitude drops the data before the processing stage, and you can't recover it.
### What happens to deleted events and properties?
Delete an event or property that you no longer need to keep your data structure organized. Too many unnecessary events and properties can lead to hitting your project's instrumentation limit.
As with blocking, Amplitude doesn't ingest deleted events and properties, and you can't recover data sent after deletion. Unlike blocked items, deleted events and properties aren't available in drop-downs.
Charts that include a deleted event or property remain available, but you can't include the deleted item in new charts. If you removed a deleted event from a chart, you can't add it back unless you undelete it. Deleted events still appear in chart results, so to remove or hide chart data for a deleted event, [create a drop filter](https://amplitude.com/docs/data/remove-invalid-data) before deleting the event.
### What are the differences between hiding, blocking, and deleting?
| | Blocked from ingestion | Available in data exports | Available in chart dropdowns | Count towards monthly event volume limit | Count towards 2000 event type limit | In Govern |
| ----------- | ---------------------- | ------------------------- | ---------------------------- | ---------------------------------------- | ----------------------------------- | ----------------- |
| **Blocked** | Yes | No | Yes | No | Yes | All, Blocked |
| **Deleted** | Yes | No | No | No | No | Deleted |
| **Hidden** | No | Yes | No | Yes | Yes | All, Live, Hidden |
## Modify or delete historical data
The Amplitude architecture uses pre-aggregated sets by the hour, day, week, and month for users and events. This approach scales well, but the tradeoff is that data is immutable.
### How do I modify events that Amplitude has already ingested?
If your account is on the Growth or Enterprise plan, refer to [Self-service data deletion in Amplitude](https://amplitude.com/docs/admin/account-management/self-service-data-deletion-in-amplitude).
For other account types, direct modification isn't possible. As a workaround:
1. Export all project data using the [Export API](https://amplitude.com/docs/apis/analytics/export).
2. Clean the data (for example, make the required changes).
3. Upload the cleaned data into a new project using the [Batch API](https://amplitude.com/docs/apis/analytics/batch-event-upload).
### I updated user properties using the Identify API. Why are there still 'none' values in my charts?
The Identify API only updates user property values for future events. You can't change data that Amplitude has already ingested. Send another event for Amplitude to apply the updated property value. For more details on how Amplitude updates user properties, refer to [user properties and events](https://amplitude.com/docs/data/user-properties-and-events).
### I accidentally sent an event for a user. How do I delete this specific event for this specific user?
You can't. Ingested data is immutable. For similar results, try this process:
1. [Delete or block](https://amplitude.com/docs/data/remove-invalid-data) the event:
* This prevents the event from entering Amplitude for all users.
* The event still appears in the user's event stream, but isn't available for querying.
2. If deleting or blocking doesn't work, try the workaround described in the previous FAQ.
### How do I backfill historical data into Amplitude?
Refer to the [Data Backfill Guide](https://amplitude.com/docs/data/data-backfill).
## Date picker behavior
The datepicker selects the timeframe of the analysis you're conducting. You can choose to analyze data collected between two dates, since a specific date, or in the last x days, weeks, or months.
The datepicker has nuances in how it handles time.
## Offset
When you use Last, your queries return data from the specified timeframe, plus the latest still-incomplete interval.
For example, when you set the datepicker to the last 30 days, Amplitude retrieves data from the last 30 full days, plus the hours elapsed today.
To exclude data from the incomplete day, or when you use a delayed batch ingestion system, use an offset. Click +Offset in the datepicker, then enter the number of days to offset by.
To remove the offset, click 'X' near the Offset by text.
## Exclude
When you use Since or the Last x days, weeks, or months options, you can also exclude the current day, week, or month. This helps when the data for the selected timeframe isn't fully available.
To exclude the incomplete time interval from your chart, click +Exclude in the datepicker and select the Incomplete Interval option. The current date no longer appears framed in a dotted line, and Amplitude excludes it from your analysis.
Deselect Incomplete Interval to revert this setting. Use the same process to exclude or include the current week, current month, or current quarter.
{% callout type="note" %}
Amplitude doesn't support using offset and exclude at the same time.
{% /callout %}
### Exclude specific days
You can exclude specific days of the week from your analysis. This option suits organizations that operate on custom schedules. For example, retailers can exclude Sundays when stores aren't open, or SaaS companies can omit weekends to focus on workweek behavior.
Excluding specific days affects both chart visuals and metric calculations like averages and rolling windows.
Exclude specific days supports only the following chart types:
* Segmentation.
* Funnels.
* Data Tables.
* Retention.
* Sessions.
Exclude specific days supports only the following time ranges:
* Last.
* Since.
{% callout type="note" %}
Exclude specific days doesn't work with Period over Period analysis, and it doesn't work with `realtime` intervals.
{% /callout %}
#### How Amplitude handles excluded days
When you exclude days, Amplitude:
* Removes the days from the calculations and from the chart visualization.
* For averages, calculates on the valid days in the window. For example, if you're looking at the range Sunday - Saturday (7 days) with Wednesday removed:
* For non-average time series analysis, the data shows as normal with Wednesday removed.
* For aggregate data analysis, the data doesn't count the Wednesday in the aggregation.
* For averaging analysis (such as the rolling window), Amplitude doesn't count the dropped days in the numerator or the denominator. If you have a 7-day rolling window, Amplitude treats the data point as a 0 and divides the average based on the valid days in the window (6 days in this example).
* For non-daily or non-hourly intervals analysis, Amplitude doesn't remove data from the chart or the table. However, the data still has the underlying days removed.
This method avoids artificially low averages and maintains consistent windowing on charts.
## Time input
When you use Since or Between, you can narrow the range further by enabling time input. Time input lets you enter a start time or an end time to add granularity to your analysis.
{% callout type="note" %}
The datepicker's time input feature is only available for Event Segmentation and Funnel Analysis charts.
{% /callout %}
To enable time granularity, click +Time in the datepicker. After you enable time input, enter the start or end times in hours, minutes, and seconds to accompany your selected date range.
To turn off time input, click the 'X' near the entered time.
## Presets
The datepicker also supports presets to streamline repetitive analysis and ensure consistency across teams.
### Using presets
Presets give you quick access to predefined time ranges, including:
* Last 7 days.
* Last month.
* Year to date.
* Custom fiscal periods.
When you select a preset, the datepicker automatically fills in the associated time range.
### Custom presets
You can create custom presets for recurring analysis windows like product launches, campaigns, or testing periods. Presets can include:
* Specific start/end dates.
* Relative timeframes (for example, "Last 60 days").
* Optional exclusions (like incomplete data or specific weekdays).
Amplitude defines presets at the project level, and they're available across the project. Admins and managers can create, edit, and manage these presets in Project Settings.
### Default presets
Users can also define their own default preset for a given project. This preset automatically applies when creating new charts.
## New orgs can't open the menu
### Why can't new users navigate the left-hand menu?
When you create a new org on Amplitude, all team members start on the Amplitude *Settings* page. They don't have an option to open the left-hand menu. New users can appear "stuck" on the *Settings* page, unable to navigate to any other page on Amplitude.
This happens because Amplitude can't populate any charts until it has data to work with. To open the left-hand menu, first set up your data sources and send data to Amplitude. After the charts have data to query on, your left menu expands and you can navigate through the Amplitude UI.
## Firefox ingestion failure
### Why does Firefox block the Amplitude SDK?
In Firefox, the tracking protection feature is automatically enabled in standard mode. Amplitude can't record events when you switch this feature to "strict," or when you use a private browser window. Tracking protection blocks cross-site trackers to protect user privacy when browsing across the web.
To read more about what tracking protection is and how it affects tracking, refer to [Mozilla's documentation](https://support.mozilla.org/en-US/kb/enhanced-tracking-protection-firefox-desktop#w_what-enhanced-tracking-protection-blocks).
Because tracking protection prevents cross-site tracking, it blocks the Amplitude SDK. Firefox blocks the network requests, which causes events to fail ingestion.
The following error appears when tracking protection is enabled in the Firefox browser:
Failed POST request.
### How do I fix the ingestion issue?
According to the Amplitude engineering team, the best solution is to build a proxy server and point the JS SDK at it. Refer to the [documentation on how to create a proxy](https://amplitude.com/docs/analytics/domain-proxy) to learn more.
================================================================================
# Integrations and source troubleshooting
URL: https://amplitude.com/docs/data/troubleshooting/integrations-and-sources
================================================================================
# Integrations and source troubleshooting
This page covers troubleshooting for Amplitude data sources and integrations: missing events and properties from Segment, incorrectly tracked sessions, iOS 14 IDFA changes, missing mobile attribution events, and how to instrument Amplitude on third-party site builders like Wix and Squarespace.
## Segment-Amplitude integration
## Missing events
### Why don't I see any data in Amplitude?
If the event isn't in Segment, then it isn't in Amplitude. Confirm that your requests from Segment received a successful response before considering an event missing.
After you confirm that the event is in Segment and got a successful response, confirm these three things:
1. Is Amplitude enabled as a destination?
2. Is the correct API Key entered?
Verify the Amplitude API Key value in project settings in your Amplitude UI matches the one in Segment.
3. Is the syntax correct?
Instrumentation errors aren't always obvious. Check the code for syntax errors (the browser Console tab can help).
After you confirm these requirements, send data to Amplitude by calling `track`. Data appears after you track your first event.
### Are you over the event-type instrumentation limit?
If you went [over the limit](https://amplitude.com/docs/faq/limits-and-quotas), Amplitude doesn't ingest any data sent after that. To ingest more event types, delete events to get back under the limit.
### Is the event deleted or blocked from Amplitude?
Check your deleted and blocked events. Deleting event types also blocks all future instances of events with the same name. If you send data to a deleted or blocked event name in Amplitude, the data doesn't come through.
### Are there any errors in Segment's debugger?
Check your Debugger tab for errors. If the missing event doesn't appear in the Debugger, send a test event of that event type. If the event doesn't reach Segment, it doesn't appear in Amplitude.
### Does the event exist in Segment?
For track calls, you can choose to send only certain events to certain integrations. Verify that the event is sending and that Amplitude is enabled.
You can also enable or disable specific integrations directly in the instrumentation code. Check that Amplitude isn't disabled in the code.
For page and screen calls, you can't see all the individual page names, but the activity shows whether Segment is receiving page calls.
You can also check the raw JSON of the requests to verify whether the Amplitude integration is turned off:
```json
"integrations": {
"Amplitude": false
}
```
## Missing properties
### What is the difference between an event property and a user property?
The article on [user properties and events](https://amplitude.com/docs/data/user-properties-and-events) explains the difference between the two types of properties.
### Why don't I see any user properties or only [Amplitude] user properties?
To send user properties through [Segment](https://segment.com/), call `identify` and include your user properties in the `traits` field. Refer to the [Segment documentation](https://segment.com/docs/spec/identify/) for more on the `identify` call.
### Are you over the event property type instrumentation limit?
If you went [over the limit](https://amplitude.com/docs/faq/limits-and-quotas), properties may be missing in Amplitude. Amplitude doesn't ingest any data sent after you exceed the limit. Delete properties to get back under the limit and ingest new properties.
### Is the property deleted or blocked from Amplitude?
Check your deleted and blocked properties. Deleting properties also blocks all future instances of properties with the same name. If you send data to Amplitude with a deleted or blocked property name, the data doesn't come through.
### Did the property come through in the raw payload to Segment?
If the property isn't in Segment, it isn't in Amplitude. Check Segment's debugger to confirm that the property appeared in Segment first.
### Does the property exist in Segment's schema?
Check your tracked properties and confirm they exist in Segment.
### Spot any syntax code errors or other instrumentation errors?
Instrumentation errors aren't always obvious. Check the code for syntax errors (the browser Console tab can help).
Refer to [Segment's specs](https://segment.com/docs/spec/) for how to format your data.
Amplitude has a [limit of 1024 characters](https://amplitude.com/docs/faq/limits-and-quotas). If the property value is too long, the property doesn't appear in Amplitude.
### Why does the location information (city or country) from Segment's data differ from the location information in Amplitude's data?
Amplitude tries to determine the user's location from the user's IP address, if available. This location may differ from the location information Segment recorded.
## Incorrectly-tracked sessions
### What is the definition of a session?
A session is a period of time when the user has the application open in the foreground. If session tracking is available, events logged within the same session share the same session ID. A new session starts when the application enters the foreground after being in the background or closed for more than five minutes.
### Why do all of my events have a `sessionId` of -1?
If you use the Amplitude Classic integration in Cloud mode, Segment doesn't provide session tracking by default, so Session ID appears as -1 in Amplitude. Segment doesn't have a [concept for a session](https://segment.com/blog/facts-vs-stories-why-segment-has-no-sessions-api/). You must pass in the sessionId for your server-side calls from Segment to Amplitude. For more details, refer to [Segment's Amplitude integration docs](https://segment.com/docs/integrations/amplitude/#sessionid%C2%A0).
If you use Segment's client-side bundled integration, the integration uses Amplitude's native SDKs, which track Session IDs for you. Segment provides these options:
* Use the integration in device mode and use Amplitude's native SDKs' default session tracking. For details, refer to the [Segment source catalog](https://amplitude.com/docs/data/source-catalog/segment).
* If you use the Amplitude Actions integration from Segment, session tracking is available in Segment's new libraries [Analytics.js 2.0](https://segment.com/docs/connections/sources/catalog/libraries/website/javascript/), [Swift](https://github.com/segmentio/analytics-swift), or [Kotlin](https://github.com/segmentio/analytics-kotlin). For details, refer to [Segment's Amplitude Actions docs](https://segment.com/docs/connections/destinations/catalog/actions-amplitude/#connection-modes-for-amplitude-actions-destination).
### Why are there no session length calculations in Amplitude Dashboard?
When Session ID is -1 (refer to the previous answer), Amplitude can't calculate session length.
### What if Segment's SDK doesn't support feature X? [device-mode]
The Segment SDK might not have all the APIs the Amplitude SDK provides. You can still access features by directly calling Amplitude's SDKs.
### Still have questions?
Submit a Support ticket with the following details:
* What type of connection are you using? ([cloud-mode or device-mode](https://segment.com/docs/connections/destinations/#connection-modes)).
* Do you have any destination filters enabled?
* Do you see any errors in the *Event Delivery* tab?
* Confirm that you're using the correct API Key for the Amplitude destination.
Also share the raw data for an event that should have been in Amplitude but is missing. Amplitude needs a full payload of the event, including the endpoint used, header, and body.
## iOS 14 changes
At WWDC 2020, Apple announced that iOS 14 requires users to opt in to tracking. The IDFA is only present for users who explicitly opt in, and the percentage of users who do so is likely to be low.
This article covers frequently asked questions about Apple's iOS 14 IDFA changes.
### Does Amplitude accept IDFA (Identifier for Advertisers) as the device identifier on iOS?
By default, Amplitude's iOS SDK uses IDFV (Identifier for Vendor) for the device ID. You can change this and use any value as the device identifier. The SDK includes an option to use IDFA as the device ID, but this option only works if the user has permitted the application to use IDFA.
### What are the implications of Apple's IDFA changes on user tracking?
For logged-in users, there's no impact. Even if the device ID changes, events continue to merge from devices when Amplitude receives a common user ID. Anonymous users have some potential for impact.
For anonymous users, there are no changes in most cases, because most Amplitude customers don't set IDFA as the device ID. For customers who do set IDFA as the device ID, Amplitude stores the device ID when the SDK initializes, and the SDK continues to send Amplitude the same ID as long as the application remains installed on the device.
If a user deletes and reinstalls an application that uses IDFA for device ID, the SDK doesn't retain the former device ID. Instead, the SDK generates a new random device ID, unless the user grants the application permission to use IDFA.
For all new application installs, the SDK accepts IDFA if the user has opted in and the application chooses to use IDFA.
### Does Amplitude require IDFA on attribution events?
No. Amplitude's attribution API accepts both IDFA and IDFV, and tries to match those IDs to user events Amplitude receives later. In some cases, IDFV is enough to make a match, but some Amplitude customers' attribution providers only send IDFA. For these customers, Amplitude can no longer match attribution events unless the user has explicitly opted in to both the referring and installed application.
Some attribution vendors are likely to stop sending individual attribution events. Vendors are unlikely to send aggregated data to Amplitude (because of the nature of the platform), unless customers or attribution vendors can segment that data and use it to set user properties.
### How does this affect outbound integrations?
If you send data to outbound integrations, you see a lower match rate when using IDFA to match devices between Amplitude and the integration. Amplitude recommends switching to IDFV or another common identifier instead.
## Missing mobile attribution events
Mobile attribution partners identify events using advertising IDs like IDFA, IDFV, or ADID. Amplitude identifies users based on a combination of `user_id`, `device_id`, and `amplitude_id`.
Amplitude's [Attribution API](https://amplitude.com/docs/apis/analytics/attribution) reconciles these differences and maps attribution events to existing users in Amplitude. Some mobile attribution partners (Appsflyer, Adjust, Branch, and Singular) use this API to send their non-custom, standard data with the advertising IDs as the identifier.
Amplitude stores unmapped attribution events for 72 hours. During that time, Amplitude looks for a matching IDFA, IDFV, or ADID on an existing user in an Amplitude project. If a match exists, Amplitude routes the attribution event to that user. If no match exists, Amplitude drops the attribution event after 72 hours.
To support this process, instrument Amplitude with advertising IDs enabled.
## Why mobile attribution events may be missing
You can resolve some causes quickly:
* The attribution events didn't successfully send to Amplitude. Confirm that the attribution partner receives a success response (for example, a 200) when sending events.
* Your project has reached the [instrumentation limit](https://amplitude.com/docs/faq/limits-and-quotas). Delete event types or properties to allow Amplitude Analytics to ingest new event types and properties.
* You blocked or deleted the event type in the Amplitude project. Restore the event type or property through Amplitude Data to fix the issue.
Other causes require more investigation:
* No existing user in Amplitude with the matching IDFA, IDFV, or ADID.
* Amplitude didn't complete mapping within 72 hours.
## Troubleshoot: No existing user in Amplitude with the matching IDFA, IDFV, or ADID
This is the top reason why Amplitude Analytics doesn't ingest mobile attribution events. You must instrument Amplitude before you can send mobile attribution events.
### Determine if you're tracking advertising IDs
Advertising IDs are IDFA, IDFV, or ADID. If you track advertising IDs in your Amplitude events, Amplitude Analytics captures their value in the respective property field. For security and PII reasons, advertising IDs don't appear as a usable property, and Amplitude removes advertising IDs from your raw data after capture (unless you instrument advertising IDs as a custom property).
Amplitude stores a hashed version of the advertising IDs in a field called `amplitude_attribution_ids`. Use this field to determine whether you're instrumenting advertising IDs. If the value is `null`, Amplitude captured no advertising IDs for this user.
A `null` value generally means either that you haven't instrumented Amplitude Analytics to capture advertising IDs, or that the end user has opted out of advertising ID tracking.
You must honor user opt-outs. If you track advertising IDs properly and want to confirm that `amplitude_attribution_ids = null` results from a user opt-out, contact Amplitude Support.
### Solution: Tracking advertising IDs
If you use JavaScript, which can't track advertising IDs automatically, send an Amplitude event with the advertising ID through the [HTTP API](https://amplitude.com/docs/data/sources/instrument-track-unique-users).
## Troubleshoot: Mapping didn't happen within 72 hours
Amplitude holds an attribution event for 72 hours. If Amplitude doesn't make a match during that time, Amplitude drops the event.
For example, User A downloads a game app on December 1 but doesn't open the app until December 7:
* Mobile attribution partners list an Install event for User A on December 1 and send that event to Amplitude on December 1.
* User A doesn't record their first event in Amplitude until they open the app on December 7. Amplitude considers User A a new user on December 7.
Amplitude drops User A's `Install` event because User A didn't exist in Amplitude within 72 hours of the attribution event. User A only existed in Amplitude seven days after the `Install` event, which is longer than the 72-hour holding period.
### Determine if the attribution event came too early
Amplitude's iOS SDKs capture IDFV as `device_id` by default. If you use the default setting for iOS SDKs, use this process to troubleshoot:
1. Identify an iOS SDK user in Amplitude who doesn't have an `Install` event, even though there is a value for `amplitude_attribution_ids`.
2. Copy the `device_id` (IDFV) of that user.
3. With your mobile attribution provider, look for the `Install` event of the IDFV.
4. Check the date on the `Install` event.
5. Compare that date to the New User date in Amplitude.
The mobile attribution provider likely sent the `Install` event more than 72 hours before the user existed in Amplitude.
You can also check whether a user already exists in Amplitude by following a similar process:
1. Identify an iOS Install event from the mobile attribution provider that doesn't appear in Amplitude yet.
2. Get the IDFV on that payload.
3. Enter the IDFV in the [user look-up](https://amplitude.com/docs/analytics/user-data-lookup) feature as the device ID.
The IDFV likely doesn't associate with a profile in Amplitude Analytics, which means Amplitude hasn't seen the user yet.
### Solution: Create users before real user activity
An end user exists in Amplitude when Amplitude receives the user's first event. If you don't want to wait on the end user's actions to trigger profile creation, create a profile yourself by either:
* Sending a placeholder event with advertising ID and `device_id` or `user_id` through the HTTP API.
* Creating a profile with advertising ID and `device_id` or `user_id` through the Identity API.
Creating a profile is only possible if you can capture the advertising ID on your own. Maintain the correct `device_id` or `user_id` so you connect real-world user activity to the right profile.
## Instrument on third-party site builders
{% callout type="note" %}
These instructions may become outdated as the third-party platforms covered here make changes and upgrades. Amplitude's Support team provides support for the instructions and processes in this article only; they can't provide recommendations for anything not included here.
{% /callout %}
### How do I instrument Amplitude on a third-party website builder?
If your site runs on a third-party website builder like Wix or Squarespace, most builders have an underlying code base you can use. Add Amplitude's [JavaScript SDK](https://amplitude.com/docs/sdks/analytics/browser/javascript-sdk) to that space, as if you were adding the SDK to a natively-built website. Add the [JavaScript SDK snippet](https://amplitude.com/docs/sdks/analytics/browser/javascript-sdk#install) to the header, and the rest of the JavaScript SDK code in the body.
If you don't have access to the header or underlying source code, you can use [webhooks](https://en.wikipedia.org/wiki/Webhook) to combine a [trigger](https://support.zendesk.com/hc/en-us/articles/203662106) or [automation](https://support.zendesk.com/hc/en-us/articles/203662126) with an HTTP [target](https://support.zendesk.com/hc/en-us/articles/203662136) to Amplitude's server-side endpoint, [HTTP v2](https://amplitude.com/docs/apis/analytics/http-v2).
### How do I instrument Amplitude on Wix?
Wix has a Tracking Tools & Analytics feature, which you can use to embed Amplitude's JavaScript SDK snippet and code in your site.
To do so, follow these steps:
1. Go to [*Settings* in your site's dashboard](https://www.wix.com/my-account/site-selector/?buttonText=Manage%20Settings&title=Select%20a%20Site&autoSelectOnSingleSite=true&actionUrl=https://www.wix.com/dashboard/%7B%7BmetaSiteId%7D%7D/manage-website).
2. Click the *Tracking & Analytics* tab, under *Advanced Settings*.
3. Click *+ New Tool* and select *Custom*.
4. Set up your custom code:
1. Enter your custom code.
2. Select the relevant domain. This option appears only if you have multiple domains.
3. Enter a name for your custom code.
4. Add Code to Pages: Select which pages to add your code to:
* All Pages: Click the dropdown and select either *Load code once*, or [*Load code on each new page*](https://support.wix.com/en/article/custom-code-loading-options).
* Choose specific pages: Begin typing the name of the relevant pages. Then click the checkbox next to the relevant page.
5. Place Code in: Select where to place the code snippet in your site's code.
* Head: This is where to place the [JS SDK install snippet](https://amplitude.com/docs/sdks/analytics/browser/javascript-sdk#install) on every page to track analytics.
* Body: This is where all other calls like [logEvent](https://amplitude.com/docs/sdks/analytics/browser/migrate-from-javascript-sdk-to-browser-sdk-1-0#logevent) and [user properties](https://amplitude.com/docs/sdks/analytics/browser/migrate-from-javascript-sdk-to-browser-sdk-1-0#set-user-properties) should go.
5. Click *Apply*.
Some customers have reported that Wix lets you add header scripts but not call functions from them. One workaround is to put the necessary script in the Public folder.
#### Further reading on Wix
* [Adding custom code to your site](https://support.wix.com/en/article/about-tracking-tools-analytics).
* [Embedding custom code on your site](https://support.wix.com/en/article/embedding-custom-code-to-your-site).
### How do I instrument Amplitude on Squarespace?
Squarespace's Code Injection and Code Block features let you embed Amplitude's JS SDK snippet and code in your site.
{% callout type="note" %}
These features may be premium features, only available in Business and Commerce plans.
{% /callout %}
#### Code Injection
Use Code Injection to add Amplitude's JavaScript SDK install snippet and other scripts that enhance specific parts of your site, like an order confirmation page.
To add JavaScript to a Code Injection field, surround the code with `<script></script>` tags. Site-wide and per-page code injection options are both available. For the per-page code injection option, refer to [Squarespace's Code Injection article](https://support.squarespace.com/hc/en-us/articles/205815908). If you add code to Code Injection, Squarespace may ask you to [disable the code while editing your site](https://support.squarespace.com/hc/articles/205815908#toc-disable-scripts-in-preview).
To add the JavaScript SDK install snippet with Code Injection:
1. Open Code Injection. In the *Home* menu, navigate to *Settings > Advanced > Code Injection*.
2. Add JavaScript SDK code into the appropriate Code Injection fields for the header, footer, lock page, or order confirmation page.
* Header: Code added here goes into the `<head>` tag on every page in your site. The Amplitude JavaScript SDK install snippet belongs here.
* For information on the other three options, refer to [Squarespace's Code Injection article](https://support.squarespace.com/hc/en-us/articles/205815908).
3. After adding your code, click *Save*.
#### Code Block
Use Code Block to set up logEvent, user properties, and similar calls. To add JavaScript to a Code Block field, surround the code with `<script></script>` tags.
To add a Code Block, follow these steps:
1. Edit a page or post, click an insert point, and select *Code* from the menu. For help, refer to [Adding content with blocks](https://support.squarespace.com/hc/articles/206543757).
2. [Add your code](https://support.squarespace.com/hc/en-us/articles/206543167#toc-add-code) in the text field. For event and property calls, refer to the [Browser SDK 2 documentation](https://amplitude.com/docs/sdks/analytics/browser/browser-sdk-2#track-an-event).
3. If you're using the Code Block to [display code snippets](https://support.squarespace.com/hc/en-us/articles/206543167#toc-display-source), check *Display Source*.
4. Click *Apply* to save your changes.
================================================================================
# Metric Explorer (Beta)
URL: https://amplitude.com/docs/analytics/charts/metric-explorer/metric-explorer-build
================================================================================
# Metric Explorer (Beta)
{% beta %}
Use Metric Explorer to:
- Compare event-based and session-based measurements side by side on the same chart, for example, Add to Carts and Sessions over time.
- Build and visualize hybrid formulas that combine event and session inputs in one expression, for example, Revenue per Session or Add to Carts per Session.
- Apply advanced per-metric measurements (rolling average, rolling window, cumulative) to any metric type.
- Run cross-metric analyses in a single chart instead of switching between Segmentation and User Sessions.
Metric Explorer brings the capabilities of the [Segmentation](https://amplitude.com/docs/analytics/charts/event-segmentation/event-segmentation-build) chart and the [User Sessions](https://amplitude.com/docs/analytics/charts/user-sessions/user-sessions-track-engagement-frequency) chart into a single chart that supports all metric types. Amplitude offers it as a separate chart in beta so you can validate parity before you adopt it for your everyday analyses.
{% /beta %}
## Before you start
- Enable sessions for your project. Refer to [Track sessions](https://amplitude.com/docs/data/sources/instrument-track-sessions).
- Hybrid formula metrics combine event and session inputs in one expression. Refer to [Hybrid formula metrics](#hybrid-formula-metrics) for how to add them in Metric Explorer.
## Create a Metric Explorer chart
To build a Metric Explorer chart, follow these steps:
1. Click **+ New Chart** and select **Metric Explorer (Beta)** from the chart picker.
2. In the metrics panel, click **+ Add metric** and pick an event, a session metric, a saved metric, or a hybrid formula. You can add multiple metrics of different types to the same chart.
3. To group your results, click **+ Group by**. When at least one metric on the chart is session-scoped, the group-by selector offers event, session, or chart-level scoping. Refer to [Group-by scoping](#group-by-scoping).
4. To filter the population, add **Segments**, or pick a saved segment from Segments V2.
5. Choose a time range and an interval (real-time, hourly, daily, weekly, monthly, or quarterly).
6. Choose a visualization (line or bar) from the visualization picker.
## Supported capabilities
{% callout type="note" heading="Updated regularly" %}
Amplitude updates this table on the regular release cadence. If a capability isn't listed, treat it as not available and use Segmentation or User Sessions in the meantime.
{% /callout %}
| Capability | Notes |
| ---------------------------------- | ------------------------------------------------------------------------------------------------------- |
| Metric types | Events, session metrics, saved metrics, hybrid formula metrics |
| Visualizations | Line, bar |
| Intervals | Real-time, hourly, daily, weekly, monthly, quarterly |
| Time range | All standard ranges, including custom |
| Segments | Standard segments, saved segments, and the Segments V2 picker |
| Group by | Event-level, session-level, or chart-level scoping |
| Breakdown by | Supported |
| Count by | Users or groups |
| Row calculations | Average, median, change, sum |
| Advanced measurements (per metric) | Rolling average, rolling window, cumulative |
| Mixed metric visualization | Amplitude applies a dual Y-axis automatically when you mix percent and non-percent metrics |
| Cart properties | Distribution of Property Value, Semantic Totals (with Events / Items toggle on cart-property group-bys) |
| Comparisons | Period-over-period |
| Dashboards | Replace Events on dashboards |
## Not yet supported
{% callout type="note" heading="Updated regularly" %}
Amplitude updates this list as capabilities ship. Until a capability moves out of this list, use Segmentation or User Sessions for that workflow.
{% /callout %}
- **Visualizations**: stacked area, stacked bar, horizontal bar, pie, KPI
- **Y-axis**: custom Y-axis controls
- **Theming**: color themes
- **Modeling**: QTS (Query Time Sampling), anomaly detection, forecasting
- **Annotations**
- **Microscope**: view groups, view cohort, journeys, replays
- **Event Explorer**
- **Normalize**
- **Show SQL**
- **Save as metric**
- **Export**
## Group-by scoping
When at least one metric on the chart is session-scoped, the **Group by** selector offers a scoping control with three options:
- **Event**: Amplitude evaluates the group-by on the event row that satisfies the metric.
- **Session**: Amplitude evaluates the group-by on the session that contains the event.
- **Chart-level**: Amplitude applies the group-by uniformly across all metrics on the chart.
For event-only metrics on a chart that also contains session metrics, scoping defaults to **Event**. The same scoping rules apply in Metric Explorer as in Data Tables. For the full reference, refer to [Use session metrics in Data Tables](https://amplitude.com/docs/analytics/charts/data-tables/data-tables-use-session-metrics#choose-event-level-or-session-level-group-bys-for-session-metrics).
## Hybrid Formula metrics
Hybrid Formulas combine event and session inputs in one expression. Metric Explorer is one of the surfaces where Hybrid Formulas work. To add one:
1. Click **+ Add metric**, then **Create metric**, then **Hybrid Formula**.
2. Add event inputs and session inputs, then write the expression, for example, `A / S`.
3. To reuse the metric across other Metric Explorer charts and Data Tables, save it.
For the support matrix, common examples, and the measurement reference, refer to [Hybrid Formulas](https://amplitude.com/docs/analytics/charts/metric-explorer/hybrid-formulas).
## FAQ
### Do existing Segmentation and User Sessions charts keep working?
Yes. Amplitude offers Metric Explorer as a separate chart, so existing charts and dashboards keep working unchanged.
### Can I save a Metric Explorer chart to a dashboard?
Yes. You can save Metric Explorer charts and add them to dashboards, and Metric Explorer supports Replace Events on dashboards.
### Can I export a Metric Explorer chart?
Not in the current beta. Use Segmentation or User Sessions if you need to export.
### How do I report a bug or request a capability?
Use the in-product feedback widget, or talk to your customer success manager.
================================================================================
# Hybrid Formulas
URL: https://amplitude.com/docs/analytics/charts/metric-explorer/hybrid-formulas
================================================================================
# Hybrid Formulas
A Hybrid Formula is a formula metric that combines event inputs and session inputs in a single arithmetic expression. Before Hybrid Formulas, formula metrics in Amplitude combined only event inputs, so analyses like Add to Carts per Session or Revenue per Session required two separate charts and a manual calculation.
Hybrid Formulas work in [Data Tables](https://amplitude.com/docs/analytics/charts/data-tables/data-tables-multi-dimensional-analysis) and in the [Metric Explorer](https://amplitude.com/docs/analytics/charts/metric-explorer/metric-explorer-build) chart.
## New formula builder
Hybrid Formulas ship with a redesigned formula builder. Compared to the previous event-only formula builder, the new builder adds:
- **A unified _Measured as_ selector** that lets each input choose between event-level measurements (uniques, totals, property sum, and others) and session-level measurements (Session Totals, Bounce Rate, First Property Value, Last Property Value, and others) in one place, without switching builders.
- **Real-time validity feedback.** Amplitude validates the formula expression as you type and shows which inputs are unresolved or incompatible, so you don't have to save the metric to find out it's broken.
- **Inline access to session inputs** alongside event inputs, with each input labeled by type.
- **Bidirectional conversion** between event-only formulas and Hybrid Formulas. Opening a saved event-only formula in the Hybrid Formula builder loads it with zero session inputs. You can add session inputs and save without losing your event inputs, and you can convert back.
- **A consistent input-naming scheme.** Event inputs start at `A`, and session inputs start at `S`, so the formula expression reads predictably.
The new builder appears wherever Hybrid Formulas work. Event-only formulas built in the legacy builder keep working unchanged, and the legacy builder remains available on surfaces that don't yet support Hybrid Formulas.
## Where Hybrid Formulas work
{% callout type="note" heading="Updated regularly" %}
Amplitude updates this support table as Hybrid Formulas roll out to more surfaces. Check back if a surface you need isn't listed.
{% /callout %}
| Surface | Supported? |
| ------------------------------------------ | ------------------------------------------------------------ |
| Data Tables | Yes |
| Metric Explorer | Yes |
| Saved metric library (reuse across charts) | Yes |
| Event Segmentation | No — continues to use the standard (event-only) formula path |
| User Sessions | No — use a session metric directly |
| Funnels, Retention, Pathfinder | No |
| Experiments | No |
Surfaces that don't yet support Hybrid Formulas keep working as they did before. Amplitude adds support to more surfaces on the regular release cadence.
## Create a Hybrid Formula
### In Data Tables
1. In a Data Table, click **+ Add column**, then **Create metric**, and then **Hybrid Formula**.
2. Add event inputs. Each event input has a letter (`A`, `B`, and so on) and its own measurement (uniques, totals, property sum, and others).
3. Add session inputs. Each session input has a letter starting at `S` (`S`, `T`, and so on) and its own session-scoped measurement (Session Totals, Bounce Rate, Average Session Duration, and others).
4. Write the formula expression using the input letters, for example, `A / S`.
5. (Optional) Click **Save metric** to add the Hybrid Formula to the saved metric library so you can reuse it across Data Tables and Metric Explorer charts.
### In Metric Explorer
1. In a Metric Explorer chart, click **+ Add metric**, then **Create metric**, and then **Hybrid Formula**.
2. Add event inputs. Each event input has a letter (`A`, `B`, and so on) and its own measurement (uniques, totals, property sum, and others).
3. Add session inputs. Each session input has a letter starting at `S` (`S`, `T`, and so on) and its own session-scoped measurement (Session Totals, Bounce Rate, Average Session Duration, and others).
4. Write the formula expression using the input letters, for example, `A / S`.
5. (Optional) Click **Save metric** to add the Hybrid Formula to the saved metric library so you can reuse it across Data Tables and Metric Explorer charts.
## Common examples
| Goal | Inputs | Expression |
| ------------------------------- | ------------------------------------------------------------------ | ------------------- |
| Revenue per Session | `A = sum of revenue on Purchase`, `S = Session Totals` | `A / S` |
| Add to Carts per Session | `A = uniques of Add to Cart`, `S = Session Totals` | `A / S` |
| Sessions per User | `S = Session Totals`, `U = uniques of Any Active Event` | `S / U` |
| Page Views per Session | `A = totals of Page View`, `S = Session Totals` | `A / S` |
| Bounce-adjusted conversion rate | `A = uniques of Purchase`, `S = Session Totals`, `B = Bounce Rate` | `A / (S * (1 - B))` |
## Measurement reference
When you add an input to a Hybrid Formula, the _Measured as_ selector sets how Amplitude measures it. The selector offers the same measurements available on event and session metrics elsewhere in Amplitude. Choosing a measurement from the **Session** group treats that input as a session metric; any other measurement keeps the input as an event metric.
**Main**
| Measured as | What it returns |
| ----------------------- | --------------------------------------------- |
| Unique Users | Distinct active users who triggered the event |
| Event Totals | Total number of event occurrences |
| % of Active Users | Share of active users who triggered the event |
| Average Events per User | Event totals divided by unique users |
| Frequency | Distribution of per-user event counts |
**Properties**
| Measured as | What it returns |
| --------------------------------------------------- | ------------------------------------------------------------------- |
| Sum, average, median, min, or max of property value | Aggregation of a numeric event property |
| Distribution of property value | Histogram of a property's values, or of how often each value occurs |
**Session**
| Measured as | What it returns |
| ------------------------------------------- | -------------------------------------------------------- |
| Session Totals | Total number of sessions |
| Average Sessions per User | Sessions divided by unique users |
| Events per Session | Event totals divided by sessions |
| Bounce Rate | Share of sessions with a single qualifying event |
| Entry Rate or Exit Rate | Share of sessions that start or end on the grouped value |
| Average Session Duration | Total session duration divided by sessions |
| Time Spent per User | Total session duration divided by unique users |
| Distribution of Session Length | Histogram of session durations |
| First Property Value or Last Property Value | First or last value of a property within the session |
**Revenue**
| Measured as | What it returns |
| --------------------------------------- | -------------------------------------- |
| Revenue | Total of the event's revenue property |
| Average Revenue per Active User (ARPAU) | Revenue divided by unique active users |
For the formula functions behind these measurements — for example, `ARPAU`, `REVENUETOTAL`, or `PROPSUM` — refer to [Custom formulas in Amplitude Analytics](https://amplitude.com/docs/analytics/charts/event-segmentation/event-segmentation-custom-formulas).
## Filters and group-bys
Hybrid Formulas honor the same filter and group-by scoping rules as the surface where you use them:
- In **Data Tables**, refer to [Use session metrics in Data Tables](https://amplitude.com/docs/analytics/charts/data-tables/data-tables-use-session-metrics).
- In **Metric Explorer**, refer to [Group-by scoping](https://amplitude.com/docs/analytics/charts/metric-explorer/metric-explorer-build#group-by-scoping).
Global filters on a Data Table apply to both the event and session inputs of a Hybrid Formula.
## Conversion from event-only formula metrics
Existing event-only formula metrics keep working unchanged. If you open a saved event-only formula in the Hybrid Formula builder, it loads as a Hybrid Formula with zero session inputs. You can convert back and forth without losing inputs.
## FAQ
### Why can't I use a Hybrid Formula in the Event Segmentation chart?
Event Segmentation continues to use the standard event-only formula path, so existing charts never enter a broken state. To analyze a Hybrid Formula in a segmentation-style view, use [Metric Explorer](https://amplitude.com/docs/analytics/charts/metric-explorer/metric-explorer-build).
### Can I use a Hybrid Formula in an Experiment?
Not yet. Experiments excludes Hybrid Formulas from the metric picker. Check back as Hybrid Formulas roll out to more surfaces.
### Can I export a Hybrid Formula's data?
In Data Tables, yes — use the Data Table export. Metric Explorer doesn't support export yet.
### Does this work in the EU Data Center?
Yes.
================================================================================
# Build an event segmentation analysis
URL: https://amplitude.com/docs/analytics/charts/event-segmentation/event-segmentation-build
================================================================================
# Build an event segmentation analysis
For most users, Event Segmentation is the foundational Amplitude chart. It shows what your users do in your product. With the **Event Segmentation chart**, you can build analyses that:
- Measure the top events performed over a selected time period.
- Analyze how often users trigger events.
- Determine the count of unique users that trigger events in your product.
- Clarify which users tend to trigger certain events.
Like most Amplitude charts, Event Segmentation charts combine events and event properties with user segments. These analyses can be simple—for example, counting the number of users that fire a specific event—or they can use intricate formulas of events.
This article describes the steps to build a segmentation analysis in Amplitude.
{% callout type="note" heading="See also" %}
To analyze event metrics and session metrics together in a single chart, try [Metric Explorer (Beta)](https://amplitude.com/docs/analytics/charts/metric-explorer/metric-explorer-build).
{% /callout %}
## Before you begin
If you haven't already read up on the basics of [building charts in Amplitude](https://amplitude.com/docs/analytics/charts/build-charts-add-events), do so before proceeding.
Refer to [selecting the best measurement for your Event Segmentation chart](https://amplitude.com/docs/analytics/charts/event-segmentation/event-segmentation-choose-measurement) for more information.
## Set up an event segmentation analysis
An event segmentation analysis shows what different groups of users do in your product. Tell Amplitude which events you're interested in, and which users to include in the analysis.
{% callout type="note" %}
You can include both active and inactive events in your segmentation analyses, but most customers find their Amplitude charts more insightful when they focus on active events.
{% /callout %}
To build an Event Segmentation chart, follow these steps:
1. In the Events Module, select the starting event or metric. Choose a specific event that's instrumented in Amplitude, or tell Amplitude to consider any event as the starting event for this analysis by selecting _Any Event_ from the list of available events.
You can also [create an in-line custom event](https://amplitude.com/docs/analytics/charts/event-segmentation/event-segmentation-in-line-events) or [create a new metric](https://amplitude.com/docs/analytics/charts/data-tables/data-tables-create-metric) at this point.
2. To add properties to your starting event, click _+ Filter by_, select the property name, and specify the property value you're interested in.
{% callout type="note" %}
The list of property values includes those Amplitude ingested into your project during the last 30 days.
{% /callout %}
3. Select another event to include. You can choose up to ten events, and you can add properties to these events.
4. In the Measured As Module, specify how to measure your results. Unique users and event totals are the most common options, but several others are available.
5. In the Segmentation Module, identify the user segment to include in this analysis. To import an already saved segment, click _Saved_ and select the segment you want from the list. Otherwise, Amplitude targets all users.
{% callout type="note" %}
The user segment you select applies to all selected events.
{% /callout %}
6. To build your own user segment instead of importing a saved one, add properties. Click _+ Filter by_, choose the property you want to include, and specify the property value you're interested in.
7. To narrow your focus further, include only users who already performed certain actions. Click _+ Performed_, then choose the event you're interested in.
8. To add another user segment, click _+ Add Segment_, and repeat steps 6 and 7.
{% callout type="note" %}
To break out your starting event by user properties, click _Group segment by_ in the Segmentation Module. For example, to group users by the cities they were in when they triggered the starting event, select _City_ from the property list. Amplitude breaks out the segmentation analysis on a city-by-city basis.
{% /callout %}
In the chart area, your Event Segmentation chart appears, along with a tabular view of your results.
## Customize your chart's Y-axis
If the data in your chart doesn't fit the default scale, customize the chart's Y-axis for better viewability.
To customize the Y-axis, click it on the chart. The Custom Y-axis modal appears.
{% callout type="note" heading="Applicable chart types" %}
Y-axis customization works with Event Segmentation charts.
{% /callout %}
### Axis name and values
By default, the Y-axis name comes from the measurement that the chart displays. For example, if your chart displays event totals, the axis name is `Totals`. To share the chart or provide more context, enter a more descriptive name.
To help the data fit more cleanly on the chart, set minimum and maximum values. By default, a chart's Y-axis starts at zero. Sometimes your data falls in a small range, but with higher value.
In the examples below, the chart on the left uses the default axis values, and the chart on the right has the minimum set to `10000` and the maximum set to `15000`.
Enable **Display data out of the min and max value** so that any data outside the range you set still appears on the chart.
Customize the unit of measure that the chart displays so it represents the data accurately. Choose from:
- Raw number.
- Percent.
- Currency, which defaults to the [currency set at the project level](https://amplitude.com/docs/admin/account-management/currency-unit).
- Custom (add a prefix or suffix).
### Logarithmic scaling
Logarithmic scaling changes the Y-axis from a linear scale to a log scale, where each increment represents a multiplicative factor instead of a fixed amount. Use log scaling when your data spans several orders of magnitude, for example when one event fires thousands of times per day and another fires only a handful.
To enable logarithmic scaling:
1. Click the Y-axis on your chart. The **Custom Y-axis** modal appears.
2. Enable **Log scale**.
### Add a second Y-axis
If the chart displays more than one event, add a second Y-axis for better visibility. For example, on a chart that tracks Weekly Active Users, if you add a second event that measures new users, add a second Y-axis to keep both events visible.
In this example, Weekly Active Users, measured by `Any Active Event`, falls in the range of 12,000 - 13,500. Weekly New Users has a range between 5,500 and 6,000. The second Y-axis displays both events with enough granularity to observe increases and decreases over time.
The second Y-axis supports the same customization options as the primary Y-axis.
{% callout type="note" heading="Dual Y-axis availability" %}
Event segmentation line charts support a dual Y-axis.
{% /callout %}
================================================================================
# Choose the right measurement
URL: https://amplitude.com/docs/analytics/charts/event-segmentation/event-segmentation-choose-measurement
================================================================================
# Choose the right measurement
Amplitude offers several ways to look at your [event segmentation](https://amplitude.com/docs/analytics/charts/event-segmentation/event-segmentation-build) results. This section explains the differences between them.
## Uniques
Uniques is the default measure for the Event Segmentation chart. It displays the total count of unique users in your segment that triggered the event you added in the Events Module. To view the exact count, hover over the data point you're interested in. To inspect the users that make up that data point, click it to activate [Microscope](https://amplitude.com/docs/analytics/microscope).
## Event Totals
Like Uniques, Event Totals is a straightforward, count-based measure. The difference is that instead of counting unique users, it graphs the total number of times users fire a specific event at each data point.
### Counting events and counting items
When you group by a cart property (an array property), Amplitude offers an explicit choice between two counting methods:
- **Counting Events**: counts unique events by deduplicating array property values. If a single event contains multiple items with the same property value, Amplitude counts it as one event.
- **Counting Items**: counts each item within the array property without deduplication. If a single event contains multiple items, each item counts toward the total.
For example, imagine a `Checkout` event with the cart property `item_list.product_category`. If a single `Checkout` event contains two tacos (one Crunchy Taco and one Soft Taco) under the same product category "tacos":
- **Counting Events** counts 1 Checkout event.
- **Counting Items** counts 2 Checkout items.
The default behavior is "Counting Items" (item count). This option appears when you group by a cart property in the Event Totals measurement.
## Active %
This measure graphs the percentage of all [active users](https://amplitude.com/docs/get-started/helpful-definitions) (users that triggered any active event in a specified time frame) that triggered a specific event at each data point.
## Average
The Average measure shows how many times, on average, each user that triggered the event did so.
For any data point, Amplitude calculates this value as the total number of times users triggered the event ÷ the number of users that triggered the event.
{% callout type="note" heading="" %}
Amplitude doesn't include users that didn't trigger the event in this calculation.
{% /callout %}
### Counting events vs. counting items
When you group by a cart property (an array property), Amplitude offers an explicit choice between two counting methods for calculating the average:
- **Counting Events**: calculates the average based on unique events by deduplicating array property values.
- **Counting Items**: calculates the average based on each item within the array property without deduplication.
This option appears when you group by a cart property in the Average measurement. The default behavior is "Counting Items" (item count).
### Example
- User 1 triggers Event A 1 time.
- User 2 triggers Event A 2 times.
- User 3 triggers Event A 0 times (excluded from average).
$$
\text{Average} = \frac{1+2}{2 \text{ users}} = 1.5
$$
## Frequency
When you apply the Frequency measure, Amplitude groups the users in your user segment into buckets defined by the number of times each user triggered an event during the time frame of your analysis. Amplitude renders the results as a histogram.
In the screenshot above, the colored dots represent the default buckets. Click _customize buckets_ to adjust bucket sizing and data distribution, or use the Custom Buckets modal to set individual ranges for each bucket.
To compare bucket distributions across segments with different population sizes, switch the chart to a normalized, PDF, or CDF view. For details on each view, refer to [Distribution chart views](https://amplitude.com/docs/analytics/charts/event-segmentation/event-segmentation-interpret-1#distribution-chart-views).
## Properties
Depending on the details of your analysis, you can also generate an event segmentation chart based on the values of your event or user properties.
- Sum of Property Value: graphs the sum of property values at each data point. To use this measure, the property value must be an integer.
- Average of Property Value: graphs the average of the property values, or the sum of those values divided by the total number of events fired at each data point. To use this measure, the property value must be an integer.
- Distinct Property Values per User: graphs the average count of different property values triggered by each user. It's the total sum of unique user-distinct property value pairs, divided by the number of users.
- Median Property Value: graphs the median property values for each data point. This measure helps most when outliers skew averages noticeably. To use this measure, the property value must be an integer.
### Distribution of Property Value
Distribution of Property Value shows the distribution of event totals broken out by the values of the selected event property. Amplitude renders the results as a histogram. The minimum bucket value is inclusive, and the maximum bucket value is exclusive. Click _customize buckets_ to adjust bucket sizing.
To compare distributions across segments with different sample sizes, switch the chart to a normalized, PDF, or CDF view. For details on each view, refer to [Distribution chart views](https://amplitude.com/docs/analytics/charts/event-segmentation/event-segmentation-interpret-1#distribution-chart-views).
## Formula
In an Event Segmentation chart, you can write formulas for Amplitude to apply to the events you include in your analysis. To read more about each formula and view example use cases, refer to [Custom Formulas](https://amplitude.com/docs/analytics/charts/event-segmentation/event-segmentation-custom-formulas).
To learn how to interpret your Event Segmentation chart, refer to [Interpret your Event Segmentation chart](https://amplitude.com/docs/analytics/charts/event-segmentation/event-segmentation-interpret-1).
================================================================================
# Custom formulas: Syntax and definitions
URL: https://amplitude.com/docs/analytics/charts/event-segmentation/event-segmentation-custom-formulas
================================================================================
# Custom formulas: Syntax and definitions
In an [Event Segmentation](https://amplitude.com/docs/analytics/charts/event-segmentation/event-segmentation-build) or [Data Table](https://amplitude.com/docs/analytics/charts/data-tables/data-tables-multi-dimensional-analysis) chart, the **Formula** option in the Measured As module's Advanced drop-down offers more flexibility when performing analyses. Custom formulas also help compare analyses on the same chart.
Choose from more than 20 custom formulas to plot the metrics you need. You can plot up to ten formulas on the same chart, separated by semicolons.
This article explains the mechanics of custom formulas, with examples of formulas you can use right now.
{% callout type="note" heading="" %}
To combine event and session inputs in one expression, (for example, Revenue per Session or Add to Carts per Session), use a [Hybrid Formula](https://amplitude.com/docs/analytics/charts/metric-explorer/hybrid-formulas) in a Data Table or Metric Explorer chart. The Event Segmentation chart continues to use the standard event-only formula path described on this page.
The Experiment Results chart also uses formula metrics, but in a different way than the Event Segmentation or Data Table charts. For more about those differences, refer to [this Help Center article on using formula metrics in Amplitude's Experiment Results chart](https://amplitude.com/docs/analytics/charts/experiment-results/experiment-results-use-formula-metrics).
{% /callout %}
## Formula syntax
In your formulas, refer to events selected in the Events Module by their corresponding letter. Functions and parameters aren't case sensitive. You can also perform the following arithmetic operations:
- Parenthesis ().
- Addition (+).
- Subtraction (-).
- Multiplication (\*).
- Division (/).
For example, the letter A in the formula `UNIQUES(A)` refers to the event `View Item Details`, while the letter B in the formula `UNIQUES(B)` refers to the event `Add Item to Cart`. This setup displays the ratio of users that viewed an item's details to users that placed an item in their cart.
You can write a formula that consists of events, grouping each event by a property or properties. For the formula to be valid, the properties must have matching values across all events you segment.
For example, if you have an event called `Page Name`, the following property values don't match:
- `Tutorial` and `TUTORIAL` (matching is case sensitive).
- `1` and `1.0` (non-matching characters).
The order in which you group properties also matters. Both events must have the _grouped by_ values in the same order; otherwise, Amplitude shows a warning that events have no matching group-by values.
{% callout type="note" heading="Ranking with multi-term formulas" %}
When you use multi-term formula metrics with group-bys, Amplitude ranks groups by the sum of unique users across all metrics in the formula, not by the final calculated values. This ranking can affect which groups appear in high-cardinality results. For more details, refer to [Column ranking behavior in Data Tables](https://amplitude.com/docs/analytics/charts/data-tables/data-tables-results-and-sorting-logic#column-ranking-behavior).
{% /callout %}
Use custom formulas to uncover how many more times users in one cohort trigger a particular event than users in another cohort do.
To compare a metric between two different cohorts or user segments, add the segment number to the letter that designates the event: `UNIQUES(A1)/UNIQUES(A2)`. This setup displays a ratio of your cohorts' performance on the same event as a single plotted line on your graph.
You can also view your metrics in percentages or dollars by adding the following prefixes to your formula:
- Percentage (%:).
- Dollars ($:).
## List of available formulas
This section lists available formulas by type: Metric, Aggregation, and Function. Click a formula name to review its syntax.
### Metrics formulas
With metrics formulas, you can query a metric for a particular event that interests you. These formulas use green color-coding. Each metrics formula requires a letter that corresponds to the event you're interested in as a parameter.
| | | | |
| ----------------------------- | ------------------------------- | --------------------------------- | --------------------------------- |
| [ACTIVE](#active) | [ARPAU](#arpau) | [AVG](#avg) | [FREQPERCENTILE](#freqpercentile) |
| [HIST](#hist) | [PERCENTILE](#percentile) | [PROPAVG](#propavg) | [PROPCOUNT](#propcount) |
| [PROPCOUNTAVG](#propcountavg) | [PROPHIST](#prophist) | [PROPMAX](#propmax) | [PROPMIN](#propmin) |
| [PROPSUM](#propsum) | [REVENUETOTAL](#revenuetotal) | [TOTALS](#totals) | [UNIQUES](#uniques) |
| [EVENTTOTALS](#eventtotals) | [SESSIONTOTALS](#sessiontotals) | [SEMANTICTOTALS](#semantictotals) | |
### Aggregation formulas
Aggregation formulas let you query a rolling average or rolling window for the metric and event that interests you. These formulas use purple color-coding. Each aggregation formula requires three components: the metric to aggregate, the event that interests you, and the interval to aggregate by.
| | | | |
| ----------------- | ------------------- | ------------------- | ------------------------------- |
| [CUMSUM](#cumsum) | [ROLLAVG](#rollavg) | [ROLLWIN](#rollwin) | [ROLLWINBEFORE](#rollwinbefore) |
### Function formulas
Function formulas let you query a mathematical function for a particular event and metric you're interested in. These formulas use blue color-coding. Each function formula requires a value that's either a constant or another formula that contains an event.
| | | | |
| --------------- | ------------- | ----------------------- | --------------- |
| [EXP](#exp) | [LN](#ln) | [LOG](#log) | [LOG10](#log10) |
| [POWER](#power) | [SQRT](#sqrt) | [TRENDLINE](#trendline) | |
## Metrics formulas
### ACTIVE
{% formula-definition %}
{% card variant="filled" %}
**Syntax**
`ACTIVE(event)`
**Parameters**
| Parameter | Description |
| --------- | --------------------------------------------------------- |
| `event` | A letter that corresponds to an event in the Events card. |
**Returns**
The percentage of active users that triggered the event, in decimal fraction form.
{% /card %}
Returns the percentage of active users that triggered the event.
This is the same as the `Active %` [metric](https://amplitude.com/docs/analytics/charts/data-tables/data-tables-create-metric) in the Measured card, but here it displays in decimal fraction form.
{% callout type="example" heading="Example" %}
`ACTIVE(A)` displays the percentage of active users that have triggered the `View Item Details` event.
{% /callout %}
{% /formula-definition %}
### ARPAU
{% formula-definition %}
{% card variant="filled" %}
**Syntax**
`$:ARPAU(event)`
**Parameters**
| Parameter | Description |
| --------- | ---------------------------------------------------------------- |
| `event` | A letter that corresponds to a revenue event in the Events card. |
**Returns**
The aggregate sum of the revenue event property formatted as a currency, divided by the number of unique active users in that same time period. Equivalent to `PROPSUM(event) / UNIQUES(any active event)`.
{% /card %}
Returns the aggregate revenue per active user, formatted as a currency.
`ARPAU` works only when you group by a numerical property on the event. The `$:` prefix is optional; its presence ensures the output format is a currency.
{% callout type="example" heading="Example" %}
Use `ARPAU` to calculate the average revenue per active user of a generic e-commerce company.
{% /callout %}
{% callout type="note" %}
You can't use `ARPAU` in conjunction with [aggregation formulas](https://amplitude.com/docs/analytics/charts/event-segmentation/event-segmentation-custom-formulas).
{% /callout %}
{% /formula-definition %}
### AVG
{% formula-definition %}
{% card variant="filled" %}
**Syntax**
`AVG(event)`
**Parameters**
| Parameter | Description |
| --------- | ------------------------------------------------------------------------------------ |
| `event` | A letter that corresponds to an event in the left module of the chart control panel. |
**Returns**
The average number of times users triggered the event. Equivalent to `TOTALS(event)/UNIQUES(event)`.
{% /card %}
Returns the average number of times users triggered the event.
{% callout type="example" heading="Example" %}
`AVG(A); AVG(B)` displays the average number of times users triggered `View Item Details` (event A) and the average number of times users triggered `Add Item to Cart` (event B) on the same chart.
{% /callout %}
{% /formula-definition %}
### FREQPERCENTILE
{% formula-definition %}
{% card variant="filled" %}
**Syntax**
`FREQPERCENTILE(event, percentage)`
**Parameters**
| Parameter | Description |
| ------------ | ------------------------------------------------------------------- |
| `event` | A letter that corresponds to an event in the Events card. |
| `percentage` | The percentile that interests you. Must be less than or equal to 1. |
**Returns**
The event frequency at the specified percentile across all users.
{% /card %}
Returns the inputted [percentile](https://en.wikipedia.org/wiki/Percentile) event frequency across all users.
A percentile is a measure that indicates the value below which a given percentage of values fall. Use the result to create a [behavioral cohort](https://amplitude.com/docs/analytics/behavioral-cohorts) of your power users and analyze what distinguishes them from users that aren't in the cohort.
{% callout type="example" heading="Example" %}
`FREQPERCENTILE(A, 0.9)` shows the 90th percentile of users that triggered the `View Item Details` event.
{% /callout %}
{% /formula-definition %}
### HIST
{% formula-definition %}
{% card variant="filled" %}
**Syntax**
`HIST(event)`
**Parameters**
| Parameter | Description |
| --------- | --------------------------------------------------------- |
| `event` | A letter that corresponds to an event in the Events card. |
**Returns**
The distribution of the event frequency per unique user over the selected time period.
{% /card %}
Returns the distribution of the event frequency per unique user over the selected time period.
{% /formula-definition %}
{% formula-definition %}
{% card variant="filled" %}
**Syntax**
`HIST(session)`
**Parameters**
| Parameter | Description |
| --------- | ------------------------------------------------------------ |
| `session` | A letter that corresponds to a session in the Sessions card. |
**Returns**
The distribution of session durations, in seconds, over the selected time period.
{% /card %}
The syntax for `HIST` varies slightly for the [User Sessions chart](https://help.amplitude.com/hc/en-us/articles/231275508-The-User-Sessions-chart-Track-engagement-frequency-and-duration) because sessions are the focus of the metrics.
Use this variant when you want to understand how long user sessions last.
{% /formula-definition %}
### PERCENTILE
{% formula-definition %}
{% card variant="filled" %}
**Syntax**
`PERCENTILE(event, percentage)`
**Parameters**
| Parameter | Description |
| ------------ | ------------------------------------------------------------------- |
| `event` | A letter that corresponds to an event in the Events card. |
| `percentage` | The percentile that interests you. Must be less than or equal to 1. |
**Returns**
The value of the grouped-by property at the specified percentile.
{% /card %}
Returns the inputted [percentile](https://en.wikipedia.org/wiki/Percentile) of the property being grouped by.
{% callout type="note" %}
This function works only when you group by a numerical property on the event.
{% /callout %}
{% callout type="example" heading="Example" %}
`PERCENTILE(A, 0.9)` returns the 90th percentile for revenue of all `Complete Purchase` events. `PERCENTILE` is also useful when tracking load times to ensure that a particular percentage of load times stays below a certain threshold.
{% /callout %}
{% /formula-definition %}
### PROPAVG
{% formula-definition %}
{% card variant="filled" %}
**Syntax**
`PROPAVG(event)`
**Parameters**
| Parameter | Description |
| --------- | --------------------------------------------------------- |
| `event` | A letter that corresponds to an event in the Events card. |
**Returns**
The average of the grouped-by property values. Equivalent to `PROPSUM(event)/TOTALS(event)`.
{% /card %}
Returns the average of the property values you are grouping by.
`PROPAVG` works only when you group by a numerical property on the event. If you group by multiple properties, the formula runs the calculation with the first group-by clause.
{% callout type="note" %}
The `PROPAVG` formula ignores events where the selected property value is `(none)`.
{% /callout %}
{% callout type="example" heading="Example" %}
Use `PROPAVG` to calculate the average revenue generated by completed purchases on a given day.
{% /callout %}
{% /formula-definition %}
### PROPCOUNT
{% formula-definition %}
{% card variant="filled" %}
**Syntax**
`PROPCOUNT(event)`
**Parameters**
| Parameter | Description |
| --------- | --------------------------------------------------------------------------------------------------------------------------------------------------------------- |
| `event` | A letter that corresponds to an event in the Events card. If you group by multiple properties, the formula runs the calculation with the first group-by clause. |
**Returns**
The number of distinct property values for the property the event is grouped by.
{% /card %}
Returns the number of distinct property values for the property the event is grouped by.
`PROPCOUNT` is an estimate of distinct property values. The estimate comes from a [HyperLogLog algorithm](https://en.wikipedia.org/wiki/HyperLogLog), and its accuracy depends on the amount of data it has to work with. Expect a relative error in the range of 0.1% for fewer than 12,000 unique values, and up to 0.5% for more than 12,000 unique property values, depending on the cardinality of the property.
{% callout type="example" heading="Example" %}
In a DAU chart, `PROPCOUNT(A)` retrieves the number of different countries that had an active user during the given period.
{% /callout %}
{% /formula-definition %}
### PROPCOUNTAVG
{% formula-definition %}
{% card variant="filled" %}
**Syntax**
`PROPCOUNTAVG(event)`
**Parameters**
| Parameter | Description |
| --------- | --------------------------------------------------------------------------------------------------------------------------------------------------------------- |
| `event` | A letter that corresponds to an event in the Events card. If you group by multiple properties, the formula runs the calculation with the first group-by clause. |
**Returns**
The average number of distinct values each user has for the grouped-by property.
{% /card %}
Returns the average number of distinct values each user has for a specified property.
{% callout type="example" heading="Example" %}
A music app captures a `Genre_Type` property on each `Play Song or Video` event. Running `PROPCOUNTAVG` on `Play Song or Video` grouped by `Genre_Type` returns the average number of unique `Genre_Type` values per user that fires `Play Song or Video`.
{% /callout %}
{% /formula-definition %}
### PROPHIST
{% formula-definition %}
{% card variant="filled" %}
**Syntax**
`PROPHIST(event)`
**Parameters**
| Parameter | Description |
| --------- | --------------------------------------------------------- |
| `event` | A letter that corresponds to an event in the Events card. |
**Returns**
The distribution of the grouped-by property values over the selected time period.
{% /card %}
Returns the distribution of the property values you are grouping by over the selected time period.
`PROPHIST` works with numeric group-by properties on the event. If you group by multiple properties, the formula runs the calculation with the first group-by clause.
{% callout type="example" heading="Example" %}
`PROPHIST(A)` displays a histogram of cart values of users that completed a purchase during the selected window.
{% /callout %}
{% /formula-definition %}
### PROPMAX
{% formula-definition %}
{% card variant="filled" %}
**Syntax**
`PROPMAX(event)`
**Parameters**
| Parameter | Description |
| --------- | --------------------------------------------------------------------------------------------------------------------------------------------------------------------------------------- |
| `event` | A letter that corresponds to an event in the Events card. The grouped-by property must be numeric. If you group by multiple properties, the calculation uses the first group-by clause. |
**Returns**
The maximum value of the grouped-by property for the specified event.
{% /card %}
Returns the maximum value of the property you are grouping the event by.
{% /formula-definition %}
### PROPMIN
{% formula-definition %}
{% card variant="filled" %}
**Syntax**
`PROPMIN(event)`
**Parameters**
| Parameter | Description |
| --------- | --------------------------------------------------------------------------------------------------------------------------------------------------------------------------------------- |
| `event` | A letter that corresponds to an event in the Events card. The grouped-by property must be numeric. If you group by multiple properties, the calculation uses the first group-by clause. |
**Returns**
The minimum value of the grouped-by property for the specified event.
{% /card %}
Returns the minimum value of the property you are grouping the event by.
{% /formula-definition %}
### PROPSUM
{% formula-definition %}
{% card variant="filled" %}
**Syntax**
`PROPSUM(event)`
**Parameters**
| Parameter | Description |
| --------- | ---------------------------------------------------------------------------------------------------------------------- |
| `event` | A letter that corresponds to an event in the Events card. The event must be grouped by the property you'd like to sum. |
**Returns**
The sum of the grouped-by property values for the specified event.
{% /card %}
Returns the sum of the property values you are grouping the event by.
`PROPSUM` works only when you group by a numerical property on the event. If you group by multiple properties, the formula runs the calculation with the first group-by clause.
{% callout type="example" heading="Example" %}
`PROPSUM(A)` shows the total revenue generated by the `Complete Purchase` event.
{% /callout %}
{% /formula-definition %}
{% formula-definition %}
{% card variant="filled" %}
**Syntax**
`PROPSUM(session)`
**Parameters**
| Parameter | Description |
| --------- | ------------------------------------------------------------ |
| `session` | A letter that corresponds to a session in the Sessions card. |
**Returns**
The total time, in seconds, summed across all matching sessions.
{% /card %}
The syntax for `PROPSUM` varies slightly for the [User Sessions chart](https://help.amplitude.com/hc/en-us/articles/231275508-The-User-Sessions-chart-Track-engagement-frequency-and-duration) because sessions are the focus of the metrics.
The chart below shows the total time, in seconds, summed across all sessions.
{% /formula-definition %}
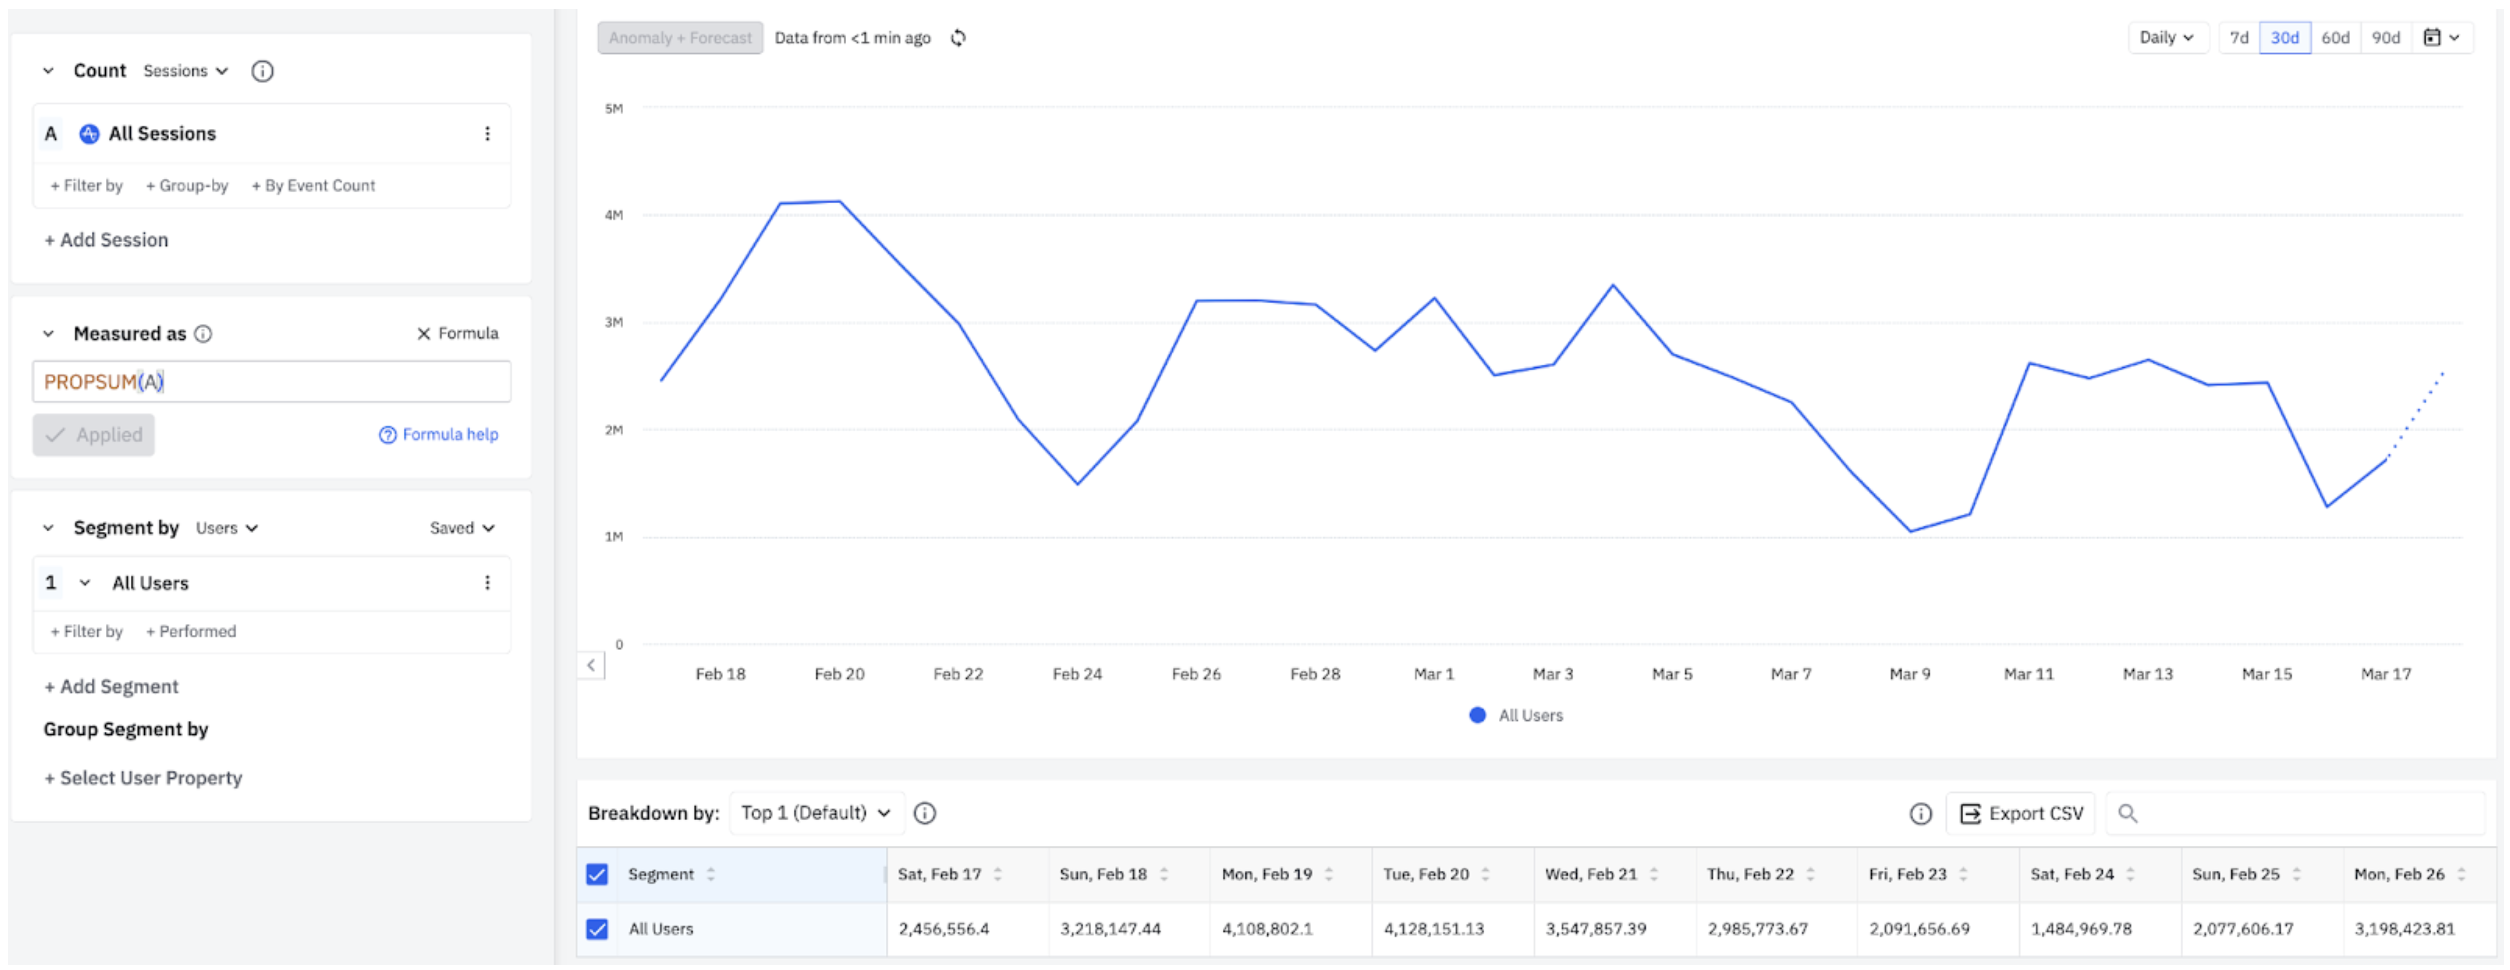
### REVENUETOTAL
{% formula-definition %}
{% card variant="filled" %}
**Syntax**
`$:REVENUETOTAL(event)`
**Parameters**
| Parameter | Description |
| --------- | ---------------------------------------------------------------- |
| `event` | A letter that corresponds to a revenue event in the Events card. |
**Returns**
The aggregate sum of the property, formatted as a currency. Equivalent to `PROPSUM(event)`.
{% /card %}
Returns the aggregate sum of a revenue property, formatted as a currency.
`REVENUETOTAL` works only when you group by a numerical property on the event. The `$:` prefix is optional; its presence ensures the output format is a currency.
{% callout type="example" heading="Example" %}
`$:REVENUETOTAL(A)` shows the total revenue by day generated by purchases.
{% /callout %}
{% /formula-definition %}
### TOTALS
{% formula-definition %}
{% card variant="filled" %}
**Syntax**
`TOTALS(event)`
**Parameters**
| Parameter | Description |
| --------- | ------------------------------------------------------------------------------------ |
| `event` | A letter that corresponds to an event in the left module of the chart control panel. |
**Returns**
The total number of times users triggered the event.
{% /card %}
Returns the total number of times users triggered the event.
{% callout type="example" heading="Example" %}
`TOTALS(A); TOTALS(B)` shows the total number of times users viewed an item's details (event A) plus the total number of times users added an item to a cart (event B).
{% /callout %}
{% /formula-definition %}
### UNIQUES
{% formula-definition %}
{% card variant="filled" %}
**Syntax**
`UNIQUES(event)`
**Parameters**
| Parameter | Description |
| --------- | --------------------------------------------------------- |
| `event` | A letter that corresponds to an event in the Events card. |
**Returns**
The number of unique users that triggered the event.
{% /card %}
Returns the number of unique users that triggered the event.
{% /formula-definition %}
{% formula-definition %}
{% card variant="filled" %}
**Syntax**
`UNIQUES(session)`
**Parameters**
| Parameter | Description |
| --------- | ------------------------------------------------------------ |
| `session` | A letter that corresponds to a session in the Sessions card. |
**Returns**
The number of unique users that engaged in the specified session.
{% /card %}
The syntax for `UNIQUES` varies slightly for the [User Sessions chart](https://help.amplitude.com/hc/en-us/articles/231275508-The-User-Sessions-chart-Track-engagement-frequency-and-duration) because sessions are the focus of the metrics.
{% callout type="example" heading="Example" %}
`UNIQUES(A)/UNIQUES(B)` shows the ratio of users that engaged in sessions longer than one minute to the users that engaged in sessions that contained at least one `Search Items` event.
{% /callout %}
{% /formula-definition %}
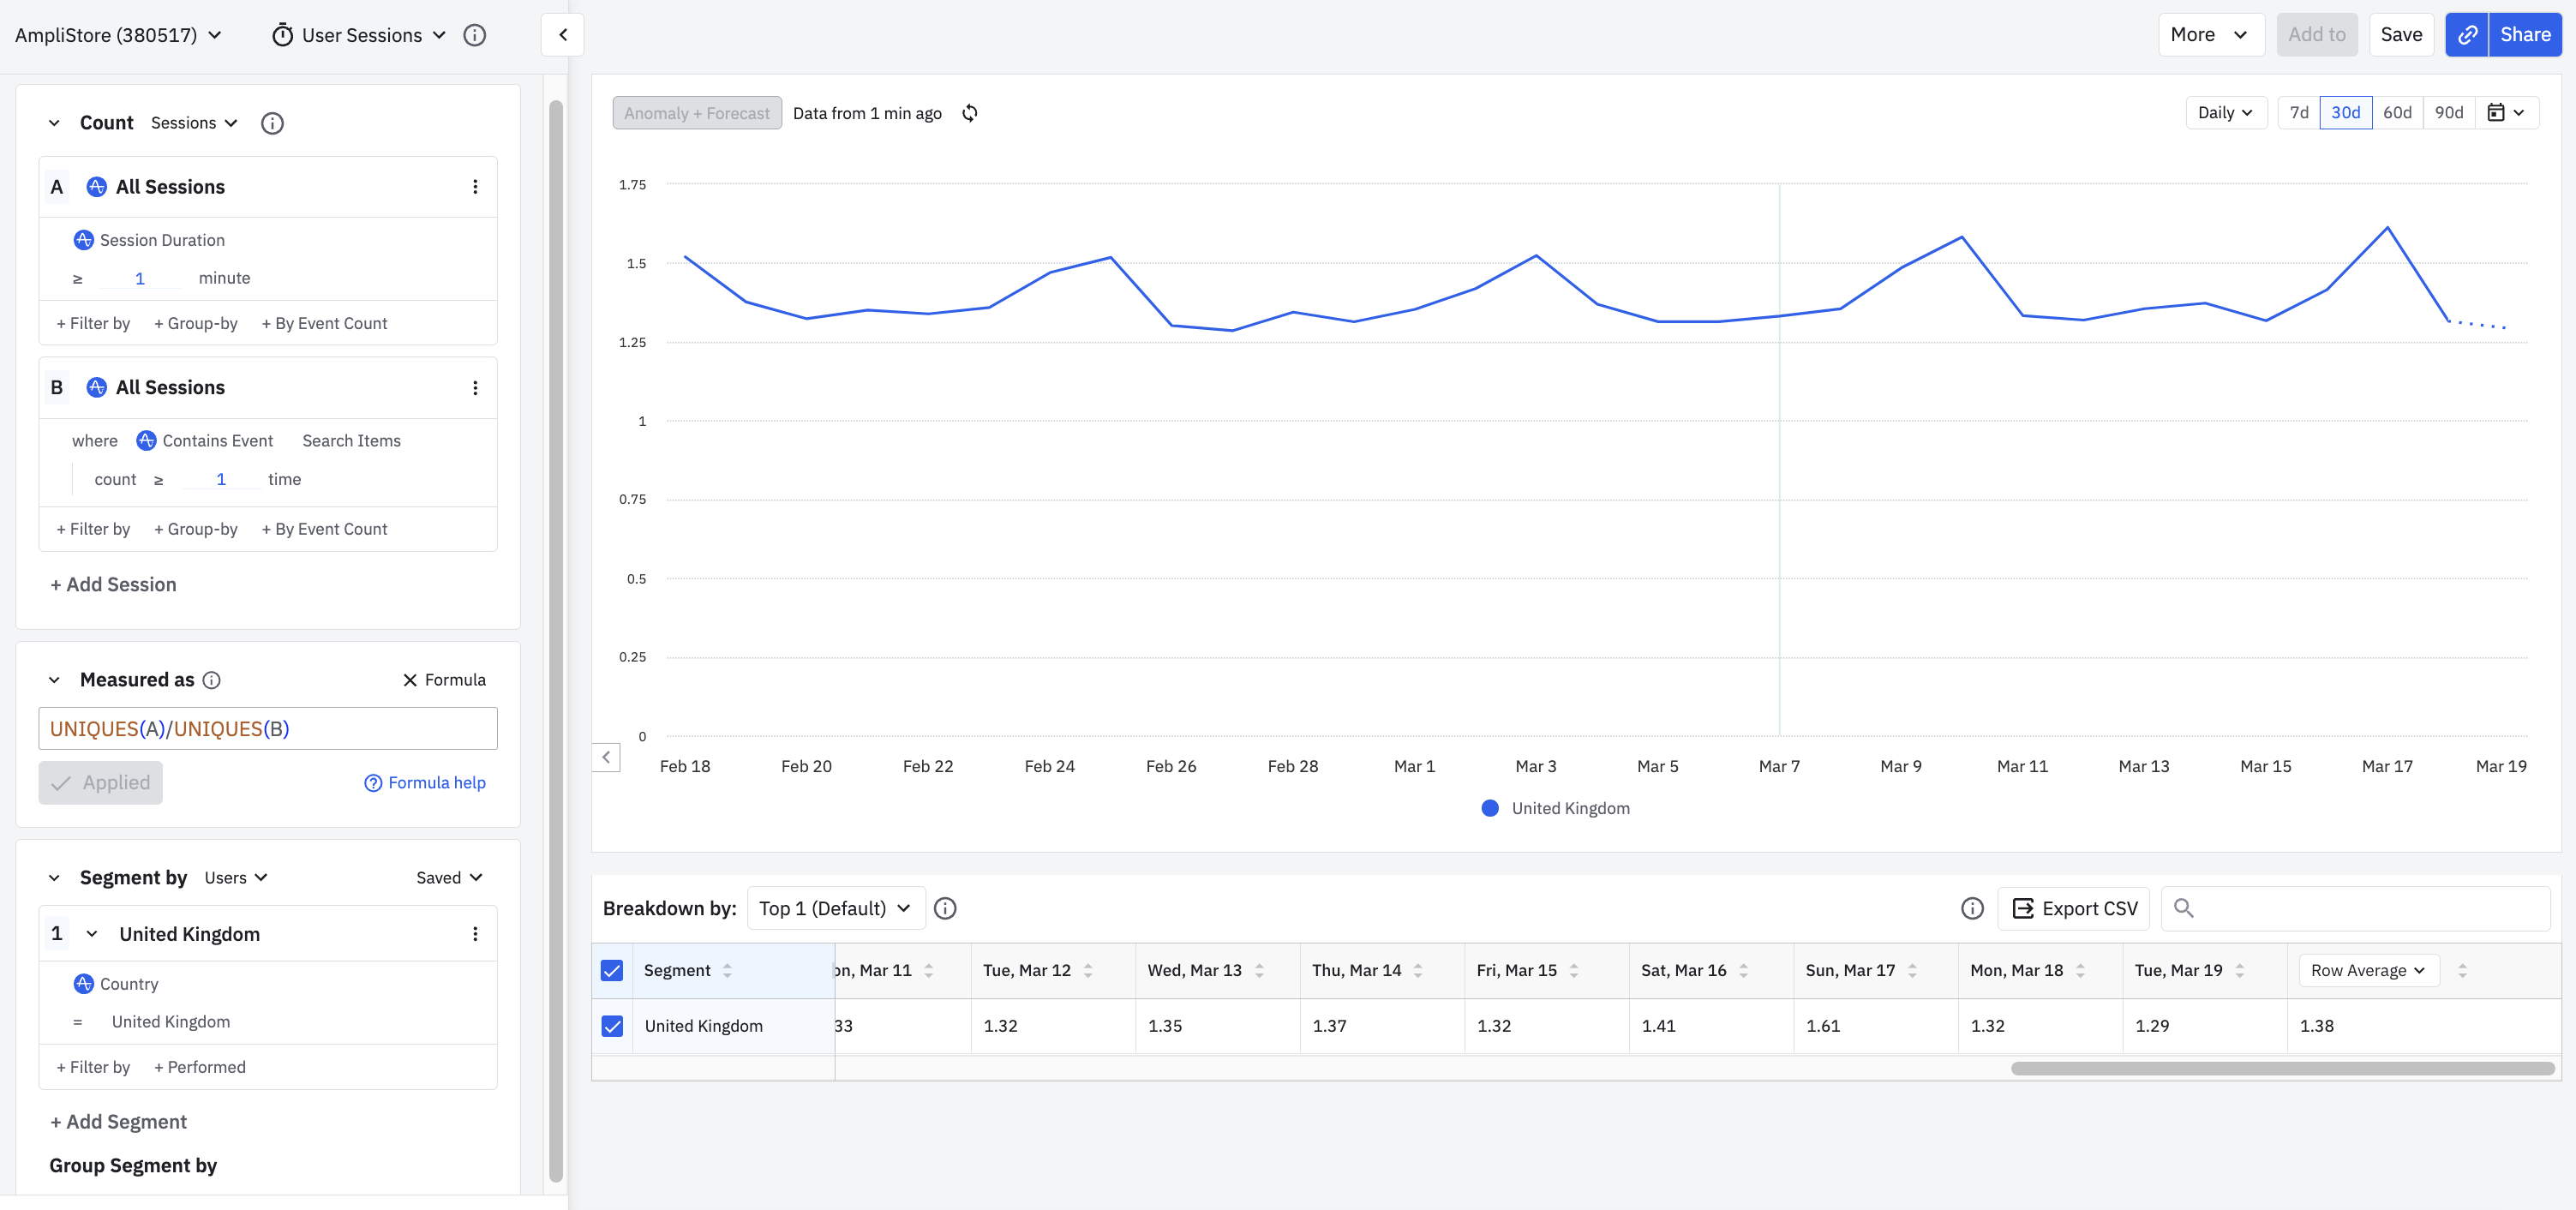
### EVENTTOTALS
{% formula-definition %}
{% card variant="filled" %}
**Syntax**
`EVENTTOTALS(session)`
**Parameters**
| Parameter | Description |
| --------- | ------------------------------------------------------------ |
| `session` | A letter that corresponds to a session in the Sessions card. |
**Returns**
The total number of events triggered during each session.
{% /card %}
Returns the total number of events triggered during each session.
This formula metric is **only** available in the [User Sessions chart](https://help.amplitude.com/hc/en-us/articles/231275508-The-User-Sessions-chart-Track-engagement-frequency-and-duration).
{% callout type="example" heading="Example" %}
`EVENTTOTALS(A)` returns the number of `Page Viewed` events across all sessions.
{% /callout %}
{% /formula-definition %}
### SESSIONTOTALS
{% formula-definition %}
{% card variant="filled" %}
**Syntax**
- User Sessions chart: `SESSIONTOTALS(session)`
- Event Segmentation chart: `SESSIONTOTALS(event)`
**Parameters**
| Parameter | Description |
| --------- | ------------------------------------------------------------ |
| `session` | A letter that corresponds to a session in the Sessions card. |
| `event` | A letter that corresponds to an event in the Events card. |
**Returns**
- For `SESSIONTOTALS(session)`: the number of sessions that match the specified session label.
- For `SESSIONTOTALS(event)`: the number of sessions that contain the specified event at least once.
{% /card %}
Returns the number of sessions. Available in both the [User Sessions](https://amplitude.com/docs/analytics/charts/user-sessions/user-sessions-track-engagement-frequency) and [Event Segmentation](https://amplitude.com/docs/analytics/charts/event-segmentation/event-segmentation-build) charts.
The value you pass to `SESSIONTOTALS` depends on the chart you're using.
{% callout type="example" heading="Example" %}
The setup below shows the total number of sessions by day over the last 30 days for all users in the United Kingdom who completed at least one `Add to Cart` event during each session.
{% /callout %}
{% /formula-definition %}
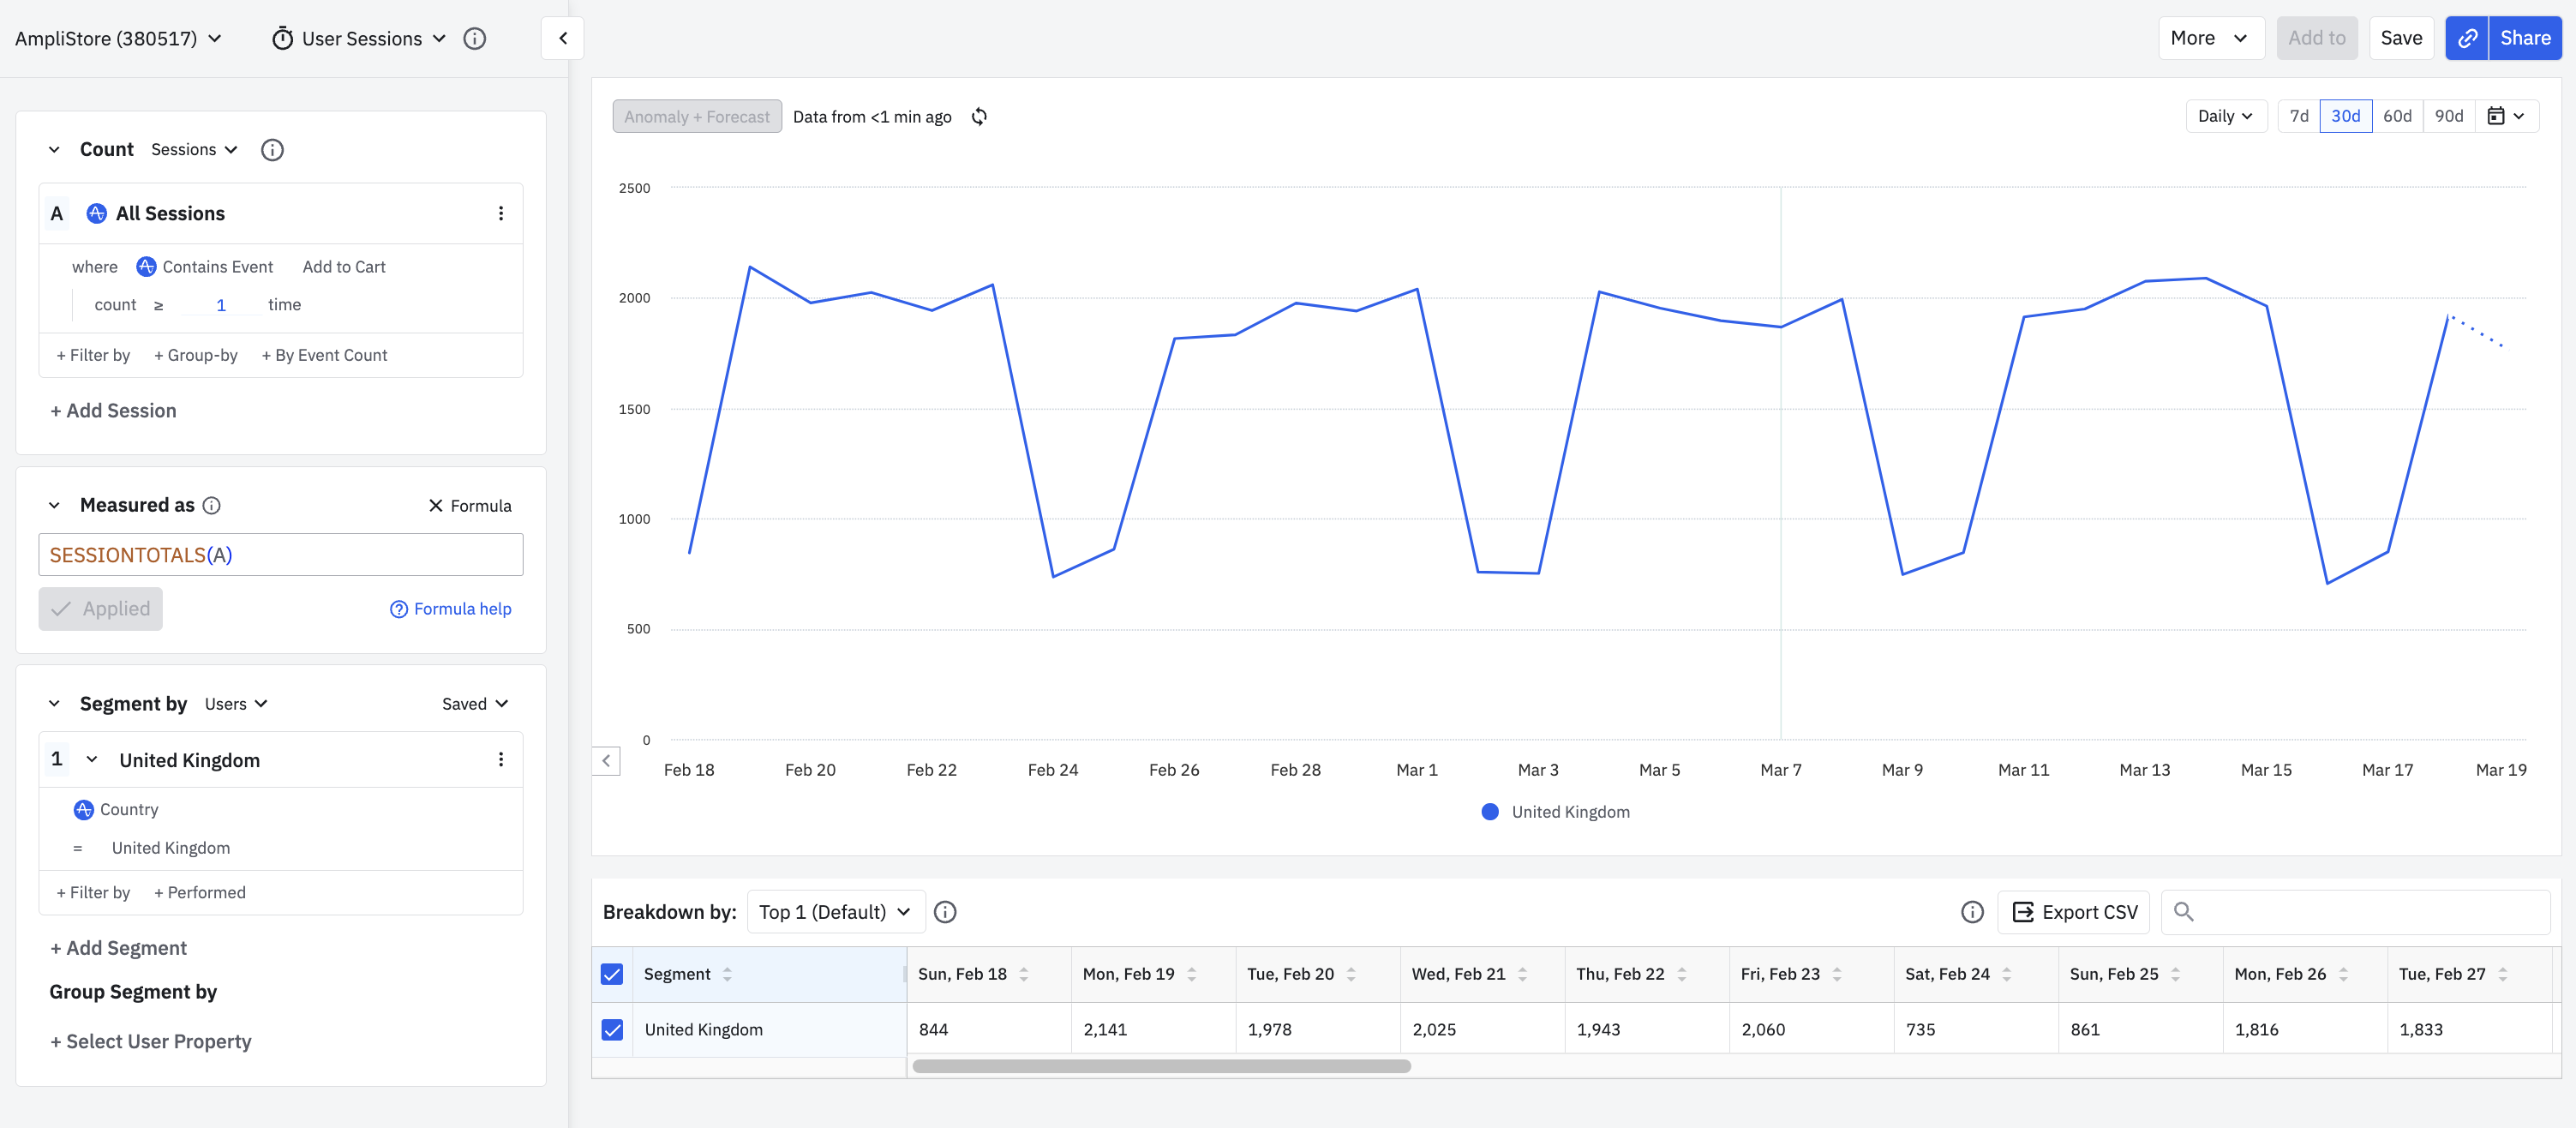
### SEMANTICTOTALS
{% formula-definition %}
{% card variant="filled" %}
**Syntax**
`SEMANTICTOTALS(event, semantic)`
**Parameters**
| Parameter | Description |
| ---------- | ------------------------------------------------------------------------------------------------------------------------------------------------------------------------------------------------------------------------------------------------------------------------------------------------------ |
| `event` | A letter that corresponds to an event in the Events card. |
| `semantic` | How totals are calculated when grouped by cart properties (array properties). Supported values: `UNIQUE_ARRAY_VALUES` performs "Counting Events" by deduplicating array property values. `ALL_VALUES` performs "Counting Items" by counting each item within the array property without deduplication. |
**Returns**
The total number of times the event occurred, counted according to the chosen `semantic`.
{% /card %}
Returns the total number of times an event occurred, with explicit control over how array properties are counted.
This gives you formula-based access to the same counting options available in the Event Totals and Average measurement controls when grouping by cart properties.
{% callout type="example" heading="Example" %}
A `Checkout` event has the cart property `item_list.product_category`. If a single `Checkout` event contains two tacos (one Crunchy Taco and one Soft Taco) under the same product category "tacos":
- `SEMANTICTOTALS(A, UNIQUE_ARRAY_VALUES)` counts 1 Checkout event.
- `SEMANTICTOTALS(A, ALL_VALUES)` counts 2 Checkout items.
{% /callout %}
{% callout type="note" %}
The default behavior for `TOTALS` remains unchanged (equivalent to "Counting Items"). Use `SEMANTICTOTALS` when you need to explicitly choose between counting events and counting items.
{% /callout %}
{% /formula-definition %}
## Aggregation formulas
### CUMSUM
{% formula-definition %}
{% card variant="filled" %}
**Syntax**
`CUMSUM(metric, event)`
**Parameters**
| Parameter | Description |
| --------- | --------------------------------------------------------- |
| `metric` | One of the metrics formulas listed above. |
| `event` | A letter that corresponds to an event in the Events card. |
**Returns**
The metric for the selected event with a running total of days, weeks, or months over the chart's time frame.
{% /card %}
Returns a metric for the selected event with a running total over the chart's time frame.
`CUMSUM(UNIQUES, A)` returns a deduplicated count of unique users for each data point.
{% callout type="example" heading="Example" %}
A daily [cumulative sum](https://amplitude.com/docs/analytics/charts/event-segmentation/event-segmentation-interpret-2#cumulative-sum) of revenue from `Complete Purchase` events in the last 30 days. The data point for February 22 is the sum of revenue generated on February 20, 21, and 22.
{% /callout %}
{% /formula-definition %}
### ROLLAVG
{% formula-definition %}
{% card variant="filled" %}
**Syntax**
`ROLLAVG(metric, event, intervals)`
**Parameters**
| Parameter | Description |
| ----------- | --------------------------------------------------------------------------------------------------------------------------------------------------------------------------------------------------------------- |
| `metric` | One of the metrics formulas listed above. |
| `event` | A letter that corresponds to an event in the Events card. |
| `intervals` | The number of five-minute intervals, hours, days, weeks, or months to include in the rolling average. The maximum ranges are 36 five-minute intervals (three hours), 72 hours, 90 days, 12 weeks, or 12 months. |
**Returns**
The rolling average of the metric for the event over the specified number of intervals.
{% /card %}
Returns the metric for the event selected with a [rolling average](https://help.amplitude.com/hc/en-us/articles/14056975720091) over the interval selected.
A daily chart allows rolling averages over daily intervals only.
{% callout type="example" heading="Example" %}
A weekly rolling average superimposed on top of daily active users. The blue line shows daily active users and the green line shows the weekly rolling average. Use this comparison to see if your daily active user count is higher or lower than the rolling average.
{% /callout %}
{% /formula-definition %}
### ROLLWIN
{% formula-definition %}
{% card variant="filled" %}
**Syntax**
`ROLLWIN(metric, event, intervals)`
**Parameters**
| Parameter | Description |
| ----------- | -------------------------------------------------------------------------------------------------------------------------------------------------------------------------------------------------------------- |
| `metric` | One of the metrics formulas listed above. |
| `event` | A letter that corresponds to an event in the Events card. |
| `intervals` | The number of five-minute intervals, hours, days, weeks, or months to include in the rolling window. The maximum ranges are 36 five-minute intervals (three hours), 72 hours, 90 days, 12 weeks, or 12 months. |
**Returns**
The metric for the event over the rolling window. The rolling window aggregation applies _after_ a cohort filter, if one is in use.
{% /card %}
Returns the metric for the event selected with a [rolling window](https://amplitude.com/docs/analytics/charts/event-segmentation/event-segmentation-interpret-2#rolling-windows) of the number of days, weeks, or months you specify.
The day, week, or month the chart displays is the last day of the window.
{% callout type="example" heading="Example" %}
This chart first calculates the new users for each time interval, then performs the rolling window aggregation on top of that.
{% /callout %}
{% /formula-definition %}
### ROLLWINBEFORE
{% formula-definition %}
{% card variant="filled" %}
**Syntax**
`ROLLWINBEFORE(metric, event, intervals)`
**Parameters**
| Parameter | Description |
| ----------- | -------------------------------------------------------------------------------------------------------------------------------------------------------------------------------------------------------------- |
| `metric` | One of the metrics formulas listed above. |
| `event` | A letter that corresponds to an event in the Events card. |
| `intervals` | The number of five-minute intervals, hours, days, weeks, or months to include in the rolling window. The maximum ranges are 36 five-minute intervals (three hours), 72 hours, 90 days, 12 weeks, or 12 months. |
**Returns**
The metric for the event over the rolling window. The rolling window aggregation applies _before_ a cohort filter, if one is in use.
{% /card %}
Returns the metric for the event selected with a [rolling window](https://amplitude.com/docs/analytics/charts/event-segmentation/event-segmentation-interpret-2#rolling-windows) over a number of intervals you specify, applied _before_ a cohort filter.
{% callout type="example" heading="Example" %}
This chart first calculates the rolling active users for each time interval, then applies the new user cohort filter on top of that.
{% /callout %}
{% /formula-definition %}
## Function formulas
### EXP
{% formula-definition %}
{% card variant="filled" %}
**Syntax**
`EXP(value)`
**Parameters**
| Parameter | Description |
| --------- | ------------------------------------------------------------------------------------------------------- |
| `value` | A constant or another function (for example, `UNIQUES` of an event). The maximum value accepted is 700. |
**Returns**
_e_ raised to the power of `value`.
{% /card %}
Returns [_e_](<https://en.wikipedia.org/wiki/E_(mathematical_constant)>) to the power of the specified value.
{% callout type="example" heading="Example" %}
`EXP(AVG(A))` computes _e_ to the power of the average number of times users purchase tickets.
{% /callout %}
{% /formula-definition %}
### LN
{% formula-definition %}
{% card variant="filled" %}
**Syntax**
`LN(value)`
**Parameters**
| Parameter | Description |
| --------- | -------------------------------------------------------------------- |
| `value` | A constant or another function (for example, `UNIQUES` of an event). |
**Returns**
The natural logarithm of `value`.
{% /card %}
Returns the [natural logarithm](https://en.wikipedia.org/wiki/Natural_logarithm) of the value — the logarithm to the base of [_e_](<https://en.wikipedia.org/wiki/E_(mathematical_constant)>).
{% callout type="example" heading="Example" %}
`LN(UNIQUES(A))` calculates the natural logarithm of the number of unique users that triggered event A.
{% /callout %}
{% /formula-definition %}
### LOG
{% formula-definition %}
{% card variant="filled" %}
**Syntax**
`LOG(value, base)`
**Parameters**
| Parameter | Description |
| --------- | --------------------------------------------------------------------------- |
| `value` | A constant or another function (for example, `TOTALS` of an event). |
| `base` | A constant. The base must be a constant and can't contain another function. |
**Returns**
The logarithm of `value` to the specified `base`.
{% /card %}
Returns the [logarithm](https://en.wikipedia.org/wiki/Logarithm) of the value to the specified base.
{% callout type="example" heading="Example" %}
`LOG(UNIQUES(A), 3)` returns the logarithm of the count of unique active users to base 3.
{% /callout %}
{% /formula-definition %}
### LOG10
{% formula-definition %}
{% card variant="filled" %}
**Syntax**
`LOG10(value)`
**Parameters**
| Parameter | Description |
| --------- | ---------------------------------------------------------------- |
| `value` | A constant or another function (for example, `AVG` of an event). |
**Returns**
The base-10 logarithm of `value`.
{% /card %}
Returns the [logarithm](https://en.wikipedia.org/wiki/Common_logarithm) of the value to base 10.
{% callout type="example" heading="Example" %}
`LOG10(AVG(A))` returns the base-10 logarithm of the average number of times users triggered `Complete Purchase`.
{% /callout %}
{% /formula-definition %}
### POWER
{% formula-definition %}
{% card variant="filled" %}
**Syntax**
`POWER(value, exponent)`
**Parameters**
| Parameter | Description |
| ---------- | ------------------------------------------------------------------------------- |
| `value` | A constant or another function (for example, `TOTALS` of an event). |
| `exponent` | A constant. The exponent must be a constant and can't contain another function. |
**Returns**
`value` raised to the power of `exponent`.
{% /card %}
Returns the value raised to the specified exponent.
{% callout type="example" heading="Example" %}
`POWER(UNIQUES(A), 2)` returns the squared number of unique users that triggered event A.
{% /callout %}
{% /formula-definition %}
### SQRT
{% formula-definition %}
{% card variant="filled" %}
**Syntax**
`SQRT(value)`
**Parameters**
| Parameter | Description |
| --------- | ---------------------------------------------------------------- |
| `value` | A constant or another function (for example, `AVG` of an event). |
**Returns**
The square root of `value`.
{% /card %}
Returns the [square root](https://en.wikipedia.org/wiki/Square_root) of the value.
{% callout type="example" heading="Example" %}
`SQRT(TOTALS(A))` returns the square root of the total number of times users triggered event A.
{% /callout %}
{% /formula-definition %}
### TRENDLINE
{% formula-definition %}
{% card variant="filled" %}
**Syntax**
`TRENDLINE(value)`
**Parameters**
| Parameter | Description |
| --------- | -------------------------------------------------------------------- |
| `value` | A constant or another function (for example, `UNIQUES` of an event). |
**Returns**
The ordinary least-squares linear regression trend line of `value`.
{% /card %}
Returns the [ordinary least-squares linear regression](https://en.wikipedia.org/wiki/Ordinary_least_squares) trend line of the value.
Strongly consider plotting another custom formula alongside this one for comparison. Otherwise, the `TRENDLINE` function gives you a straight line with no context on a chart.
{% callout type="example" heading="Example" %}
Use `TRENDLINE` to understand the trend line of the number of users that purchase a song or video and compare it to the unique number of users.
{% /callout %}
{% /formula-definition %}
================================================================================
# Create in-line custom events
URL: https://amplitude.com/docs/analytics/charts/event-segmentation/event-segmentation-in-line-events
================================================================================
# Create in-line custom events
Sometimes an analysis calls for combining multiple events, but you might not know which events you need. You can explore event combinations directly in the chart controls without creating and saving a permanent custom event. Amplitude offers in-line OR logic to combine events for funnels and event segmentation charts.
{% callout type="note" %}
To gain access, contact your Amplitude Client Success Manager.
{% /callout %}
Follow these steps to add a custom event:
1. Click _More Options_ in the _Events_ side control and select _Combine events inline_.
2. Click _Add event inline_ to add a custom event. Add any number of custom events.
{% callout type="note" %}
The in-line event you create is relevant to that specific chart and isn't accessible anywhere else unless you save it as a custom event.
{% /callout %}
3. To add event properties, hover on the event and click _Filter_. Add as many filter properties as needed for each in-line event.
4. To use the in-line events in other charts, save them as a [custom event](https://amplitude.com/docs/analytics/charts/group-events). Click **More Options** and choose _Save Custom Event_.
5. Click _Remove_ to remove properties and in-line events.
{% callout type="note" heading="" %}
Custom events can't contain other custom events. Also, _Show User Journeys_, _Explore Conversion Drivers_, and _Show User Paths_ aren't available from the Microscope for in-line event steps in funnels.
{% /callout %}
================================================================================
# Interpret your analysis, part 1
URL: https://amplitude.com/docs/analytics/charts/event-segmentation/event-segmentation-interpret-1
================================================================================
# Interpret your analysis, part 1
Amplitude's **Event Segmentation** chart helps you understand what specific groups of users do in your product. For example, in an event segmentation analysis, you can:
- Identify the top events fired over a selected time.
- Compare event totals to each other.
- View which users fire certain events.
## Before you begin
Familiarize yourself with the basics of [building charts in Amplitude](https://amplitude.com/docs/analytics/charts/build-charts-add-events) and with how to create an [Event Segmentation](https://amplitude.com/docs/analytics/charts/event-segmentation/event-segmentation-build) chart.
## Interpret your Event Segmentation chart
Event Segmentation is Amplitude's most commonly used chart. This article explores these features and explains how to put them to use to generate insights on user behavior.
### Breakdown table
Below the chart, a breakdown table appears. By default, Amplitude includes all top values or events in this table, which update automatically when Amplitude receives new top values or events. To turn this off, deselect the segments and then explicitly select the values and events to keep.
### Change your chart view
Whichever metric you choose, you have several options for displaying results on the chart.
- The default setting is a basic **line chart**. Line charts help when looking at the trend of one event for one user category over time.
- **Stacked area charts** help when looking at data that breaks down into discrete buckets, such as when analyzing multiple events.
- **Bar charts** help show a distribution of data points or compare metric values across different segments of your data. Bar charts make it easy to see which values are highest or most common, and how specific groups compare against the rest.
- A **stacked bar chart** shows how broad categories or buckets divide into smaller ones, and the relationship each smaller part has to the overall total.
- A **Pie chart** displays each result as a percentage of the total.
- **KPI** displays a grid with the current total values or average values over a time range you select.
If your analysis uses multiple group-by conditions, the resulting visualization can become confusing and hard to interpret.
For example, here the control panel groups the `Play Song or Video` event by `Genre_Type`, with segmentation by `Country` and `Platform`.
The **group by** visualization isn't specifically a chart type, but it clarifies your data in these circumstances. With more than one group-by or segmentation, the resulting chart becomes difficult to understand.
Refer to [this Help Center article for more information on the syntax and limitations of group-by conditions](https://amplitude.com/docs/analytics/charts/group-by).
### Distribution chart views
When your Event Segmentation chart uses the **Frequency** or **Distribution of Property Value** measurement, Amplitude displays the results as a histogram. Use the chart controls to switch between these views:
- **Counts**: displays raw counts in each bucket.
- **Normalized**: scales each series so the bucket values sum to 1. Use this when you compare distributions with different sample sizes, because taller bars in one series might reflect a larger population rather than a more likely value.
- **PDF** (probability density function): displays a normalized density curve for each series. Use PDF when you compare the shape of distributions across segments with different sample sizes.
- **CDF** (cumulative distribution function): displays the cumulative percentage of values at or below each bucket. Use CDF to read approximate percentiles. For example, to approximate the 75th percentile, find the smallest bucket where CDF is at least 75%.
{% callout type="note" %}
Normalization and PDF/CDF views aren't available in [Metric Explorer (Beta)](https://amplitude.com/docs/analytics/charts/metric-explorer/metric-explorer-build) yet.
{% /callout %}
### Switch between absolute totals and relative percentages
In stacked area charts and stacked bar charts, you can view your analysis in terms of relative percentages instead of absolute totals.
_# Absolute_ displays the overall user volume, while _% Relative_ gives you the series value divided by the sum of all the series values.
{% callout type="note" %}
Amplitude disables the _% Relative_ option when analyzing two or more events with the Uniques measure in a stacked area chart. Instead, build a formula in the Measured As Module with the `UNIQUES` metric for each event. The _% Relative_ option becomes available after you choose the formula option.
{% /callout %}
This method counts unique users **per event**. One user can count more than once if they trigger multiple events within the same time window. This is why the **microscope's sum** of unique users can exceed the number of unique users overall.
## Learn more
Next, learn about the [advanced features of segmentation analysis in Amplitude, including averages, windows, and cumulative totals](https://amplitude.com/docs/analytics/charts/event-segmentation/event-segmentation-interpret-2).
================================================================================
# Interpret your analysis, part 2: Advanced features
URL: https://amplitude.com/docs/analytics/charts/event-segmentation/event-segmentation-interpret-2
================================================================================
# Interpret your analysis, part 2: Advanced features
This article explores some advanced features available as you interpret your event segmentation analyses. For a primer on the basics, [refer to part one](https://amplitude.com/docs/analytics/charts/event-segmentation/event-segmentation-interpret-1).
## Rolling averages
Rolling averages display the unweighted mean, which smooths out a chart. This option helps when you have cyclical users—for example, people that use your product during the week, but not on weekends.
To apply a rolling average to your chart, click _Advanced_ and select _Rolling Average_ from the drop-down list.
{% callout type="note" %}
The maximum ranges allowed for a rolling average are 36 five-minute intervals (three hours), 72 hours, 90 days, 12 weeks, or 12 months.
{% /callout %}
This chart displays the daily event totals without a rolling average. Notice the sharp peaks and valleys in the line.
When you add a rolling average of seven days, those fluctuations disappear. Each data point now represents an average of the previous seven days of data.
Each day's data is included in that day's data point:
- For the current day, Amplitude uses a dotted line to show that data collection for today isn't finished. Use an **Offset** in the date picker to exclude the current day from your analysis.
- With a seven-day rolling average, the first six days of your selected time period fetch data from outside the selected time period. For example, in an analysis covering the month of February, the result for February 6 averages data over January 31 to February 6.
## Rolling windows
A rolling window is another method to smooth your data. It displays the **aggregate** last N days of information in a single data point. Rolling windows help when you want to view aggregated metrics—such as your 7-day active user count—on a daily basis.
This option differs from the rolling average because a rolling window doesn't average your data over the selected time frame. Instead, it sums the data.
To apply a rolling window to your chart, click _Advanced_ and select _Rolling Window_ from the drop-down list.
{% callout type="note" %}
The maximum ranges allowed for a rolling window are 36 five-minute intervals (three hours), 72 hours, 90 days, 12 weeks, or 12 months.
{% /callout %}
This chart displays event totals without a rolling window.
Below, the event totals display with a rolling window of seven days. Each day represents a sum of the previous seven days of events.
As with a rolling average, when you use a seven-day rolling window, the first six days of your selected time frame fetch data from outside the selected time period. For example, in an analysis covering the month of February, the result for February 6 averages data over January 31 to February 6.
### Cohort filtering
When you select a rolling window, specify whether aggregation happens before or after Amplitude filters results according to the cohort or cohorts you select.
- **before cohort filter**: Amplitude aggregates the event data, then applies the cohort and filters the results.
- **after cohort filter**: Amplitude applies the cohort and filters the results, then aggregates the resulting event data.
## Cumulative sum
Cumulative sum displays a **running total** of events in a single data point. For example, to show a running total of revenue generated by purchase events, use cumulative sum.
To apply a cumulative sum to your chart, click _Advanced_ and select _Cumulative_ from the drop-down list.
{% callout type="note" %}
To use cumulative sum in a formula, click _Formula_ and type CUMSUM.
{% /callout %}
This chart shows a running total of purchases that use the `Complete Purchase` event. The April 19 data point represents a sum of purchases on all the preceding days of the selected time frame. Here, that means April 5 to April 19.
Cumulative sum with uniques generates a count of unique users for each data point, with duplicates removed.
For example:
- On April 5, User A triggered `Complete Purchase`.
- On April 11, User A and User B triggered `Complete Purchase`.
- On April 19, User C and User D triggered `Complete Purchase`.
On the data point for April 19, Amplitude returns a total count of four because four unique users fired this event from April 5 to April 19.
## Real-time segmentation
View segmentation data in real time. Note these caveats:
- You can segment only one day of data for real-time.
- Amplitude rounds event times down.
- Amplitude caches charts every five minutes for all users.
## Period-over-period comparison
Use period-over-period comparison to compare the results of your current time range against previous time periods. The comparison control appears in the top-right of the chart, near the date picker.
To start a comparison, click **Previous Period vs.** above the chart. The _Compare with_ panel opens.
### Choose a comparison period
Select from the following preset comparison options:
| Range | Description |
| ---------------- | ---------------------------------------------------------------------------------------------------------------------------------------------------------------------------- |
| Previous day | Shifts the comparison window back by one day. For example, if your current range is `Mar 25-Mar 27`, Amplitude compares against `Mar 24-Mar 26`. |
| Previous week | Shifts the comparison window back by one week. For example, if your current range is `Mar 25-Mar 27`, Amplitude compares against `Mar 18-Mar 20`. |
| Previous month | Shifts the comparison window back by one month. For example, if your current range is `Mar 25-Mar 27`, Amplitude compares against `Feb 25-Feb 24`. |
| Previous quarter | Shifts the comparison window back by one quarter. For example, if your current range is `Mar 25-Mar 27`, Amplitude compares against `Dec 25-Dec 27` of the previous quarter. |
| Previous year | Shifts the comparison window back by one year. For example, if your current range is `Mar 25-Mar 27`, Amplitude compares against `Mar 25-Mar 27` of the previous year. |
Each preset displays the calculated date range so you can verify the comparison window.
### Custom comparison periods
For more control, use the custom period options:
| Range | Description |
| ------------------ | ----------------------------------------------------------------------------------------------------------------------------------- |
| Period Starting On | Set a fixed start date for the comparison period. Amplitude calculates the end date based on the length of your current time range. |
| Period Ending On | Set a fixed end date for the comparison period. Amplitude calculates the start date based on the length of your current time range. |
These options let you compare against specific dates, such as a product launch or campaign start.
Both custom options support a **Rolling** toggle. When you enable Rolling, the comparison period shifts forward automatically as time passes, keeping the same offset from the current date range. When Rolling is off, the comparison period stays fixed to the exact dates you chose, regardless of when you view the chart.
### Compare multiple periods
You can compare up to two previous periods at the same time. Click **Add Comparison** in the _Compare with_ panel to add a second comparison period. Each comparison period can use a different preset or custom date range.
To remove a comparison, click the **X** next to the period you want to remove.
### View comparison results
Toggle between display modes in the _Compare with_ panel:
- **Absolute values**: displays the raw metric values for each period.
- **Percentage change**: displays the percentage difference between the current period and each comparison period.
### Period-over-period for custom formulas
Use period-over-period comparison with the [custom formula](https://amplitude.com/docs/analytics/charts/event-segmentation/event-segmentation-custom-formulas) metric. For example, compare your current rolling average with that of the previous month.
================================================================================
# Event Segmentation FAQ
URL: https://amplitude.com/docs/analytics/charts/event-segmentation/faq
================================================================================
# Event Segmentation FAQ
## Common questions
This page answers common questions about the Event Segmentation chart.
## Chart setup
### How do I analyze event and user properties and not just events?
After you select an event to analyze in a chart, use _+Group-by_ and _+Filter by_ to query event and user properties further. _+Filter by_ filters your results for specific property values. _+Group-by_ groups your results by your selected property.
### How do I look at data older than the last 30 days?
To see data beyond the last 30 days, use the date picker and date interval options to select different date ranges of data. The date options appear in the top right of your chart.
For example, to see data for the last 90 days, click _Last 90 days_. To see data for a specific date range, click the calendar to open the custom date range fly-out. Enter your custom dates in the _Between_ section, and click _Apply_ to save. Your chart updates with the custom date range.
### How do I find the average of this property?
In the Measured as section of the Event Segmentation chart, select _Average of Property Value_ from the _Properties_ drop-down to calculate the average value.
### How do I segment by a user's past performance?
Customers on Scholarship, Growth, or Enterprise plans can add a _who performed_ filter to the specified users in the Segment By module. To add an in-line behavioral cohort, follow these steps:
1. Click More options and choose _Add who performed_.
2. Click the Amplitude logo _Any Event_ and choose the event you want the cohort to have performed.
3. Enter the number of events you want next to _count_.
4. Choose the timeframe by clicking _Last 30 Days_. This option behaves like the date picker, and lets you choose a date range in the last number of days or a custom date range.
5. To add an offset, click More options next to the date picker and choose _Add offset_.
You can also define and save a cohort in the Segment By module, which you can then use in other charts.
### How do I filter by accounts instead of users?
In the Segment By module, a drop-down menu lets you select _Accounts_ instead of _Users_.
### What is the maximum date range in the Event Segmentation chart?
For daily and weekly intervals, the maximum date range you can query is 365 days. For monthly, you can look up the last 36 months.
### How can I compare this year's data to last year's?
Use the [Compare](https://amplitude.com/docs/analytics/charts/event-segmentation/event-segmentation-interpret-2) drop-down to choose the comparison you want. From your chart, click _Compare_ and choose _Previous year_ to compare the current year's data to last year's. The _Compare_ feature also lets you choose a custom date range. Click _Select custom date range_, enter your end date in the modal that appears, and click _Apply_.
### How can I set a goal line or horizontal annotation in my chart?
Amplitude doesn't support creating goal lines or horizontal annotations.
For a similar result, use a custom formula to set a "target" for a specific metric. In this example, the Measured As module contains the following custom formula:
`UNIQUES(A); UNIQUES(A) * 0 + 90000`
The custom formula produces a goal line. Rename the y-axis to identify the goal.
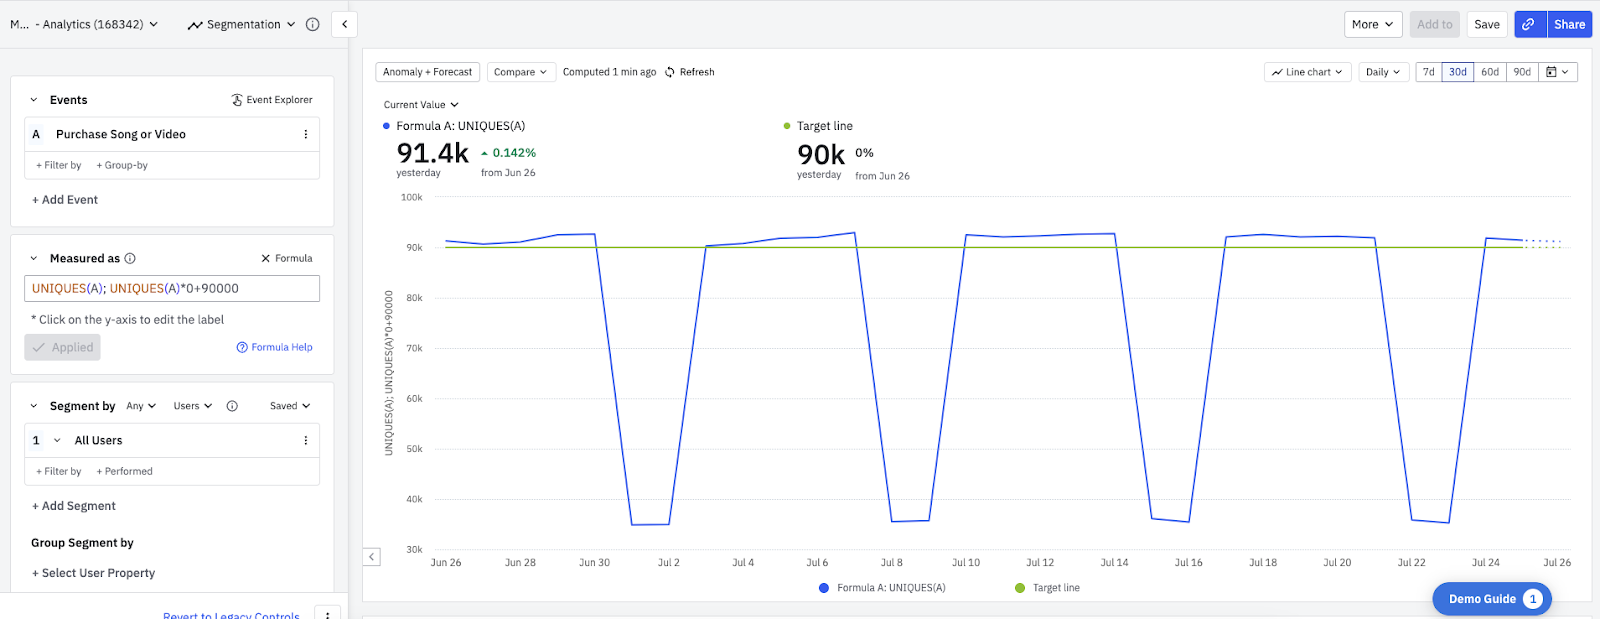
## Custom formulas
### How do I calculate a ratio as a percentage?
For example, suppose you want to see how many users downloaded a song or video compared to all the users that favorited a song or video each day. Use a custom formula to calculate the ratio of those events as a percentage. To create that custom formula, follow these steps:
1. From the _Measured as_ module, click _Advanced_.
2. Enter the formula's syntax: `%:UNIQUES(A) / UNIQUES(B)`.
3. The ratio displays as a percentage in your chart.
### How do I create a DAU or a MAU chart?
Use the [`ROLLWIN` custom formula](https://amplitude.com/docs/analytics/charts/event-segmentation/event-segmentation-custom-formulas) in the Event Segmentation chart. Rolling windows track a rolling total of unique users over the time frame you specify (hours, days, weeks, or months).
For more information, refer to [how custom formulas work in Amplitude Analytics](https://amplitude.com/docs/analytics/charts/event-segmentation/event-segmentation-custom-formulas).
### How does Amplitude handle null values in `PROP()` formulas?
Amplitude doesn't consider null values in the calculation for `PROP()` formulas.
### Why don't my `PROP()` formulas return any values?
`PROP()` formulas consider only integer values in their calculations. For example, a value of $30 isn't calculable, but a value of 30 is.
## Results
### Why don't my line chart data points add up to my bar chart total?
Line charts return values per date interval (such as per day, per week, or per month), while bar charts return values for the entire date range. The date interval doesn't matter for a bar chart. If a user triggers an event on multiple days, the line chart counts a user for each day they triggered the event, while the bar chart counts the user once. The bar chart deduplicates the counts.
For example, if a user triggered event A on November 2 and November 6, and you have a chart that counts uniques daily between November 1 and November 30, the line chart counts this user twice but the bar chart counts the user once. The bar chart returns a count smaller than the sum of each daily data point.
### What does New User mean?
A new user is a user that logged an event to Amplitude for the first time (this includes inactive events). The user's "new" time matches the time they logged their earliest event.
In an Event Segmentation chart, when you choose _New Users_, Amplitude looks for the events triggered by new users within each day, week, or month (whichever interval you chose) that the user was new. For example, if the interval is set to _daily_ and a user was new on July 17, only the events that happened on July 17 appear on the chart, regardless of whether the user also triggered events the next day, on July 18.
[Find the definitions of Amplitude user properties here](https://amplitude.com/docs/get-started/user-property-definitions).
### What is the definition of `Active %`?
The `Active %` metric graphs the percentage of users that triggered a specific event, compared to the total number of active users (users that triggered any active event) at each data point.
If you apply a cohort or segment filters to the chart, the denominator includes only users that triggered an active event and meet your segmentation requirements.
For more information on how Amplitude defines each metric, refer to [this article on interpreting your event segmentation analysis](https://amplitude.com/docs/analytics/charts/event-segmentation/event-segmentation-interpret-1).
### Why do I get a different result for `Active %` when I apply the group-by on the Events module versus the Segment By module?
Because of the definition of the `Active %` metric, the denominator changes when you apply a group-by in the Events module versus the Segment By module.
When you apply group-by in the **Events** module, Amplitude applies the group-by **only** to the event (numerator). The formula for `Active %` is:
`count of users that performed the event and meet the group-by property`
`/``number of active users * 100`
When you apply a group-by in the Segment By module, the `Active %` metric considers the **number of active users** that match the group-by property in both the numerator and the denominator. The formula in this case is:
`count of users that performed the event and meet the group-by property`
`/``number of active users **that meet the group-by property** * 100`
### Why is my `Active %` metric more than 100%?
This usually happens because you're querying an inactive event. The number of users that performed an inactive event can exceed the number of active users.
### Why am I getting an incomplete data error?
Amplitude servers ingest high volumes of data, and some data processing delays can occur. Amplitude doesn't lose data. Incomplete data means only that Amplitude received the data, but the servers are taking longer to ingest and process the data for you to query.
To stay up to date, refer to the Amplitude status page: <https://status.amplitude.com/>
## Usability
### How do I download a list of users?
- **Microscope**: in a chart, click a data point you're interested in. A pop-up appears; click _Download users_.
- **Cohort**: create a cohort definition and click _Export CSV_.
- **Create a chart**: use _Any Active Event_, grouped by Amplitude ID or user ID. Then click _Export CSV_ in the breakdown table below the chart.
### Why don't I see a specific value I know Amplitude ingested?
Sometimes users instrument event and user properties that share the same naming convention. When choosing the property, select the correct type of property. For example, you can use 'url' as a name for both an event property and a user property. If you filter or group by the 'url' user property instead of the 'url' event property, the chart can return different results than you expect.
### Why doesn't my chart display all possible values for this event/user property?
Amplitude displays only the top 100 property values in the breakdown table. If you export the breakdown table to CSV, the file maxes out at the first 10,000 values.
### Why doesn't my glob match filter return any results?
The asterisk in glob match matches only non-"/" characters. To search for strings that contain "/", use two asterisks, because "\*\*" matches anything. The referrer property contains URLs, which include many "/" characters.
Refer to the [glob pattern overview on Wikipedia](https://en.wikipedia.org/wiki/Glob_%28programming%29) for more information on glob matching.
### Why is my CSV Export missing values, even though the data is under the 10,000 values group-by limit stated in your documentation?
When you have multiple segments, Amplitude "splits" the group-by cap between each segment. With 2 segments, each segment gets 5,000 group-by values, which causes the limit you see in the exported CSV. This behavior matches how Amplitude reduces the number of rows allotted to each event when you have multiple events.
================================================================================
# Build a funnel analysis
URL: https://amplitude.com/docs/analytics/charts/funnel-analysis/funnel-analysis-build
================================================================================
# Build a funnel analysis
Amplitude's **Funnel Analysis** chart helps you understand how users navigate defined paths ("funnels") within your product, and helps you identify problem areas where users tend to drop off.
A common example of a funnel is successful onboarding. To Amplitude, a converted user is one who triggers the events you specified, in the specified order.
This article explains the steps to build a funnel analysis in Amplitude. Before you begin, familiarize yourself with the basics of [how charts work in Amplitude](https://amplitude.com/docs/analytics/charts/build-charts-add-events).
After you build your funnel analysis chart, go to [interpret your funnel analysis](https://amplitude.com/docs/analytics/charts/funnel-analysis/funnel-analysis-interpret).
## Set up a funnel analysis
A funnel analysis shows how your users navigate specific sequences of events in your product. Build Funnel Analysis charts using the Events Module and the Segmentation Module. To create a Funnel Analysis chart, tell Amplitude what those events are, and which users to include in the analysis.
{% callout type="note" %}
You can include both active and inactive events in your funnel analyses. Most customers find their Amplitude charts more insightful when they focus on active events.
{% /callout %}
To build a Funnel Analysis chart, follow these steps:
1. In the Events module, select the **starting event**. Choose a specific event instrumented in Amplitude, or tell Amplitude to consider any event as the starting event for this analysis by selecting _Any Event_ from the list of available events.
2. If you want, add **properties** to your starting event by clicking _+ Filter by_, selecting the property name, and specifying the property value you want.
3. Next, select at least **one other event**. You can add properties to these events as well.
4. Specify the **order** in which a user must trigger these events to convert through the funnel: this order, any order, or exact order.
Selecting _This order_ tells Amplitude Analytics that a user must complete all the steps you've included, in the order you've included them, to count as a conversion. Along the way, they can **also** trigger other steps not specified here. _Any order_ means the user must complete all the steps you've included, but the order in which that happens doesn't matter. _Exact order_ works the same as _This order_, except the user can't include any other steps at all.
5. To **exclude** users from your funnel who trigger specific events between steps of your funnel, click _+ Exclude users who did_ and select the exclusion event from the drop-down list. Apply the exclusion between all steps in the funnel, or between two specific steps. For any-order funnels, users exclude themselves if they fire the exclusion event between any of the funnel steps.
6. In the Segmentation module, identify the user segment to include in this analysis. Import a saved segment by clicking _Saved_ and selecting the one you want from the list. Otherwise, Amplitude begins from the assumption that your analysis targets all users.
{% callout type="note" %}
The user segment you select only applies to the starting event.
{% /callout %}
7. If you don't want to import a saved user segment, build your own by adding properties. Click _+ Filter by_, choose the property to include, and specify the property value you want.
8. Narrow your focus further by telling Amplitude to only include users who have already performed certain actions. Click _+ Performed_, then choose the event you want.
9. To add another user segment, click _+ Add Segment_, and repeat steps 6 and 7.
Your new funnel analysis appears in the chart module.
To read about interpreting your funnel analysis, refer to [interpret your funnel analysis](https://amplitude.com/docs/analytics/charts/funnel-analysis/funnel-analysis-interpret).
================================================================================
# Interpret your funnel analysis
URL: https://amplitude.com/docs/analytics/charts/funnel-analysis/funnel-analysis-interpret
================================================================================
# Interpret your funnel analysis
Amplitude's Funnel Analysis chart helps you understand how users navigate defined paths ("funnels") within your product, and identify potential problem areas where users tend to drop off.
This article describes how the chart area of the Funnel Analysis chart works, and how to interpret the data it contains.
{% callout type="note" heading="" %}
You can use [Global Agent](https://amplitude.com/docs/amplitude-ai/global-agent-overview) to interpret funnel charts with natural language. Ask questions like "Why did conversion drop?" or "Compare conversion rates between mobile and web" to analyze your funnel data.
{% /callout %}
You analyze your funnel analysis data in the screen's lower panel.
## Before you begin
If you haven't already read the overview of [Amplitude's Funnel Analysis chart](https://amplitude.com/docs/analytics/charts/funnel-analysis/funnel-analysis-build), start with that before continuing.
## Interpret your Funnel Analysis chart
Interpreting the Funnel Analysis chart is more straightforward than it might at first appear, mostly because you can read through the parameters like a sentence.
For example, the following chart shows (1) any users who (2) triggered all these events (3) in this order, (4) within one day of triggering the initial event.
You can change all these parameters, as well as many others, to reflect the needs of your analysis.
You can also specify how the chart describes results (also known as the **takeaway**) by selecting the appropriate option from the dropdown in the chart's upper-left corner:
- **Total conversion**: A straightforward calculation that determines your funnel's total conversion rate: (Users who triggered every event in the funnel) divided by (Users who triggered the funnel's first event).
- **Largest drop-off step**: Shows the step with the largest drop-off in conversion. The relevant comparison here is the **absolute** decrease, and **not** the percentage decrease.
- **Slowest conversion step**: Identifies the step in the funnel with the longest median time to transition to the next.
The rest of this section explains the Measured As Module as it applies to a funnel analysis, what all the parameter options mean, and how you can use them to generate the data you want.
### Set your time options
Specifying the time frames of your funnel analysis is straightforward in Amplitude.
- **...completed within:** Set your conversion window here, which is the maximum length of time allowed for a converting user to take between entering a funnel and completing it. The default conversion window is one day (in UTC). Amplitude counts a user as converted if they complete the funnel within one day of entering it; any longer than that, and the user doesn't count. The minimum conversion window length is one second, and the maximum is 366 days.
- **any day:** Applies to new user funnels only. If you select _any day_ from the dropdown, the funnel includes new users who performed the first step of the funnel at any point in the date range selected.
- **their first day:** If, in a new user funnel, you select _their first day_ instead, this restricts the funnel to users who fire the first event (and therefore enter the funnel) on the first day they appear in Amplitude (their new user date).
By default, Amplitude assumes events don't trigger within one second of each other. However, in some situations—like when you have multiple events firing at the same time—you might need a more detailed level of time resolution. In these cases, Amplitude can resolve events on a per-millisecond level.
Check _Millisecond resolution_ in the _Advanced_ drop-down.
{% callout type="note" %}
This setting can cause issues if you generate client event times in distributed or multithreaded environments. Contact Amplitude support if you need help.
{% /callout %}
### Conversion
The default option for a Funnel Analysis chart, the Conversion graph is a bar graph that details the number of users who clicked through to each step of the funnel.
In this chart above, 229,324 users triggered the event `User Sign Up` in the last 30 days. Of these, 173,093 triggered `Search Song or Video` within one day of viewing an item's details. And 28,472 of the original group of users triggered `Purchase Ticket` within one day of `User Sign Up`.
Not only does the bar graph show the number of users who converted at each step, it also shows the number of users who dropped off at a particular step of the funnel. The solid regions of the bars represent users who converted, while the striped areas on top represent users who dropped off.
The tabular view of the data, directly below the chart, offers additional context:
- **Conversion:** The percentage of users who completed the entire funnel.
- **[Event name]:** The number of users who complete that step in the funnel. The first step is always 100% because a funnel only includes users who triggered that first event.
- **Average Time:** The average time it takes users to move from one event to another event in the funnel, based on the time of users' _first_ conversion.
{% callout type="note" %}
If you applied a group-by to your funnel chart, the _Average Time_ column returns "N/A", since Amplitude doesn't count average and median times for daily/weekly/monthly step transitions.
{% /callout %}
You can also count conversions by event totals instead of unique users.
### Conversion over time
The Conversion Over Time graph shows conversion rates for users who entered the funnel **on a specific date**. For example, if a user enters a funnel on January 1st and then converts in the funnel on January 5th, Amplitude counts them in the bucket for January 1st, since that's when they first entered the funnel.
The percentages here are conversions per unique user, per day/week/month. For instance, if a user enters the funnel by firing the first step on both July 1st and July 2nd, and completes the funnel within 30 days of both dates, Amplitude counts that user in the conversion percentages for both July 1st and 2nd.
This graph can also show you the conversion rate between funnel steps. Users don't need to complete the entire funnel to count in this analysis—they need only complete all the steps up to (and including) the last step you want to analyze.
For an example, consider the following chart.
Within this three-step funnel, Amplitude lets you look at conversion rates across the **entire** funnel, between **any two steps** in the process (in this example, step 1 to step 2, **or** step 2 to step 3), or between **two pairings** of steps (step 1 to step 2, **and** step 2 to step 3). If you select `1: User Sign Up to 2: Search Song or Video`, Amplitude includes all users who completed those two steps, regardless of whether they completed step three.
Amplitude displays conversion graphs for each selection in the Measured As Module below, as shown in the screenshot above.
If this were a four-step process, conversions from step two to step three would include all users who completed the first three steps of the process, regardless of whether they completed the fourth. Users always **must enter the funnel at the first step** to count.
{% callout type="note" %}
Conversion Over Time for new users still counts all active users.
{% /callout %}
### Time to convert
Time to Convert shows how long your users take to move from one step in your funnel to the next, displaying the data as a histogram.
Amplitude automatically chooses a bucket size (1 second, 10 seconds, 1 minute, 10 minutes, 1 hour), depending on the conversion window and lookback window you select. The median time to convert shown is for the entire funnel.
The percentages on the vertical axis represent the ratio of users who converted within a particular interval, relative to the number of all users who converted within the selected time range.
If you need to, you can also create custom buckets.
If you create custom buckets, Amplitude calculates the returned percentages using only users who fall between the min and max values for your bucket.
{% callout type="note" %}
Amplitude calculates the median bar based on the full data set, regardless of the bucket min and max values.
{% /callout %}
You can also switch from a histogram view to a time series that depicts how median time to convert changes over time. Click the _Distribution_ drop-down and select _Over Time_.
While the default scope of a Time to Convert graph is the entire funnel, you can also limit it to any two consecutive steps in your funnel, as described in the previous section.
### Frequency
The Frequency chart helps you understand the number of times users in your funnel trigger one event before triggering another specific event for the first time. You can choose the two events you want to analyze in the Measured As Module, as shown in the screenshot below.
For example, in the chart below, 41.1% of all users performed the `Search Song or Video` event only once before purchasing a ticket within a one-day period.
================================================================================
# Combine funnel events inline
URL: https://amplitude.com/docs/analytics/charts/funnel-analysis/funnel-analysis-combine-events
================================================================================
# Combine funnel events inline
Explore event combinations directly in the chart controls without creating and saving a permanent custom event. Follow these steps to add a custom event for inline comparison:
1. Click **More Options** in the Events side control and select _Combine events inline_.
2. Next, click _Add event inline_ to add a custom event. Add the number of custom events you need.
{% callout type="note" %}
The inline event you create only applies to that specific chart and isn't accessible anywhere else.
{% /callout %}
3. To add event properties, hover on the event and click **Filter**. Add as many filter properties as needed for each inline event.
4. Click **Remove** to remove properties and inline events, as needed.
{% callout type="note" %}
Custom events can't contain other custom events. Also, _Show User Journeys_, _Explore Conversion Drivers_, and _Show User Paths_ aren't available through the Microscope for inline event steps in funnels.
{% /callout %}
================================================================================
# Compare group-by values in your Funnel Analysis chart to each other
URL: https://amplitude.com/docs/analytics/charts/funnel-analysis/funnel-analysis-compare-group-by
================================================================================
# Compare group-by values in your Funnel Analysis chart to each other
Funnel charts let you compare a group-by property to another baseline property. After your Funnel chart has a Segment property group-by, click the _Compare_ dropdown to choose a value for comparison.
With that value selected, the conversion percentage difference appears in the microscope when you hover over a value in the visual, and in the breakdown table. For a particular step in the breakdown table, the table shows both the absolute percent difference and the conversion percent difference.
Segment property group-by comparisons have these limitations:
- Only available for Conversion and Conversion Over Time.
- Only applicable to Compare to Property Value or Compare to Past.
- Limited to a maximum of two Segment group-bys.
================================================================================
# Compare multiple funnel events in a single step
URL: https://amplitude.com/docs/analytics/charts/funnel-analysis/funnel-analysis-compare-multiple
================================================================================
# Compare multiple funnel events in a single step
In a Funnel Analysis chart, you can compare up to three events within a single conversion step. After [step 4 of building your funnel](https://amplitude.com/docs/analytics/charts/funnel-analysis/funnel-analysis-build), select _Compare Event_ from the _Options_ flyout menu, and then select the events to compare.
Comparing multiple events within one step is available for conversion and conversion over time metrics. Compare up to three events per step, and two steps at a time. Event comparisons are available for all three order options (any order, this order, exact order). Event comparisons aren't available in dashboard filters, and Amplitude removes them when you switch between charts or funnel metrics.
================================================================================
# Get the most out of Amplitude's Funnel Analysis chart
URL: https://amplitude.com/docs/analytics/charts/funnel-analysis/funnel-analysis-get-the-most
================================================================================
# Get the most out of Amplitude's Funnel Analysis chart
Funnel analysis has become the cornerstone of event-based analytics. A **funnel** is a series of steps a user takes as part of the experience of using your product. Product managers often try to encourage users to navigate these funnels to demonstrate product value and to increase engagement. Amplitude considers a user to have **converted** through a step in the funnel when they trigger the event in the order you've specified.
Users who don't convert have **dropped off**. Knowing which steps of your funnel lead to user drop-off is often a critical tool in improving engagement and stickiness.
Using Amplitude's [Journeys](https://amplitude.com/docs/analytics/behavioral-cohorts) features, you can identify and set up insightful funnels.
## Identify funnel events: Which ones should you include
Funnels should track the flow of users along a critical path in your product. Each funnel step is a distinct action a user can take within a flow you want to analyze.
For example, an onboarding funnel may track the following events:
- `Create Account` →
- `SignUpPage1` →
- `SignupPage2` →
- `Registration Complete`
For an e-commerce platform, tracking a purchase funnel might involve the following sequence of events:
- `View Item` →
- `Add to Cart` →
- `Checkout` →
- `Purchase Confirmation`
These examples work well when you already know the paths your users take. However, it's impossible to know every possible navigation route within your platform, especially because the routes your customers use may at first seem counterintuitive. Amplitude has additional features to help:
- The [Pathfinder](https://amplitude.com/docs/analytics/charts/journeys/journeys-understand-paths) feature shows the most commonly-taken event paths in your product, either following a specific start action or preceding a specific end action, and helps you discover the alternate navigation routes your users are already taking.
- [Compass](https://amplitude.com/docs/analytics/charts/compass/compass-aha-moment) helps you find the event most correlated with retention, or your most important KPI.
The next step is uncovering the different paths users take before triggering these events, so you can encourage that behavior. Start by trying to understand the actions users take immediately before triggering `Search Song or Video`, by analyzing a flow ending with that event. You might find that `Favorite Song or Video` is the most commonly-triggered event immediately before the `Search Song or Video` event.
Look at this in the other direction. What events do users trigger immediately after searching for a song? To answer this question, build a **starting-with** flow, beginning with that event.
## Design the funnel
When setting up your funnel, decide whether to use **This Order**, **Any Order**, or **Exact Order** mode. The first requires users to follow the **specified order** of events to count as converted, and they can also trigger additional events along the way. The conversion window can be much shorter for this mode: as little as one second. Any order counts all users who trigger the funnel steps **in any order** during the conversion window, which you can set anywhere between one and 90 days. Exact order works similarly to this order, but users can **not** trigger any other events along the way.
For more, refer to [building a funnel analysis in Amplitude](https://amplitude.com/docs/analytics/charts/funnel-analysis/funnel-analysis-build).
Imagine you've been sending push notifications to certain users to get them to play songs. However, you've found that many users trigger `Add a Friend`, `Play Song or Video`, and `Add to Playlist` close to each other. It may be worth understanding whether sending those push notifications actually makes those users more likely to also add more friends. If so, that insight validates the hypothesis that push notifications have a complementary effect on other major KPIs.
For more about the semantics of Amplitude's funnel conversion window, refer to [Interpret your funnel analysis](https://amplitude.com/docs/analytics/charts/funnel-analysis/funnel-analysis-interpret).
## Building and interpreting your funnel analysis
After you've designed a funnel analysis that works for you, go to [build a funnel analysis in Amplitude Analytics](https://amplitude.com/docs/analytics/charts/funnel-analysis/funnel-analysis-build), and then learn how to [interpret your results](https://amplitude.com/docs/analytics/charts/funnel-analysis/funnel-analysis-interpret).
## Acting on the funnel insights
Your next goal should be to create a retention loop where you can get more users to come back and take the wanted action: add more friends, which is correlated with retention, your main KPI in this scenario.
For example, go back to your funnel and use the [Microscope](https://amplitude.com/docs/analytics/microscope) feature to make cohorts of users who dropped off from the funnel at critical points, like `Add To Playlist` and `Add Friends`, and message them to take the corresponding actions.
Use an in-house messaging platform or one of Amplitude's push notification partners like [Airship](https://www.urbanairship.com/) or [Kahuna](https://www.kahuna.com/) to message these cohorts.
## Next steps
Now that you know about Amplitude's Funnel Analysis chart, the next step is to [build one for yourself](https://amplitude.com/docs/analytics/charts/funnel-analysis/funnel-analysis-build).
================================================================================
# Hold properties constant in a Funnel Analysis chart
URL: https://amplitude.com/docs/analytics/charts/funnel-analysis/funnel-analysis-hold-properties-constant
================================================================================
# Hold properties constant in a Funnel Analysis chart
By default, Amplitude doesn't hold properties constant in a funnel analysis. The funnel chart displays the **unique count of users** who have gone through the funnel **once or more**. For example, if a user goes through the entire funnel multiple times, they only count once.
For the following chart, if a user converts this funnel (`View Item` -> `Add to Cart` -> `Complete Purchase`) ten times over the last day, they only show up once.
If, however, you opt to hold properties constant, the funnel chart displays the **unique count of user and user/event property pairs** that completed the funnel. If a user goes through the entire funnel X times with Y distinct event property values, the user counts Y times.
For example, if a user converts `View Item Details` -> `Add Item to Cart` -> `Complete Purchase` with ten different `Item_ID` property values, they show up ten times in the chart. Here, `Item_ID` is an event property sent for all three events in the funnel. **An event property can only hold constant** when you instrument it for **every event** in the funnel.
Use this method to build session-based funnels. To do this, hold `[Amplitude]Session ID` constant, as shown here.
A user must complete each step in the funnel with the same session ID to count as converted. A Funnel Analysis chart with this setup doesn't show unique users, because users can complete the funnel multiple times in different sessions.
================================================================================
# How Amplitude computes conversions through funnels
URL: https://amplitude.com/docs/analytics/charts/funnel-analysis/funnel-analysis-how-amplitude-computes-conversions
================================================================================
# How Amplitude computes conversions through funnels
Identify key differences between Funnel and Event Segmentation charts.
When you calculate conversion for a funnel in which users can complete the steps more than once, Amplitude buckets each user based on the values tied to the **first** occurrence of each event.
Understanding these implications is vital to drawing accurate conclusions from your analyses.
## First-touch attribution scenarios
Assume you have a funnel that tracks registrations (`complete registration`) **broken down by** the landing page each user sees (`view landing page`). If you **hold constant** by `session_id`, users must complete **both** steps of the conversion process in the **same session** for Amplitude to count them as converted.
### Scenario 1: Funnels using both _Hold property constant_ and _group conversions by_
When a funnel analysis uses both the hold constant and broken down by functions, Amplitude bases conversion on the **earliest entry within the session**.
Consider the following events and conversion results as examples:
| **Events** | **Conversion** |
| --------------------------------------------------------------------------------------------------------------------------- | -------------------------------------------------------------------------------------------------------------------------------------------------------------------------------------------------------------------------------------------------------------------------------- |
| A user sees Landing Page A and completes registration within the **same** session. | The session counts as **converted**, and Amplitude attributes the conversion to Landing Page A. |
| A user sees Landing Page A, then Landing Page B in the **same** session, but converts only **after** seeing Landing Page B. | Since that user saw Landing Page A **first**, Amplitude attributes the conversion within the session to Landing Page A. |
| A user sees Landing Page A, then Landing Page B in **different** sessions. | That user **doesn't** convert in the session where they saw Landing Page A. But that same user **does** convert in the session where they saw Landing Page B. Amplitude counts the Landing Page A session as **not** converted, and the Landing Page B session as **converted**. |
{% callout type="note" %}
When you hold constant by session ID, your chart displays the **number of user sessions** that included a conversion, and **not** the number of users who converted.
{% /callout %}
### Scenario 2: Funnels using group conversions by, but not Hold property constant
When only the broken down by function applies, Amplitude bases conversion on the **earliest entry** within the lookback window.
Amplitude **groups** users by the first landing page they saw within the lookback window (how they entered the funnel). Amplitude considers them converted if they trigger the **final event** within the duration of the conversion window.
For example, consider the following events and related conversions:
| **Events** | **Conversion** |
| --------------------------------------------------------------------------------------------------------------------- | ----------------------------------------------------------------------------------------------------------------------------------------- |
| A user sees Landing Page A and completes registration **within** the conversion window. | That user counts as **converted**, and Amplitude attributes the conversion to Landing Page A. |
| A user sees Landing Page A, then Landing Page B, and completes registration **within** the window for Landing Page A. | That user counts as **converted**, and Amplitude attributes the conversion to Landing Page A, since they saw that one first. |
| A user sees Landing Page A, then Landing Page B, but **doesn't convert**. | That user counts as **not converted**. The events negatively affect Landing Page A's performance, but don't count against Landing Page B. |
{% callout type="note" %}
Amplitude calculates conversions broken down by a filter differently than a group-by. A group-by looks for the earliest and most complete conversion **first**, and then groups by the specified property value. A filter-by first accounts for the property you filter by **before** looking for a conversion.
{% /callout %}
## The logic of unique user counts in funnel analyses
When counting by **unique users**, the baseline conditions for conversion are:
- **A user must qualify for inclusion in the funnel**: Amplitude **can't filter the user out** through the user segmentation panel. Any filters set in the _Segment by_ module only apply at the time the user triggered the first funnel event.
- **A user must enter the funnel and complete all steps in the conversion window**: The user must enter the funnel and complete **all** steps within the stated **conversion window** to count as converted in the final funnel step. Otherwise, Amplitude counts the user based on how far they progressed through the funnel.
When Amplitude counts by uniques, it **only** counts the earliest and longest conversion for each unique user:
- **Longest**: In this context, longest means the **most complete** conversion—the completion of the most required steps within the funnel.
If Amplitude finds multiple conversions that meet the **longest** definition, it selects the first one and counts that as when conversion occurred.
- **Earliest**: Amplitude measures earliest using the **first converting sequence** chronologically, if more than one exists.
When you use the broken down by function, Amplitude continues to use the longest/earliest logic to bucket users according to the property that was present at their **point of funnel entry**.
If you use _Hold constant by_ in your analysis, Amplitude looks for the longest/earliest **converting sequence** within the same user session. When it does, the unit of measurement changes to unique user and session ID pairings.
When counting by **event totals**, the earliest/longest logic **doesn't apply**. Instead, Amplitude considers **all** conversion paths taken or attempted, rather than just the earliest/longest path per user. Amplitude then attributes the paths to the property for the event in the step it was broken down by.
## Funnels versus event segmentation
The Funnel and Event Segmentation charts provide different types of analyses, and can display different results. The following table highlights some of those differences:
| **Funnel** | **Event Segmentation** |
| ------------------------------------------------ | ------------------------------------------ |
| Shows **steps** a user takes to gauge experience | Shows what **events** users are triggering |
| Filters only apply to the **first** step | Filters apply to **every** event |
| User **must execute step 1** to **enter funnel** | **No funnel** to enter |
================================================================================
# How Amplitude computes funnels
URL: https://amplitude.com/docs/analytics/charts/funnel-analysis/funnel-analysis-how-amplitude-computes
================================================================================
# How Amplitude computes funnels
Unlike other charts, a Funnel Analysis requires you to specify the order of the events you include in the Events Module. Your options are:
| Order | Definition |
| ----------- | -------------------------------------------------------------------------------------------------------------------------------------------------------------------------------------------------------------------------- |
| Any order | Amplitude considers a user converted when they complete all listed steps. |
| This order | Amplitude considers a user converted when they complete steps in the order you specify. They can trigger events in between those you specify and still count as a conversion. You can add repeated steps with this option. |
| Exact order | Similar to _This order_, Amplitude considers a user converted when they complete steps in the order you specify, but don't trigger events in between. |
{% callout type="note" %}
In ordered funnels, events are unique per conversion path. For example, you have a funnel with two events: `search -> add to cart`. A user searches four times and then adds a product to their cart after the last search: `search, search, search, search, add to cart`. Amplitude records one conversion, even though four occurrences of the funnel's first step exist.
{% /callout %}
## Segmentation
When you [segment the data on a user property](https://amplitude.com/docs/analytics/charts/build-charts-add-events), Amplitude applies the segmentation to the first step of your funnel.
For example, suppose Event A is the first step of your funnel, and a user triggered:
- Event B with the user property `[Amplitude] Country` = `Canada`; and then
- Event A with the user property `[Amplitude] Country` = `United States`
If you segment by country, Amplitude shows this user in the `[Amplitude] Country` = `United States` segment in the Event A step.
## Filters
Applying filters in a funnel analysis has certain nuances:
### Applying filters in the Segmentation Module
In a funnel chart, any filters applied from the Segmentation Module apply only to the first event. You can, however, add filters to individual steps directly in the Events module.
{% callout type="note" %}
Amplitude only counts users as entering the funnel if they trigger an event that meets the conditions of the filters applied to the first event.
{% /callout %}
### Applying group-by filters
You can apply a group-by filter in the Segmentation Module, for up to two properties. The group-by filter applies only to the first event, similar to the other filters in the Segmentation Module.
If you look at the Unique Users metric and users can complete the steps of your funnel multiple times, the group-by filter takes the first occurrence of the event and buckets the user for the value on that event.
{% callout type="note" %}
If "holding property constant" applies at the same time, Amplitude counts each property value / user pair as a separate user, so the user appears once for each property value they have.
{% /callout %}
You can also use the group-by filter for an event (limit of one event group-by per funnel). The results show how users with a certain event or user property converted through the other steps in the funnel. This helps you understand which property value has the greatest or smallest impact on conversion.
For example, look at this Funnel Analysis chart:
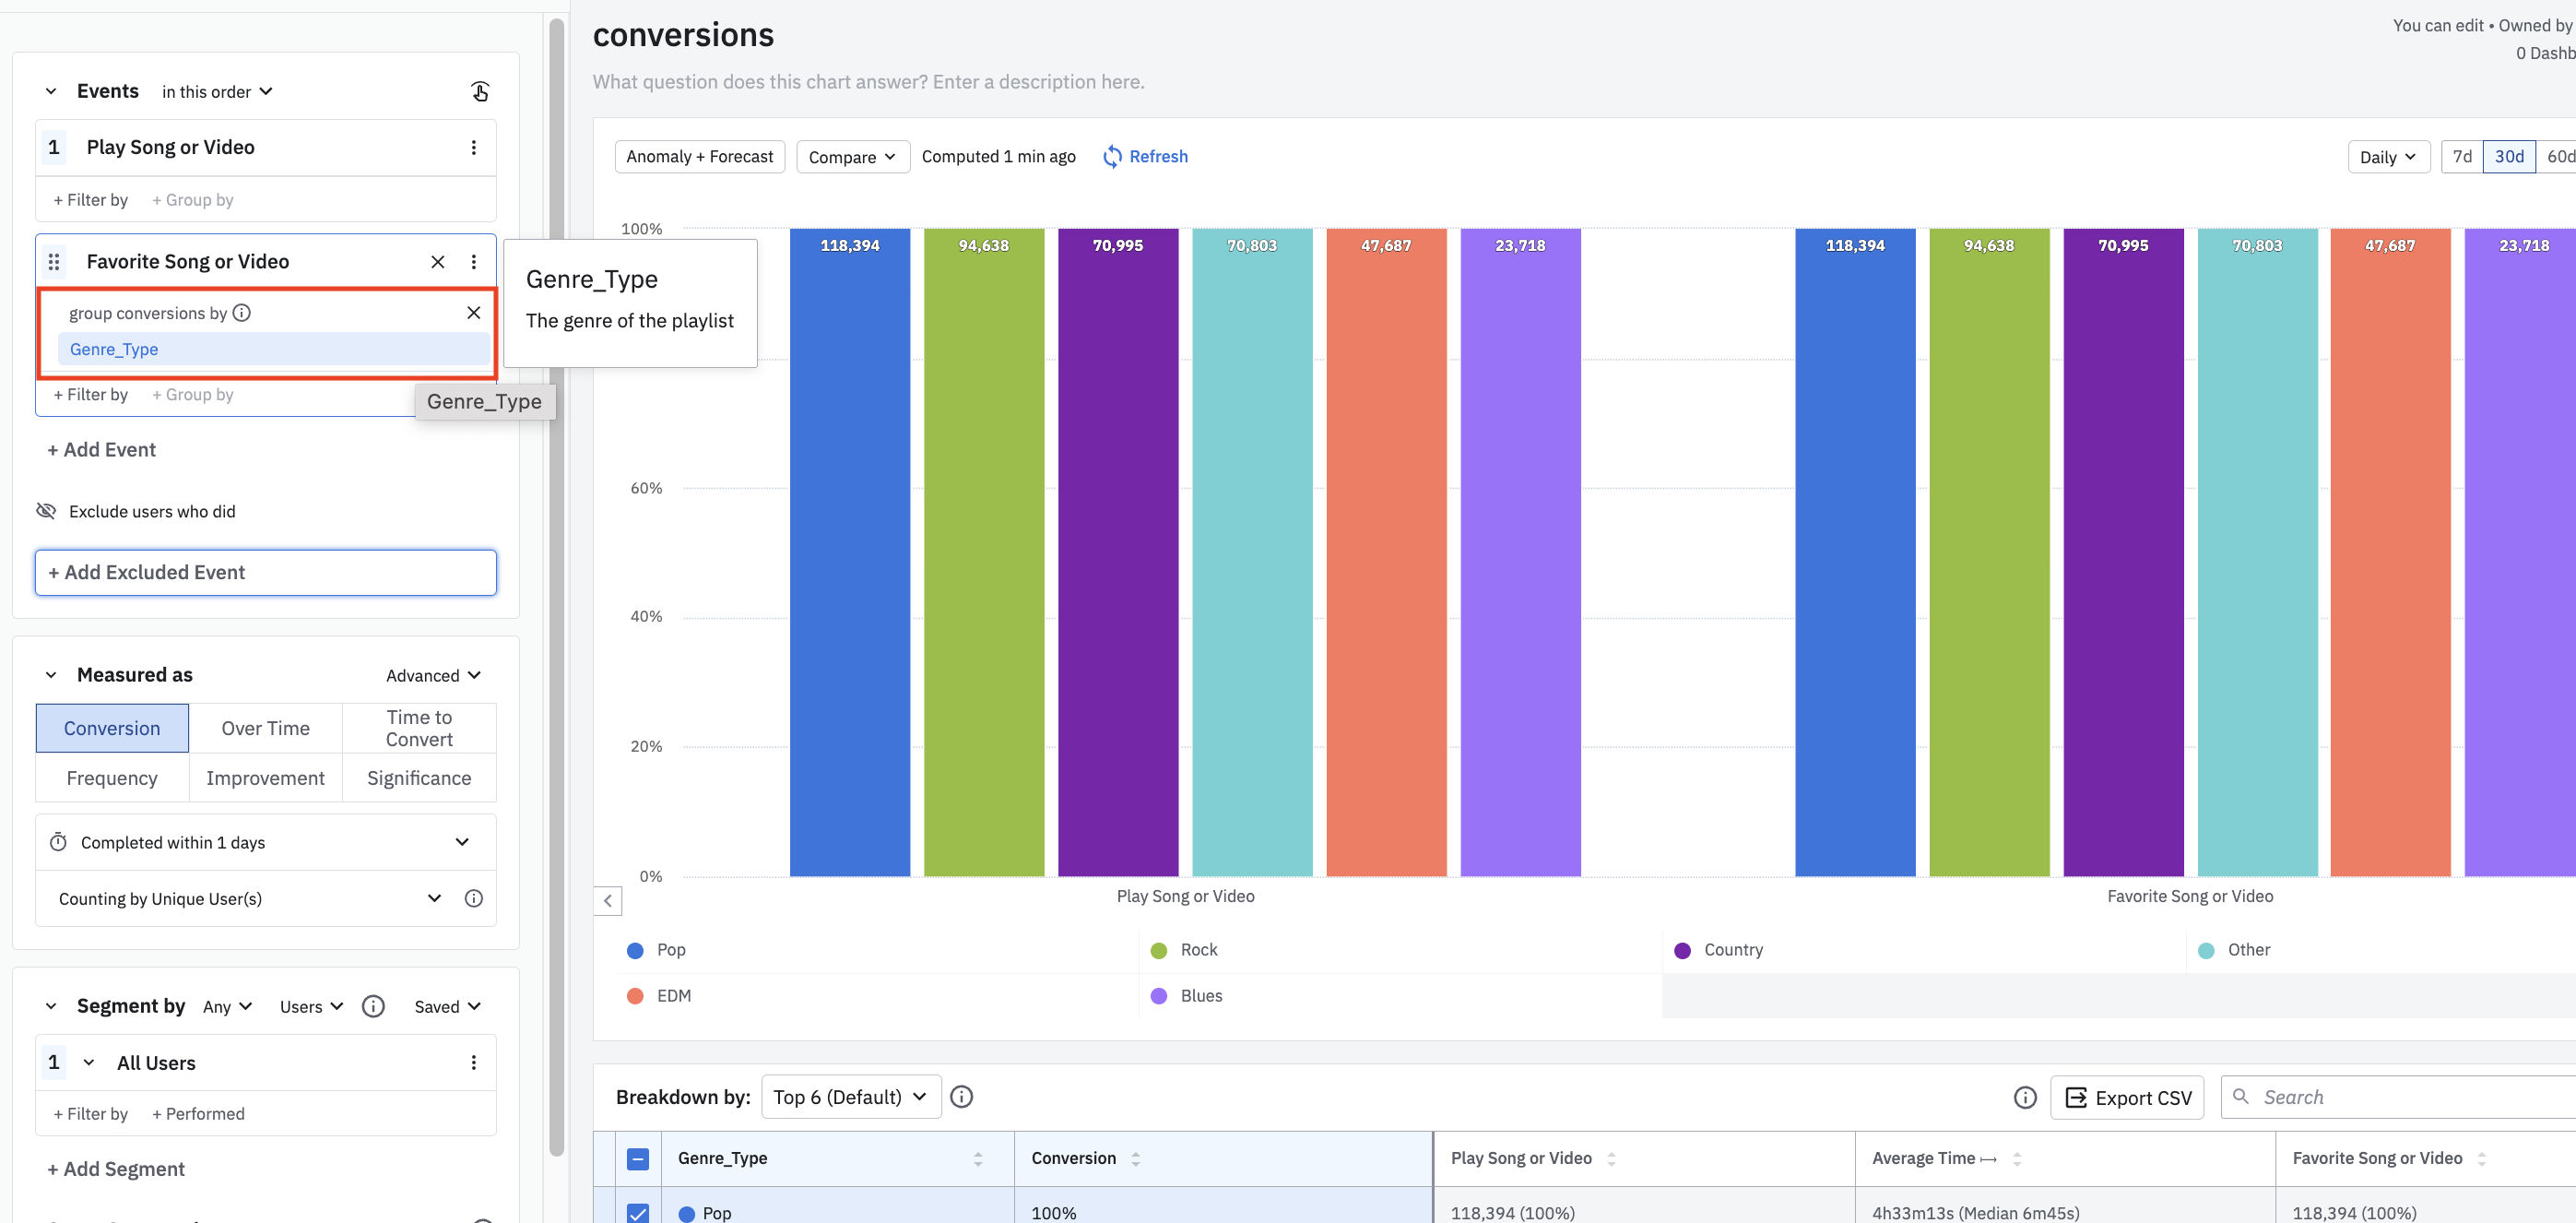
The _Group-by_ here looks at users' property values for `Genre_Type` at the time their `Favorite Song or Video` events trigger, and shows how they converted through the remaining events of the funnel.
For example, a user that has a `Pop` property value for `Genre_Type` at the time their `Favorite Song or Video` event triggered shows up under the `Pop` property bar for the `Play Song or Video` event as well.
{% callout type="note" %}
If users in your funnel can complete the steps multiple times, this method takes the first occurrence of each event and buckets the user for the value on that event.
{% /callout %}
This three-step funnel groups by Step 2's event property, `item_id`:
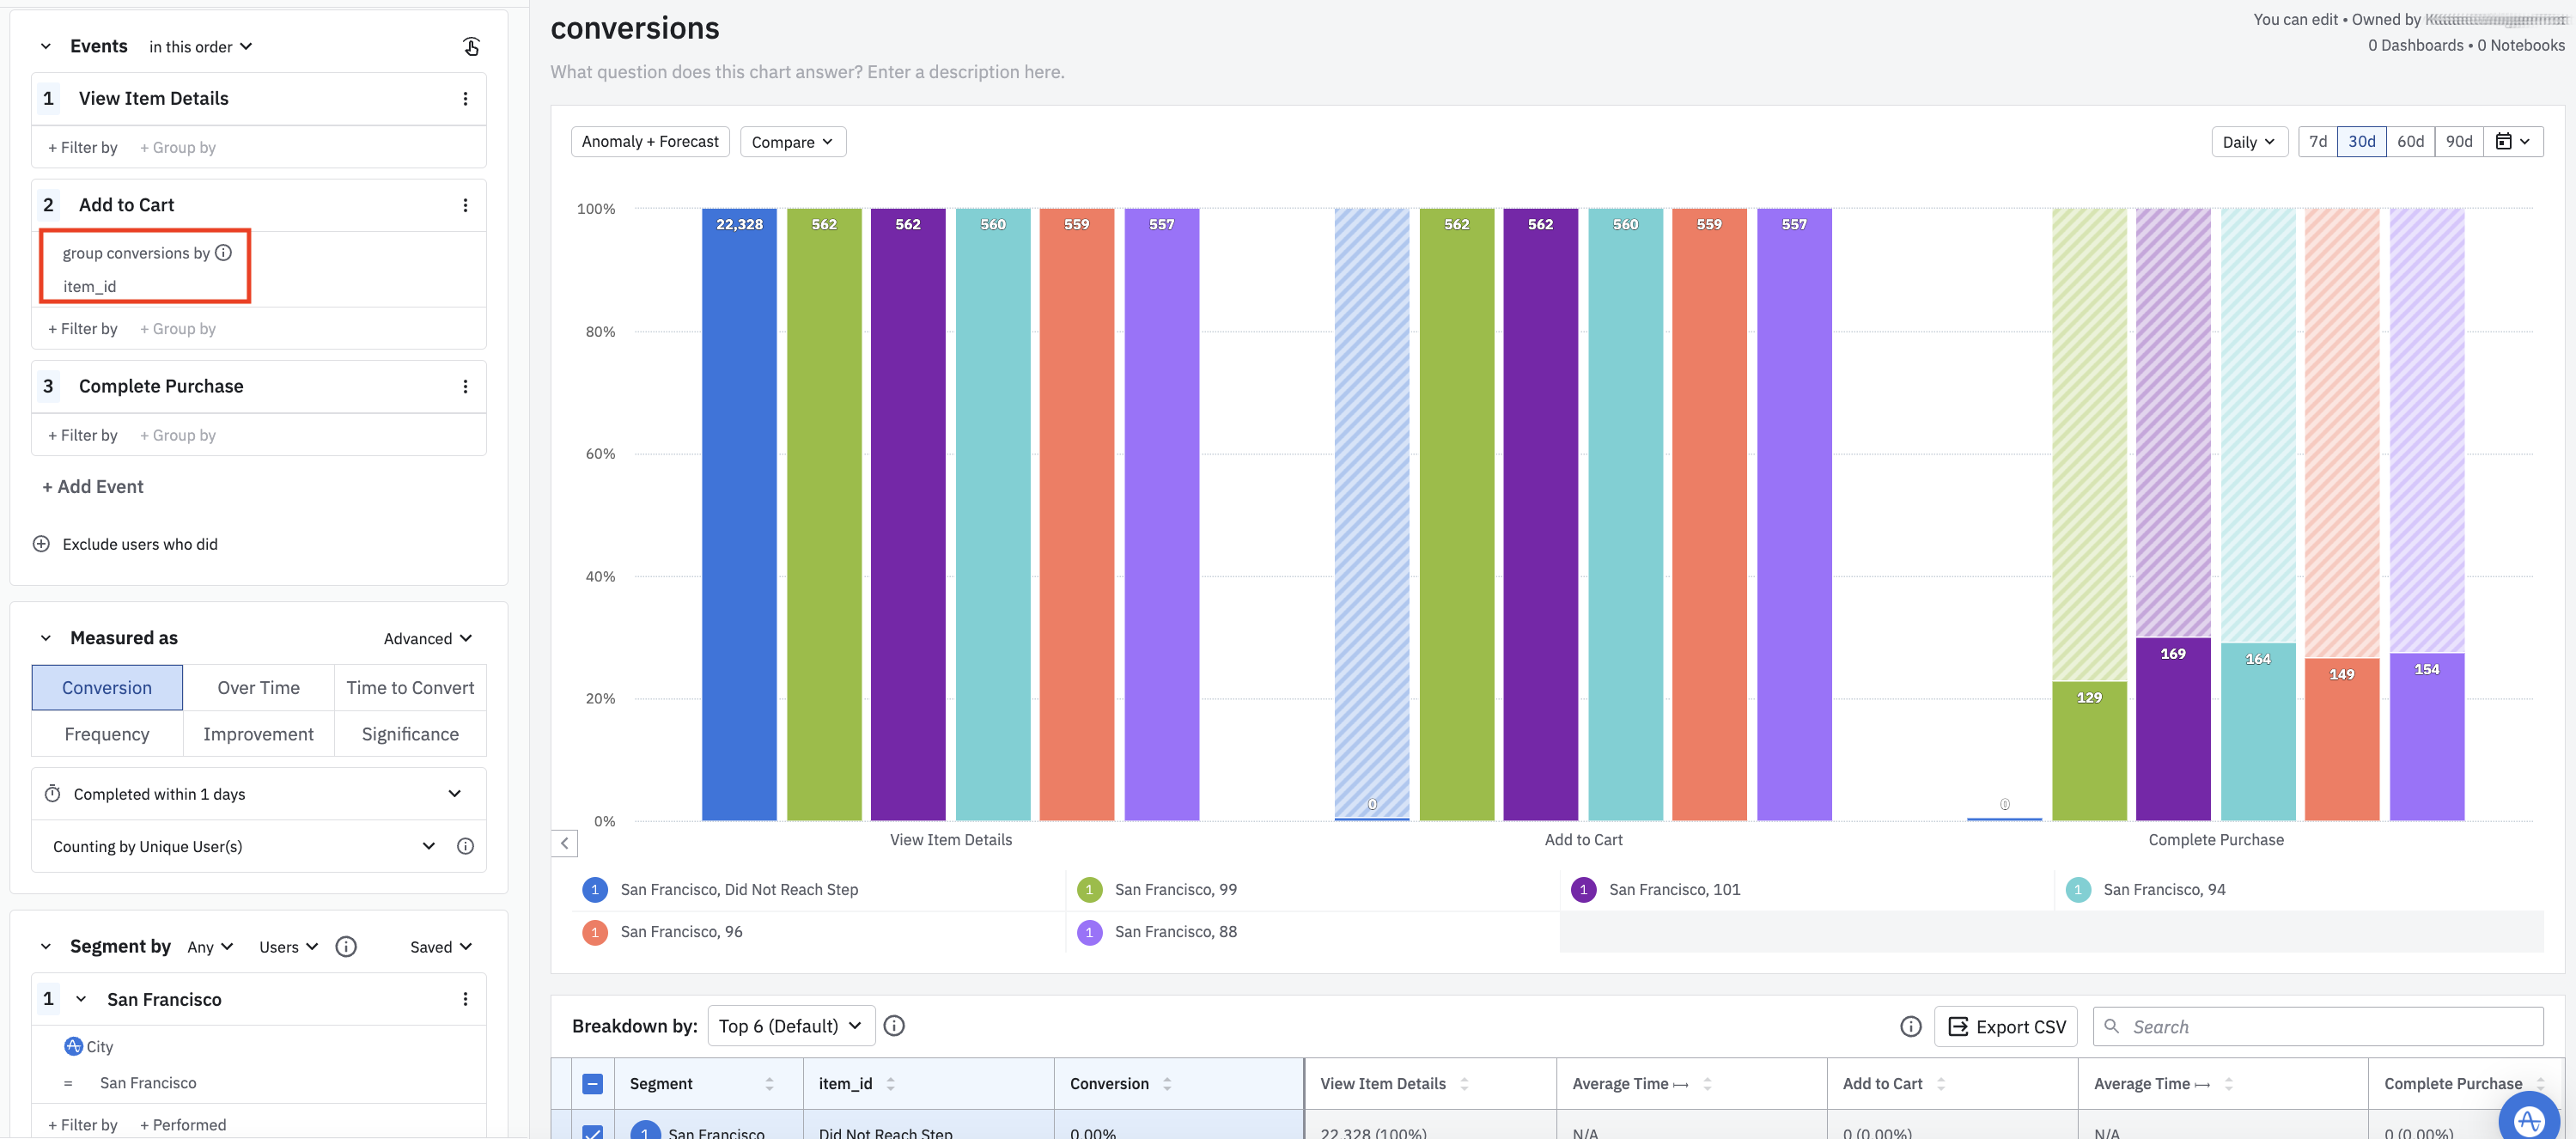
The graph shows the conversion distribution of users who triggered the Step 2 (`Add to Cart`) event, broken out by each `item_id` value.
If you choose to group by a step other than the first, Amplitude shows a segment of users who didn't reach that segmented step (the blue-shaded segment for `did not reach step` in this example).
================================================================================
# How Amplitude handles segmenting on a user property in a Funnel Analysis chart
URL: https://amplitude.com/docs/analytics/charts/funnel-analysis/funnel-analysis-how-amplitude-handles-segmenting
================================================================================
# How Amplitude handles segmenting on a user property in a Funnel Analysis chart
When you [segment the data on a user property](https://amplitude.com/docs/analytics/charts/build-charts-add-events), Amplitude applies the segmentation to the first step of your funnel.
For example, suppose Event A is the first step of your funnel, and a user triggered:
- Event B with the user property `[Amplitude] Country` = `Canada`; and then
- Event A with the user property `[Amplitude] Country` = `United States`
If you segment by Active country(s), Amplitude shows this user in the `[Amplitude] Country` = `United States` segment in the Event A step.
================================================================================
# How Amplitude handles simultaneous events in a funnel
URL: https://amplitude.com/docs/analytics/charts/funnel-analysis/funnel-analysis-how-amplitude-handles-simultaneous-events
================================================================================
# How Amplitude handles simultaneous events in a funnel
Amplitude rounds all time to the nearest second. For that reason, it maintains a one-second window to account for **simultaneous events**. If a user fires two different events within one second, Amplitude doesn't try to determine which one came first. Instead, it considers **either** order correct and applies that to your funnel.
For example, if a user fires Event B first, and then fires Event A within one second, a funnel counts this as a conversion from **either** Event A -> Event B, **or** Event B -> Event A.
In an exact order funnel, if an event that isn't part of your funnel definition fires simultaneously in the same second, Amplitude still considers that user converted.
{% callout type="note" %}
When you use [Historical Count](https://amplitude.com/docs/analytics/historical-count-1) filters on the _same_ events that occur within the _same_ second, users appear to have dropped off. The funnel query doesn't distinguish between events that happen within the same second, but the Historical Count filter does.
{% /callout %}
## Same events fire at once
If two of the same event types send within the same second, Amplitude counts only one of them. This also applies if you use `Any Event` within the step of a funnel, or if custom events within your funnel steps share the same sub-events: Amplitude assumes they're the same event if they fire at the same second and doesn't count each instance. To address this, ensure the step conditions are mutually exclusive, or turn on [millisecond resolution](#millisecond-resolution) to capture events precisely.
## Millisecond resolution
By default, Amplitude assumes events don't trigger within one second of each other. However, if you have multiple events that fire at the same time and you want to observe the precise order of events, you can turn on millisecond resolution.
Follow these steps to track events by the millisecond:
1. From your Funnel Analysis, open the _Advanced_ dropdown in the _Measured As_ module.
2. Click _Millisecond resolution_.
The funnel updates automatically, and shows events tracked by the millisecond instead of by the second.
================================================================================
# How filters work in a Funnel Analysis chart
URL: https://amplitude.com/docs/analytics/charts/funnel-analysis/funnel-analysis-how-filters-work
================================================================================
# How filters work in a Funnel Analysis chart
Applying filters in a funnel analysis has certain nuances:
## Applying filters in the Segmentation Module
In a funnel chart, any filters applied through the Segmentation Module apply only to the first event. You can, however, add filters to individual steps directly in the Events module.
{% callout type="note" %}
Amplitude only counts users as entering the funnel if they trigger an event that meets the conditions of the filters applied to the first event.
{% /callout %}
## Applying group-by filters
You can apply a group-by filter in the Segmentation Module, for up to two properties. The group-by filter applies only to the first event, similar to the other filters in the Segmentation Module.
If you look at the Unique Users metric and users can complete the steps of your funnel multiple times, the group-by filter takes the first occurrence of the event and buckets the user for the value on that event.
{% callout type="note" %}
If "holding property constant" applies at the same time, Amplitude counts each property value / user pair as a separate user, so the user appears once for each property value they have.
{% /callout %}
You can also use the group-by filter for an event (limit of one event group-by per funnel). The results show how users with a certain event or user property converted through the other steps in the funnel. This helps you understand which property value potentially has the greatest or smallest impact on conversion.
For example, look at this Funnel Analysis chart:

The _Group-by_ here looks at users' property values for `Genre_Type` at the time their `Favorite Song or Video` events trigger, and shows how they converted through the remaining events of the funnel.
For example, a user that has a `Pop` property value for `Genre_Type` at the time their `Favorite Song or Video` event triggered shows up under the `Pop` property bar for the `Play Song or Video` event as well.
{% callout type="note" %}
If users in your funnel can complete the steps multiple times, this method takes the first occurrence of each event and buckets the user for the value on that event.
{% /callout %}
This three-step funnel groups by Step 2's event property, `item_id`:

The graph shows the conversion distribution of users who triggered the Step 2 (`Add Item to Cart`) event, broken out by each `item_id` value.
If you choose to group by a step other than the first, you also see a segment of users who didn't reach that segmented step (the blue-shaded segment for 'did not reach step' in this example).
================================================================================
# Identify conversion drivers in your funnel analyses
URL: https://amplitude.com/docs/analytics/charts/funnel-analysis/funnel-analysis-identify-conversion-drivers
================================================================================
# Identify conversion drivers in your funnel analyses
Knowing which events lead to conversions and which events don't is a crucial part of any analytics program. With Amplitude, you can also conduct deeper analyses and learn **why** users convert or churn after a specific event, with **conversion drivers**.
Use this feature to understand which behaviors drive key outcomes in your customer journey. To help you do that, Amplitude provides several relevant metrics in each conversion driver analysis:
- A correlation score.
- Behavior frequency.
- Percentage of users engaging in that behavior.
- Overall time to convert when a user engages in that behavior.
These metrics help clarify the frequency of different user actions, and whether they help or impede conversion.
## Before you begin
- If you haven't already, familiarize yourself with the Funnel Analysis chart.
- Always keep in mind that **correlation doesn't equal causation**.
- This feature only works for funnel charts set up for the conversion metric, with the order of events set to "this order".
For a more advanced look at funnel analysis, refer to [the funnel analysis interpretation guide](https://amplitude.com/docs/analytics/charts/funnel-analysis/funnel-analysis-interpret).
## Analyze events performed between funnel steps
A conversion drivers analysis begins with a simple, two-step funnel. Step one should be the starting event—for example, `Search Song or Video` in a music app—while step two should be the conversion event you're interested in, like `Purchase Song or Video`. Amplitude then automatically sorts through, aggregates, and analyzes all events that occur for each user **between these two steps** to identify which user actions correlate most strongly with that outcome.
To start a conversion drivers analysis, follow these steps:
1. From within a funnel analysis chart, find the step you want to examine as a conversion event. It can be any step after the initial event in the funnel. This opens the Microscope.
2. From the Microscope, click _Explore Conversion Drivers_. This opens the conversion drivers panel.
The conversion drivers panel has two sections. The **step controller** lets you choose the beginning and ending steps for your conversion driver analysis. You can change these by clicking on them and selecting the events you want.
This section also displays the conversion and drop-off numbers for the steps you selected, in terms of both unique users and a percentage of users.
Below the step controller is the **events table**. This lists all the events users performed _between_ the two selected steps. At the top of the table, you can choose to look at the event list either for users who converted, or for users who dropped off.
The events table shows four relevant metrics for each event listed:
- **Correlation Score**: [Correlation](#01H82R1VSSKZDBJ2RMNNMD25E4) means there's a relationship between two things. In this context, the correlation column quantifies the relationship between the event in question and conversion (or drop-off), depending on which tab you selected (_Converted_ or _Dropped Off_). The higher the score, the stronger the relationship.
- **Frequency**: The average number of times users fired a given event between the two selected funnel steps.
- **% Who Did Event**: The percentage (and absolute numbers) of users in the selected cohort who fired a given event.
- **Time Between Steps**: How long it took users who fired a given event to convert between the two selected funnel steps.
### How Amplitude identifies events to include in a conversion drivers analysis
For users who **convert**, Amplitude looks at the events performed between the timestamps of the two selected funnel steps. For users who **churn**, Amplitude looks at the timestamps of the first selected funnel step, and their entry into the funnel plus the conversion window.
Imagine a funnel defined as A --> B --> C, and you want to investigate drivers of conversion at step C. The following table shows the time periods analyzed for each set of users, where t() represents the timestamp of the event performed:
| | |
| ------------- | ----------------------------- |
| **Converted** | **Dropped-off** |
| t(b), t(c) | t(b), t(a)+ conversion window |
### Understand the correlation score
Correlation is a measure (ranging from -1 to 1) of how two variables relate to each other. In a conversion drivers analysis, the variables for each user are:
- Whether the user performed the selected event.
- Whether the user was in the cohort you selected (converted or dropped off).
Click _View Correlation data_ for a detailed confusion matrix (also known as a prediction summary). This matrix shows the count and percentage of users in your base cohort that constitute:
- **True Positives** (TP, top left of matrix): Converted users predicted to perform the event.
- **False Positives** (FP, top right): Dropped-off users predicted to perform the event.
- **False Negatives** (FN, bottom left): Converted users predicted not to perform the event.
- **True Negatives** (TN, bottom right): Dropped-off users predicted not to perform the event.
You might have heard of different variations and definitions of correlation, including Matthews correlation, Pearson correlation, phi coefficient, and R-value. In this case, all these definitions are equivalent because a conversion drivers analysis looks at pairs of binary random variables.
Remember, **correlation isn't causation**, so you must still test and verify hypotheses generated by a conversion drivers analysis in the real world.
{% callout type="note" %}
Use [Amplitude Experiment](https://help.amplitude.com/hc/en-us/articles/360061270232-Amplitude-Experiment-overview-Optimize-your-product-experience-through-A-B-testing) to determine causality.
{% /callout %}
## Event properties and conversion drivers
When you look at combinations of attributes on an event, you get a more accurate picture of what a user does in your product, which leads to a more layered and nuanced analysis.
To use this feature, open a funnel chart and follow these steps:
1. On the chart, find the event you want to analyze. Open the Microscope by clicking either the top section (for churn) or the bottom section (for conversions). Then click _Explore Conversion Drivers_. This opens the conversion drivers tab.
The conversion drivers tab lists every event included in your project, along with each event's correlation with either conversion or churn. In this example, the `Add Content to Cart` event correlates very highly (+0.97) with conversion on the `Purchase Song or Video` event.
{% callout type="note" %}
You can switch between viewing correlations with conversions and correlations with churn by clicking _Converted_ or _Dropped Off_, directly above the list of events.
{% /callout %}
2. Locate the event you want. Below the event name, click _Expand by Property_.
3. Click the _Select property …_ button and click the property you want to analyze.
In this example, the goal is to find out which genres customers most frequently add to their carts and then purchase—remember, this analysis looks at users who converted on `Purchase Song or Video`. Here, pop is the most popular genre, with a correlation of +0.41.
{% callout type="note" %}
You can add up to three different properties. You can also create another, separate property view by clicking _+_. Each property view is completely independent of any other property views you might have already created.
{% /callout %}
## Share the report
When you find a valuable insight using conversion drivers, you can share it with a teammate:
1. Click _Share_.
2. Click _Copy Chart Link_ to copy the chart's unique URL to your clipboard, then send your analysis to others.
================================================================================
# Mark a step in your funnel as optional
URL: https://amplitude.com/docs/analytics/charts/funnel-analysis/funnel-analysis-optional-step
================================================================================
# Mark a step in your funnel as optional
Sometimes you need to define a conversion where some steps are optional. For example, a funnel has steps A, B, C, and D, where B is optional. If a user performs steps A, C, and D, they still convert.
Click **More Options** in the Events side control and select _Optional step_ to make a step optional.
When you mark an event optional, the side control says _\*Optional_ and has a dotted line around it.
The chart then shows two funnels: one with the step and one without the step. The conversion takeaways and breakdown table also reflect these two scenarios.
Marking a step as optional has some limitations:
- It's available for Conversion and Conversion Over Time only.
- Only one step can be optional at a time.
- Only middle steps can be optional. First and last steps can never be optional.
- You can't reorder optional events.
- Events with a group-by can't be optional.
- Events that compare multiple events can't be optional.
You can also create in-line custom events in Funnel and Event Segmentation charts. For more information, refer to [Inline events](https://amplitude.com/docs/analytics/charts/event-segmentation/event-segmentation-in-line-events).
================================================================================
# A/B testing in a Funnel Analysis chart
URL: https://amplitude.com/docs/analytics/charts/funnel-analysis/funnel-analysis-ab-test
================================================================================
# A/B testing in a Funnel Analysis chart
{% callout type="note" %}
For best practices, including tips on instrumentation, refer to [How to Analyze A/B Tests Results in Amplitude](https://amplitude.com/docs/get-started/analyze-a-b-test-results).
{% /callout %}
In Amplitude, A/B testing lets you compare the funnel conversion performance of two or more user segments against each other. View results as **improvement**, which describes the performance of a segment compared to the baseline, or as **statistical significance**, which shows the probability of observing a difference as extreme as what you saw, assuming the control and treatment have the same mean.
{% callout type="note" %}
For statistical significance calculations with continuous metrics, use the [experiment results chart](https://amplitude.com/docs/analytics/charts/experiment-results/experiment-results-dig-deeper) or the [Experiment end-to-end product](https://amplitude.com/docs/feature-experiment/overview).
{% /callout %}
By default, Amplitude uses the first segment added to the funnel analysis as the baseline. Change this in the _Baseline segment_ drop-down menu.
### A/B Test - Improvement
This chart displays the conversion rate for each segment across all steps in your funnel. You can have more than one variant in an A/B test, but you can only have one baseline.
### A/B Test - Significance
On this chart, a high value for a variant suggests it converts better than the baseline. A low value suggests it doesn't.
Amplitude considers the results statistically significant when the results meet these conditions:
- A sample size above 30 for both variants.
- Sample `size * conversion rate >= 5` **and** `sample size * (1-conversion rate) >= 5` for both variants.
- A significance of 95% or greater.
For more details, refer to [how Amplitude calculates statistical significance](https://amplitude.com/docs/feature-experiment/experiment-theory/analyze-with-t-test#common-questions).
### Understand the breakdown table
The data table below the chart breaks down the data. As with all data tables in Amplitude, you can export the data as a CSV file. The columns include:
- **Count:** The number of users or groups that entered the funnel.
- **Converted:** The number of users or groups that completed all the steps in the funnel with all conditions met.
- **% Conversion:** The number of converted users or groups, divided by the number of users or groups that entered the funnel.
- **% Improvement over Baseline:** Amplitude calculates this with the equation `(% conversion for that variant - % conversion for the baseline) / (% conversion for the baseline)`. The percentage in the data table is green when the value is a positive number.
- **Significance:** The likelihood that the performance displayed for each test variant is **actually** different from zero, and not due to random fluctuations in the data. The higher this value is, the more confident you can be in your results. More formally, this is `1 - p-value`.
================================================================================
# Funnel Analysis FAQ
URL: https://amplitude.com/docs/analytics/charts/funnel-analysis/faq
================================================================================
# Funnel Analysis FAQ
## Common questions
This page answers common questions about the Funnel Analysis chart.
## Funnel metrics
### Do funnels count by unique users or by event totals?
Either one. To switch from unique users to event totals, select _Totals_ from the _Counting by_ dropdown.
{% callout type="note" %}
For event totals, the earliest-longest logic no longer applies. Amplitude considers **all** conversion paths taken or attempted rather than just the earliest-longest path per user. Amplitude then attributes the paths to the property for the event in the step the funnel broke it down by.
{% /callout %}
You can also use the Holding Property Constant feature to count by unique user-property pairs. For example, if you hold `Session ID` constant, you can count a user multiple times when they perform the funnel events in different sessions.
{% callout type="note" %}
To hold a property constant, the property must exist on all events in the funnel.
{% /callout %}
### Do funnel charts count conversion in 24-hour windows or by calendar dates?
The conversion window uses a **24-hour window** when looking at conversion from Step 1 to Step 2. The window isn't based on strict calendar dates.
### How can I tie revenue to funnel conversions?
In the Measured As module, check _Calculate sum of property for final step_ from within the _Advanced_ dropdown. Then, in the field labeled _Property sum for final step_, select the revenue property you want Amplitude to calculate.
The result appears in the breakdown table.
### Why does my conversion over time chart show lower conversion rates than my regular funnel analysis chart?
By default, the conversion Funnel Analysis chart counts unique users. A single user can only appear in the chart once. However, the Conversion Over Time funnel chart can count a user in multiple data points.
For example, imagine a user who triggered Step 1 of your funnel on January 1, January 5, and January 20, and triggered Step 2 of the funnel on January 2 and January 6. In a Conversion Funnel chart with a date range of January 1-31, the user counts as 100% converted because they completed the funnel steps within those dates. In a Conversion Over Time Funnel chart, the user counts as 100% converted for January 1 and January 5, but 0% converted on January 20. As a result, the conversion rate for January 20 may appear lower than in the regular conversion chart.
### I select the same events in the event segmentation and funnel charts. Why do I see different results between these charts?
Event segmentation and funnel charts are different types of analyses, so they can show different results.
In a funnel chart, users must perform the first step within the selected date range to enter the funnel. They must then complete the remaining steps in a defined order within the conversion window to count as converted.
In an event segmentation chart, users must fire the chosen events within the selected date range to appear in the chart.
In addition, if you apply a segment filter in the segmentation module, the filter only applies to the first step in the funnel chart. In a segmentation chart, the filter applies to every event.
For more, refer to [How Amplitude computes conversions](https://amplitude.com/docs/analytics/charts/funnel-analysis/funnel-analysis-how-amplitude-computes-conversions) and this [community post](https://community.amplitude.com/building-and-sharing-your-analysis-58/what-is-the-difference-between-funnel-and-event-segmentation-charts-1873).
### How is the median time to convert calculated?
When the funnel chart looks at the median time to convert in distribution view, it only counts the first conversion per user in the entire date range. When you switch to the time to convert over time view, Amplitude counts the first conversion of each user in each day of the date range. For example, if users can convert more than once in a day, only the first conversion of that day counts.
In both cases, Amplitude uses [an approximate algorithm](https://metamarkets.com/2013/histograms/) to estimate the median time to convert. The median time to convert is only an approximation.
### Is the median time to convert calculated using the entire data set or using the bin min/max I enter?
Amplitude calculates it using the entire data set. Amplitude calculates the percentages on the Y-axis using the bin min/max limits.
### I exclude some events from the funnel, but why do excluded events appear in the Show User Paths of converted users?
Users who performed the excluded steps don't necessarily count as dropped off. Users can have multiple conversions in the funnel. As long as at least one of their conversions satisfies the exclusion constraint, they count as converted.
### Can I use the holding constant feature if the property is an array?
Yes, you can hold an array property constant in a funnel. Amplitude treats each item in the array as an independent value.
Consider a two-step funnel (Event A > Event B). A user performed the events with the following `item_id` property values:
Event A where `item_id = [1, 2, 3]`
Event B where `item_id = 3`
When the funnel holds `item_id` constant, the user counts as converted because the `item_id` value in Event B matches one of the values in the array in Event A. In other words, the value of the property held constant isn't necessarily the same across all the funnel events.
## Funnel order (this order, any order, exact order)
### In an 'Any Order' funnel, do users need to complete the first event as the first step?
"Any Order" requires users to perform the first event within the date range to count as part of the funnel. Users who fire the later events without firing the first event don't count as part of the funnel. In other words, users don't have to perform the first event as the first step in their sequence to count as converted.
### Why do the numbers change when I move the first and last step of an 'Any Order' funnel chart?
In an "Any Order" funnel, the number for the first event is the number of users who fire the first event to enter the funnel. Users must do all the events in the funnel to count for the last step, because no step can be skipped. Although users can complete the events in any order, they must complete all the other steps and the last step to count as converted for the last step. If the funnel has only two or three events, moving the first and last events around changes the results, because the ordering of the first and last events still matters.
### In an 'Exact Order' funnel, why do users count as converted even when they perform an event that isn't included in the funnel?
In an "Exact Order" funnel, if an event that isn't part of the funnel definition fires in the same second as a funnel event, the user still counts as converted. A second is the default resolution Amplitude currently supports.
This also applies to excluding events from a funnel. If the excluded event happens in the same second as an event included in the funnel, the user still counts as converted.
If you need a more detailed level of time resolution, select Millisecond resolution in the Advanced drop-down.
## Usability
### If I create a cohort through Microscope in a funnel chart, is it static?
Cohorts created directly from Microscope on a Funnel Analysis chart are **dynamic if only events were added** to the chart. If the chart uses "holding property constant", "broken down by", or any inline cohorting, the cohort is **static**.
Also, you **can't** create dynamic cohorts from funnel charts that contain exclusions. Any such cohorts are static.
### How does the segment filter on the Segmentation module apply to the funnel chart?
In a funnel chart, the segment filter only applies to the first funnel event. Add individual filters to each step in the Event module if you want them to apply to each funnel event. For more information, refer to [How filters work in a Funnel Analysis chart](https://amplitude.com/docs/analytics/charts/funnel-analysis/funnel-analysis-how-filters-work).
### How can I export the data of a funnel chart?
Click the Export CSV button in the breakdown table to export the data. If a group-by filter applies in the funnel chart, the export limit is 300 group-by values. Learn more about [CSV download limits](https://amplitude.com/docs/faq/limits-and-quotas).
Alternatively, export the funnel result through [the Dashboard REST API](https://amplitude.com/docs/apis/analytics/dashboard-rest). The default group-by limit is 100, but you can edit the `limit` parameter to export up to 1000 group-by values.
================================================================================
# Build a retention analysis
URL: https://amplitude.com/docs/analytics/charts/retention-analysis/retention-analysis-build
================================================================================
# Build a retention analysis
Amplitude's **Retention Analysis** chart helps you drive product adoption by showing you how often users return to your product after taking a specific action (known as **triggering an event**).
Amplitude computes retention data by comparing the date of that starting event to the date of the **return event** you specified. The return event is the event that, when triggered, tells you a user is retained. When building a retention analysis chart, you can choose any event for both the starting and return events. You can also choose not to specify an event and instead tell Amplitude to use any active event.
{% callout type="note" %}
You may also find [this course on retention analysis](https://academy.amplitude.com/drive-product-adoption-with-retention-analysis) helpful.
{% /callout %}
You can select up to two return events for your retention analysis. Each event has its own analysis and appears as a separate segment in the chart.
The Retention Analysis chart's **usage interval** shows the percentage of active users who triggered the events you're interested in with a specified daily, weekly, or monthly median frequency. Essentially, it shows how much time elapses between a user firing your product's critical event. This is a vital piece of your retention analysis puzzle. Knowing how often users actually use your product helps you gauge the health of your product when looking at Retention Analysis and [Lifecycle](https://amplitude.com/docs/analytics/charts/lifecycle/lifecycle-track-growth) charts.
## Before you begin
You can't use the Retention Analysis chart, or any other Amplitude chart, until you complete the instrumentation process. Read the article on [building charts in Amplitude](https://amplitude.com/docs/analytics/charts/build-charts-add-events) to learn the basics of Amplitude's user interface.
If you're new to Amplitude, read about the [Event Segmentation](https://amplitude.com/docs/analytics/charts/event-segmentation/event-segmentation-build) chart before moving on to Retention Analysis. You may also want to review the [playbook on mastering retention](https://amplitude.com/mastering-retention).
## Set up a retention analysis
At its core, a retention analysis measures the amount of time between two different user events. Tell Amplitude what those events are and which users to include in the analysis.
{% callout type="note" %}
You can include both active and inactive events in your retention analyses, but most customers find their Amplitude charts more insightful when they focus on active events.
{% /callout %}
To build a Retention Analysis chart, follow these steps:
1. In the Events Module, select the starting event. You can choose a specific event that's instrumented in Amplitude, or you can tell Amplitude to consider any event as the starting event for this analysis by selecting _Any Event_ from the list of available events.
2. To filter by properties on your starting event, click _+ Filter by_, select the property name, and specify the property value you're interested in.
3. Select at least one return event. You can choose up to two, and you can filter by properties on these events as well.
4. In the Segmentation Module, identify the user segment you want to include in this analysis. You can import a previously saved segment by clicking the _Saved_ dropdown and selecting the one you want from the list. Otherwise, Amplitude assumes your analysis targets all users.
{% callout type="note" %}
The user segment you select applies only to the starting event.
{% /callout %}
5. If you don't want to import a previously saved user segment, build your own by adding properties. To do so, click _+ Filter by_, choose the property you want to include, and specify the property value you're interested in.
6. To narrow your focus further, tell Amplitude to include only users who already performed certain actions. To do so, click _+ Performed_, then choose the event you're interested in.
7. To add another user segment, click _+ Add Segment_ and repeat steps 5 and 6.
{% callout type="note" %}
You can break out your starting event by user properties by clicking _… grouped by_ in the right module. For example, to group users by the cities they were in when they fired the starting event, select _City_ from the property list. Amplitude then breaks out the retention analysis on a city-by-city basis. However, you can include only one user segment in your analysis.
{% /callout %}
Your Retention Analysis chart appears, along with a tabular view of your results in the [breakdown table](https://amplitude.com/docs/analytics/charts/review-chart-data). Check or uncheck segments in the breakdown table to compare retention rates in the visual. For example, this Retention Analysis chart shows two lines for comparison because its third segment is unchecked.
{% callout type="note" %}
Amplitude includes users who triggered the starting event during the time period specified on the date picker, in the upper-right corner of the chart. Users don't have to trigger the return event during that period to appear in the analysis.
{% /callout %}
### Usage interval analysis
The Retention Analysis chart also supports [usage interval analyses](https://amplitude.com/docs/analytics/charts/retention-analysis/retention-analysis-usage-interval).
Or [learn how to interpret your Retention Analysis chart](https://amplitude.com/docs/analytics/charts/retention-analysis/retention-analysis-interpret).
================================================================================
# Interpret your retention analysis
URL: https://amplitude.com/docs/analytics/charts/retention-analysis/retention-analysis-interpret
================================================================================
# Interpret your retention analysis
Amplitude's **Retention Analysis** chart helps you drive product adoption by showing you how often users return to your product after triggering an initial event. This article describes how the Retention Analysis chart works and how to interpret the data it contains.
{% callout type="note" heading="" %}
You can use [Global Agent](https://amplitude.com/docs/amplitude-ai/global-agent-overview) to interpret retention charts with natural language. Ask questions like "Why did week 2 retention drop?" or "Show me 7-day retention for users who signed up last month" to analyze your retention data.
{% /callout %}
Analyze your retention analysis data in the chart area. There, you can:
- Specify the method Amplitude uses to measure retention ([Return On or After](#return-on-or-after-formerly-known-as-unbounded), [Return On](#return-on-formerly-known-as-n-day), or [Return On (Custom)](#return-on-custom-formerly-known-as-custom)).
- View data for either [Retention or Change Over Time](#retention-vs-change-over-time).
- Define how Amplitude measures days when it calculates retention (24-hour windows or strict calendar dates).
- Specify the timezone and set the time frame for your analysis using the date picker.
## Before you begin
If you haven't already read the overview of [Amplitude's Retention Analysis chart](https://amplitude.com/docs/analytics/charts/retention-analysis/retention-analysis-build), start there before continuing.
If you find the references to time in this article confusing, this Help Center article explains [how time works in a retention analysis](https://amplitude.com/docs/analytics/charts/retention-analysis/retention-analysis-time).
## Interpret your Retention Analysis chart: Retention view
Interpreting your Retention Analysis chart is simpler than it may at first appear, because you can read through the parameters like a sentence. For example, the following chart shows you (1) new users who came back and triggered (2) any event (3) on or after the first day of your retention analysis over (4) the last 45 days:
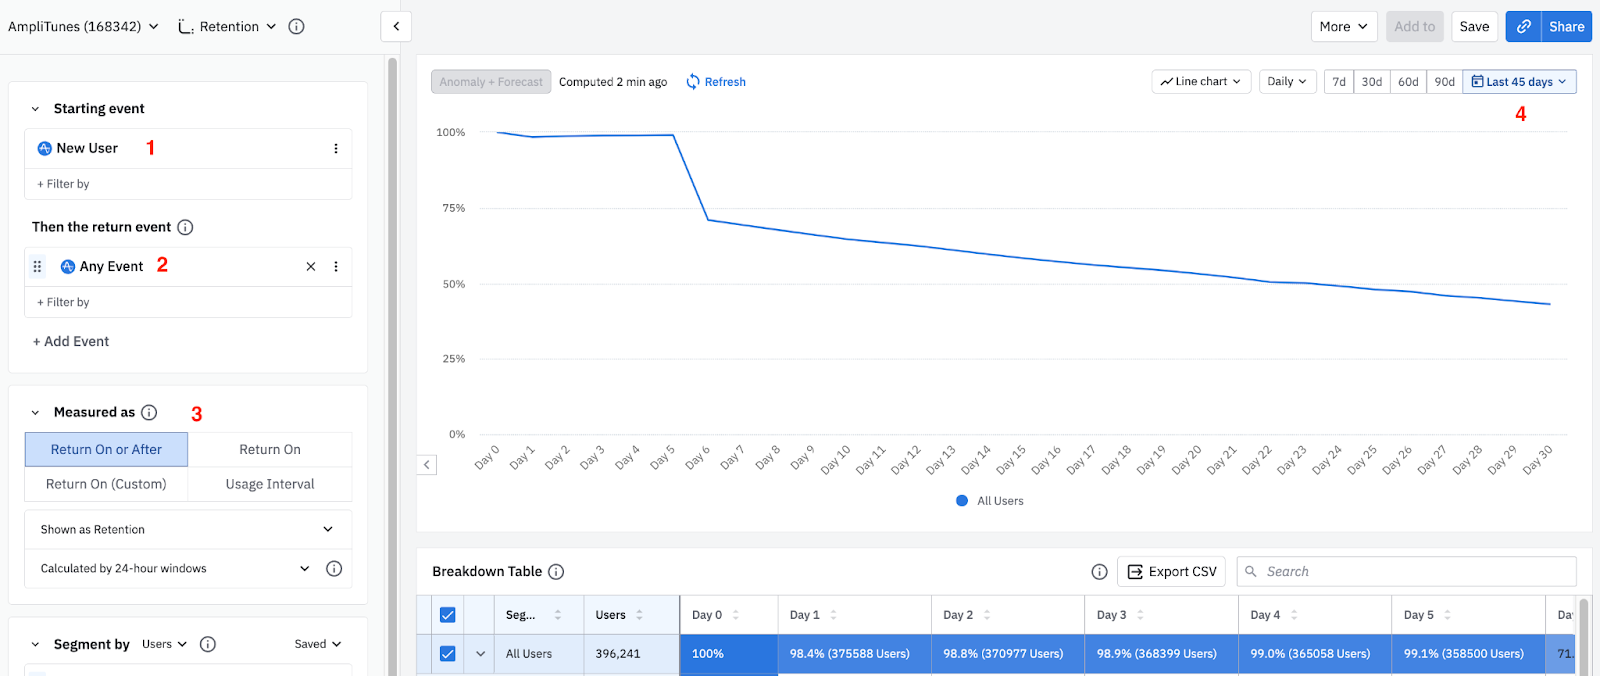{.expandable-image}
Change all these parameters to reflect the needs of your analysis.
The rest of this section explains how to measure retention, what the parameter options mean, and how to use them to generate the data you want.
## Different ways to measure retention
The Retention Analysis chart offers several options for measuring retention, based on when your users triggered their [return event](https://amplitude.com/docs/analytics/charts/retention-analysis/retention-analysis-build):
- To discover how many of your users triggered your return event **on a specific day or after** triggering your starting event, use [**Return On or After**](#return-on-or-after-formerly-known-as-unbounded) retention.
- To learn what percentage of users came back to fire your return event **only on a specific day** after they performed your starting event, use [**Return On**](#return-on-formerly-known-as-n-day) retention.
- To create custom brackets for your Return On retention instead of using predefined units of time (like weeks or days) as retention brackets, use [**Return On (Custom)**](#return-on-custom-formerly-known-as-custom) retention.
In all cases, the day a user triggers the starting event is their **cohort entry date**, an important concept when seeking to understand [how Amplitude Analytics calculates retention](https://amplitude.com/docs/analytics/charts/retention-analysis/retention-analysis-calculation).
### Return On or After (formerly known as Unbounded)
Return On or After retention tells you how many of your users triggered your return event **on a specific day or after** they triggered your starting event. When using Return On or After, the retention value for Day 7 tells you the percentage of users who returned seven days or more after their first use.
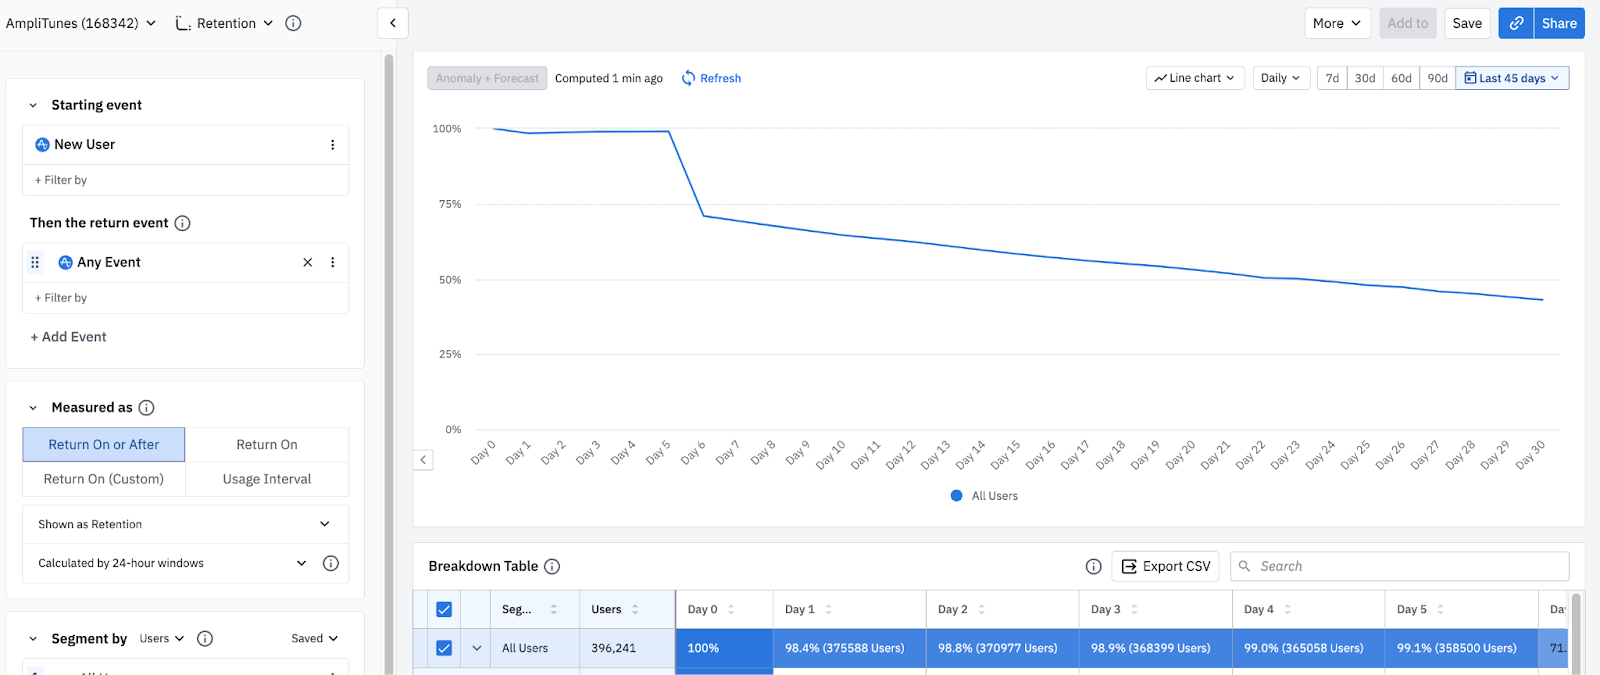{.expandable-image}
When you first open the Retention Analysis chart, the Return On or After retention graph by default shows retention for new users who returned any event. To see exact percentages, hover over the data point for the day you're interested in, or click it to inspect the users at that interval (refer to the Help Center article on [Amplitude's Microscope feature](https://amplitude.com/docs/analytics/microscope) to learn more).
To see this data as a bar chart, click the _Line chart_ dropdown. You can still use Microscope to get more details on users who weren't retained.
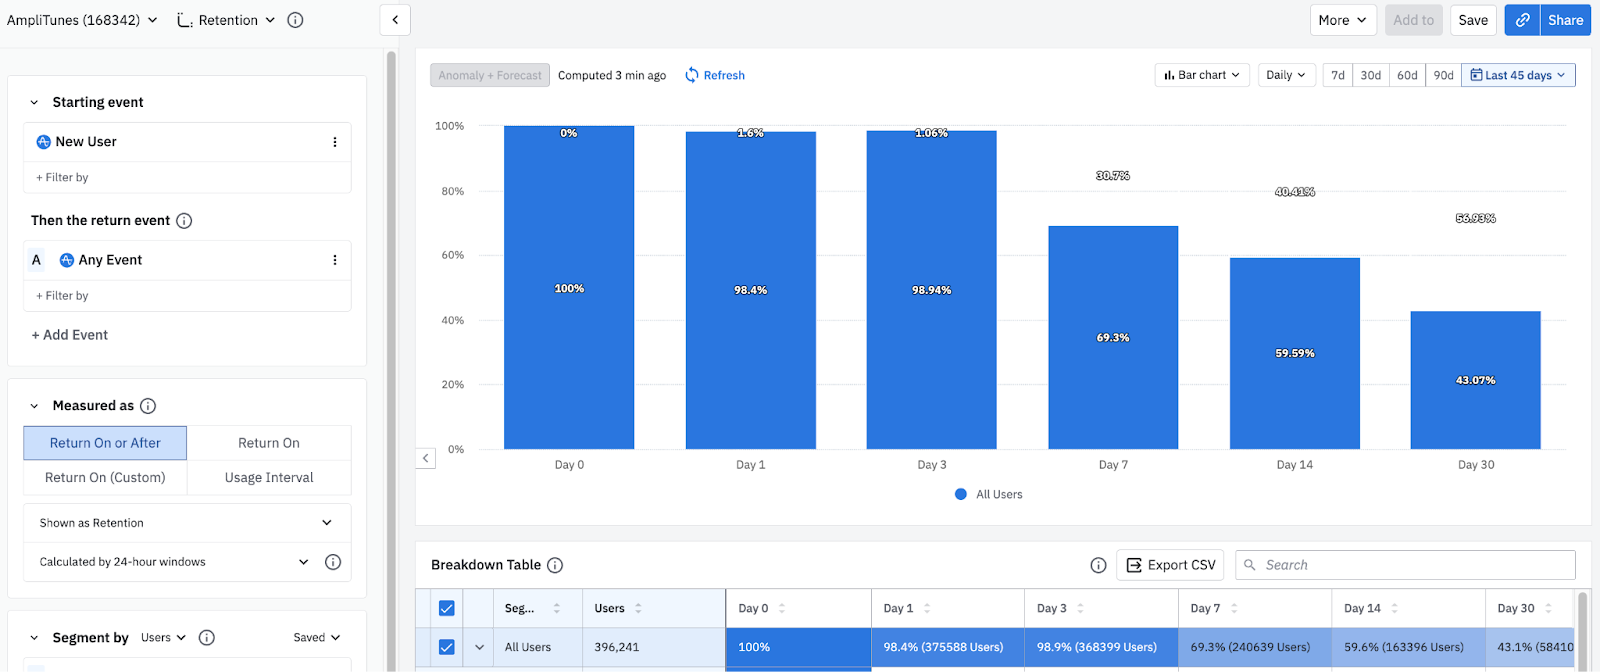{.expandable-image}
{% callout type="note" %}
In bar chart format, the X axis includes the most common units of time (days, weeks, months) by default.
{% /callout %}
Amplitude also displays a detailed table breaking down the data, broken out by each user cohort and into individual day buckets.
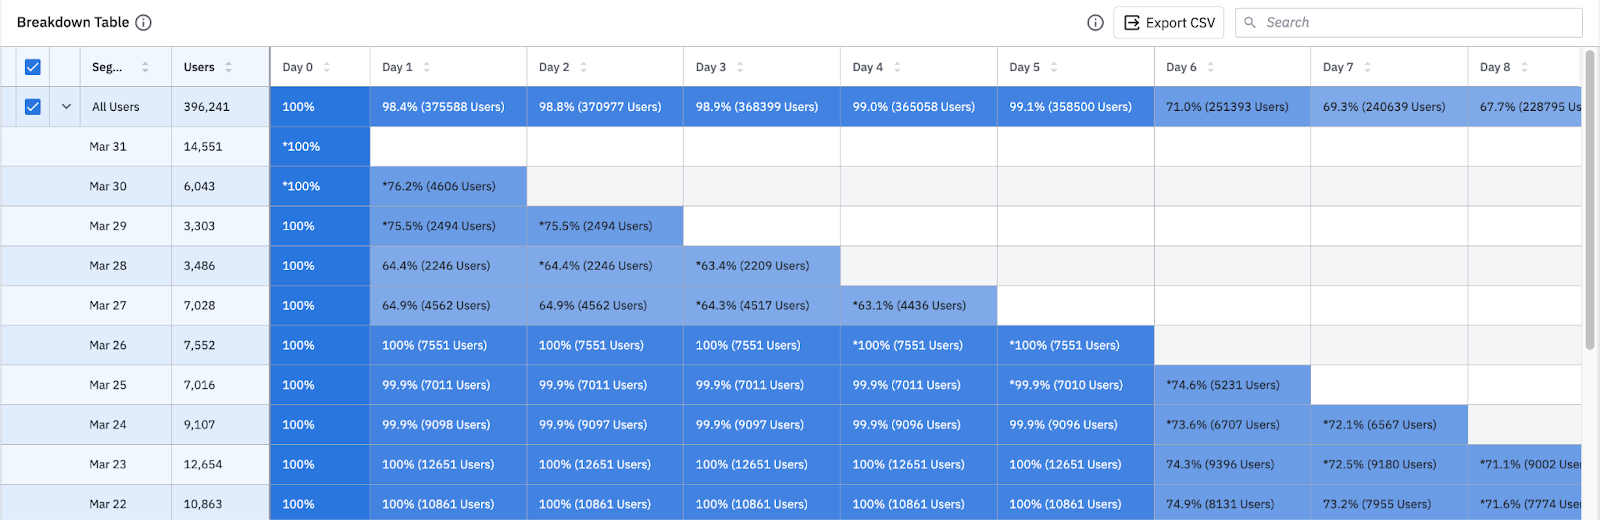{.expandable-image}
The method Amplitude uses to calculate Return On or After retention depends on whether you're looking at retention for all users or for a specific cohort entry date for your segment. Both the chart and the first row of the breakdown table below it show overall retention by default.
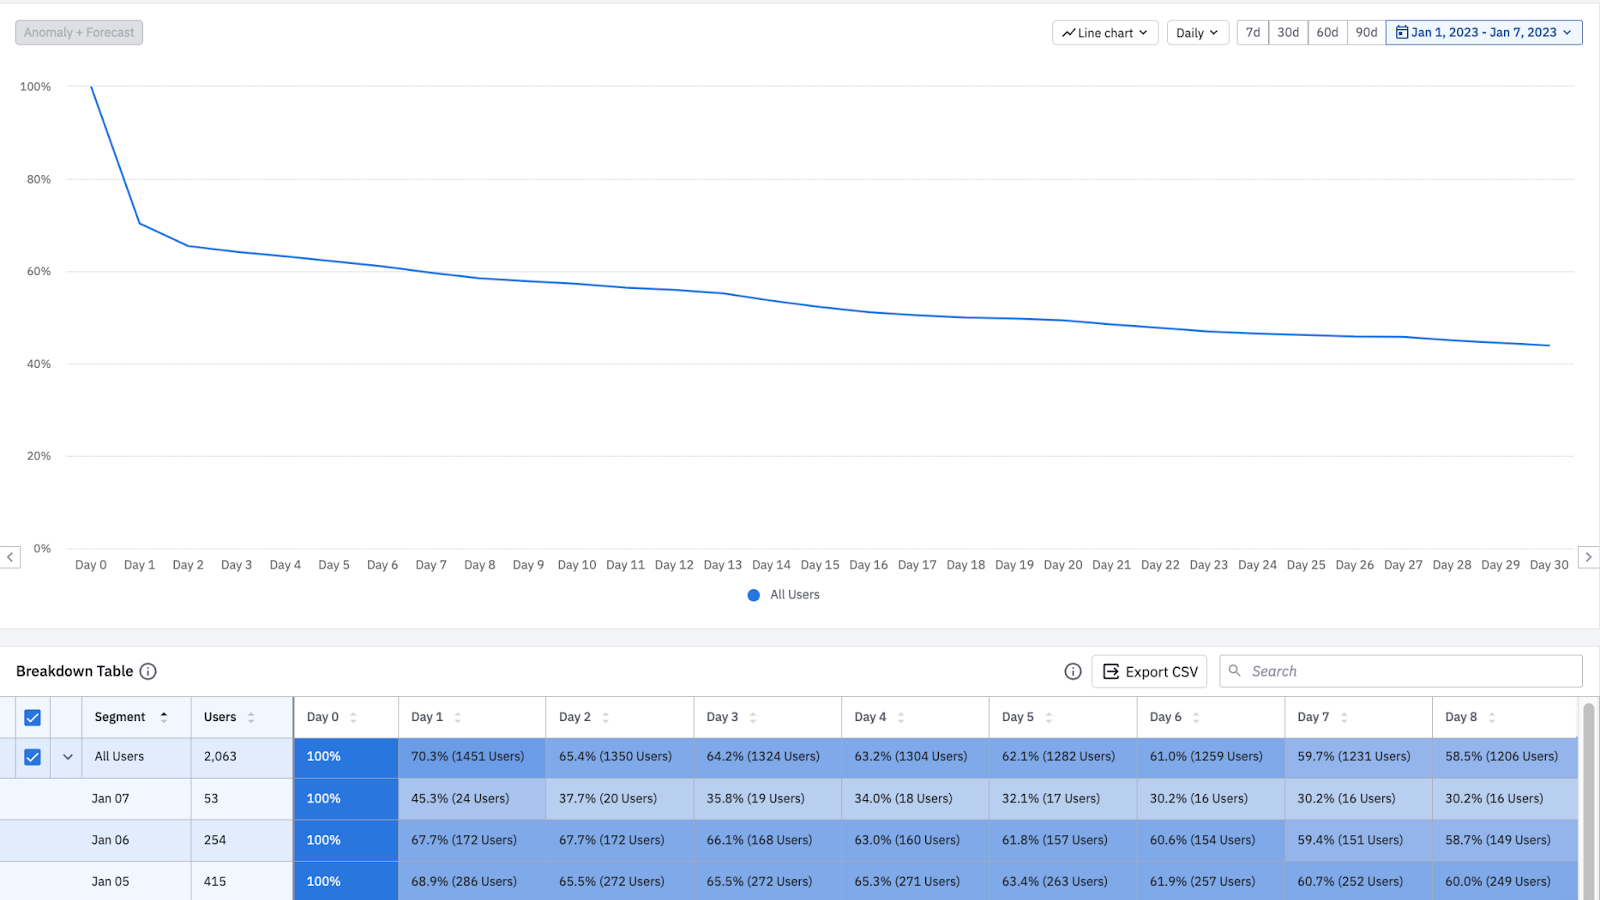{.expandable-image}
[Learn more about how the Retention Analysis chart calculates retention](https://amplitude.com/docs/analytics/charts/retention-analysis/retention-analysis-calculation).
### Return On (formerly known as N-Day)
Return On retention tells you the percentage of users that came back to trigger your return event **on a specific day** after triggering your starting event. The retention value for day 7, for example, tells you the percentage of users who returned on day 7 after their first use.
Regardless of whether you're looking at retention for all users or for specific cohort entry dates, Amplitude uses only one method to calculate Return On retention (unlike [Return On or After](#return-on-or-after-formerly-known-as-unbounded)). Both the chart and the first row of the breakdown table below it show overall retention by default.
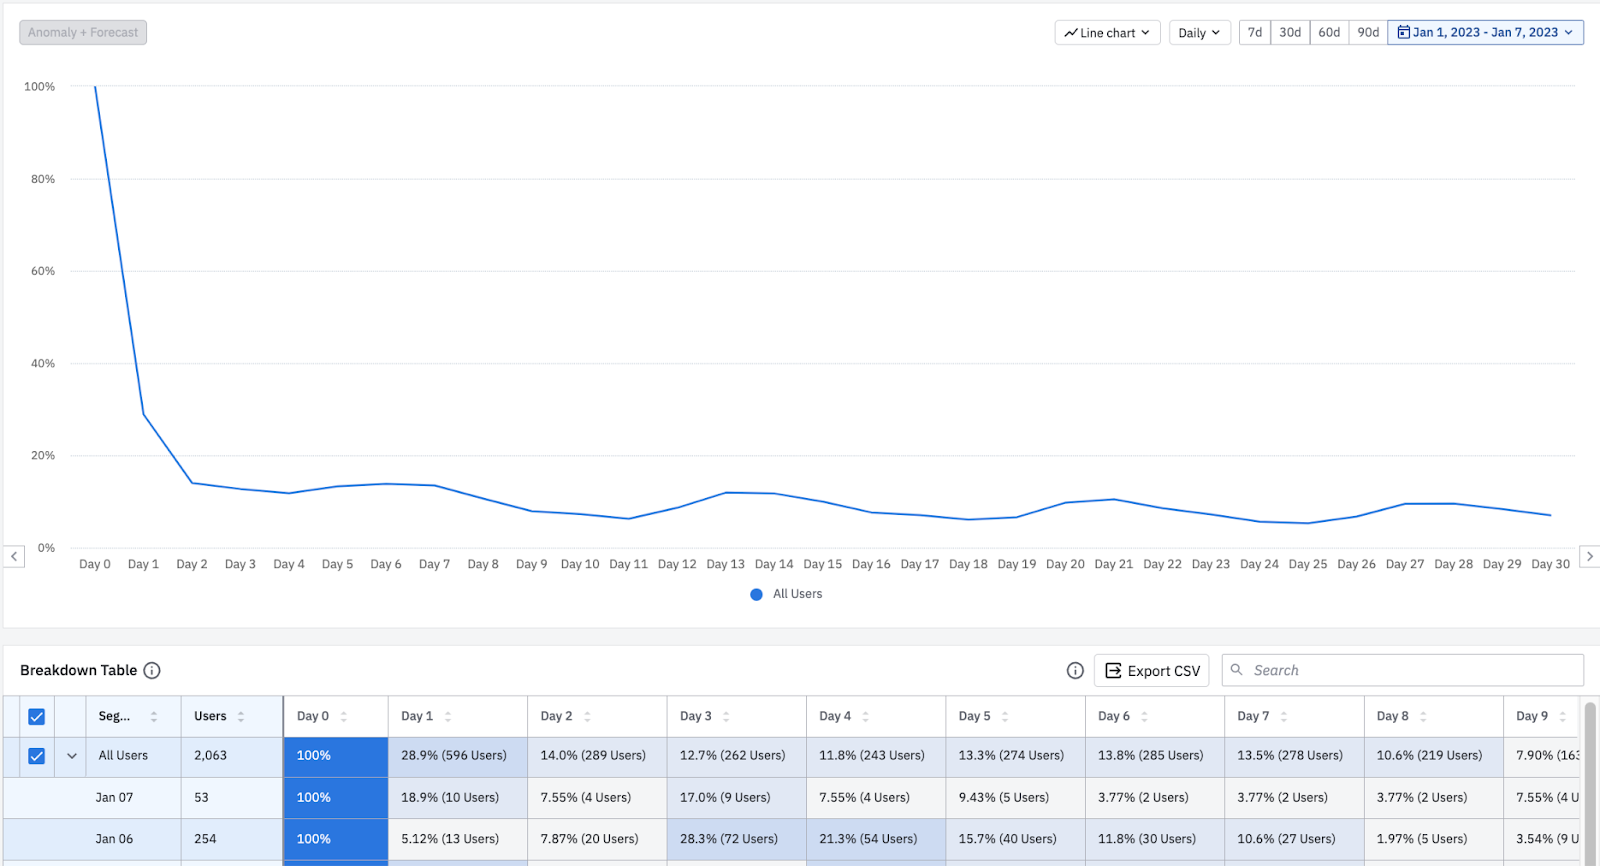{.expandable-image}
[Learn more about how the Retention Analysis chart calculates retention](https://amplitude.com/docs/analytics/charts/retention-analysis/retention-analysis-calculation).
### Return On (Custom) (formerly known as Custom)
By default, Amplitude assumes you want to use predefined units of time, such as days, weeks, or months, as retention brackets for your retention analyses. Change this by using Return On (Custom) and instead create custom brackets for your Return On retention.
Because the custom brackets feature uses the same logic as Return On retention, you can use it to generate the equivalent of a Return On retention chart while defining the relevant units of time yourself.
In the image above, there are four custom brackets defined:
- First bracket: one day (Day Zero).
- Second bracket: three days (Day 1-3).
- Third bracket: three days (Day 4-6).
- Fourth bracket: five days (Day 7-11).
The line graph shows the weighted averages of all the bracket retention numbers from the user cohorts within the selected timeframe.
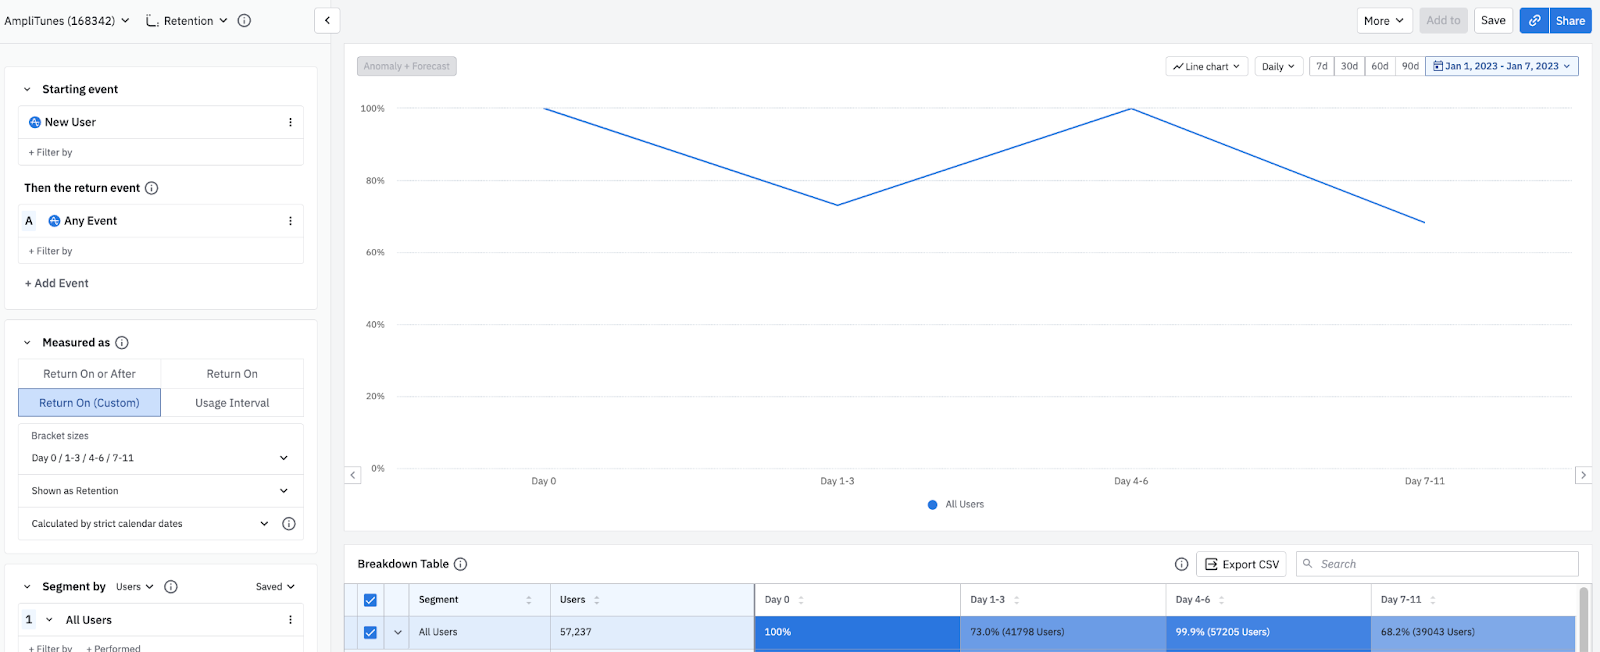{.expandable-image}
In the table below, on Jan 4th there were 3,172 new users.
The Day 1-3 retention is 75.1%, meaning that 2,382 of the 3,172 users triggered the return event anywhere between one and three days after their starting event.
The Day 4-6 retention is 99.7%, meaning that 3,164 of the 3,172 users triggered the return event four to six days after their starting event.
Each chart can have a maximum of 100 custom brackets. Results for days with incomplete data show an asterisk.
## Retention vs change over time
Sometimes you may need more than a straightforward view of your retention rates on specific days. You may want to know how a new release has affected your product's Day 1 retention rates, or if a new training program has had an impact on your Day 14 retention rates. In these cases, view your retention data over time by selecting _Change Over Time_ from the _Shown as_ dropdown.
In this chart, the data shows all users who were new on January 1st. 100% of them triggered the return event on Day 1, and 72.1% triggered it on Day 7.
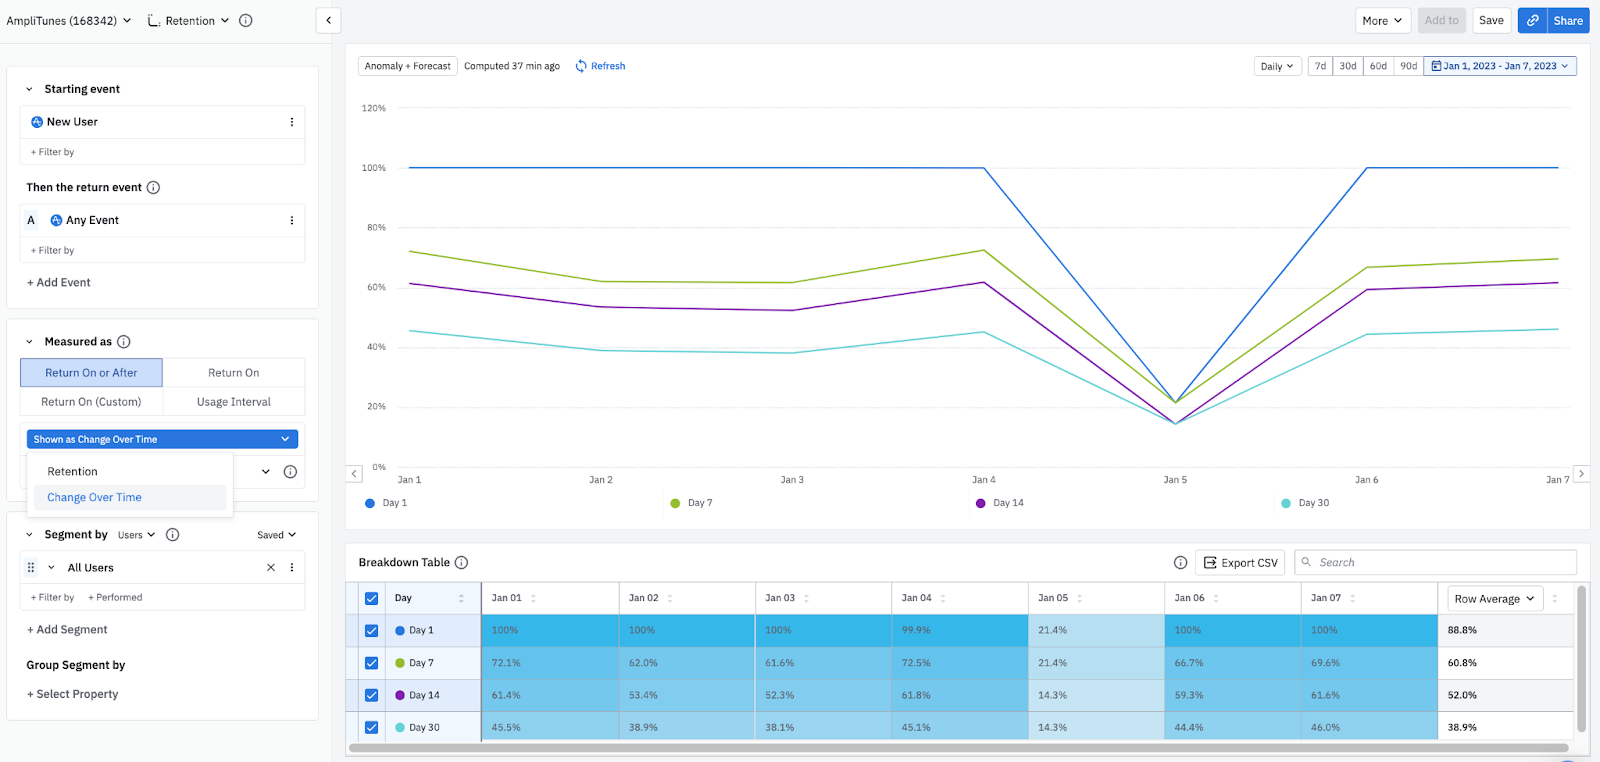{.expandable-image}
Amplitude calculates this percentage by dividing 1) the number of users from each new user cohort who triggered the return event on each retention day, by 2) the number of users who were new on the selected day.
{% callout type="note" %}
The Return On Change Over Time data table shows the same data as the Return On Retention data table, but with the X-axis and Y-axis switched.
{% /callout %}
## Further reading
The retention view is only one way of working with a Retention Analysis chart. You can also use the [usage interval](https://amplitude.com/docs/analytics/charts/retention-analysis/retention-analysis-interpret-usage) view to view the percentage of active users who triggered your selected events with a specified daily, weekly, or monthly median frequency.
Understanding [how time works in a retention analysis](https://amplitude.com/docs/analytics/charts/retention-analysis/retention-analysis-time) is crucial to correctly interpreting your results.
You may also need more details on [how the Retention Analysis chart calculates retention](https://amplitude.com/docs/analytics/charts/retention-analysis/retention-analysis-calculation).
================================================================================
# How the Retention Analysis chart calculates retention
URL: https://amplitude.com/docs/analytics/charts/retention-analysis/retention-analysis-calculation
================================================================================
# How the Retention Analysis chart calculates retention
Amplitude's methods for calculating retention are direct, but you should familiarize yourself with the differences between them. This helps you develop a nuanced understanding of the Retention Analysis chart.
## Return On or After
Amplitude calculates Return On or After retention a bit differently depending on whether you're looking at a specific cohort entry date for your segment or overall. Overall retention (for example, All Users) appears in the visualization and the first row of the breakdown table below it.
Because Return On or After retention measures users that returned on the Xth day **or later**, the numerator includes users in **all data points prior** to when they triggered an event. A user who triggers the event on day two, for example, also appears in the data point for days one and zero.
### Specific cohort entry date
The calculation for a **specific cohort entry date** is:
```
{ # of users who triggered return event on X day after cohort entry date,
or any day after X day }
divided by
{# of users who triggered start event on specific cohort entry date
[constant across X days] }
```
In the table below, Day 3 retention for April 1 shows that 6,633 users triggered the return event on April 4 or later. 9,644 users triggered the start event on April 1. Dividing 6,633 by 9,644 gives an April 1 Day 3 retention of 68.8%.
The retention percentage for a specific cohort entry date always **decreases over time**. While the denominator remains constant, the numerator gradually goes down: the number of people who are 7 day+ retained is less than the number of people who are 3 day+ retained.
### Overall retention
The calculation for **overall retention** (also known as **all users**) is:
```
{ # of users who triggered return event on X day or later after cohort entry date }
divided by
{ # of users who triggered start event on cohort entry dates
that reached the retention interval }
```
In the table below, the All Users Day 3 retention shows that 55,752 users triggered the return event on Day 3 or later, while 137,586 users triggered the start event between March 30 and April 6. Dividing 55,752 by 137,586 gives a Day 3 retention of 40%.
In the table, the All Users row contains the daily sums of the date rows below it. Amplitude excludes incomplete data from the All Users totals (incomplete cells have an asterisk).
When the analysis time frame is complete, the graph curves down as retention decreases over time. This happens because fewer people can be retained for longer periods of time as shown in the numerator (it's harder to retain people for seven days than for three days).
However, when the analysis is still in progress, the graph can **curve up** and appear to **increase** over time. This happens because Amplitude **excludes** users who haven't yet reached later retention intervals from the denominator. This means Amplitude hasn't collected enough data, and you should give your users more time to trigger your return event. Wait until your analysis time frame is fully complete to get an accurate understanding of your retention trend.
Accordingly, the denominator value in the Microscope for a single day is the sum of the users who completed that day's retention interval. The breakdown table doesn't show this value.

## Return On
The calculation for **Return On retention** is:
```
{ # of users who triggered return event on exactly X days after cohort entry date }
divided by
{ # of users who triggered start event on specific cohort entry date
[constant across X days] }
```
In the table below, Day 3 retention for April 1 shows that 6,594 users triggered the return event on April 4, while 9,644 users triggered the start event on April 1. Dividing 6,594 by 9,644 gives an April 1 Day 3 retention of 68.4%.
All users' Day 3 retention shows 48,219 users triggered the return event on Day 3, while 125,665 users triggered the start event between March 30 and April 6, giving a Day 3 retention of 72%.
A user can trigger the return event on multiple days and Amplitude counts them on each day. This can drive retention percentage up over time, for a specific cohort entry date row or overall row. While the denominator is constant, the number of users that trigger a return event each X days is independent. More users can trigger an event on any day than the prior.
As with Return On or After retention, when the analysis time frame is complete, the denominator value in the Microscope for any day is consistent with the total number of users for overall retention. When the analysis is still in progress, the denominator value in the Microscope for a single day is the sum of the users who completed that day's retention interval. The breakdown table doesn't show this value.
{% callout type="note" %}
In bar chart format, the X axis includes the most common units of time, [days, weeks, months](https://amplitude.com/docs/analytics/charts/retention-analysis/retention-analysis-time), by default. You can customize this using [Return On (Custom)](https://amplitude.com/docs/analytics/charts/retention-analysis/retention-analysis-interpret#return-on-custom-formerly-known-as-custom).
{% /callout %}
The overall row represents the sum of the cohort entry date rows below it. Similar to Return On or After retention, if data is incomplete (cells noted with an \*), Amplitude excludes them from the overall row's total (for example, the sum of each row for Day 3 doesn't add to the overall Day 3 value).
================================================================================
# Interpret your Retention Analysis chart: Usage interval
URL: https://amplitude.com/docs/analytics/charts/retention-analysis/retention-analysis-interpret-usage
================================================================================
# Interpret your Retention Analysis chart: Usage interval
In a retention analysis, the **usage interval** shows the percentage of active users who triggered the selected events with a specified daily, weekly, or monthly median frequency. Amplitude includes users only if they triggered these events on **at least two different days**.
Your usage interval is important for drawing accurate conclusions about your retention numbers. Some products are built for daily use, while others might serve much less frequent use. Knowing how often users actually use your product helps you gauge the health of your product when looking at Retention Analysis and [Lifecycle](https://amplitude.com/docs/analytics/charts/lifecycle/lifecycle-track-growth) charts.
To view the usage interval, click _Usage Interval_ in the Measured As module.
Suppose your product's critical event is `Purchase Song or Video`. Select this event and use the usage interval view to find the usage interval for that event. To calculate this, Amplitude plots the distribution of each user's median return period: for each user, Amplitude looks at all `Purchase Song or Video` events they triggered in the last 15 days, and then determines the median length of time between each of these events.
For example, the highlighted data point shows that 65.4% of your users have a median interval of four days or fewer between each `Purchase Song or Video` event. Interpret this inflection point as your usage interval. Use this usage interval to create a [Return On (Custom)](https://amplitude.com/docs/analytics/charts/retention-analysis/retention-analysis-interpret) chart or a [Lifecycle](https://amplitude.com/docs/analytics/charts/lifecycle/lifecycle-track-growth) chart. In this case, four days is the expected usage interval for active users with the critical event of `Purchase Song or Video`.
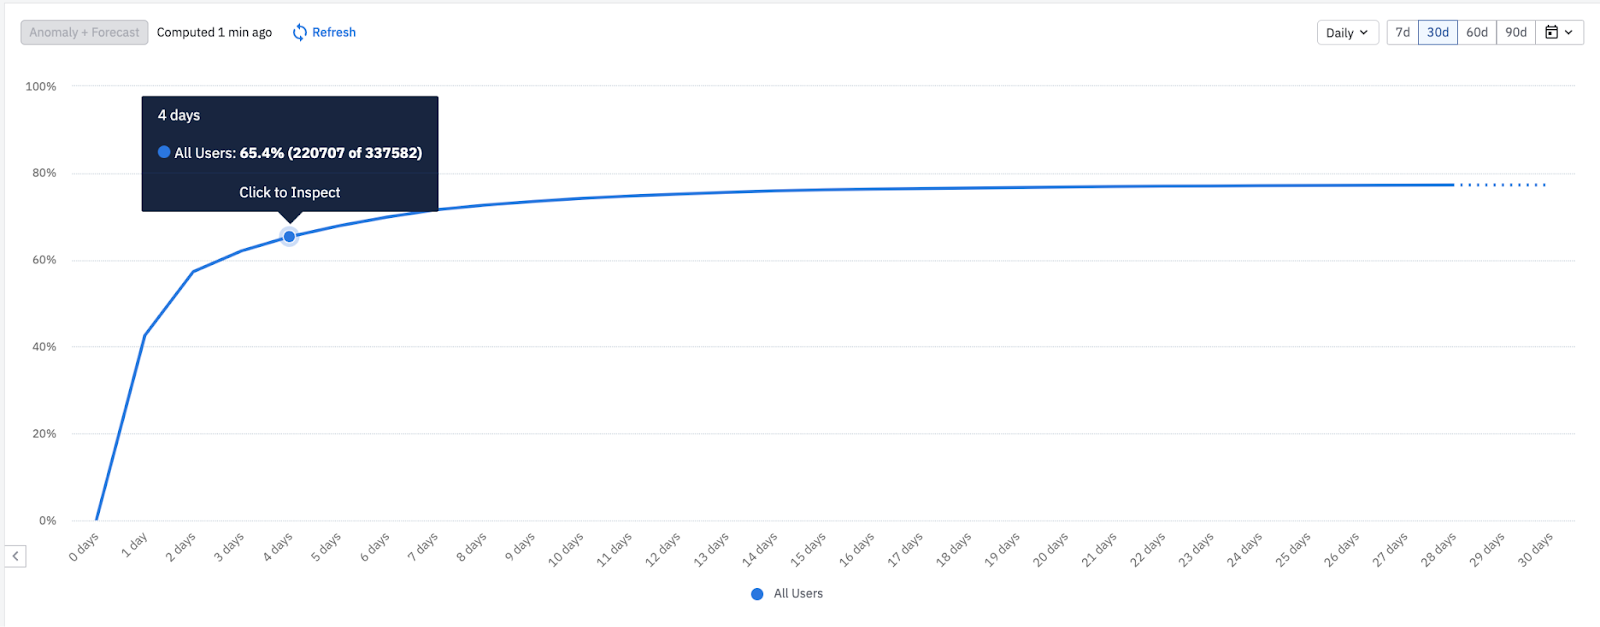
{% callout type="note" %}
To learn more about how to find your critical event, refer to this [blog post](https://blog.amplitude.com/user-retention-app-critical-event).
{% /callout %}
You can see how the median frequency between events changes over time by selecting the _Usage Interval Over Time_ view. Amplitude doesn't plot averages in this view; instead, it shows the actual percentages.
For example, the following data point shows that of the users who triggered `Purchase Song or Video` on March 10th, 89.1% of them fired it again within seven days.
================================================================================
# How time works in a retention analysis
URL: https://amplitude.com/docs/analytics/charts/retention-analysis/retention-analysis-time
================================================================================
# How time works in a retention analysis
In a Retention Analysis chart, you can define a day in two ways: a rolling **24-hour window** or a **strict calendar date**. The method you choose can affect your results.
Amplitude treats a day as a **rolling 24-hour window** by default, which is different for each user. Each day is **exactly the same length**, no matter when the user triggered the starting event. For example:
- The beginning of the 24-hour window starts when a user triggers the starting event (Day Zero).
- Day 1 runs from hour 24 to hour 48.
- Day 2 from hour 48 to hour 72, and so on.
When using **strict calendar dates**, a day starts when the calendar day starts, and ends when the calendar day ends. Amplitude then determines daily retention by:
- The timezone specified in your project settings.
- The **specific calendar day** instead of on an hourly basis.
## Retention using 24-hour windows
The way Amplitude calculates retention depends on whether you're looking for daily, weekly, or monthly retention rates. When using a 24-hour window to measure a day, Amplitude calculates the retention rates as the following:
- **Daily**: Amplitude computes daily retention on an **hourly basis**. Amplitude **rounds down** event timestamps to the most recent hour. An event triggered at 4:59 pm has a timestamp of 4:00 pm. Amplitude counts the user as **next-day retained** if they trigger any event during or after the 24th-incremented hour, but before the 48th-incremented hour.
When a user triggers the initial event multiple times, Amplitude starts multiple 24-hour buckets for them. One return event can define a user as both Day 1 and Day 2 retained.
- **Weekly**: Amplitude computes weekly retention on a **daily basis**. A week is **seven days**.
- **Monthly**: Amplitude computes monthly retention on a **daily basis**. A month is **30 days**.
For instance, suppose three users triggered the following events. **User 1** is measured for daily retention, **User 2** for weekly retention, and **User 3** for monthly retention.
- **Wednesday, December 1st**
- User 1 triggered their first event at 5:59 PM.
- User 2 triggered their first event.
- **Thursday, December 2nd**
- User 1 triggered their second event at 5:00 PM.
- **Monday, December 6th**
- User 2 triggered their second event.
- User 3 triggered their first event.
- **Sunday, December 12th**
- User 3 triggered their second event.
Amplitude counts **User 1** as **Day 1 retained** (next-day retained), because their second event's timestamp (5:00 PM) was during the 24th-incremented hour **after** the timestamp on the original event (5:59 PM).
**User 2** is **Week Zero retained** because they triggered their second event (December 1st) within seven days from the first event (December 6th). They would be Week 1 retained if they triggered an event on any day between December 8th and December 14th (days 8-14).
When considering **User 3** for monthly retention, Amplitude counts them as **Month Zero retained** because they triggered the return event within 30 days from the original event (event one on December 6th and event two on December 12th).
{% callout type="note" %}
Any retention computations that include dates of August 17, 2015 or earlier use calendar time instead.
{% /callout %}
## Retention using strict calendar dates
Amplitude can also measure retention by strict calendar dates, where day X is measured from the calendar date the event was triggered. The way Amplitude calculates retention depends on whether you're looking at retention on a daily, weekly, or monthly basis.
When measuring a day by strict calendar dates, Amplitude measures retention by the following:
- **Daily**: Daily calendar dates start when the calendar day starts and end when the calendar day ends. The timezone specified in your project settings determines the calendar view. Under the strict calendar view, daily retention is based on the calendar day instead of on an hourly basis.
- **Weekly**: Weekly calendar dates determine the beginning and end of each week. The timezone specified in your project settings defines a week. There you can also specify the first day of your week.
- **Monthly**: Monthly calendar dates determine the beginning and end of each month. The timezone specified in your project settings defines a month.
Using the user activity example above, the retention rates are:
- **Daily retention for User 1**: Amplitude counts this user as **next-day retained** because they fired their second event during the next calendar day (December 2nd). Had they fired their return event on December 1st before 11:59 PM, Amplitude would consider them Day Zero retained.
- **Weekly retention for User 2**: If a week starts on Monday, User 2 is **Week 1 retained** because they triggered their return event on December 6th, **after** the end of the week of their original event (Monday, December 1st to Sunday, December 5th).
- **Monthly retention for User 3**: Amplitude counts User 3 as **Month Zero retained** because they triggered both their original and return events within the same month (December).
Users who trigger the starting event multiple times are still restricted to the calendar day they first triggered the starting event. The exception is when a user triggers the starting events on multiple calendar days; in this case, Amplitude includes that user in multiple interval cohorts.
## Retention types
For **new user** retention, filter conditions applied in the _Segmentation_ module are only satisfied if they're true during the same time frame the `new user` event was triggered. For charts using strict calendar dates, this is the same as the chart interval. For charts using unaligned ranges, the time frame is more granular: for example, the first day for seven-day windows and the first hour for 24-hour windows.
This table further delineates the differences between 24-hour windows and strict calendar dates by retention types [Return on or After and Return On](https://amplitude.com/docs/analytics/charts/retention-analysis/retention-analysis-calculation).
| Retention type | A single cohort entry date retention | Explanation (strict calendar days) | Explanation(by 24-hour windows) |
| ------------------ | ------------------------------------ | ------------------------------------------------------------------------------------------------------------ | ---------------------------------------------------------------------------------------------------------- |
| Return On or After | 168 / 254 = 66.1% | 168 users triggered the return event on June 10 or after /254 users who triggered the start event on June 7. | 168 users triggered the return event 72 hours or after /254 users who triggered the start event on June 7. |
| Return On | 72 / 254 = 28.3% | 72 users triggered the return event on June 10 /254 users who triggered the start event on June 7. | 72 users triggered the return event 72-96 hours later /254 users who triggered the start event on June 7. |
================================================================================
# Build a usage interval analysis
URL: https://amplitude.com/docs/analytics/charts/retention-analysis/retention-analysis-usage-interval
================================================================================
# Build a usage interval analysis
A usage interval analysis is related to a [retention analysis](https://amplitude.com/docs/analytics/charts/retention-analysis/retention-analysis-build), but works a little differently. While a simple retention analysis measures the amount of time between a starting event and a return event, a usage interval analysis considers return events only. It shows how long users go between triggering your product's most important event, its **critical event**.
For more details on usage interval analyses and what they mean, refer to the Help Center article on [interpreting your retention analysis](https://amplitude.com/docs/analytics/charts/retention-analysis/retention-analysis-interpret-usage).
To build a usage interval analysis, follow these steps:
1. In the Measured As module, click _Usage Interval_.
2. In the Events Module, select the return event. This should be your product's critical event.
3. To add properties to your return event, click _+ Filter by_, select the property name, and specify the property value you're interested in.
{% callout type="note" %}
You can add up to two return events for your usage interval analysis.
{% /callout %}
4. In the Segmentation Module, identify the user segment you want to include in this analysis. You can import a previously saved segment by clicking the _Saved_ dropdown and selecting the one you want from the list. Otherwise, Amplitude assumes your analysis targets all users.
5. If you don't want to import a previously saved user segment, build your own by adding properties. To do so, click _+ Filter by_, choose the property you want to include, and specify the property value you're interested in.
6. To narrow your focus further, tell Amplitude to include only users who already performed certain actions. To do so, click _+ Performed_ and choose the event you're interested in.
7. To add another user segment, click _+ Add Segment_ and repeat steps 5 and 6.
Your usage interval analysis appears, along with a tabular view of your results.
But what does it mean? For the answer, refer to the Help Center article on [interpreting your usage interval analysis](https://amplitude.com/docs/analytics/charts/retention-analysis/retention-analysis-interpret-usage).
================================================================================
# N-Day LTV in retention analysis
URL: https://amplitude.com/docs/analytics/charts/retention-analysis/retention-analysis-n-day-ltv
================================================================================
# N-Day LTV in retention analysis
N-Day LTV (Lifetime Value) helps you understand how much revenue a cohort of users generates within a fixed time window after their first activity. By combining retention cohorts with revenue, you can measure not just whether users return, but how valuable they are over time.
## Before you begin
If you haven't already read the overview of [Amplitude's Retention Analysis chart](https://amplitude.com/docs/analytics/charts/retention-analysis/retention-analysis-build), start there before continuing.
N-Day LTV requires a purchase event (or equivalent revenue-generating event) with a numeric revenue property such as `amount`, `revenue`, or `price`. Amplitude uses this value to compute cumulative revenue over time.
## What is N-Day LTV
N-Day LTV measures the cumulative revenue a cohort of users generates within the first N time units after their start event. Amplitude calculates it as:
```
Cumulative revenue during the window ÷ Number of users in the cohort
```
This gives you an average revenue per user over time.
## When to use N-Day LTV
N-Day LTV is useful when you want to:
- Measure how quickly new users generate revenue.
- Understand revenue impact beyond retention rates.
- Track changes in user value after product or pricing updates.
## How N-Day LTV works
N-Day LTV is built directly into Retention Analysis charts and uses the same cohort structure:
- Users enter a cohort when they perform a **Start Event**.
- Amplitude tracks revenue based on a **Return Event** (a purchase event or equivalent).
- Revenue accumulates over the selected N-day window.
When you enable N-Day LTV mode, the Return Event logic changes to **Return On or Before**. Amplitude counts users as returning if they perform the return event at any point up to that interval. This creates a cumulative view that aligns with how revenue accrues over time.
## Enable N-Day LTV
To enable N-Day LTV in a Retention Analysis chart:
1. Open a Retention Analysis chart.
2. Select your **Start Event** (for example, _Sign Up_).
3. Select your **Return Event** (for example, _Purchase_).
4. Select the **N-Day LTV** button under the Return Event controls.
The chart switches into revenue-based LTV mode.
## Choose your N-day window
N-Day LTV supports flexible time windows. You can measure LTV in hours, days, weeks, months, or quarters.
This helps answer questions like:
- "How much revenue do users generate in their first three days?"
- "What is 30-day LTV for users acquired from paid search?"
- "How does value grow over the first quarter?"
## All users compared to paying users only
When you enable N-Day LTV, you can calculate LTV for two groups:
### All users
This option includes every user in the cohort, even those who generate $0 in revenue. This gives you a complete picture of average revenue across the full cohort.
### Paying users only
This option restricts the cohort to users who generate revenue at any point during the selected window. This is useful for analyzing value among monetizing users without dilution from non-paying users.
## How Day 0 is defined
Day 0 is based on the first time a user performs the Start Event, in accordance with the limitations for [Historical Count](https://amplitude.com/docs/analytics/historical-count-1#how-amplitude-defines-historical-count). A user enters the cohort the first day they trigger the starting event, and Amplitude tracks revenue forward from that point.
## Example: 3-Day LTV across multiple cohorts
Amplitude calculates N-Day LTV separately for each cohort.
For each cohort:
```
3-Day LTV = Cumulative revenue in the first 3 days ÷ Number of users in the cohort
```
Amplitude also shows an overall 3-Day LTV value, calculated only from cohorts that fully matured through Day 3.
### Example 1: Three mature cohorts
In this example, all cohorts completed the full 3-day window.
| Cohort | Users in cohort | Revenue in first 3 days | 3-Day LTV |
| -------- | --------------- | ----------------------- | --------- |
| Cohort 1 | 100 | $500 | $5.00 |
| Cohort 2 | 120 | $720 | $6.00 |
| Cohort 3 | 80 | $320 | $4.00 |
Amplitude combines revenue and users across all mature cohorts to calculate the overall value:
- **Total revenue:** $500 + $720 + $320 = $1,540
- **Total users:** 100 + 120 + 80 = 300
- **Overall 3-Day LTV:** $1,540 ÷ 300 = **$5.13**
Because all cohorts are mature, the overall value represents the true average revenue per user within the first three days.
{% callout type="note" heading="Immature cohorts" %}
An immature cohort for a specific N-day period consists of users who began but haven't yet finished the full N-day window. For instance, a cohort starting today isn't mature until the N-day period is complete, typically by the next day and beyond.
{% /callout %}
### Example 2: One cohort isn't yet mature
Recent cohorts may not have completed the full N-day window. Amplitude excludes immature cohorts from the overall calculation until they mature.
| Cohort | Users in cohort | Revenue collected so far | Days observed | (current) 3-Day LTV |
| -------- | --------------- | ------------------------ | ------------- | ------------------- |
| Cohort 1 | 100 | $500 | 3/3 | $5.00 |
| Cohort 2 | 120 | $720 | 2/3 | $6.00 |
| Cohort 3 | 80 | $200 | 1/3 | $2.50 |
Because Cohort 2 has only reached Day 2 and Cohort 3 has only reached Day 1, Amplitude excludes both from the overall Day 3 calculation.
**Overall 3-Day LTV (mature cohorts only):** $500 ÷ 100 = **$5.00**
================================================================================
# Retention Analysis FAQ
URL: https://amplitude.com/docs/analytics/charts/retention-analysis/faq
================================================================================
# Retention Analysis FAQ
## Common questions
This page answers common questions about the Retention Analysis chart.
### How are the data points calculated?
Amplitude uses a "[weighted average](https://en.wikipedia.org/wiki/Weighted_arithmetic_mean)" to calculate each data point percentage in the Retention Analysis chart. The data point is the number of unique users who triggered the return event during a specified timeframe (day, week, or month) divided by the total number of unique users who reached that point in time. In other words, Amplitude calculates a weighted average of the below-row values.
The calculation uses **unique** users, so Amplitude counts the user in each numerator only one time. If a user triggers the first event and the return event multiple times, Amplitude only counts them once in the denominator.
**Return On**
For **Return On** retention specifically, the numerator is the unique count of users who trigger the return event on the day, week, or month indicated. The denominator is the total number of unique users who triggered the starting event on the first day, week, or month of the specified time frame. Amplitude counts a user who triggers the start and return events multiple times in a time frame only once in the denominator. However, Amplitude can include them in the numerator once per day, week, or month of each data point interval. [Get more details in this Community article](https://community.amplitude.com/building-and-sharing-your-analysis-58/retention-how-is-retention-calculated-n-day-retention-82).
**Return On or After**
For **Return On or After** retention, the denominator for a specific day, week, or month (call this number X) is users who completed that day, week, or month. Amplitude counts these users towards the overall Return On or After retention as long as X days, weeks, or months passed since that user's starting event. The numerator is the unique count of users who triggered the return event on the Xth day, week, or month, or later.
Because Return On or After retention measures users who returned on that Xth day or later, Amplitude includes a user in all data points prior to when they triggered an event. A user who triggers the event on day two, for example, also appears in the data point for days one and zero.
### Why are the recent periods asterisked?
Results for days with incomplete data have an asterisk. For example, suppose some users trigger the starting event on July 15th (Day 0). You're looking at Day 6 data on July 21st and see an asterisk next to the computed results. Because July 21st is Day 6 and the day isn't yet over in this example, the data point is incomplete until the day ends. This gives users from Day 0 a chance to become Day 6 retained.
### In the breakdown table, why doesn't the user count for the interval equal the number shown in the total users row?
The total user count of the retention analysis breakdown table sums **unique** users who triggered the start event within the entire time period. Suppose a user triggered the start action on July 17th and the 18th. The user is unique to July 17th and 18th, so Amplitude counts them in the user totals for both days. However, Amplitude counts this user only **once** for the overall user total. This is one reason why the sum of each day's user totals doesn't always equal the total user count.
Another reason is that Amplitude excludes the current day from this sum because it isn't over yet. Amplitude is still collecting the day's events and performing calculations with them.
On the breakdown table, any value with an asterisk indicates a data point that is still calculating because the time frame isn't yet over. Amplitude doesn't include these users in the overall retention calculation until the time frame is complete.
### Why is my overall retention higher or lower than expected?
There are two potential explanations for this:
1. Amplitude doesn't include incomplete data points in the retention calculation. If all the data points are higher or lower than the values in the breakdown table, many of these users may not have completed the full time frame yet. Incomplete values that Amplitude hasn't included in the data points have an asterisk beside them.
2. The data points are a deduplicated calculation of all users in the time frame. In that case, the overall retention calculation counts that user only once. The breakdown table can show the user more than once, making your retention appear higher than expected.
### I can only see 12 months or 365 days of data in this retention chart. How can I see more?
Use Amplitude's [custom bracket](https://amplitude.com/docs/analytics/charts/retention-analysis/retention-analysis-interpret) feature, available through the Return On (custom) measure, to add more time frames beyond the default limits.
### Why does the retention curve go up?
If you're looking at data that is ongoing, you can see your retention curve trend upwards. This happens because Amplitude only includes users in the weighted average calculation after they've had enough time to convert.
For example, if you're looking at the last 30 days, a user can only appear in the Day 4 data point after four days elapsed since they triggered the starting event. Because Amplitude only includes users after they pass that milestone, the later data points can seem higher. This happens because the users who didn't retain never passed that milestone. This usually occurs when only a small percentage of users finished the chart's entire time frame. After more users do so, your chart starts to even out and more accurately reflects retention.
[Get more details in this Community article](https://community.amplitude.com/building-and-sharing-your-analysis-58/retention-why-does-the-retention-curve-go-up-73).
### How far out does Return On or After retention go?
Return On or After retention extends to the current day. The last point in a Return On or After retention chart shows users who triggered the return event on or after a specific day, week, or month, and checks if they triggered that event as recently as yesterday.
### Why does the denominator in the data points change over time?
The denominator changes on a daily basis because it's based on a cumulative count of unique users who reached a **specific day** (Day 5, Day 10, and so on).
For example, suppose user A and user B perform events on the following days within a specified timeframe of March 20th to March 22nd:
- March 20th: user A performs starting event.
- March 21st: user A performs return event.
- March 21st: user B performs starting event.
- March 22nd: user A performs return event.
For user A, March 20th is Day 0, March 21st is Day 1, and March 22nd is Day 2. Amplitude includes user A in each day's denominator (Day 0 to Day 2). User B, however, triggered the starting event on March 21st (Day 0) and didn't trigger any other events. Amplitude counts user B only in the Day 0 denominator for the specified timeframe.
================================================================================
# Attribute credit to multiple acquisition touch points
URL: https://amplitude.com/docs/analytics/charts/data-tables/data-tables-attribute-credit
================================================================================
# Attribute credit to multiple acquisition touch points
Attributing the success of marketing activities is difficult when you can't pinpoint which activities led users to a desired outcome. For example, a user might visit your website after seeing a Google ad, interacting with a Facebook post, and watching a TikTok video. You can attribute credit to one or more of these activities in several ways. Attributing success to property values, known as [**multi-touch attribution**](https://amplitude.com/blog/amplitude-attribution), provides context that informs future marketing plans.
### Restrictions
- Users on the Free and Plus plans can create a single channel view.
## Pre-built attribution models
Amplitude includes common, pre-built attribution models that you can configure on your metric.
{% callout type="note" %}
First Touch, Last Touch, and Last Non-Direct Touch are the only pre-built attribution models for which the event totals for all attribution groups add up to match the total event count (shown in the `Overall` row).
For example, the Last Touch model attributes 100% of the credit to a single property value—the last one. As a result, the attribution group totals sum to 100%. The Participation model attributes 100% credit to multiple property values, so the attribution group totals sum to more than 100%.
{% /callout %}
When measuring unique users, none of these models generate attribution group totals that sum to the count in the `Overall` row. Each unique user can appear in multiple attribution groups because attribution applies to events, not unique users. A unique user can perform events attributed to both channel X and channel Y. In this case, the user appears in rows for both X and Y, which can double-count the user when summing the rows.
- **First Touch**: Gives all credit for the selected metric to the first property value within the selected lookback window relative to the date the metric occurred. With the event totals attribute, this sums to 100%.
- **Last Touch**: Gives all credit for the selected metric to the last property value within the selected lookback window relative to the date the metric occurred. With the event totals attribute, this sums to 100%.
- **Last Non-Direct Touch**: Gives all credit for the selected metric to the last property value within the selected lookback window relative to the date the metric occurred, excluding direct touch points. If every touch point in the window is direct, all credit goes to the last touch instead, so no credit goes unassigned. With the event totals attribute, this sums to 100%.
- **Linear**: Distributes credit for the selected metric equally across all property values within the selected lookback window relative to the date the metric occurred. For example, with two properties each receives 50% credit, and with three properties each receives 33.3%.
- **Participation**: Allocates credit for the selected metric fully to all property values within the selected lookback window relative to the date the metric occurred. For example, with two properties each receives 100% credit, and with three properties each receives 100%. The total rows can exceed the overall total because multiple properties from the same event can receive credit.
- **U-Shaped**: Biases credit to the first and last values for the selected property. With two touch points, the middle 20% is added equally to the first and middle touch points (50%, 50%). With four touch points, the middle two touch points share the 20% (40%, 10%, 10%, 40%).
- **J-Shaped**: Distributes credit for the selected metrics in a way that biases credit to the more recent values for the selected property. With two touch points, the first 20% is added equally to the last and middle touch points (30%, 70%). With four touch points, the final two touch points share the 20% (10%, 10%, 20%, 60%).
- **Inverse J-Shaped**: Distributes credit for the selected metrics in a way that biases credit to the first values for the selected property. With two touch points, the last 20% is added equally to the first and middle touch points (70%, 30%). With four touch points, the last two touch points share the 20% (60%, 20%, 10%, 10%).
- **Data Driven:** With this model, Amplitude Analytics relies on a probabilistic algorithm based on [first-order Markov chains](https://rpubs.com/EelesCB/469421). Every customer journey—a sequence of channels or touch points—is represented as a chain in a directed Markov graph. Each node is a possible state (a channel or a touch point), and the edges represent the probability of transition between states. Amplitude Analytics removes the nodes one by one and estimates the impact of removing each node on the conversion rate. Each channel receives credit in proportion to its removal effect. Use this model with properties that don't have a large number of unique values (50 or fewer work best). Learn more about the algorithm at [analyzecore.com](https://www.analyzecore.com/2016/08/03/attribution-model-r-part-1/).
**Weighting by touch-point count**
| Model | 2 touch points | 4 touch points |
| ---------------- | -------------- | --------------------- |
| Linear | 50% / 50% | |
| U-shaped | 50% / 50% | 40% / 10% / 10% / 40% |
| J-shaped | 30% / 70% | 10% / 10% / 20% / 60% |
| Inverse J-shaped | 70% / 30% | 60% / 20% / 10% / 10% |
{% callout type="note" heading="About the Data Driven model" %}
- The data driven attribution model executes in real time, and calculations can take longer than with other models.
- The data driven model doesn't count `null` values.
{% /callout %}
{% callout type="note" heading="How Last Non-Direct Touch identifies direct traffic" %}
Last Non-Direct Touch uses your [channel classifier](https://amplitude.com/docs/data/channels) to decide which touch points count as direct:
- If the property you group by is a channel classifier, Amplitude uses that classifier. Otherwise, Amplitude uses the `[Amplitude] Default Channels` classifier, or another channel classifier defined in your project.
- Within that classifier, Amplitude excludes touch points from the channel named `Direct`. If the classifier doesn't define a `Direct` channel, Amplitude excludes the classifier's fallback ("all other") channel. If the classifier has neither, Amplitude excludes `(none)` values.
{% /callout %}
## Configure an attribution model
In a data table, configure an attribution model on each metric column:
1. On the column, click **…**, then click **Attribution**.
2. Select an attribution model and configure a lookback window. Optionally, apply the attribution model to all columns in the table.
3. Click **Apply** to confirm the change and review the table results with the attribution model applied.
## Create a custom attribution model
If the pre-built attribution models don't meet your needs, create a custom model. You must be an Admin or Manager to create a custom attribution model. Follow these steps:
1. On the column, click **…**, then **options**, then click **Attribution**.
2. Select **Custom** from the model dropdown to display options for configuring your custom model.
3. Set a name and description for the model so others know how to interpret it.
4. Choose a custom weighting for your model.
- The first weight applies to the first touch.
- The last weight applies to the last touch.
- The middle weight distributes evenly across all touches between. If there are no touches between, the first and last touch each receive half of the middle weight.
{% callout type="note" heading="" %}
Amplitude recommends that all weights equal 100%, although this isn't required.
{% /callout %}
5. Set the default lookback window for the model. Optionally, lock the window to ensure that others using this model can only use that lookback window.
6. Decide whether to share the custom model with others in your organization.
7. Optionally, exclude property values from attribution. This is useful when you don't want to assign credit to a particular value, such as direct website visits or email.
8. Click **Save** to confirm the change, save the model for yourself or others to use later, and review the table results with the attribution model applied.
## Use cases
- **Acquisition channel credit**: When you analyze the effectiveness of organic and paid investments, use acquisition channels with a multi-touch attribution model to understand how each channel contributes to driving KPI outcomes. Depending on your business model and user behavior, analyze which attribution model fits best, and make investment decisions based on each channel's contribution to your target metric.
- **Comparing attribution models**: In longer conversion cycles with multi-session user flows, compare the same metric with different attribution models applied. This data helps you discover which attribution model reflects the most efficient marketing investment, and which stage of the customer buying cycle a campaign affects. For example, when attributing to advertising campaigns, find which campaigns tend to be the first interaction (awareness) that a customer has, the last (high intent), or somewhere between (research).
- **Content**: Use attribution to find how often users viewed content and how that content participated in driving a business KPI outcome. Knowing that content has a low bounce or exit rate or longer time on page is helpful, but you can clarify the business impact by generating a conversion rate based on different attribution models.
- **Internal campaigns**: Like paid off-platform advertising investments, marketing teams invest time and creative talent to generate offers and brand-building content that drives KPI outcomes. Attribution on the impact of those marketing efforts informs your content marketing teams which types of offers and creatives drive the most short- and long-term business value.
- **Paid channels with LTV**: Combine your attribution model with your behavior-based LTV calculations to see a fuller perspective of how much value a paid channel or campaign drives. This data unlocks potential for greater investments in channels that drive the most long-term business value.
## Supported attribution types by metric
Each metric type supports a specific set of attribution types:
| Attribution type | Uniques | Conversion | Event totals | Property sum, revenue total, formula |
| --------------------- | ------- | ---------- | ------------ | ------------------------------------ |
| First touch | ✓ | ✓ | ✓ | ✓ |
| Last touch | ✓ | ✓ | ✓ | ✓ |
| Last non-direct touch | ✓ | | ✓ | ✓ |
| Participation | ✓ | ✓ | ✓ | ✓ |
| Linear | | | ✓ | ✓ |
| J-shaped | | | ✓ | ✓ |
| Inverse J-shaped | | | ✓ | ✓ |
| U-shaped | | | ✓ | ✓ |
| Custom | | | ✓ | ✓ |
| Markov | ✓ | | ✓ | |
The property sum, revenue total, and formula column applies to the uniques, total, and propsum clauses.
Attribution options differ between uniques and event total attribution types because a unique user is a less clear unit to split across multiple channels or campaigns. Only attributions that clearly assign a whole user to a single channel or to many channels are used, such as First, Last, or Participation.
## Attribution with multiple properties
The attribution model applies only to the property in the outermost group-by level. Properties in inner group-by levels don't undergo attribution modeling. Instead, they inherit their values from the attributed event.
In this example, the attribution model applies only to `Channel`, the outermost group-by property.
`utm_source`, as an inner group-by property, derives its value from the attributed events rather than applying attribution separately.
For more information about how Amplitude organizes results, or why a sum may not match the overall value, go to [Group-bys: How Amplitude prunes and orders chart results](https://amplitude.com/docs/analytics/charts/group-by).
## Attribution example calculation
This example highlights the differences between attribution models and lookback windows.
{% callout type="note" %}
In Amplitude Analytics, attribution queries have a scope of one day.
{% /callout %}
A user has three touch points before the `Sign Up` event, each with a different UTM source:
| UTM source | Date | Event |
| ---------- | ---------- | --------------------- |
| Google | 2022-05-01 | Viewed Home Page |
| Facebook | 2022-05-07 | Viewed Blog Post |
| TikTok | 2022-05-10 | Viewed Promotion Page |
| | 2022-05-10 | Sign Up |
The following sections show example combinations of attribution model and lookback window, and the resulting credit attributed to each UTM source.
| Model | Lookback | Google | Facebook | TikTok | Explanation |
| ---------------------- | -------- | ------ | -------- | ------ | ------------------------------------------------------------------------------------------------------------------------------------------------------------------------------------------------------------------------------------------------------------------ |
| First Touch | 30 Days | 100% | | | All credit goes to the first touch within the last 30 days, which is Google on 2022-05-01. |
| First Touch | 7 Days | | 100% | | All credit goes to the first touch within the last 7 days, which is Facebook on 2022-05-07. |
| Last Touch | 7 Days | | | 100% | All credit goes to the last touch within the last 7 days, which is TikTok on 2022-05-10. |
| Last Non-Direct Touch | 7 Days | | | 100% | Works like Last Touch, but skips direct touch points. No touch point in this journey is direct, so the last touch (TikTok) receives all credit. If the TikTok touch point were direct traffic instead, all credit would go to Facebook, the last non-direct touch. |
| Linear | 30 Days | 33% | 33% | 33% | Divides evenly between all three touch points in the last 30 days. |
| Linear | 7 Days | | 50% | 50% | Divides evenly between the two touch points in the last 7 days. |
| J-Shaped | 30 Days | 20% | 20% | 60% | In the last 30 days, the first touch gets 20%, middle touches 20%, and last touch 60%. |
| J-Shaped | 7 Days | | 30% | 70% | There is no middle touch, so the 20% is split across the first and last touches. |
| Custom; 5% - 20% - 75% | 30 Days | 5% | 20% | 75% | In the last 30 days, the first touch gets 5%, middle touches 20%, and last touch 75%. |
================================================================================
# Create a metric
URL: https://amplitude.com/docs/analytics/charts/data-tables/data-tables-create-metric
================================================================================
# Create a metric
Metrics let you define and save reusable analysis objects in Amplitude. They speed up workflows and increase confidence when building analyses. Metrics are shared **project-wide**, and any member, manager, or admin can create them. Only managers and admins can mark a metric as official.
## Create and configure a new metric
To create and configure a metric for use in Event Segmentation charts or Data Tables:
1. Go to where you add an event to your analysis. Open the _Metrics_ tab and click _+ Define new Metric_.
2. In the modal, specify the metric type to create. Event Segmentation, Revenue, and Formula metrics are available for both chart types. Funnels are also available in Data Tables. Hybrid Formula metrics are only available in Data Tables and Metric Explorer.
{% callout type="note" %}
For more information about custom formulas, refer to [Custom formulas in Amplitude Analytics](https://amplitude.com/docs/analytics/charts/event-segmentation/event-segmentation-custom-formulas). For Hybrid Formulas that combine event and session inputs, refer to [Hybrid Formulas](https://amplitude.com/docs/analytics/charts/metric-explorer/hybrid-formulas).
{% /callout %}
3. Add the events and properties you want.
4. Give the metric a unique name. You can also add a description to explain the metric to your team, and verify (or "officiate") the metric.
{% callout type="note" %}
Only project managers and admins can verify metrics.
{% /callout %}
5. Click _Save_ to add the metric to your analysis.
After you add a metric, you can **edit** or **remove** it. In a Data Table, click **More Options** in the metric header. In an Event Segmentation chart, click _View Metric_ in the flyout panel to edit the metric. Remove a metric from an Event Segmentation chart the same way you remove an event.
To **delete** a metric from the project, click _Edit metric_, then _Delete_, in the metric drawer. Only Amplitude users with the Administrator role can delete metrics they don't own.
For **event total** metrics in Data Tables, click the settings gear next to the date picker to switch between absolute numbers, relative percentage of total, or both.
================================================================================
# Multi-dimensional analysis with Data Tables
URL: https://amplitude.com/docs/analytics/charts/data-tables/data-tables-multi-dimensional-analysis
================================================================================
# Multi-dimensional analysis with Data Tables
When analyzing a rich dataset, analysts often need to compare multiple metrics at once and slice the data by different dimensions to build a custom analysis. Amplitude's Data Tables enable multi-metric, multi-dimensional analyses in a single view.
Use Data Tables for:
- Marketing [attribution](https://amplitude.com/docs/analytics/charts/data-tables/data-tables-attribute-credit) (total visits, page views, and conversion rate by UTM source)
- Market segment analysis
- Experiment analysis
- Trend investigation
- Comparing time periods across multiple metrics (metric A, metric B, and metric C, broken down by category, compared to last quarter)
Sort columns in ascending or descending order by clicking the metric header, drag or resize columns, and highlight, copy, and paste any number of cells from your Data Table.
{% callout type="note" heading="Display limits" %}
When you apply group-bys, Data Tables display the top 100 results for a single group-by, or up to 500 results for multiple top-level group-bys. Metrics with attribution have a 20-row limit. These are display limits—Amplitude processes all your data but shows only the top results. Export limits vary by metric type. For complete details, review [Results limits and sorting logic in Data Tables charts](https://amplitude.com/docs/analytics/charts/data-tables/data-tables-results-and-sorting-logic).
{% /callout %}
## Create a Data Table
To create and use a Data Table:
1. Go to _Create > Chart > Data Table_.
2. In the empty Data Table panel, click _Add an event or metric_ and select the event or metric you want. A new Data Table opens with your chosen event or metric in the first column. Add more by clicking _+ Add Event or Metric_ in the rightmost column.
You can [create a new metric](https://amplitude.com/docs/analytics/charts/data-tables/data-tables-create-metric) at this point if you need to.
3. To break out your events and metrics by property values—such as country, platform, or week—click _Select property…_ in the leftmost column of the table and choose the property.
This runs a group-by on your events and metrics, grouping by the property you selected. You can include up to five top-level group-bys in a single Data Table.
{% callout type="note" %}
When you do a top-level group-by in a Data Table and include a Formula Metric, the results are consistent with measuring by a Formula in Event Segmentation _and_ grouping by an Event property (as opposed to grouping by a Segment in Event Segmentation).
{% /callout %}
4. After you add a group-by property, run a secondary group-by on that row of your Data Table. For example, break your events and metrics out by the `Day of Week` property nested within `Country`.
Click the bar icon in the rightmost group-by column and select the property.
{% callout type="note" %}
When using a time dimension as a group-by property, the time dimension must be the last group-by you add: `group by: country`, then `group by: day of week`. Adding these group-bys in the reverse order doesn't generate correct results.
{% /callout %}
5. Add [user segments](https://amplitude.com/docs/analytics/charts/build-charts-add-user-segments) if you want. Saved segments are accessible. Multiple segments appear in the table as separate columns within the same metric.
After you configure the data table, you can manage and manipulate your data in several ways.
In any cell, click the Options icon to:
- **Open as chart** to open a new tab with the chosen metric applied.
- **Create cohort** to save the chart's data points as a [cohort](https://amplitude.com/docs/analytics/behavioral-cohorts).
- **Copy** the data to paste elsewhere, or export the data as a CSV file.
In any column header, click the Options icon to:
- **Add Filter** to apply a filter to the chosen field.
- **Duplicate** or **remove columns**.
- **Rename** a column for clarity or consistency.
{% callout type="note" %}
To reset a display name to its original name, choose _Reset to Original Name_ from the column's Options icon.
{% /callout %}
- **Save as metric** to use the metric in other analyses.
- **Attribution** to apply an [attribution model](https://amplitude.com/docs/analytics/charts/data-tables/data-tables-attribute-credit) to the chosen field or all fields.
- **Sort** values from low to high (ascending) or high to low (descending).
### Use metrics in Data Tables
In Data Tables, including a "-" character in any cell included in your formula's calculation results in an error.
Using Uniques as a metric type in combination with group-bys can produce results that look counterintuitive. When you add a group-by to the event in the left column, the total sum for the event in the top row **isn't a sum** of the rows below. Because a group-by is applied to the event, the same user can exist in multiple rows.
The same logic applies to the Session Totals metric. When you add a group-by in the left column, the total number of sessions in the top row can be fewer than the sum of the rows below. The chart counts a session containing property values X and Y under both X and Y groups.
When you add conversion metrics to your data table, the conversion rate appears in the cell. When you add a group-by, the breakdown shows the conversion rate for each grouped value.
## Transpose rows and columns
You can transpose columns and rows of a Data Table when:
- you've toggled on a period over period comparison,
- segments exist in your chart definition,
- you've added top-level group-bys to your data table, _or_
- time properties exist.
Transposing _isn't_ possible if:
- _nested_ group-bys exist
- you've unchecked _Absolute numbers_
{% callout type="note" heading="" %}
Transposed Data Tables don't support the display options _Relative % for totals_, _Data bars in cells_, or _Color % delta_.
{% /callout %}
To transpose a Data Table:
1. Add events or metrics to the horizontal axis.
2. Add top-level group-bys to the vertical axis.
3. Change the _Columns_ dropdown to rows to flip the axes.
{% callout type="note" %}
Transposed Data Tables are read-only.
{% /callout %}
================================================================================
# Results limits and sorting logic in Data Tables charts
URL: https://amplitude.com/docs/analytics/charts/data-tables/data-tables-results-and-sorting-logic
================================================================================
# Results limits and sorting logic in Data Tables charts
For more complex analyses, understand how Amplitude Analytics decides what results to display, and what happens when you sort on a column.
## Display limits
Data Tables apply display limits based on your group-by configuration. Amplitude still processes all your data, but displays only the top results. These are the maximum rows shown in the table:
- **Single top-level group-by**: 100 rows maximum
- **Multiple top-level group-bys**: 500 rows maximum
- **Metrics with attribution**: 500 rows maximum
- **Multiple metric types with different limits**: The smallest limit applies.
### Nested group-bys
To add multiple group-bys in a data table, start with one group-by selected in the first column. On hover, an icon with three stacked lines appears with the label "Add top-level group-by." Click the icon to add another column and a second group-by.
By default, Amplitude applies the first group-by, finds the second group-by value within each value of the first, and continues in that order for any additional group-bys you add.
Amplitude applies display limits to each group-by level separately. For example, if you group by `city` (top-level limit: 100 rows), then add a nested group-by for `email`, up to 100 emails appear for each city.
### Multiple metric types
If your Data Table includes metrics with different display limits, the smallest limit applies to all metrics. For example, if you include both an event segmentation metric (normally 100 rows) and an attribution metric (500 rows), only 100 rows appear.
{% callout type="note" %}
If your table contains metrics that aren't segmentation-based (such as conversion, attribution, or session) **and** you're using multiple group-bys, you might see fewer results than these limits suggest. Contact your CSM or Amplitude Support if this is an issue.
{% /callout %}
## Sorting logic
Once you have these results, sorting applies **only to them**, and **doesn't** bring in new results.
For example, if your group-by has enough different property values that Amplitude Analytics limits the results to the top 100, Amplitude sorts these results in descending order by default. If you switch to ascending order, **you don't** see the "bottom 100" results. You **still** see the same top 100 results; only the sorting order changes.
When you use multiple metrics, sorting by a column displays data for all columns based on the values in the sorted column. For a data table with multiple segments, multiple metrics, and a period over period comparison, sorting a period-over-period column within a metric returns a dataset based on the first segment's current period.
## Column ranking behavior
When you apply group-bys to your Data Table, Amplitude ranks and prunes high-cardinality results before displaying them. The ranking method depends on the metric type in the sorted column.
### Single-term formulas and non-formula metrics
When you sort a column by a single-term formula metric or any non-formula metric (such as Uniques, Totals, or property aggregations), Amplitude ranks groups according to the standard [group ordering logic](https://amplitude.com/docs/analytics/charts/group-by#group-ordering).
For example, if you sort by Uniques, Amplitude ranks by the number of unique users. If you sort by Sum of Property Value, Amplitude ranks by the sum of property values.
### Multi-term formula metrics
When you sort a column by a formula metric with multiple terms (such as `PROPSUM(A) / TOTALS(B)`), Amplitude uses a different ranking approach. Instead of ranking by the final calculated formula values, **Amplitude ranks by the sum of unique users across all metrics in the formula**.
This ranking method is less accurate because it doesn't reflect the actual formula results. The system weights each group by unique user count, calculates each metric separately, performs the formula operation, and then orders the results.
{% callout type="note" %}
This weighted ranking applies only when determining which groups to display (the top N results based on display limits). After Amplitude selects the groups, sorting within those results displays them in the correct order based on the actual formula values.
{% /callout %}
#### Example
You create a Data Table with the formula `PROPSUM(A) / TOTALS(B)` grouped by Country:
- **USA**: Revenue = $40,000, Events = 20,000, Users with revenue events = 1
- **Canada**: Revenue = $10,000, Events = 10,000, Users with revenue events = 10
When ranking to determine which countries to display, Amplitude ranks Canada higher than USA because Canada has 10 users with revenue events compared to USA's 1 user. This happens even though USA's actual formula result ($40,000 / 20,000 = $2) is higher than Canada's ($10,000 / 10,000 = $1).
After Amplitude selects which countries to display based on this user-weighted ranking, the table sorts them by their actual formula values.
### Why this matters
This ranking behavior can produce unexpected results when you work with high-cardinality data (many unique group-by values). Groups with high formula values but few users may not appear in your results if other groups have more users, even when those groups have lower formula values.
{% callout type="tip" heading="Workaround" %}
To rank by actual formula results, consider:
- Breaking your analysis into separate metrics without using multi-term formulas
- Exporting the data and performing calculations outside Amplitude
- Using filters to reduce cardinality before applying group-bys
{% /callout %}
This behavior also applies to Event Segmentation charts with custom formulas. For more details on formula metrics, review [Custom formulas in Event Segmentation](https://amplitude.com/docs/analytics/charts/event-segmentation/event-segmentation-custom-formulas).
## CSV export limits
CSV exports have different row limits than the table display. Export limits depend on the metric type:
- **Event segmentation metrics without attribution**: 10,000 rows
- **Funnel metrics without attribution**: 300 rows
- **Session metrics**: 100 rows
- **Any metric with attribution**: 500 rows
- **Multiple metric types**: Smallest limit applies.
Amplitude prunes rows that exceed the limit. They don't appear in the exported CSV file.
## Limits for Dashboard REST API queries
Results queried from the [Dashboard REST API](https://amplitude.com/docs/apis/analytics/dashboard-rest) have a limit of 1000 rows for event segmentation metrics. This is the only difference from the CSV limits described in the previous section.
## How time properties work in Data Tables
When you apply time properties as group-bys, all limits described above apply to each group of the property.
### Examples
- If you use multiple top-level group-bys, the display limit is 500 rows. If you add another top-level group-by for the month property (a time-related property), and the date range includes three months (and three different values for the property), up to 1500 rows (`500 rows × 3 property values`) display in the Data Table.
- If you export a funnel metric without attribution, grouped by a non-time property, the CSV export limit is 300 rows. If you add another top-level group-by for the day property (a time property), and the date range includes seven days (and seven different values for the property), up to 2100 rows (`300 rows × 7 property values`) export to your CSV.
- The 10,000-row limit for event segmentation metrics without attribution doesn't apply if the final group-by in the top level group includes a time property.
================================================================================
# Use session metrics in Data Tables
URL: https://amplitude.com/docs/analytics/charts/data-tables/data-tables-use-session-metrics
================================================================================
# Use session metrics in Data Tables
Session metrics—such as bounce rate, exit rate, entry rate, entries, exits, and session totals—are diagnostic tools for understanding the performance of campaigns, landing pages, and other key touchpoints. Use these metrics in Data Tables to compare how different pages, screens, or content perform.
In Analytics, session metrics are available in Data Tables charts on the _Metrics_ tab. Other than session totals, session metrics aren't available as standalone metrics in Analytics. Amplitude calculates session metrics from the group-by you select, and includes only active events in the computation. Amplitude Analytics uses the group-by to determine how many values are present and the sequence used for calculation.
{% callout type="note" heading="See also" %}
To combine a session metric with an event metric in one expression, (for example, Revenue per Session or Add to Carts per Session), refer to [Hybrid Formulas](https://amplitude.com/docs/analytics/charts/metric-explorer/hybrid-formulas).
{% /callout %}
{% callout type="note" %}
To analyze other marketing metrics with Amplitude charts, refer to [Marketing metrics recipes](https://amplitude.com/docs/analytics/charts/user-sessions/marketing-metrics-recipes).
{% /callout %}
## Filter session metrics inline in Data Tables
Filter session metrics directly from the column header in a Data Table. This focuses your analysis on sessions that match specific conditions, without changing the underlying metric definition.
To filter a session metric inline:
1. Open or create a **Data Table**.
2. Add a **session metric column** by either:
- Selecting a session metric (such as **Session totals**, bounce rate, entry rate, or exit rate) from the **Metrics** tab, or
- Selecting an event column and changing **Measured as** to **Session Totals**.
3. In the header for the session metric column, select the **Options** icon (three dots) and click **Add filter**.
4. Define the conditions that sessions must meet to be included in the metric. For example, restrict the metric to sessions that include a `Page Viewed` event where **Page URL** contains `/pricing`.
Amplitude evaluates inline filters on session metrics at the session level. They work alongside any other filters or segments in your Data Table definition.
### Session filter types
When you add a filter on a session metric column, the filter menu shows session-specific options. Amplitude always applies these filters at the session level:
- **Contains Event**: Include only sessions that contain at least one event matching the conditions you specify. For example, filter to sessions that contain a `Page Viewed` event where Page URL contains `/pricing`.
- **Session Duration**: Filter sessions based on duration (for example, sessions longer than 30 seconds or shorter than 5 minutes).
- **First Property Value**: Filter sessions by the first non-null value of a property in the session (for example, sessions where the first Page URL in the session is `/home`).
- **Last Property Value**: Filter sessions by the last non-null value of a property in the session (for example, sessions where the last Page URL in the session is `/checkout`).
These filters narrow which sessions the session metric column counts. They apply on top of any global filters already in effect, and further restrict the result set.
## Global filters and session metrics
Global filters in Data Tables apply to all columns, including session metric columns. When you add a global filter to a Data Table, Amplitude evaluates it across your entire analysis, including session metric columns, the same way it applies to event-based columns.
You don't need to set the same filter on each session metric column individually to get consistent results. Add it one time as a global filter and it takes effect everywhere.
{% callout type="note" %}
Session metrics require session filters. Applying a user or event filter globally means session columns filter by a session filter that reflects the global filter logic. For example, when you apply an event property filter such as "Page URL = /home", the session columns filter by "Sessions that contain any active event with Page URL = /home".
{% /callout %}
### Inline session column filters
When you add an inline filter to a session metric column (for example, to restrict to sessions containing a `Page Viewed` event where the page URL contains `/pricing`), that filter stacks on top of the global filter, and narrows the result set further.
For example, if you apply a global filter for users in the United States, your session metric columns (bounce rate, exit rate, session totals, and so on) reflect US users only, the same scope as the rest of your Data Table.
## Select a good group-by property
The most common properties for a group-by are page- or screen-level properties that change as a user interacts with your app or site. These work well because they vary between most of the relevant events, and are set frequently enough to signal a bounce when needed.
{% callout type="note" %}
Session metrics can't combine more than one top-level group-by.
{% /callout %}
## Example: Group-bys and session metrics
Amplitude uses the number of values of your group-by property to decide whether to classify a session as a specific metric, such as bounce, entry, or exit.
Here are three example sessions:
### Session 1
1. Event: `Page View`
`Page` = A
2. Event: `Click`
`Name` = 1A
`Type` = Ad
3. Event: `Page View`
`Page` = B
### Session 2
1. Event: `Page View`
`Page` = B
`Name` = 1A
`Type` = Ad
2. Event: `Click`
`Name` = 1B
`Type` = Ad
### Session 3
1. Event: `Buy`
`Amt` = $15
`Prod` = 1
A `Page View` event is either a default event captured through the Browser SDK, specified in Amplitude's Marketing Space settings, or defined in a Data Tables analysis as a bounce rate metric.
### Bounce
A bounce is a session where the user triggers only one `Page View` event. This is also known as a single-page session.
Amplitude calculates the bounce rate as a percentage based on this formula:
```
count of single-page sessions / the total number of sessions
```
Amplitude calculates bounce rates with a group-by by:
```
count of single-page sessions grouped by the first non-null property value /
the total number of sessions grouped by the first non-null property value
```
To decide if the example sessions are a bounce:
- **Session 1** isn't a bounce because, regardless of the group-by property such as `Page` or `Name`, it contains more than one `Page View` event.
- **Session 2** contains only one `Page View` event. If you group by the `Name` event property, Amplitude Analytics classifies this session as a bounce. Amplitude groups it by the `Name` value of "1A" since it appears first in the session, and the bounce rate is 1 / 2 (50 percent).
- **Session 3** isn't a bounce because, regardless of the group-by property, it doesn't contain any `Page View` events.
### Entry and exit
Amplitude defines Session Entries by the first non-null value for the group-by property within the session. Amplitude defines Session Exits by the **last** non-null value for the group-by property within the session.
Amplitude calculates entry and exit rates as a percentage using this formula:
```
the number of entries or exits / the total number of sessions
```
{% callout type="note" %}
Overall entry and exit rates are always 100 percent because every session has entry and exit values.
{% /callout %}
For the same sessions above:
- If you group by the `Name` event property, Amplitude groups both the entry and exit rates under "1A" because it's the first property value of `Name`. The entry rate is 2 / 3 (66.66 percent) and the exit rate is 1 / 3 (33.33 percent).
- If you group by the `Page` event property, Amplitude groups the entry and exit rates under "B." The entry rate is 1 / 3 (about 33.33 percent). The exit rate is 2 / 3 (66.66 percent).
{% callout type="note" %}
When you use a session metric that includes an event filter, you can choose whether group-bys use properties from the entire session (**Session level**) or only from the filtered event (**Event level**). For details, see [Choose event-level or session-level group-bys for session metrics](#choose-event-level-or-session-level-group-bys-for-session-metrics).
{% /callout %}
## Choose event-level or session-level group-bys for session metrics
When you use a session metric that includes an event filter, you can choose whether Amplitude evaluates group-bys at the session level or the event level.
- **Session level** (default): Amplitude takes group-by values from all events in the session.
- **Event level**: Amplitude takes group-by values only from the events included in the metric's event filter.
This choice is available when:
- You define a **session metric** in the Metrics tab with an **event filter**, and
- You add a **group-by property** for that session metric column in a Data Table.
In that case, the session metric column includes a control that lets you select **Session level** or **Event level**.
### Example
Suppose you define a session metric as:
- **Metric**: Session totals
- **Filter**: Sessions that contain a `Page Viewed` event where **Page URL** contains `/pricing`
- **Group-by**: `utm_source`
- With **Session level** selected, `utm_source` can come from any event in the session that has that property set (for example, earlier campaign events or other page views).
- With **Event level** selected, Amplitude takes `utm_source` only from the filtered `Page Viewed` events that match the metric definition (for example, page views where **Page URL** contains `/pricing`).
The choice between event-level and session-level controls is only available for session metrics that have an event filter. If a session metric doesn't have an event filter, group-bys always use session-level semantics.
## Differences between session totals and PROPCOUNT(session IDs)
You may want to compare results of one Amplitude chart with another, but not all chart analyses are interchangeable.
For example, you can't compare the results of a session totals query in a Session Metrics chart with the [PROPCOUNT](https://amplitude.com/docs/analytics/charts/event-segmentation/event-segmentation-custom-formulas)(session IDs) formula in the Event Segmentation chart.
These two analyses can't be compared because of the following differences in their logic:
| Session totals query in Session Metrics chart | PROPCOUNT(session IDs) formula in an Event Segmentation chart |
| ------------------------------------------------------------------ | -------------------------------------------------------------------------------------------------------------------------------------------------------------------------------------------------------- |
| Measures an **exact** total | Measures an **estimate** of distinct property values |
| Measurement **counts unique pairings** of user IDs and session IDs | **Doesn't count unique pairings** of user IDs and session IDs, and produces different results when multiple users have the same session ID |
| | Session IDs aren't tracked for [custom session](https://amplitude.com/docs/data/sources/instrument-track-sessions#custom-session-property) definitions, so Amplitude can't count them with the PROPCOUNT(session IDs) formula |
================================================================================
# Entry / Exit Analysis
URL: https://amplitude.com/docs/analytics/charts/data-tables/entry-exit-analysis
================================================================================
# Entry / Exit Analysis
Entry / Exit Analysis lets you use the entry (first) or exit (last) in-session dimensions across different types of analysis.
## Supported metric types
Entry / Exit analysis supports the following metric types:
- **Uniques**: The count of unique users
- **Event totals**: The total number of events
- **Session totals**: The total count of sessions
- **PROPSUM**: The sum of a group-by property value
## Enable Entry / Exit Analysis
Apply Entry or Exit semantics to any supported metric type in the Data Table.
To enable this analysis:
1. In a data table with at least one event or metric, click the Options menu in the header of the column you want to enable the analysis on.
2. Click _Enable Entry/Exit Analysis_ in the options menu. The _Enable Entry/Exit Analysis_ dialog appears.
3. Select how to apply group-by properties to the column:
- **Default**: Uses the standard group-by setting for the column
- **Entry**: Groups data by the first non-null property value of an active event in a session that contains the specified event.
- **Exit**: Groups data by the last non-null property value of an active event in a session that contains the specified event.
{% callout type="note" heading="" %}
Data table columns support either Attribution **or** Entry / Exit analysis, but not both.
{% /callout %}
4. Click **Apply**.
## Processing flow
For each session that contains the event specified in the column:
1. Amplitude identifies all relevant sessions.
2. For each session:
- Amplitude extracts the first property value of an active event for Entry Analysis.
- Amplitude extracts the last property value of an active event for Exit Analysis.
3. Amplitude uses these values to compute session-based metrics.
## Calculations
Amplitude uses the following formulas to compute the metrics that support Entry and Exit analysis:
| Metric Type | Formula |
| ------------------------------- | ------------------------ |
| Uniques | `UNIQUES(A)` |
| Event totals | `TOTALS(A)` |
| Prop sum | `PROPSUM(A)` |
| Session totals (Entry analysis) | Like **Session Entries** |
| Session totals (Exit analysis) | Like **Session Exits** |
================================================================================
# Time spent analysis
URL: https://amplitude.com/docs/analytics/charts/data-tables/time-spent-analysis
================================================================================
# Time spent analysis
Amplitude calculates the time spent on an event as the duration between consecutive events of the specified type. To prevent long periods of inactivity from skewing the analysis, Amplitude applies a 30-minute timeout. If no events of the specified type occur within a 30-minute window, Amplitude closes the current time spent window and begins a new window with the next event.
When you specify a group-by property, such as `page URL` or `page type`, any change in its value resets the time spent window. This ensures that Amplitude can attribute time spent to the specific value of the group-by property at the beginning of each window.
In the following example, the timeline represents a set of consecutive page views and their associated page types.
| Page type | Time spent |
| ---------- | ---------- |
| `Landing` | 10 minutes |
| `ViewItem` | 20 minutes |
| `Checkout` | 7 minutes |
## Supported event types
Amplitude supports any event type to define a time spent metric. Page view events are most commonly used for this analysis. You can define page view events in a few ways:
- **Primitive page view event**: A basic event designed to track page views. For example, the predefined `[Amplitude] Page View` event.
- **Any active event where Event Name ∈ 'Page View'**: Some taxonomies define page view at the property level. Use a filter to limit event selection to names that contain `page view`.
- **Custom page view event**: A combination of primitive events that collectively represent a page view.
## Use time spent metrics in data tables
Time spent metrics are available in data tables. Use these metrics to gain insight into user behavior:
- **Total time spent on page**
- **Definition**:
- The cumulative time spent by all users on a specific page or set of pages.
- `TimeSpent(PV)`
- **Time spent per user**
- **Definition**:
- The average time users spend viewing pages on your site.
- `TimeSpent(PV) / Uniques(PV where TimeSpent(PV) > 0)`
- **Time spent per page**
- **Definition**:
- The average time spent per page event.
- `TimeSpent(PV) / Totals(PV where TimeSpent(PV) > 0)`
- **Time spent per session**
- **Definition**:
- The average time spent on page views per session.
- `TimeSpent(PV) / SessionTotals(where TimeSpent(PV) > 0)`
{% callout type="note" heading="" %}
The computation of time spent per user, per page, and per session metrics depends on an internal metric used as the denominator. As a result, Amplitude doesn't support calculating these metrics as a formula.
{% /callout %}
Time spent metrics return results in the specified unit of time, such as seconds, minutes, or hours.
{% callout type="note" heading="" %}
The last page view in a session isn't measured for time spent because there is no subsequent page view event to measure. Sessions with a single page view (bounces) behave the same way for the same reason.
{% /callout %}
## Create a time spent metric
To create a time spent metric:
1. Create a new Data Table or open an existing one.
2. Click _+Add Event or Metric_.
3. Select the _Metrics_ tab in the dialog. Click _+Define new Metric_.
4. In the _Metric Type_ selection, scroll to the **Time Spent** metrics and select the metric you want to use.
5. Optionally, apply a filter to the event and select the unit of time.
6. Click _Save_.
================================================================================
# Data Tables FAQ
URL: https://amplitude.com/docs/analytics/charts/data-tables/faq
================================================================================
# Data Tables FAQ
## Common questions
This page answers common questions about Data Tables charts.
## Results
### Why is the sum of the rows in my Data Table greater than the overall value?
After you apply a group-by clause to a uniques metric in a Data Table, a single user **may** appear in more than one group **if** they triggered that event multiple times with **different values** for the property specified in the group-by. The sum of uniques after a group-by can be **greater** than the overall value.
### The overall value in my Data Table doesn't equal the sum of the rows below it when it should. Why?
This is due to caching. The overall result and the group-by results come from different queries, so they're cached differently. To get consistent results, update the end day to yesterday in the date picker.
### When I apply an attribution model in my Data Table, why doesn't the overall value equal the sum of the values in the rows below it?
When a metric with attribution is applied in a Data Table **and** there are more than ten possible values for the group-by clause, only ten values appear. When this happens, a [pruning message at the top](https://amplitude.com/docs/analytics/charts/group-by) of the screen appears. Other users contribute to the total, but their values aren't included in the ten values shown (they're pruned from view), so the sum of the ten rows doesn't equal the overall value at the top.
### Why do some of my values disappear in my Data Table when I sort from high to low?
For details about results limits and sorting logic in Data Tables, see [Data Tables documentation](https://amplitude.com/docs/analytics/charts/data-tables/data-tables-multi-dimensional-analysis).
### Why does my Data Table show only 100 rows when I've applied a group-by clause?
When you apply a group-by to your Data Table, Amplitude displays the top 100 results by default. This is a display limit, not a data processing limit. Amplitude still processes all your data, but only shows the top 100 groups ranked by the sorted metric.
The display limits vary based on your configuration:
- **Single top-level group-by:** 100 rows
- **Multiple top-level group-bys:** 500 rows
- **Metrics with attribution:** 20 rows
- **Multiple metric types:** Smallest limit applies
When you export to CSV, different limits apply based on metric type. For complete details about display limits, export limits, and sorting logic, review [Results limits and sorting logic in Data Tables](https://amplitude.com/docs/analytics/charts/data-tables/data-tables-results-and-sorting-logic).
### Why do some formula metric column cells populate in my Data Table while others appear as null ("-")?
The formula metric in a Data Table works only for groups that have a value for all terms in the formula. If one cell that makes up the formula isn't available, the formula populates as a dash.
## Exports
### Why doesn't my exported CSV include all the rows displayed in the Data Table?
For details about results limits and sorting logic in Data Tables, see [Data Tables documentation](https://amplitude.com/docs/analytics/charts/data-tables/data-tables-multi-dimensional-analysis).
### Why does my exported CSV show more values than what appears in the Data Table?
For details about results limits and sorting logic in Data Tables, see [Data Tables documentation](https://amplitude.com/docs/analytics/charts/data-tables/data-tables-multi-dimensional-analysis).
### Why does my exported CSV contain more than 10,000 rows if 10,000 rows is the limit?
The limit is 10,000 groups per metric per group-by clause. If you have multiple metrics in your data table, and the groups of the first column differ from those of the second column, the results may display as a union of available properties across the board, which can exceed 10,000 rows overall.
### When I export my Data Table as a PDF or PNG, why is the image cut off?
This is due to a bounded box of the Data Table, set intentionally for technical reasons. To request a change, submit feedback through the Amplitude widget at the bottom right corner of the UI.
## Usability
### Why can't I scroll horizontally in a Data Table?
When you have many group-by filters, the property values can take up the entire width of a laptop screen. This pushes the metric columns off the page, making them unreachable. Open the Data Table on a larger monitor, or reduce the number of group-bys applied.
To request a change, submit feedback through the Amplitude widget at the bottom right corner of the UI.
### Can I show all the filters applied to the Data Table without hovering over the filter icon?
No. The filter is only visible on hover.
To request a change, submit feedback through the Amplitude widget at the bottom right corner of the UI.
### Is there a way to perform simple calculations using the columns of Data Tables? For example, I have two columns, A and B. How do I calculate `A / B` row-wise and display the result in a third column?
Create a [formula metric](https://amplitude.com/docs/analytics/charts/data-tables/data-tables-create-metric) to do this.
================================================================================
# Understand the paths users take, and why they convert
URL: https://amplitude.com/docs/analytics/charts/journeys/journeys-understand-paths
================================================================================
# Understand the paths users take, and why they convert
Amplitude's Journeys chart incorporates the power of the legacy Journeys and Pathfinder Users charts to generate a complete, 360-degree analysis of how your users convert (or fail to convert) between key transitions in your product. You can inspect your users' product journeys in two ways:
- By the total number of unique users who took a particular path.
- By the total number of times users took that path.
{% callout type="note" heading="Uniques versus totals" %}
- When counting **uniques**, Amplitude counts the first conversion per user in the given time range.
- When counting **totals**, Amplitude counts every conversion in the time range.
{% /callout %}
Within a Journeys chart, you can:
- Start with **Pathfinder** for a high-level exploration of paths your customers take. Drill in on a particular branch based on a starting event, ending event, or between two events. This is a helpful starting point if you don't know what you want to see.
- Dive deeper with **Journey Map** to compare all your customer paths against each other and understand the details. Analyze paths by frequency, similarity, or average time to complete; identify where paths branch out at the most detailed level; or compare converted vs. dropped-off paths.
A common use case for Journeys is to bridge the gap between your **ideal** customer journey, which you can generate in a funnel chart, and the customer journeys your users **actually** take, as shown in a Journey Map or a Pathfinder analysis.
Refer to [Understand and use the Journeys visualizations](https://amplitude.com/docs/analytics/charts/journeys/journeys-understand-visualizations) for more information on the **Pathfinder** and **Journey Map** visualizations.
## Create a Journeys chart
A Journeys chart lets you analyze paths that:
- Include specific events.
- Exclude specific events by property.
- Expand events by property.
- Measure paths within a specific conversion window.
- Analyze by a single segment.
You can also hide noisy events, only show specific events, collapse repeated events, and view custom events. Any settings you change while viewing one visualization carry over to the others.
In any Journeys visualization, you can remove an event, expand an event by property, filter by sequences that include the event and property pair, or create a cohort from an event. Click the event and select the option you want from the menu that appears.
To create a new Journeys chart, follow these steps:
1. Click _Create > Chart > Journeys_.
2. In the Paths module, use the dropdown to specify whether you want to build a path **starting** with a specific event, **ending** with a specific event, or a path **between** two specific events.
3. Click _+ Add Event_ and add the event you want.
4. In the _Filter by paths, expand by property_ module, click:
- _+ Add event to filter_ to narrow your results to only include paths in which your specified event appears.
- _+ Add event to exclude_ to hide specified event and property values from the results.
- _+ Add event to expand_ to group by an event and view property values separately. This is essentially the same as applying a group-by condition.
5. In the _Measured As_ module, specify whether you want this chart to measure by uniques or event totals.
6. In the _Segment by_ module, [specify the users you want to include in this analysis](https://amplitude.com/docs/analytics/charts/build-charts-add-user-segments).
7. In the chart area, click _+ More Events_ to load more events into the chart. By default, Amplitude loads the top five events by number of users.
8. Your chart appears. To hide noisy events, show only specific events, show custom events, or collapse repeated events, click the _Filter Events_ dropdown and make your selections.
{% callout type="note" %}
Amplitude hides inactive events by default. To show them, click _Choose events to exclude_ and deselect the ones you want visible.
{% /callout %}
Any changes you make to settings in this procedure populate across [all Journeys visualizations, which you can read more about here](https://amplitude.com/docs/analytics/charts/journeys/journeys-understand-visualizations).
## How the conversion window works in a Journeys chart
Like any other Amplitude chart, Journeys requires a length of time to use as the basis for your analysis. In a Journeys chart, this is the **conversion window**.
Conversion windows can use clock time or sessions to define the window. When you set the window to a unit of clock time, your chart includes event paths that users completed within that length of time, no matter how many sessions it took.
When you set the window to one session, your chart includes event paths that users completed within a single session, no matter how much time elapsed (as long as it doesn't exceed the length of time covered by the chart).
For information about Journeys visualizations, refer to [Understand and use the Journeys visualizations](https://amplitude.com/docs/analytics/charts/journeys/journeys-understand-visualizations).
================================================================================
# Understand and use the Journeys visualizations
URL: https://amplitude.com/docs/analytics/charts/journeys/journeys-understand-visualizations
================================================================================
# Understand and use the Journeys visualizations
Each Journeys chart consists of the Pathfinder and Journey Map visualizations. Both views tell you something different about the customer journey your users experience. Navigate between them by selecting the appropriate tab along the top of the chart area.
In any of these analyses, you can:
- Analyze paths that include specific events.
- Exclude specific events by property.
- Expand events by property.
- Measure paths within a specific conversion window.
- Analyze by a single segment.
You can also hide noisy events, only show specific events, collapse repeated events, and view custom events. Any settings you change while viewing one visualization carry over to the others.
Start and end sessions are defined the same way for all Journeys visualizations, and don't allow cohort generation from dropped-off users. Start and end times don't always represent true events. For example, a user logs in and then goes inactive after 30 minutes. By default, Amplitude generates a start session event after the user logs in and an end session event when the user goes inactive. Read more about how Amplitude tracks sessions in [Track sessions](https://amplitude.com/docs/data/sources/instrument-track-sessions). No microscope actions, such as `view user streams` or `Create cohort`, are available for dropped-off users in the Pathfinder or Journey Maps.
In any Journeys visualization, you can remove an event, expand an event by property, filter by sequences that include the event and property pair, or create a cohort from an event. Click the event and select the option you want from the menu that appears.
{% callout type="note" %}
To [access your legacy Pathfinder, Pathfinder Users, and Journeys charts, go to our Help Center article linked here](https://amplitude.com/docs/analytics/charts/journeys/journeys-understand-paths).
{% /callout %}
Because Journeys charts automatically hide inactive events, you may experience more conversions in a Pathfinder chart than in an identical funnel. Other differences between a Journeys chart and a funnel:
- When a path has a step that repeats, a **Journeys chart begins a path from the first time the repeated event triggered**. A funnel uses the instance that best meets the conversion window.
- A Journeys chart uses the earliest path. Going from the first instance of the starting event for each user, the chart creates paths from there. Funnels take the earliest and longest conversion based on the instance of the starting event that matches as many of the later events as possible.
- **Funnels created from a Pathfinder are set to _this order_**. The results won't exactly match because a Journeys chart can include hidden events between steps.
## Pathfinder
Pathfinder is the default visualization of the Journeys chart. Pathfinder shows you how users use your product by presenting all the paths that start with, or end with, a specific event during a given time period. The visualization shows the paths your customers take and their popularity relative to each other.
The flow diagram shows all the paths starting or ending with a specific event. Each step is labeled. The label tells you the event triggered at that step in the sequence, as well as the frequency the event triggered at that stage in the sequence. If a step reads _Dropped off_ or _Did not perform an event_, that path includes users who dropped off at that point, or who didn't trigger an event before the next one listed in the path.
Drill in on and expand a particular branch by clicking _More_, to a maximum of nine steps.
{% callout type="note" %}
You can turn a Pathfinder chart into a funnel. Click a step in a Pathfinder flow, then click _Create Funnel_ in the popup that appears.
{% /callout %}
One distinguishing feature of Pathfinder is the ability to select properties instead of events. Event properties, user properties, and Amplitude User properties are all supported (Historical Count and Event Historical Count aren't supported). You can select one property value for each property. Avoid setting property values to "none," as doing so may produce inaccurate results.
To filter paths by a property, select _Any Event_ and specify the property to use as a filter.
### Sunburst Visualization
The Sunburst visualization displays customer journey event flows as a hierarchical, radial chart where each ring represents a sequential step in the user journey. The Sunburst visualization is an alternate way to visualize the Pathfinder chart. It isn't related to the Journeys chart.
Users can hover over nodes to view detailed event paths and metrics in an interactive breadcrumb panel, or click nodes to drill down and explore specific journey segments in greater detail. The visualization automatically color-codes events by source path and consolidates infrequent paths (< 1% threshold) into an "Other" category for cleaner display.
## Journey Map
The Journey Map helps you understand how conversions happen in your product, especially when you know user friction exists somewhere in the user journey but not what's causing it.
Imagine a product manager who wants to better understand the initial activation flow that their product's users take. They open Journeys and switch to the Journey Map. There they find an interesting path they weren't expecting and click on it to dig deeper. The map shows them the average time it takes a user to convert, as well as specific paths individual users take.
From here, they might develop a hypothesis about why users are behaving in a way that has implications for the design of the flow itself, which they can take to the product team for discussion and iteration. They might identify something in the flow that looks like it's causing friction for users, which leads to further questions and new explorations. Or they notice a large number of users dropping off before getting to a critical step in the conversion process, so they save them into a cohort, which they share with the marketing team to target with specific messaging.
The Journey Map does the hard work of surfacing these patterns for you. Follow the insights and keep asking follow-up questions.
{% callout type="note" %}
You can't create cohorts for event paths that include `Dropped off` or `Did not perform an event`.
{% /callout %}
## Read a path across both charts
Both visualizations in any Journeys analysis measure the same paths in slightly different ways. Look at an example, starting with the Pathfinder.
The starting event is `charts: create new chart`. This is 100%, because users had to trigger this event to be included in the path. If a user didn't trigger this event, they aren't relevant to this analysis and aren't included in the charts.
Of these users, 55.4% triggered `event explorer: hide event explorer` next. The vast majority of those users (55.2% of the total number of users included in this path) then triggered `navigation: new chart`.
Each percentage on this chart refers to the percentage of all users included in the analysis, not a percentage of users captured in the previous step.
Next, 20.7% of all users triggered `taxonomy: view event detail panel`, followed by 17.5% triggering `open event dropdown`. This 17.5% represents 2,725 users.
Notice the same progressions in the Journey Map. Those 2,725 users took an average of 1 hour and 48 minutes to progress all the way through the path.
## Differences from the legacy versions of these charts
- The logic changed from the legacy Pathfinder chart. Imagine the following set of events, with a one-day conversion window:
1. Event A, April 1st, 9:00 AM.
2. Event A, April 1st, 10:00 AM.
3. Event B, April 2nd, 9:30 AM.
The legacy Pathfinder chart limited its analysis to events that occurred within the conversion window. Because the first event in this sequence is outside the conversion window, legacy Pathfinder would have used the second event as the beginning of the path.
The new Journeys logic begins by looking at the first occurrence of the start event. If it's in the conversion window, it counts as a conversion; if not, it counts as a drop-off.
- In the new version, the Pathfinder visualization matches the numbers in the legacy Pathfinder through Step 2. After Step 2, the numbers differ. In the legacy version, the % shown for an event after Step 2 represents a cumulative sum of all prior events in the step before it. Because of the branching experience in the new version, the % shown for any event after Step 2 relates specifically to the event that occurred before it in the same path.
This change aligns the Pathfinder and Journeys visual numbers, and provides users with faster exploration capabilities.
- The legacy Journeys chart collapsed events by default, without giving you the ability to change this. The new Journeys chart lets you collapse or expand events whenever you need to.
- The legacy Journeys chart required both starting and ending events, since it was created directly from a funnel. With the new Journeys chart, you can provide only one or the other.
================================================================================
# Dig deeper into experimentation data with Experiment Results
URL: https://amplitude.com/docs/analytics/charts/experiment-results/experiment-results-dig-deeper
================================================================================
# Dig deeper into experimentation data with Experiment Results
Experiment Results lets you delve into the data your experiments collect. Experiment Results can incorporate data and information from non-Amplitude feature-flagging platforms and use that external data within Amplitude's native planning, tracking, and analysis tools. Amplitude incorporates this data into the A/B tracking data that Experiment generates.
## Before you begin
Before using Experiment Results, instrument the [metric events](https://amplitude.com/docs/feature-experiment/advanced-techniques/advanced-metric-use-cases) relevant to your experiment. Without metric events, you can't create the success metrics and goals that Experiment Results needs to compare each variant in its analysis.
Also instrument the necessary [exposure events](https://amplitude.com/docs/apis/experiment/experiment-management-api-experiments#exposureevent), which represent the delivery of a variant to a user participating in the experiment.
For more information, refer to the [Experiment Results FAQ](https://amplitude.com/docs/feature-experiment/analysis-view#common-questions).
## Analyze an A/B test using Experiment Results
##### To create an A/B test and view the results
1. Go to _Create > Chart > Experiment Results_.
2. In the Metrics module, click **Add Metric** or **Define single-use metric** to define your primary metric.
3. If adding a single-use metric, use the drop-down menu to specify the metric type. Choose one of:
- Unique conversions
- Event totals
- Sum of property value
- Average of property value
- Funnel conversion
- Formula
{% callout type="note" heading="" %}
Amplitude has deprecated the Retention metric. It's no longer available.
{% /callout %}
The first four are available for individual event metric analyses. Funnel conversion lets you define a multi-step journey that users must complete for the conversion to count. The Formula metric lets you [define a formula](https://amplitude.com/docs/analytics/charts/experiment-results/experiment-results-use-formula-metrics) centered around a selected event or events.
{% callout type="note" %}
You can use any of the above metrics as a [custom metric during the design phase in Amplitude Experiment](https://amplitude.com/docs/feature-experiment/workflow/define-goals).
{% /callout %}
4. Specify the event to use for this metric. You can also filter the event using a **Where** clause.
5. When you're done, click **Done**.
Optionally, click **Add Metric** or **Define single-use metric** in the Secondary Metrics module to add a second, subordinate metric to the analysis. Add multiple secondary metrics as needed.
6. Click **Add Event** in the Exposure module to define your experiment's exposure event. The exposure event is the event users must trigger to join the experiment.
7. In the Variants performed by module, click **Add Experiment Variant** to add your variants. All experiments require at least one variant, known as the control.
Choose the properties and values that define your variant and click **Apply**.
8. Click **Add Experiment Variant** to add more variants that reflect the experiment setup in your feature flagging system.
Amplitude calculates your statistical results as they become available and displays them in the Results area. The results let you modify your experiment's [statistical settings](https://amplitude.com/docs/feature-experiment/workflow/finalize-statistical-preferences), such as switching from the default Sequential test to a T-test.
## Interpret your results
The specifics vary based on the metric types you use. Four charts depict your results:
- **Confidence interval of absolute performance over time**: This chart applies to [sequential testing](https://help.amplitude.com/hc/en-us/articles/17767898439835) only. It helps you identify when the experiment reaches statistical significance, which occurs when the confidence interval no longer includes zero.
- [**Cumulative exposure**](https://amplitude.com/docs/feature-experiment/advanced-techniques/cumulative-exposure-change-slope): This chart shows the number of users who receive your experiment over time. The x-axis shows the first date of a user's exposure, and the y-axis shows a cumulative, running total of users exposed to the experiment.
- **Performance by variant**: The title of this chart is the metric you focus on. The chart shows the number of users who completed each step of a funnel, or the means of each variant if the metric isn't a funnel.
- **Mean over time** (cumulative or non-cumulative): The x-axis shows the date the user first saw the experiment. The y-axis shows the mean of the selected metric. Click the dropdown under the metric table to select a metric. Amplitude selects the recommendation metric by default for each variant. This chart works like the conversion over time chart, except it also handles non-conversion metrics. Use this chart to identify seasonality, novelty effects, or trends over time. Usually, the mean for days near the start of the experiment exceeds the mean for days near the end, because users at the start have had more time to perform the metric event. This concern lessens when you use the exposure attribution window. View the cumulative or non-cumulative version of this chart. The cumulative view smooths out daily noise and makes the chart easier to interpret.
These charts also help you [learn from your end-to-end experiment](https://amplitude.com/docs/feature-experiment/overview).
{% callout type="note" %}
By default, Amplitude selects the primary metric in experiment results. Choose a different metric in the _Analysis_ module. Click the dropdown in the metric table to view the results.
{% /callout %}
## Group By
For more resources on group by in experiments, refer to the [group by reference](https://amplitude.com/docs/analytics/charts/group-by) and the [experiment learnings guide](https://amplitude.com/docs/feature-experiment/workflow/experiment-learnings).
================================================================================
# Using formula metrics in Experiment Results
URL: https://amplitude.com/docs/analytics/charts/experiment-results/experiment-results-use-formula-metrics
================================================================================
# Using formula metrics in Experiment Results
In an Experiment Results chart, a formula metric gives you more flexibility when performing analyses. A formula metric consists of:
- At least one event.
- A mathematical operation that combines the events.
If you've used [custom formulas in Event Segmentation](https://amplitude.com/docs/analytics/charts/event-segmentation/event-segmentation-custom-formulas), this is familiar. If not, review that article before proceeding.
## Create a formula metric
##### To add a formula metric to your Experiment Results chart
1. In the Primary Metric module, click **Add Metric** and choose a formula from the Formula dropdown options.
2. Click **Define single-use metric**, then select _Formula_ from the Metric Type dropdown.
3. Click **Select event...** to start selecting events to include in your formula metric. Repeat this step until you've selected all the events you need.
4. In the Formula box, enter the formula for calculating your formula metric. Refer to the [list of supported formulas](#supported-formula-functions) or the [formula syntax explanation](#formula-syntax).
5. Add a name for this new formula metric and click **Apply**.
The metric appears in your Experiment Results chart.
You can also view this metric in the [object management center](https://amplitude.com/docs/data/object-management).
## Supported formula functions
Experiment Results supports the formula functions listed here:
### UNIQUES
**Syntax**: `UNIQUES(event)`
- **Event**: The event you want to analyze. This must be a letter corresponding to an event in the Events Module.
Returns the number of unique users who triggered the event.
### TOTALS
**Syntax**: `TOTALS(event)`
- **Event**: The event you want to analyze. This must be a letter corresponding to an event in the Events Module.
Returns the total number of times users triggered the event.
### PROPSUM
**Syntax**: `PROPSUM(event)`
- **Event**: The event you want to analyze. This must be a letter corresponding to an event in the Events Module.
This function only works when you group by a numerical property on the event. If you group by multiple properties, the formula runs the calculation with the first group-by clause.
Returns the sum of the property values that the specified event groups by.
### PROPAVG
**Syntax**: `PROPAVG(event)`
- **Event**: The event you want to analyze. This must be a letter corresponding to an event in the Events Module.
This function only works when you group by a numerical property on the event. If you group by multiple properties, the formula runs the calculation with the first group-by clause.
Returns the average of the property values you group by. This function is the same as `PROPSUM(event)/TOTALS(event)`. To learn more, refer to [how Amplitude calculates PROPAVG and PROPSUM](https://amplitude.com/docs/feature-experiment/under-the-hood/experiment-analysis-chart-calculation).
### PROPCOUNTAVG
**Syntax**: `PROPCOUNTAVG(event)`
- **Event**: The event you want to analyze. This must be a letter that corresponds to an event in the Events card. If you group by multiple properties, the formula runs the calculation with the first group-by clause.
Returns the average number of distinct values each user has for a specified property.
For example, suppose you want the average number of song genres your music app subscribers listen to. Each time a user plays a song, a Play Song or Video event triggers, and each played song captures a Genre_Type event property. Running `PROPCOUNTAVG` on Play Song or Video grouped by Genre_Type returns the average number of unique Genre_Type values for users who fire Play Song or Video.
{% callout type="note" heading="" %}
`PROPCOUNTAVG` supports only numeric event properties in Experiment.
{% /callout %}
### PROPMAX
**Syntax**: `PROPMAX(event)`
- **Event**: Returns the maximum value of the property you group the specified event by. The property must be numeric. If you group by multiple properties, the calculation uses the first group-by clause.
### PROPMIN
**Syntax**: `PROPMIN(event)`
- **Event**: Returns the minimum value of the property you group the specified event by. The property must be numeric. If you group by multiple properties, the calculation uses the first group-by clause.
### PROPCOUNT
**Syntax**: `PROPCOUNT(event)`
- **Event**: The event you want to analyze. This must be a letter that corresponds to an event in the Events card. If you group by multiple properties, the formula runs the calculation with the first group-by clause.
Returns the number of distinct property values for the property the event groups by. In this setup, the formula retrieves the number of different departments covering all the items for which users viewed details.
`PROPCOUNT` is an estimate of distinct property values. The estimate comes from a [HyperLogLog algorithm](https://en.wikipedia.org/wiki/HyperLogLog), and its accuracy depends on the amount of data it has to work with. Expect a relative error in the range of 0.1% for less than 12,000 unique values and up to 0.5% for more than 12,000 unique property values, depending on the cardinality of the property.
{% callout type="note" heading="" %}
`PROPCOUNT` supports only numeric event properties in Experiment.
{% /callout %}
A common metric in experiments is the number of distinct days someone performs an event. To compute this metric, use `PROPCOUNT` and specify an event property that's a number. For example, the `YYYYMMDD` format for a date. You might need to use a [derived property](https://amplitude.com/docs/data/derived-properties) to make sure you apply the `PROPCOUNT` to a number.
### REVENUETOTAL
**Syntax**: `$:REVENUETOTAL(event)`
- **Event**: The revenue event. This must be a letter that corresponds to an event in the Event card.
- This function only works when you group by a numerical property on the event.
Returns the aggregate sum of the property, formatted as a currency. It's the same as `PROPSUM(event)`. The `$:` prefix is optional. Its presence ensures the output format is a currency.
## Formula syntax
In your formulas, refer to events selected in the Events Module by their corresponding letter. The functions and parameters aren't case-sensitive. You can also perform the following arithmetic operations:
- Parenthesis ()
- Addition (+)
- Subtraction (-)
- Multiplication (\*)
- Division (/)
## Formula metric examples
Use these examples to create common business metrics for your experiments. Each example shows the formula syntax and what it measures.
### Total engagement score
Combines multiple engagement events into a single metric.
**Formula**: `TOTALS(A) + TOTALS(B) + TOTALS(C)`
**Example**: If event A is "Article Read", event B is "Comment Posted", and event C is "Article Shared", this formula sums all engagement actions.
### Average order value
Calculates the average value of orders or purchases.
**Formula**: `PROPAVG(A)`
**Example**: If event A is "Purchase Completed" grouped by a `order_value` property, this formula returns the average order value. This is equivalent to `PROPSUM(A) / TOTALS(A)`.
### Engagement ratio
Compares two types of engagement to understand user preferences.
**Formula**: `TOTALS(A) / TOTALS(B)`
**Example**: If event A is "Video Watched" and event B is "Article Read", this formula shows the ratio of video views to article reads.
## How Amplitude calculates experiment data for formula metrics
Before reviewing how Amplitude calculates formula metrics with experiment data, understand the [Experiment Analysis view](https://amplitude.com/docs/feature-experiment/analysis-view), which provides details for your experiment.
For formula metrics, Amplitude computes the results for each function independently to find the mean and variance of each one. Amplitude then applies the arithmetic operators to the results of these individual functions.
For example, suppose you define a formula metric as `TOTALS(A) + TOTALS(B)`. Amplitude calculates the variances and means of both components of this metric, as well as the covariance.
If you set X equal to TOTALS(A) and Y equal to TOTALS(B), the following statements hold:
- `V[X]` = Variance of X
- `E[X]` = Mean of X
- `V[Y]` = Variance of Y
- `E[Y]` = Mean of Y
- `Cov[X, Y]` = Covariance of X and Y, assumed to be zero for all mathematical operations.
- **Addition:**
Variance: `V[X + Y] = nV[X] + nV[Y]`
Mean: `E[X + Y] = E[X] + E[Y]`
- **Subtraction:**
Variance: `V[X - Y] = nV[X] + nV[Y]`
Mean: `E[X - Y] = E[X] - E[Y]`
- **Multiplication:**
Variance: `V[X * Y] = n^3 mu_y^2 sigma_x^2 + n^3 sigma_y^2 mu_x^2 + n^2 sigma_x^2 sigma_y^2`
Mean: `E[X * Y] = E[X] * E[Y]`
- **Division:**
Variance: {.inline}
Mean: `E[X / Y] = E[X] / E[Y]`
After you have the mean and variance of the formula metric, you can calculate the confidence interval chart and the p-values.
`Formula / Metric: TOTALS(A) / TOTALS(B)`
================================================================================
# Interpret your revenue analysis
URL: https://amplitude.com/docs/analytics/charts/revenue-ltv/revenue-ltv-interpret
================================================================================
# Interpret your revenue analysis
Remember that Revenue LTV is a monetization analysis focused on **new users only**. Forgetting this can lead to off-base interpretations of your data.
{% callout type="note" %}
This article assumes you've already reviewed [building a Revenue LTV chart in Amplitude](https://amplitude.com/docs/analytics/charts/revenue-ltv/revenue-ltv-track-new-user-monetization). If you haven't, read that before proceeding.
{% /callout %}
Suppose you selected a daily frequency breakdown in step 7 of [building your Revenue LTV chart](https://amplitude.com/docs/analytics/charts/revenue-ltv/revenue-ltv-track-new-user-monetization). The breakdown could be hourly, weekly, monthly, or quarterly, and the underlying logic would be the same. Also assume you're looking at a date range beginning December 5th and ending December 20th.
When calculating each data point, the Revenue LTV chart treats all users in each segment who were new users during your chosen timeframe as a **single cohort**.
For example, the total revenue shown on Day 1 is the total revenue collected from users who began using your product between December 5th and December 20th, by the 48th hour after their first Amplitude event. On Day 5, the same metric shows the total revenue collected from that cohort by the **144th hour after** their first active Amplitude event.
{% callout type="note" %}
Day 5 revenue covers total revenue across **six** days. Amplitude considers a user's Day Zero to be the first 24 hours after the user triggers their initial event. The math works out as (24 hours in a day) \* (six days) = 144 hours.
{% /callout %}
Because Amplitude treats all users as a single cohort, a user who has paid at any time in the past counts as a paying user **even** when looking at data points **before** their first payment.
For example, look at Day 10. If some users started using your product fewer than ten days ago, the Day 10 calculations exclude their data. This can cause **drops** in ARPU and ARPPU near the end of the timeframe, even though the metrics use cumulative revenue.
The breakdown table below the chart can show the data broken up by cohorts of users who started on the same day. Click the triangle next to _All Users_ to expand.
You can set up and interpret any Revenue LTV chart easily, because the user interface lets you read the parameters like a sentence. For example, the following chart shows a visualization of all revenue events fired by your users, measured by the average revenue per user daily in the last 30 days.
Hover over individual data points to see the actual amounts.
================================================================================
# The Revenue LTV chart: Track how well you're monetizing new users
URL: https://amplitude.com/docs/analytics/charts/revenue-ltv/revenue-ltv-track-new-user-monetization
================================================================================
# The Revenue LTV chart: Track how well you're monetizing new users
Successfully acquiring, engaging, and retaining new users doesn't help your company grow if you can't monetize them.
With Amplitude's **Revenue Long-Term Value (LTV)** chart, you can:
- See how well your organization monetizes new users, using common, relevant, easy-to-understand revenue metrics.
- Analyze new-user monetization with a time horizon of up to twelve months into the past.
- See how quickly and effectively segments of new users transition to paying users.
- Set benchmarks and goals for new-user monetization going forward.
## Before you begin
Events don't appear in any Amplitude charts until instrumentation is complete. Make sure you've completed instrumentation. Before you begin, refer to [building charts in Amplitude](https://amplitude.com/docs/get-started/helpful-definitions).
Review the [tracking revenue](https://amplitude.com/docs/data/sources/instrument-track-revenue) documentation to learn how to track revenue events. For example, if you use [Amplitude's SDKs](https://amplitude.com/docs/sdks/analytics), call `logRevenueV2()` with the provided revenue interface. If you track in-app purchases (IAPs), use Amplitude's revenue authentication system.
Review [Currency Conversion](https://amplitude.com/docs/data/currency-conversion) for information about how to aggregate and display original and converted currency options.
{% callout type="tip" heading="" %}
Amplitude recommends that you enable both the `amplitude.Revenue()` and [product array](https://amplitude.com/docs/analytics/charts/cart-analysis) tracking methods to get the most information possible.
{% /callout %}
## Set up a Revenue LTV chart
Like most Amplitude charts, the Revenue LTV chart has an Events Module. Use `[Amplitude] Any Revenue Event` here. This lets you analyze the data Amplitude's SDK sends when it logs revenue events.
You can also calculate revenue based on other events. To segment on the event itself, add properties to it in the Events Module.
To build a Revenue LTV chart, follow these steps:
1. Select your revenue event and the event property that contains the revenue information, if one exists. If you use `[Amplitude] Any Revenue Event`, select `$revenue`. If you use your own custom revenue event, select your own custom revenue property.
{% callout type="note" %}
You don't have to use a revenue property here. It's the most common use case of the Revenue LTV chart.
{% /callout %}
1. Add properties to the revenue event by clicking _+ Filter_, selecting the property name, and specifying the property value you want. Add as many properties as you want, one at a time.
{% callout type="note" %}
You must send these properties **explicitly** through Amplitude's SDKs when you log revenue events.
{% /callout %}
If you use `[Amplitude] Any Revenue Event`, filter on one of five event properties, all prefixed with a `$`:
* `$price`: The price of the products purchased.
* `$productId`: A product-specific identifier for each item purchased.
* `$quantity`: The quantity of products purchased.
* `$revenueType`: The revenue category. Common values include income, tax, and refund.
* `$eventProperties`: An object of event properties to include in the revenue event.
2. In the Segmentation Module, identify the user segment to include in this analysis. Click _Saved Segments_ to import a segment you've saved. Otherwise, Amplitude assumes the analysis targets all users.
3. To build your own segment instead of importing a saved one, add properties. Click _+ where_, choose the property you want to include, and specify the property value you want.
4. To narrow your focus, include only users who have already performed certain actions. Click _+ perform_, then choose the event you want.
5. To add another user segment, click _+ Add Segment_ and repeat steps 3 and 4.
6. Choose the measure for this analysis.
- **Total Revenue**: The total revenue received during the timeframe of your analysis. Specifically, it's the sum of all total revenue from all new users, starting the day they sent their first Amplitude event. Break this out on an hourly, daily, weekly, monthly, or quarterly frequency.
- **New Paying Users**: The number of users who triggered a revenue event for the first time during the specified hour, day, week, or month after their cohort's start date.
- **ARPU**: Short for average revenue per user. A new user cohort's **cumulative** total revenue as of the hour, day, week, or month you're looking at, divided by the number of users in the cohort.
- **ARPPU**: The same as ARPU, except it considers **paying users only**. A paying user is a user who has ever triggered a revenue event, even if their first revenue event occurs **after** the specific data point you're looking at. For example, if a user first purchases something on the fifth day after they began using your product, that user counts as a paying user when calculating ARPU over their first four days.
{% callout type="note" %}
Each of these metrics only looks at users who were **new to Amplitude** during the timeframe of your analysis. Users don't need to have triggered a revenue event to count, except for ARPPU.
{% /callout %}
7. Use the date picker to set the frequency breakdown and timeframe of your analysis.
## Next steps
Next, learn how to [interpret your revenue analysis](https://amplitude.com/docs/analytics/charts/revenue-ltv/revenue-ltv-interpret).
================================================================================
# The Compass chart: discover your users' 'a-ha' moments
URL: https://amplitude.com/docs/analytics/charts/compass/compass-aha-moment
================================================================================
# The Compass chart: discover your users' 'a-ha' moments
A key step in driving growth is discovering your users' "a-ha" moments. An "a-ha" moment happens when a **new user** makes the decision, consciously or unconsciously, to become an **active user** of your product.
The most famous example comes from Facebook. Facebook discovered that users who added at least seven friends in the first ten days almost always stuck around. Users who didn't almost always churned. This insight helped Facebook drive retention by encouraging the right user behavior: adding friends.
The Compass chart helps you achieve the same outcome. A Compass analysis scans your user data and identifies these behaviors, giving you the insights you need to improve your product and drive sustainable growth.
## Before you begin
Events don't appear in any Amplitude charts until instrumentation is complete, so finish that work first. Refer to the article on [building charts in Amplitude](https://amplitude.com/docs/get-started/helpful-definitions).
## Set up a Compass chart
The Compass chart works differently than most other Amplitude charts. There's no _Event_ module, no _Segmentation_ module, and no _Measured As_ module.
When you first open a Compass chart, you see a heat map view that shows the likelihood of retaining new users into their second week, based on the events they trigger and when they trigger them. In this example, users who start a session on their first day are less likely to retain. This happens because **all** new users start a session on their first day. They have to start a session to become a new user, and since they haven't yet had a chance to interact with your product beyond that, the event isn't especially predictive.
If those users also search for a song or video on that first day, they're much more likely to retain into the second week. The correlation rates between triggering those events on day 1 and sticking around for another week are 0.40 for starting a session and 0.72 for searching for a song. Refer to the [article on interpreting your Compass chart](https://amplitude.com/docs/analytics/charts/compass/compass-interpret-1) for more on correlation.
To build a Compass chart, follow these steps:
1. In the left-side module, select the user cohort you're interested in from the _For users in the following cohort_ dropdown. This is your **base cohort**. Amplitude populates this list with the cohorts you've already created. If this is your first cohort, you can only select _New Users_.
2. From the _... how does performing_ dropdown, select an event you'd like to know more about.
3. To add properties to your event, click _+ where_, select the property name, and specify the property value you want. You can add multiple properties to your event.
4. Next, take one of the following steps:
- Set the **range of first use**. Tell Amplitude that the new user must have triggered your event within a set number of days after first using your product. The default is seven days.
- Tell Amplitude you want to **group your results** by a particular property by clicking _+ group by_. Amplitude generates a report explaining how different values of that property affect the correlation between your base cohort and your target cohort.
5. From the ..._predict they will be in the following cohort_ dropdown, select the **target cohort** you want. Amplitude draws from the list of cohorts you've already created. You can also select from a handful of **pre-set, out-of-the-box cohorts**:
- [Amplitude] 2nd Week Retention.
- [Amplitude] 3rd Week Retention.
- [Amplitude] 4th Week Retention.
- [Amplitude] 2nd Month Retention.
These cohorts include users who were new during the timeframe of your analysis and who fired an active event in the week (or month) listed after they were new.
6. Set the date range of your analysis with the date picker.
Make this time range long enough to generate a good sample size, and far enough in the past to ensure that all users in your sample have had an opportunity to retain. For example, if you're looking at '[Amplitude] 2nd Week Retention' as your target cohort, make sure the new users in your base cohort have been new for longer than two weeks.
## Add your Compass report to a dashboard
To add your Compass report to a dashboard, follow these steps:
1. If you haven't done so already, save your chart by clicking _Save_.
2. Click _+ Add to_. From the dropdown, select the dashboard you want to add the report to, or select _Create a new dashboard_.
After you create a Compass chart, find out what it all means. Refer to the [Help Center article on interpreting your Compass chart](https://amplitude.com/docs/analytics/charts/compass/compass-interpret-1).
================================================================================
# Find your company's inflection metrics with Compass
URL: https://amplitude.com/docs/analytics/charts/compass/compass-find-inflection-metrics
================================================================================
# Find your company's inflection metrics with Compass
[Compass](https://amplitude.com/docs/analytics/charts/compass/compass-aha-moment) helps you identify behaviors that predict retention or conversion. Compass identifies **inflection metrics**, which capture the moments when a user reaches a critical threshold in your product. These metrics help drive user growth.
For example, Facebook found early on that adding seven friends in the first ten days was the strongest signal of long-term retention. More recently, Netflix published an analysis of how many episodes per TV show it takes for a viewer to get hooked.
Before you proceed, Amplitude suggests you [read the Help Center documentation on Compass first](https://amplitude.com/docs/analytics/charts/compass/compass-aha-moment). The rest of this article assumes a general understanding of how the analysis works.
For ease of reading, Amplitude uses the new user/retention use case as the example. You can replace new user with any base cohort, and replace retained user with any target cohort.
To find an inflection metric, first decide your target cohort. The inflection metric often centers on encouraging new users to become retained users. In the examples in this article, the base cohort is new users and the target cohort contains retained users.
A **base cohort** is the initial set of users you're analyzing (for example, new users or logged-in users). A **target cohort** is a set of users that have completed a targeted action (for example, retention or conversion).
This is a common use case, and it's the default setup for Compass charts. You can edit your chart so that it reflects your specific analytic needs.
When looking for an inflection metric, remember that it isn't absolute. It doesn't mean a user converts at that exact point. Instead, it suggests the type of behavior you want your organization (for example, the product and marketing team) to encourage in your users.
## Get started with Compass
The best way to begin using Compass is to ask yourself which events might be good predictors of retention. After you select an event to analyze, start thinking about correlations that might reveal something interesting about user behavior.
## Proportion above threshold
The **proportion above threshold** tells you how many new users triggered the event in their first _N_ days. This matters because the sample of users meeting the threshold must be large enough for Compass to understand how well the event correlates with retention.
One way to change the proportion is to increase the number of performance days in the window (Amplitude allows between one and seven days). More performance days give users more time to reach the threshold, which increases the proportion. If you're investigating an event property, consider looking at the complete event, which may have a higher proportion above the threshold.
There's no perfect proportion above the threshold. Too low and you can't get many new users to perform that event; too high and you don't have any room for improvement.
In some extreme cases, a low proportion above the threshold can still produce a high correlation. For example, a web application that has high traffic but forces login for all new users.
This metric matters because it accounts for the balance you need to find your inflection metric. Returning to the Facebook example, getting a new user to add one friend isn't a great choice for an inflection metric, because most users do that already. But getting a new user to add 100 friends, while highly correlated with retention, is hard because few users actually reach that level.
## True positive ratios: PPV and sensitivity
If you have a reasonable proportion above the threshold, view the correlation between reaching the event frequency and retention. Look at the **positive predictive value** **(PPV)** and **sensitivity**.
PPV looks at the ratio of users who reached the event frequency and retained (**true positive**) to all users who reached the event frequency (**true positive + false positive**). Sensitivity looks at the ratio of users that retained and reached the event frequency (true positive) to all users retained (true positive + false negative). You want both to be high.
For more information about true positives, false positives, and other values in a contingency matrix, refer to [Confusion matrix](https://en.wikipedia.org/wiki/Confusion_matrix) on Wikipedia.
| **Event frequency** | **Retained** | **Not retained** |
| ------------------- | -------------- | ---------------- |
| ≥ n Times | True positive | False positive |
| < n Times | False negative | True negative |
### Example 1: High PPV, low sensitivity
Imagine PPV is high but sensitivity is low. The event **predicts** retention, but few new users reach the threshold. The event is a promising candidate for experimentation to see if you can encourage more users to trigger it. The result also means another inflection metric might exist that you haven't looked at yet, since people who aren't reaching this frequency are still retained.
| **Event Frequency** | **Retained** | **Not Retained** |
| ------------------- | ------------ | ---------------- |
| ≥ 5 Times | 10 | 1 |
| < 5 Times | 100 | 10 |
### Example 2: Low PPV, high sensitivity
The event frequency captures many of the retained users, but the total retention for the product is likely low. This **isn't a good candidate** for an inflection metric, because either the product's retention is low or a high percentage of users meeting the event frequency aren't retained.
| **Event Frequency** | **Retained** | **Not Retained** |
| ------------------- | ------------ | ---------------- |
| ≥ 5 Times | 10 | 100 |
| < 5 Times | 1 | 10 |
## True negative ratios: NPV and specificity
The inflection moment should be a positive predictor. You also want to ensure that when a user **fails** to reach the threshold, the failure is a **negative** predictor of retention, in other words, churn. Amplitude captures this through the **negative predictive value** **(NPV)** and **specificity**.
NPV looks at the ratio of users who didn't reach the event frequency and didn't retain (true negative) to all users who didn't reach the event frequency (true negative + false negative).
Specificity looks at the ratio of users who didn't reach the event frequency and didn't retain (true negative) to all users who didn't retain (true negative + false positive). As in the examples above, you want to maximize both of these values.
{% callout type="tip" heading="" %}
There's an edge case where a high NPV and high specificity can lead to a strong correlation that's inappropriate for use as an inflection metric. This occurs when a very high proportion of users fall into the true negative bucket and the proportion above the threshold is very low. For example, a website where a small proportion of users log in, but logging in blocks every other event from occurring. In this case, most events have a high correlation with retention because most users don't trigger any events. To prevent this, change the base cohort to better reflect an actual user (for example, someone who logs in).
{% /callout %}
### Example 3: High NPV, low specificity
In this example, one of two things is likely happening. Either the PPV is also low (as in Example 2), or the proportion above the threshold is so high that there's no room for improvement by encouraging this action. Neither makes a great inflection metric.
| **Event Frequency** | **Retained** | **Not Retained** |
| ------------------- | ------------ | ---------------- |
| ≥ 5 Times | 1000 | 100 |
| < 5 Times | 1 | 10 |
### Example 4: Low NPV, high specificity
Here, either the sensitivity is also low (as in Example 1), or the retention is so high that few users remain to convert, which is a good problem to have.
| **Event Frequency** | **Retained** | **Not Retained** |
| ------------------- | ------------ | ---------------- |
| ≥ 5 Times | 1000 | 1 |
| < 5 Times | 100 | 10 |
The Compass analysis tries to uncover event frequencies that maximize the upper-left (true positive) and bottom-right (true negative) quadrants of the contingency matrix. If you're familiar with statistics, this minimizes the [Type I and Type II errors](https://en.wikipedia.org/wiki/Type_I_and_type_II_errors).
These inflection metrics balance all five of the detailed statistics in the contingency matrix. Depending on the type of product, a good correlation falls in the range of 0.2 to 0.4, depending on the number of performance days (1 to 7) for the event.
Check that the sample size is large enough to draw conclusions. There's no magic number, since it depends on your total user volume, but you can see the effect of sample size by clicking the blue +- number (the 95% confidence interval) next to the correlation. Change the date range to increase the sample size. You can use up to 90 days of data.
Compass exposes **correlations** from your data, which are hypotheses you can test by making changes to your product or lifecycle marketing. The only way to prove a causal relationship is to run an A/B or split test to isolate those changes. Read more about how you can [analyze A/B test results on Amplitude](https://help.amplitude.com/hc/en-us/articles/115001580108).
================================================================================
# Interpret your Compass chart, part 1
URL: https://amplitude.com/docs/analytics/charts/compass/compass-interpret-1
================================================================================
# Interpret your Compass chart, part 1
Amplitude's **Compass** chart shows how a new user firing an event correlates with that user retaining. Understanding which user events lead to retention is critical to driving sustainable product growth.
## Before you begin
Refer to the article about [building a Compass chart](https://amplitude.com/docs/analytics/charts/compass/compass-aha-moment) before you start to interpret one.
## How to read your Compass chart
When you first launch a Compass chart, you might have a specific hypothesis about which events are likely to drive retention. Even if you don't, Compass can help you develop one.
In the previous article, you saw how Compass generates a heat map of user events and correlations by default when you select _Any Event_.
This is a quick summary of the events most correlated with members of a base cohort converting to a target cohort. It's a good place to start if you don't have much data yet.
You can sort the table in ascending or descending correlation for a given day by clicking the day labels across the top. Clicking a specific cell displays a popup with more detailed information about the event/day combination you selected.
This summary report is useful for looking at your data from a bird's-eye view, for example, identifying events that should rank at the top but don't.
After you choose an event to focus on, Compass replaces the heat map view with a more detailed breakdown.
As an example, look at how triggering the event `Social Action: Add Friends` within the first seven days of becoming a new user correlates with second-week retention. The following sections walk through the different components of the reports Compass generates.
On the left, you see the **correlation scores** of that event, sorted by the frequency with which your users have triggered it. By default, the report shows you the frequency with the highest correlation. Users who triggered `Social Action: Add Friends` at least once had the highest correlation score, and are most likely to have ended up in the second-week retention cohort. The correlation between triggering `Social Action: Add Friends` and second-week retention is weak.
{% callout type="note" %}
Correlation and causation aren't the same thing. A high correlation score may suggest a causal relationship between two events, but it can also mean that each of those events is highly correlated with another, as-yet-unidentified event.
{% /callout %}
Click any of the buckets to view a detailed breakdown of that event/frequency combination, particularly when looking at smaller numbers of initial days for each user.
Amplitude categorizes correlation scores like this:
- **Highly Predictive**: correlation >= 0.4.
- **Moderately Predictive**: 0.3 <= correlation < 0.4.
- **Slightly Predictive**: 0.2 <= correlation < 0.3.
- **Not Predictive**: correlation < 0.2.
### Choose a different metric
Compass defaults to showing correlation scores. You can select a different metric if it better suits the needs of your analysis. Select the metric you want from the _Correlation_ dropdown menu, such as [Positive Predictive Value](https://amplitude.com/docs/analytics/charts/compass/compass-find-inflection-metrics).
## View statistical significance
Compass lets you toggle the 95% confidence interval of the correlation on and off. Click the blue numerical text on the right side of the table to display the interval on the left-side bar chart.
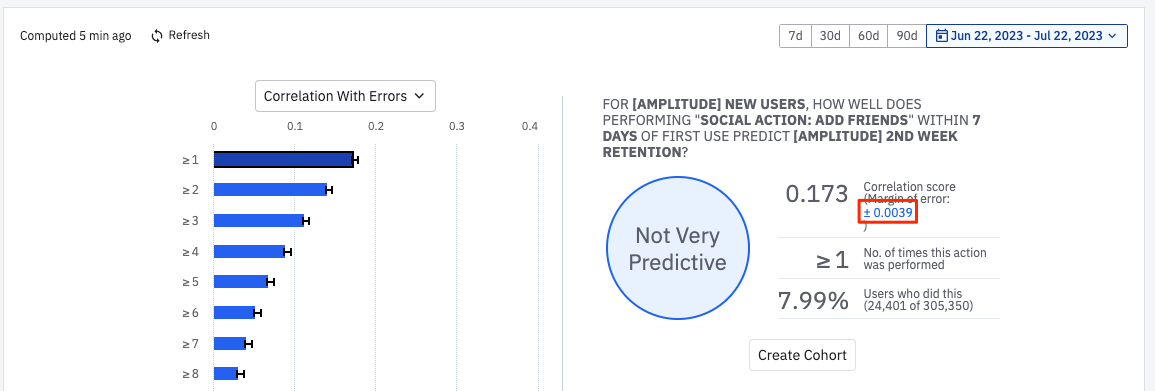
[Read on to learn more about how correlation is used in Compass, and how to create a cohort from your results](https://amplitude.com/docs/analytics/charts/compass/compass-interpret-2).
================================================================================
# Interpret your Compass chart, part 2: Correlation and cohorts
URL: https://amplitude.com/docs/analytics/charts/compass/compass-interpret-2
================================================================================
# Interpret your Compass chart, part 2: Correlation and cohorts
This article explains correlation and how it applies to your Compass chart, and how to create a cohort from its results. Refer to [Interpret your Compass chart, part 1](https://amplitude.com/docs/analytics/charts/compass/compass-interpret-1) for a breakdown of how to read and interpret a Compass chart.
## Understanding correlation
Correlation measures how two statistical variables relate to each other. Possible values range from -1 to 1. A score of zero indicates no statistical relationship between the variables. A score of 1 indicates perfect positive correlation; a score of -1 indicates perfect negative correlation.
Amplitude categorizes correlation scores like this:
- **Highly Predictive**: `|correlation| >= 0.4`.
- **Moderately Predictive**: `0.3 <= |correlation| < 0.4`.
- **Slightly Predictive**: `0.2 <= |correlation| < 0.3`.
- **Not Predictive**: `|correlation| < 0.2`.
In a Compass chart, the two variables to correlate are:
- Whether the user triggered the event in question at least a certain number of times.
- Whether the user was retained in the target cohort.
You may have heard of different variations and definitions of correlation. Well-known examples include Matthews correlation, Pearson correlation, phi coefficient, and R-value. In this case, all these methods generate equivalent results, because Compass looks at pairs of binary random variables.
Correlation isn't causation, so test and verify any hypotheses you form from a Compass analysis.
{% callout type="note" %}
Use [Amplitude Experiment](https://amplitude.com/docs/feature-experiment/overview) to determine causality.
{% /callout %}
### Why correlation is a good metric to use here
When you're looking for the metric that captures your users' "a-ha" moment, you want one where most users above a certain threshold go on to be retained, and most users below the threshold aren't retained. Such a metric has a threshold with a good [positive predictive value (PPV)](https://amplitude.com/docs/analytics/charts/compass/compass-find-inflection-metrics).
You also have to consider how easy it will be to move users across that threshold. If you find a threshold with a strong PPV and NPV but moving users across it proves difficult, that metric won't help much in growing your user base. A tell-tale sign is when few of your users have crossed the threshold or almost all of them have already crossed it. This isn't always the case, but in the absence of more specific information, it's generally a good assumption.
Compass uses correlation to locate these thresholds because correlation accounts for PPV, NPV, and the proportion above the threshold. If the PPV is higher, the NPV is higher, or the fraction of users above the threshold is closer to 50%, then the correlation is also higher. If the PPV is lower, the NPV is lower, or the fraction of users above the threshold is further from 50%, then the correlation is lower.
{% callout type="note" %}
This becomes less clear-cut for negative correlations, but you typically don't look at negative correlations when using Compass.
{% /callout %}
## Create a cohort from your results
You can create a cohort from your results by clicking _Create Cohort_. Amplitude automatically compares the cohort's retention to new user retention.
This comparison is based on `Any Active Event`, not `Any Event`.
Clicking _Show_ (next to _Correlation Table_) brings up a detailed [contingency table](https://amplitude.com/docs/analytics/charts/compass/compass-find-inflection-metrics) that shows the count of users in your base cohort in each of four categories: true positives, false positives, false negatives, and true negatives.
You can also see detailed statistics on your cohort by clicking _Show_ (next to _Detailed Statistics_).
Read more about these statistics in [Find your company's inflection metrics with Compass](https://amplitude.com/docs/analytics/charts/compass/compass-find-inflection-metrics).
Next, refer to the Help Center article on how to use [Compass to identify the moments in the user journey that are critical to driving growth](https://amplitude.com/docs/analytics/charts/compass/compass-find-inflection-metrics).
================================================================================
# Stickiness: Identify the features that drive users back to your product
URL: https://amplitude.com/docs/analytics/charts/stickiness/stickiness-identify-features
================================================================================
# Stickiness: Identify the features that drive users back to your product
To get the most from your product analytics, you need to understand what drives engagement and retention. What is it about your product that makes it so appealing to your most engaged users, and what's causing other users to fall short?
Amplitude's **Stickiness** chart helps you answer these questions by showing you how often users fire specific events over a given time period. You can segment your power users and include them in a stickiness analysis to uncover what they're doing differently. Use this information to redirect the product interactions of your regular users.
## Before you begin
Events don't appear in Amplitude charts until instrumentation is complete, so finish that work first.
## Create a Stickiness chart
A Stickiness chart shows how often your users fire specific events. Tell Amplitude what event you want and which users to include in the analysis.
To build a Stickiness analysis, follow these steps:
1. To open a new Stickiness chart, click _Create > Chart > View additional chart types_, then select _Stickiness_ from the list of available charts.
2. In the Events Module, select the event you want. Choose a specific event that's instrumented in Amplitude, or tell Amplitude to consider any event for this analysis by selecting _Any Event_ from the list of available events.
3. To add properties to your starting event, click _+ where_, select the property name, and specify the property value you want.
{% callout type="note" %}
Unlike other Amplitude charts, Stickiness charts support analysis of one event.
{% /callout %}
1. In the Segmentation Module, identify the user segment to include in this analysis. You can import a saved segment by clicking _Saved Segments_ and selecting the one you want from the list. Otherwise, Amplitude assumes your analysis targets all users.
2. If you don't want to import a saved user segment, you can build your own by adding properties. Click _+ where_, choose the property to include, and specify the property value you want.
3. You can narrow your focus further by including only users who have performed certain actions. Click _+ perform_, then choose the event you want.
4. To add another user segment, click _+ Add Segment_ and repeat steps 5 and 6.
5. Choose the time zone, frequency (weekly or monthly), and time frame your analysis covers. Find the date picker in the top-right corner of the chart area.
{% callout type="note" %}
You can break out your starting event by user properties by clicking _… grouped by_ in the Segmentation Module. For example, to group users by the cities they were in when they fired the starting event, select _City_ from the property list. Amplitude breaks out the segmentation analysis on a city-by-city basis. You can only include one user segment in your analysis.
{% /callout %}
In the chart area, you should now see your Stickiness chart, along with a tabular view of your results. To learn how to interpret your stickiness analysis, refer to the [Help Center article](https://amplitude.com/docs/analytics/charts/stickiness/stickiness-interpret).
================================================================================
# Interpret your stickiness analysis
URL: https://amplitude.com/docs/analytics/charts/stickiness/stickiness-interpret
================================================================================
# Interpret your stickiness analysis
Stickiness helps you dig into the details of your product's user engagement, specifically users that have formed product usage habits.
This article explains the _Metrics_ Module of the Stickiness chart and helps you interpret your stickiness analysis.
## Before you begin
If you haven't already, read [building a Stickiness chart in Amplitude](https://amplitude.com/docs/analytics/charts/stickiness/stickiness-identify-features).
## Interpret your Stickiness chart
In Amplitude, you can measure stickiness in one of two ways: **cumulatively** or **non-cumulatively**. You can change this setting at the top of the Metrics Module at any time during your analysis.
### Non-cumulative stickiness
The non-cumulative Stickiness chart shows the percentage of users who triggered the event at least one time on the **exact number of days** listed on the X axis. For example, users in the _2 days_ bucket triggered the event on **exactly two days** over the course of a week (or month) in the time frame of your analysis. Users in the _3 days_ bucket triggered the event on **exactly three days** in a week.
{% callout type="note" %}
A user can appear in more than one bucket of a non-cumulative stickiness analysis for each week (or month) in the time frame. For example, they might trigger the event on one day in week one, then three times in week two. This user appears in both the one-day and three-day buckets.
{% /callout %}
### Cumulative stickiness
The cumulative Stickiness chart shows the percentage of users who triggered the event one or more times on **at least the number of days** listed on the X axis. For example, users in the _2 days_ bucket triggered the event on **two or more** days over the course of a week (or month) in the time frame of your analysis. Users in the _3 days_ bucket triggered the event on **three or more** days in a week.
You can also click a specific data point to inspect the users included in that point. Refer to the [Microscope](https://amplitude.com/docs/analytics/microscope) article for more information.
### Breakdown data table
The table shows a detailed breakdown of the data by each user cohort and more granular daily buckets. Days with incomplete data have an asterisk.
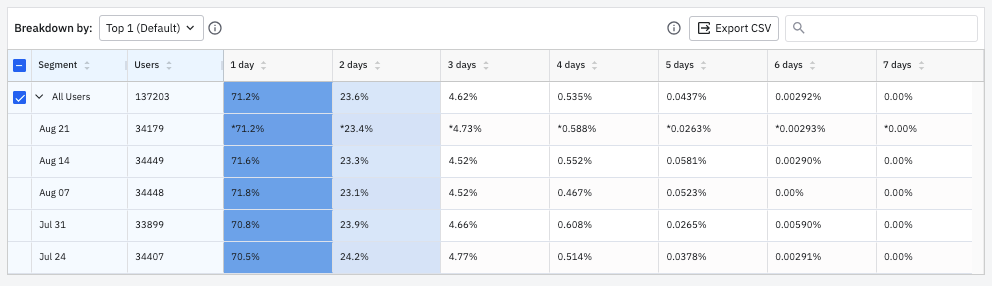
## Track changes in stickiness over time
You can discover how the stickiness of your most engaged users fluctuates over time by selecting _Change Over Time_ from the _..shown as_ dropdown menu.
## Create a cohort from your Stickiness chart
Users on Scholarship, Growth, and Enterprise plans can create a [cohort](https://amplitude.com/docs/analytics/microscope).
================================================================================
# The Personas chart: Find your product's user personas
URL: https://amplitude.com/docs/analytics/charts/personas/personas-clustering
================================================================================
# The Personas chart: Find your product's user personas
Amplitude's **Personas** chart groups your users into **clusters** based on similarities in their event behavior. Amplitude places users who behave the same way into the same cluster. It's similar to a behavioral cohort, except no explicit, pre-specified rule defines a cluster.
The Personas chart rewards experimentation. Use it to do exploratory data mining analyses of how your user base navigates your product. It surfaces similarities between user cohorts you might not have thought to look for. It also guides you through creating a comprehensive set of user personas for your product, which you can use to drive engagement and retention.
## Before you begin
Events don't appear in Amplitude charts until instrumentation is complete, so finish that first. Read the article on [building charts in Amplitude](https://amplitude.com/docs/get-started/helpful-definitions).
## Personas differs from other Amplitude charts
If you're already familiar with Amplitude, the first thing to notice about the Personas chart is that it doesn't work like other Amplitude charts. There's no Event Module and no Segmentation Module. There's also no Measured As Module, because the Personas chart doesn't rely on metrics the way other Amplitude charts do.
Instead, there's the Cluster Generation Module, the Cluster Count Module, and the Target Cohort Module.
{% callout type="note" %}
Refer to the FAQ article on [how Amplitude calculates clusters](https://help.amplitude.com/hc/en-us/articles/360053937572).
{% /callout %}
## Set up a Personas chart
To build a Personas chart, follow these steps.
1. In the Cluster Generation Module, choose the user cohort to analyze. Amplitude populates this dropdown list with the user cohorts you've already created. If you haven't created any user cohorts yet, you can only choose _Active Users_ or _New Users_.
When analyzing new users, Amplitude only considers events triggered during their first day as a new user.
2. To limit your analysis to a segment of this cohort, filter users based on user properties. Click _+ where_, choose the property to use as a filter, and specify the property value you're interested in.
3. To narrow the focus further to users who already performed certain actions, click _+ perform_, then choose the event you're interested in.
4. In the Cluster Count Module, choose the number of clusters from the _...into a total of_ dropdown.
{% callout type="note" %}
Each analysis is different, and there's no one-size-fits-all answer for how many clusters to select. With too few clusters, the differences between them might not generate meaningful insights. With too many, Amplitude might create invalid or spurious clusters because it can't find that many distinct user personas. Try different cluster counts until you get a result that seems useful.
{% /callout %}
5. In the Target Cohort Module, choose your target cohort from the dropdown. Amplitude draws from the list of cohorts you've already created. You can also select from a handful of **pre-set, out-of-the-box cohorts**:
- [Amplitude] 2nd Week Retention
- [Amplitude] 3rd Week Retention
- [Amplitude] 4th Week Retention
- [Amplitude] 2nd Month Retention
The definitions of these cohorts depend on whether you're looking at new users or active users (including cohorts you created yourself). New users fall into these cohorts if they were new during the time frame of your analysis and triggered an active event in the listed week (or month) after they were new.
Active users fall into these cohorts if they triggered an active event during the time frame of the analysis, and then another one in the specified week (or month) following that initial event.
6. Use the date picker to specify the timezone and set the timeframe for your analysis. Your analysis can span a maximum of 30 days.
Read on to [learn how to interpret your Personas chart](https://amplitude.com/docs/analytics/charts/personas/personas-interpret).
================================================================================
# Interpret your Personas chart
URL: https://amplitude.com/docs/analytics/charts/personas/personas-interpret
================================================================================
# Interpret your Personas chart
The [Personas chart](https://amplitude.com/docs/analytics/charts/personas/personas-clustering) helps you identify and name user clusters, which you can use to drive engagement and retention.
## Interpret your cluster cards
The first section of a Personas report is the **cluster cards**. The example below shows a Personas report with three clusters.
Each card includes:
- A small bubble chart, where the size of a cluster's bubble represents the proportion of users in the cluster.
- The count of users in the cluster, plus the cluster's size relative to all other clusters (expressed as a percentile).
- The percentage of users in the cluster who are also in the target cohort.
- An editable description field. Amplitude recommends describing your clusters.
- The option to export the cluster as a behavioral cohort.
## Identify and name your user personas
The cluster cards offer an overview, but the real details are in the **event table** below them. The table reveals the similar behaviors that hold each cluster together, which serve as the basis for their user personas.
The table displays a list of events with two metrics for each cluster:
- Average # of Events: The average number of times users in cluster _N_ triggered a specific event.
- Standard Deviation (σ): The standard deviation from the mean of the event. Amplitude rounds standard deviation numbers to the nearest decimal point (for example, -0.01 rounds to -0.0).
The table has two halves. The top half contains events users in your selected cluster triggered **more** frequently than average. The bottom half contains events those users triggered **less** frequently than average. To sort these tables by any cluster, click the cluster you're interested in.
When you choose a new cluster to sort the table by, the event lists change too. Each cluster should exhibit a different pattern of behavior in your product, so they fire events at different rates.
The event table helps you answer: "Did I select enough clusters to group my users into different personas?" If the answer is no, try different cluster quantities. If yes, give your clusters appropriate descriptions and save your report.
### Hide events
To track events without visualizing them in your Personas reports, [hide them](https://amplitude.com/docs/data/remove-invalid-data) in your tracking plan. Amplitude clusters over the top 100 events. If you mark one of those events as hidden, it no longer counts in the calculation.
================================================================================
# Personas FAQ
URL: https://amplitude.com/docs/analytics/charts/personas/faq
================================================================================
# Personas FAQ
## Common questions
This page answers common questions about the [Personas chart](https://amplitude.com/docs/analytics/charts/personas/personas-clustering).
### How does the Personas chart calculate clusters?
Amplitude previously relied on the [K-Means](https://en.wikipedia.org/wiki/K-means_clustering) algorithm to generate clusters for the Personas charts. This approach has two important limitations:
- It doesn't handle outliers well, so behaviors with large frequency ranges could skew the clusters toward representing unusual patterns of engagement. As a result, the clusters could fail to capture the nuance in more typical rates of behavior.
- It doesn't handle "high-dimensional" data well, so when customers have many different event types, the clusters could fail to represent groups of users who were truly similar in behavior.
For these reasons, Amplitude explored how to better use clustering to help customers identify meaningful patterns of user behavior in their data. Through that work, Amplitude replaced K-Means with [Non-Negative Matrix Factorization](https://en.wikipedia.org/wiki/Non-negative_matrix_factorization).
### What is Non-Negative Matrix Factorization (NMF)?
Amplitude uses NMF to calculate clusters. Given a data set, clustering algorithms look for ways to partition the set that maximize similarity within each partition while minimizing similarity between different partitions.
To escape the curse of high-dimensionality in the original "event space," NMF explicitly carries out a mathematical [dimension-reduction](https://en.wikipedia.org/wiki/Dimensionality_reduction) to arrive at a more comprehensible "behavior space." The method also reduces outlier effects by weighing events based on their frequencies and by normalizing each user's event counts. Once projected to the simpler behavior space, users similar along certain behavioral dimensions cluster together easily.
The number of dimensions in the behavior space matches the number of clusters specified. Because of this built-in connection, NMF clusters tend to be hierarchical.
To learn more about how NMF works, refer to the [NMF clustering paper](https://arxiv.org/pdf/1507.03194.pdf).
================================================================================
# Interpret your Impact Analysis chart
URL: https://amplitude.com/docs/analytics/charts/impact-analysis/impact-analysis-interpret
================================================================================
# Interpret your Impact Analysis chart
The [Impact Analysis chart](https://amplitude.com/docs/analytics/charts/impact-analysis/impact-analysis-track) helps you discover how triggering one event affects the frequency at which your users fire other events.
## Interpret the results of your Impact Analysis chart
The Impact Analysis chart plots the outcome event on a relative _n_-day basis, starting from the first time each user triggered the treatment event. Amplitude aligns each user's relative timeline so you can see the pattern. The center line represents the day or week users first triggered the event.
### Choose your metric
Amplitude offers four metrics for the Impact Analysis chart: **average**, **active percentage**, **frequency**, and **properties**.
#### Average
When you use Average, the chart's Y axis shows the mean number of times users triggered the outcome event in each n-relative-day or n-relative-week interval. Amplitude counts only users who **triggered the event at least once**. Hover over each data point to see how many users triggered the outcome event at least once in each interval.
#### Active %
The Y axis shows the percentage of people who triggered the outcome event at least once in each n-relative-day or n-relative-week interval. Amplitude includes users who **triggered any active event** in that interval. Hover over each data point to see how many users triggered the outcome event at least once in each interval.
In the example below, 160,836 users were active the day after favoriting a song for the first time, and 85.1% played a song or video.
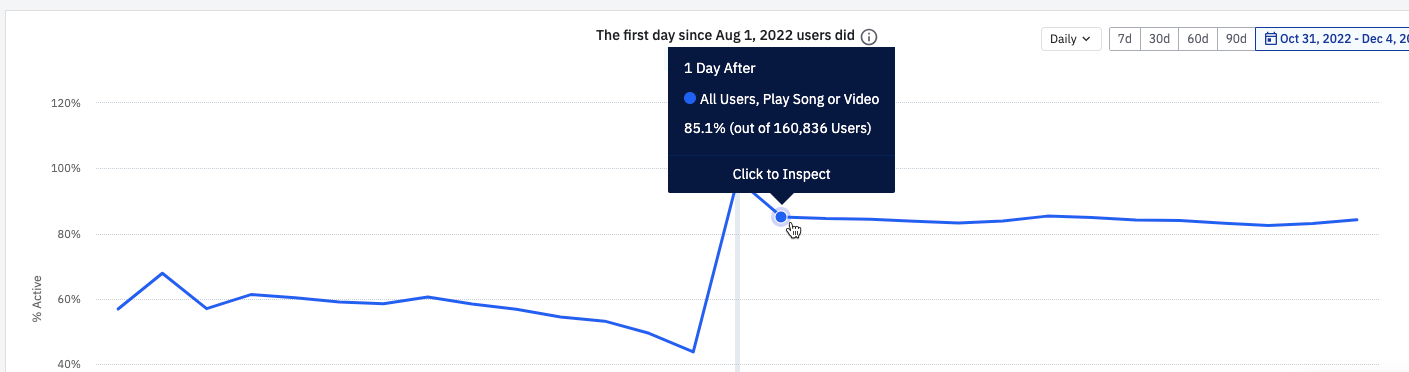
#### Frequency
The chart's Y axis shows the distribution of the number of times people triggered the outcome event at least once in each n-relative-day or n-relative-week interval.
In the example below, 15,085 users played four songs or videos on the seventh day after favoriting a song for the first time.
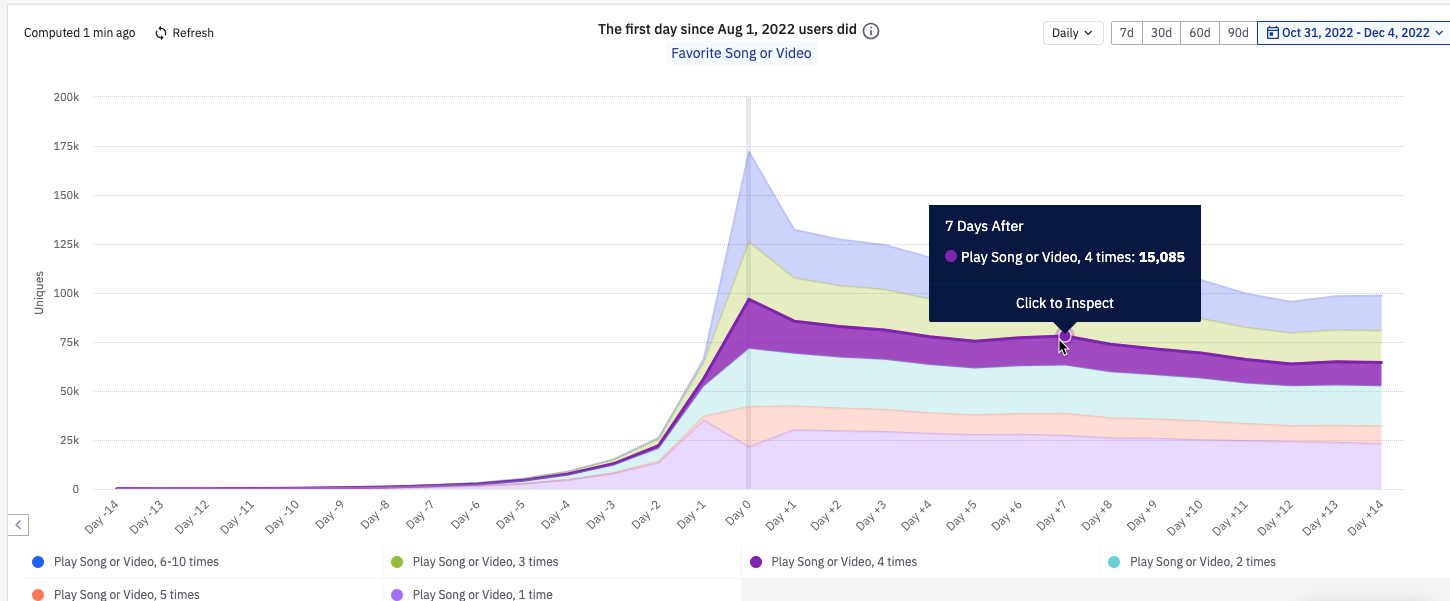
#### Properties
The Properties metric lets you compute either the average or sum of an event property for a given outcome event. These calculations cover every instance of that outcome event triggered in each n-relative-day or n-relative-week interval. For example, plot the average length of all songs or videos played by users in the weeks before and after favoriting a song.
## Causal inference interpretation best practices
Impact Analysis helps you validate hypotheses to better understand the effects between user behaviors. It doesn't replace randomized experimentation, which is still the gold standard for determining causal effects. Treat the Impact Analysis chart as a tool to determine where to focus your experimentation program, to help users engage more successfully with your product.
Consider these factors before making causal conclusions:
- **Alternate hypotheses:** Have you considered other potential actions users take around the same time they fire your treatment behavior for the first time? These actions might also contribute to the change in the rate of the outcome behavior. If those alternative actions have instrumentation, create other Impact Analysis charts using those actions as the treatment event. If the results look similar, investigate how much each treatment event contributes to the change in outcome, through user research and randomized experiments whenever possible.
- **User counts:** If your outcome metrics show high volatility (changing dramatically between intervals) or a dramatic change relative to the intervals before versus after the treatment, check your user count. A small user count can explain these inconsistencies or their magnitudes. A small handful of users can swing the metric in one direction, while large user counts typically have a smoothing effect that gives the metric more stability. Use caution when making conclusions with small user counts, because they don't necessarily reflect a broader pattern.
================================================================================
# Impact Analysis: How engagement changes user behavior
URL: https://amplitude.com/docs/analytics/charts/impact-analysis/impact-analysis-track
================================================================================
# Impact Analysis: How engagement changes user behavior
With Amplitude's **Impact Analysis** chart, you can discover how first-time engagement with one feature affects the rate of another behavior.
For example, a product manager of a music app can use Impact Analysis to see changes in the average number of times users play a song after they first discover the ability to favorite songs.
Use the Impact Analysis chart to:
- Learn whether discovering a feature for the first time changes how often users take another specific action.
- Determine whether users who interacted with a new or changed feature take certain actions more frequently, relative to the time before they first used the new feature.
## Before you begin
Events don't appear in any Amplitude charts until instrumentation is complete. Make sure you've completed instrumentation. To learn the basics, refer to [building charts in Amplitude](https://amplitude.com/docs/get-started/helpful-definitions).
When working with an Impact Analysis chart, remember that correlation doesn't imply causation.
{% callout type="note" %}
Use [Amplitude Experiment](https://amplitude.com/docs/feature-experiment/overview) to determine causality.
{% /callout %}
## Set up an Impact Analysis chart
To build an Impact Analysis chart, follow these steps:
1. In the Events Module, select a **treatment event**. This is a user action that you believe might affect your users' propensity to take a key action within your product. Select up to three treatment events.
2. Select the **outcome event**. This is the behavior you think might have changed after users triggered the treatment event for the first time. Select up to three outcome events.
3. To add **properties** to your events, click _+ where_, select the property name, and specify the property value you want.
4. In the Segmentation Module, identify the **user segment** to include in this analysis. To import a saved segment, click _Saved Segments_ and select the one you want from the list. Otherwise, Amplitude assumes the analysis targets all users.
5. To build your own segment, add properties. Click _+ where_, choose the property you want to include, and specify the property value you want.
6. To **narrow your focus**, include only users who have already performed certain actions. Click _+ perform_, then choose the event you want.
7. Use the date picker to specify the timezone, interval, and timeframe for your analysis. This sets the window of time during which Amplitude finds all users who triggered the treatment event for the first time.
Here, "first time" means the first time the user triggered the treatment event in the number of calendar days **before the beginning of the selected date range**. This number depends on the time interval you choose:
- Daily: 90 calendar days
- Weekly: 91 calendar days (or 13 weeks)
- Monthly: 120 calendar days (or 4 months)
- Quarterly: 360 calendar days (or 4 quarters)
For example, if you set the timeframe between 10/15/2022 and 11/18/2022 with a weekly interval, the results include all users who triggered the treatment event during that time and who had **not** previously done so at any point between 7/17/2022 and 10/15/2022 (91 calendar days before the beginning of the selected time window).
To learn how to interpret your Impact Analysis chart, refer to [interpret your Impact Analysis chart](https://amplitude.com/docs/analytics/charts/impact-analysis/impact-analysis-interpret).
================================================================================
# Marketing metrics recipes
URL: https://amplitude.com/docs/analytics/charts/user-sessions/marketing-metrics-recipes
================================================================================
# Marketing metrics recipes
Amplitude Analytics provides many insights into the success of your product's marketing efforts. This article highlights the ingredients to recreate common marketing metrics using [Event Segmentation](https://amplitude.com/docs/analytics/charts/event-segmentation/event-segmentation-build) or [User Sessions](https://amplitude.com/docs/analytics/charts/user-sessions/user-sessions-track-engagement-frequency) charts.
{% callout type="note" heading="See also" %}
To combine event and session metrics in one chart, including hybrid formulas such as _Revenue per Session_, try [Metric Explorer (Beta)](https://amplitude.com/docs/analytics/charts/metric-explorer/metric-explorer-build).
{% /callout %}
## Before you begin
If you haven't already read the basics of [building charts in Amplitude](https://amplitude.com/docs/analytics/charts/build-charts-add-events), do so before continuing.
Some setup instructions in this article use custom formulas. To read more about [custom formula metrics, syntax, and definitions](https://amplitude.com/docs/analytics/charts/event-segmentation/event-segmentation-custom-formulas), refer to that article.
## Metric recipes
The examples in this section provide a starting point for setting up each metric. As with other analyses, use filters, group-bys, or segmentation to refine results.
| | | |
| ----------------------------------------------------- | ------------------------- | ------------------------------------------------- |
| [Session totals](#session-totals) | [Visitors](#visitors) | [Sessions per user](#sessions-per-user) |
| [Average session duration](#average-session-duration) | [Page views](#page-views) | [Page views per session](#page-views-per-session) |
| [Bounce rate](#bounce-rate) | [Entry rate](#entry-rate) | [Exit rate](#exit-rate) |
{% callout type="note" %}
You can also apply the setup instructions for session totals, visitors, page views, bounce rate, entry rate, and exit rate to [Data Tables](https://amplitude.com/docs/analytics/charts/data-tables/data-tables-multi-dimensional-analysis) analyses.
{% /callout %}
### Session totals
The session totals metric provides a sum of sessions.
Use the following setup for each module in your User Sessions chart to create the session totals metric:
- **Sessions**: `Count` sessions for all sessions.
To filter results by a specific domain or URL:
- Click _Filter by_ and choose `Contains Event`. Search for the `Page Viewed` event. Set the count to greater than or equal to one.
- Click the Filter to add a where clause for your `Page URL`.
- **Measured as**: `Total Sessions`.
- **Segmented by**: All users.
### Visitors
The visitors metric counts unique users who trigger a specific event.
Use the following setup for each module in your Event Segmentation chart to create the visitors metric:
- **Events**: `Page View`.
To filter results by a specific domain or URL:
- Click _Filter by_ and choose `Page URL`. Select the checkbox next to your domain and click _Apply_.
- **Measured as**: `Uniques`.
- **Segmented by**: All users.
### Sessions per user
The sessions per user metric gives an average count of sessions by unique user.
Use the following setup for each module in your User Sessions chart to create the sessions per user metric:
- **Sessions**: `Count` sessions for all sessions.
To filter results by a specific domain or URL:
- Click _Filter by_ and choose `Contains Event`. Search for the `Page Viewed` event. Set the count to greater than or equal to one.
- Click Filter to add a where clause for your `Page URL`.
- **Measured as**: `Avg Per User`.
- **Segmented by**: All users.
### Average session duration
The average session duration metric gives an average length of sessions.
Use the following setup for each module in your User Sessions chart to create the average session duration metric:
- **Sessions**: `Count` sessions for all sessions.
To filter results by a specific domain or URL:
- Click _Filter by_ and choose `Contains Event`. Search for your `Page View` event. Set the count to greater than or equal to one.
- Click Filter to add a where clause for your `Page URL`.
- **Measured as**: `Avg length` (counting in days, hours, minutes).
- **Segmented by**: All users.
### Page views
The page views metric gives a sum of page views events.
Use the following setup for each module in your Event Segmentation chart to create the page views metric:
- **Events**: `Page View`.
To filter results by a specific domain or URL:
- Click _Filter by_ and choose `Page URL`. Select the checkbox next to your domain and click _Apply_.
- **Measured as**: `Event Totals`.
- **Segmented by**: All users.
### Page views per session
The page views per session metric gives an average count of `Page View` events per session.
Use the following setup for each module in your User Sessions chart to create the page views per session metric:
- **Sessions**: `Count` events performed within sessions for all sessions.
- `By Event Count` of the `Page View` event.
To filter results by a specific domain or URL:
- Click _Filter by_ and choose `Contains Event`. Search for the `Page Viewed` event. Set the count to greater than or equal to one.
- Click Filter to add a where clause for your `Page URL`.
- **Measured as**: `Avg events per session`.
- **Segmented by**: All users.
### Bounce rate
The bounce rate metric compares the count of sessions with a single `Page View` event to the total number of sessions, as a percentage.
Use the following setup for each module in your User Sessions chart to create the bounce rate metric:
- **Sessions**: `Count` sessions.
- A: All sessions.
- where `Contains Event` = `Page Viewed` with a count of one.
- B: All sessions.
To filter results by a specific domain or URL of each session:
- Click _Filter by_ and choose `Contains Event` for session B. Search for the `Page Viewed` event. Set the count to greater than or equal to one for session B.
- Click Filter to add a where clause for your `Page URL` for sessions A and B.
- **Measured as**: Formula `%:SESSIONTOTALS(A)/SESSIONTOTALS(B)`.
- **Segmented by**: All users.
This User Sessions chart calculates the 30-day bounce rate for the `Page URL` ampli.com/home. The bounce rate for March 4th was 97.3 percent.
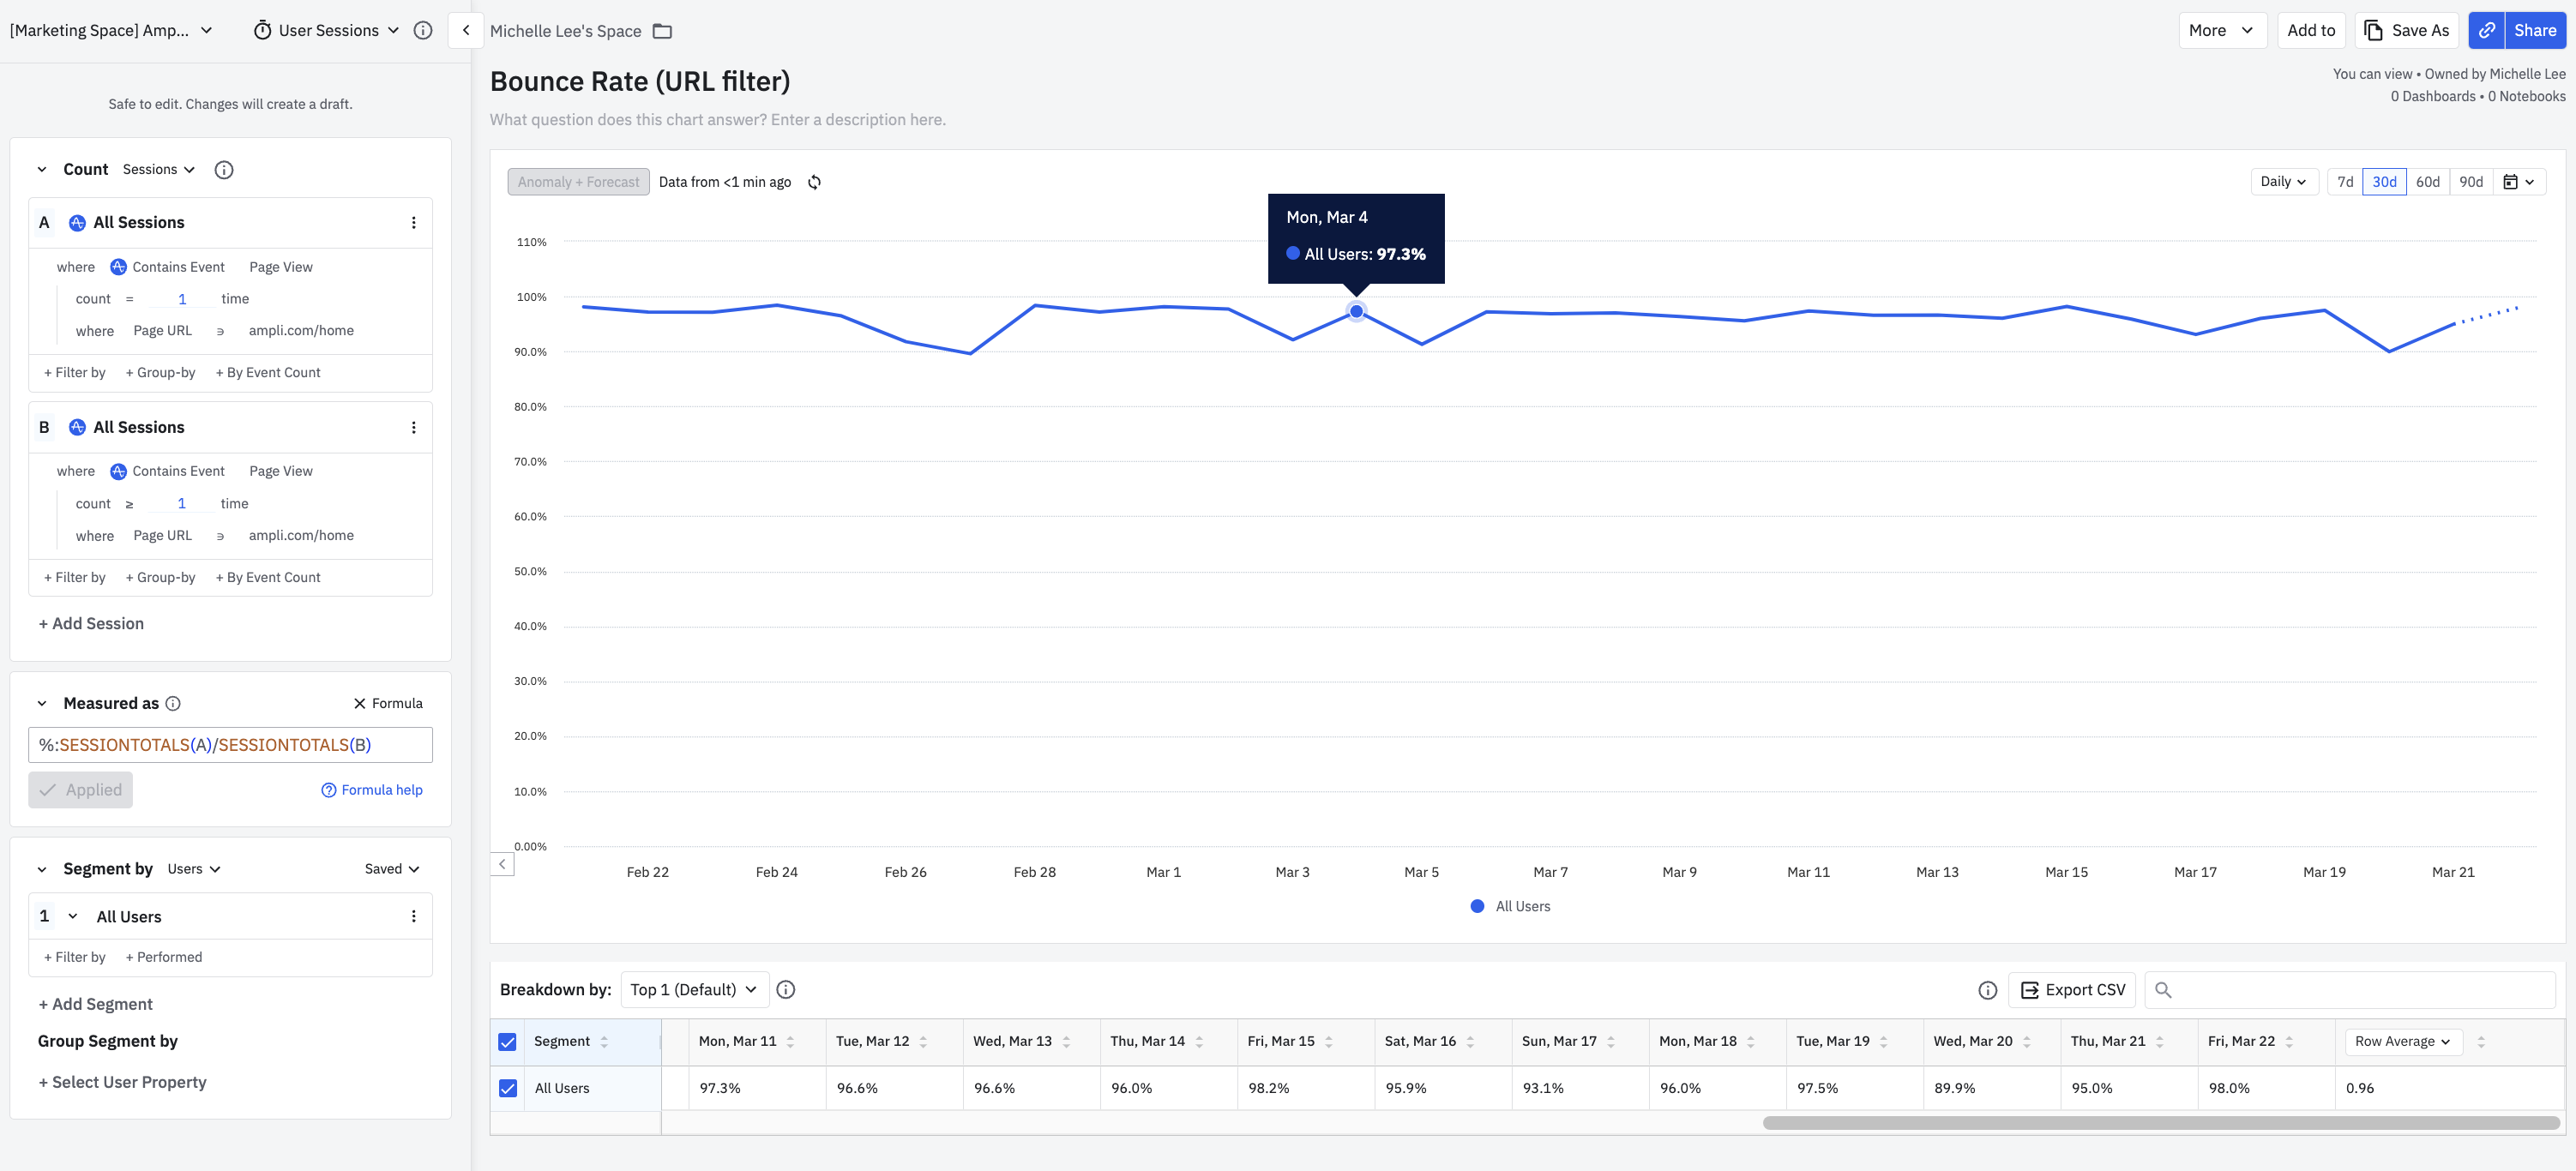
### Entry rate
The entry rate metric compares sessions with a `Page View` event grouped by the **first property value** of the specified event property to the total number of sessions, as a percentage.
Use the following setup for each module in your User Sessions chart to create the entry rate metric:
- **Sessions**: `Count` sessions.
- A: All sessions.
- Grouped by the `First Property Value` of the `Page View` event property `Page Title`.
- B: All sessions.
To filter results by a specific domain or URL of sessions A and B:
- Click _Filter by_ and choose `Contains Event`. Search for the `Page Viewed` event. Set the count to greater than or equal to one.
- Click Filter to add a where clause for your `Page URL`.
- **Measured as**: Formula `%:SESSIONTOTALS(A)/SESSIONTOTALS(B)`.
- **Segmented by**: All users.
This User Sessions chart calculates the 30-day entry rate for the `Page URL` ampli.com/home. The chart's group-by property value `Page Title` appears as different colored lines in the chart. The entry rate for March 3rd was 35.5 percent for the `Home` property value.
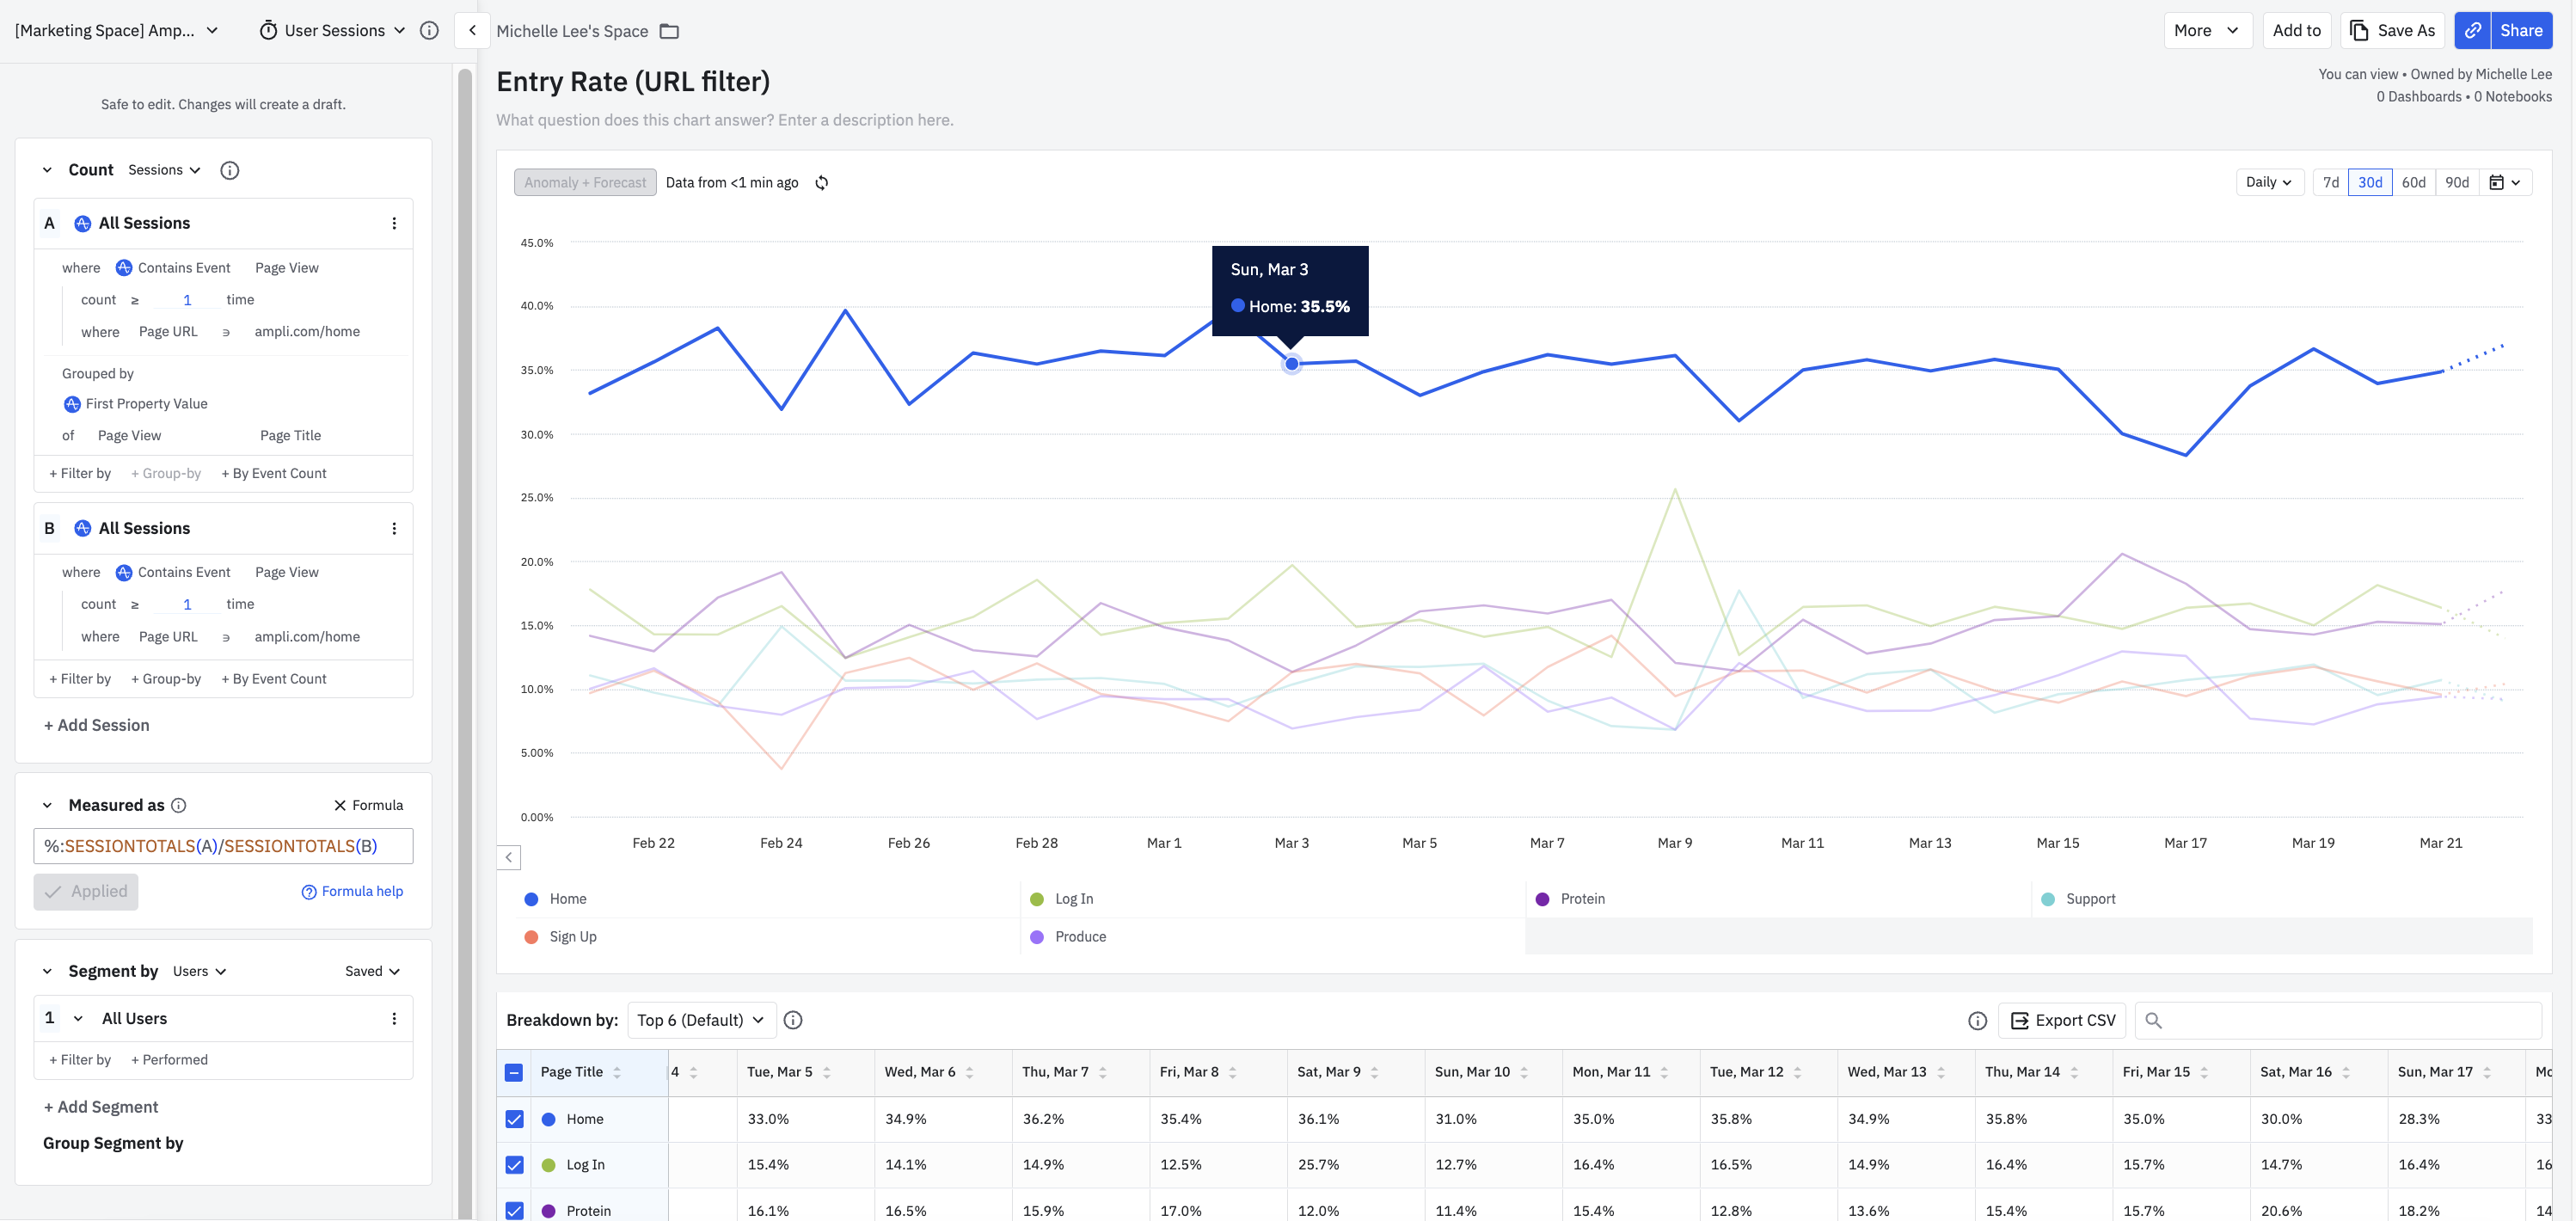
### Exit rate
The exit rate metric compares sessions with a `Page View` event grouped by the **last property value** of the specified event property to the total number of sessions, as a percentage.
Use the following setup for each module in your User Sessions chart to create the exit rate metric:
- **Sessions**: `Count` sessions.
- A: All sessions.
- Grouped by the `Last Property Value` of the `Page View` event property `Page Title`.
- B: All sessions.
To filter results by a specific domain or URL of sessions A and B:
- Click _Filter by_ and choose `Contains Event`. Search for the `Page Viewed` event. Set the count to greater than or equal to one.
- Click Filter to add a where clause for your `Page URL`.
- **Measured as**: Formula `%:SESSIONTOTALS(A)/SESSIONTOTALS(B)`.
- **Segmented by**: All users.
This User Sessions chart calculates the 30-day exit rate for the `Page URL` ampli.com/home. The chart's group-by property value `Page Title` appears as different colored lines in the chart. The exit rate for March 4th was 16.1 percent for the `Log In` property value.
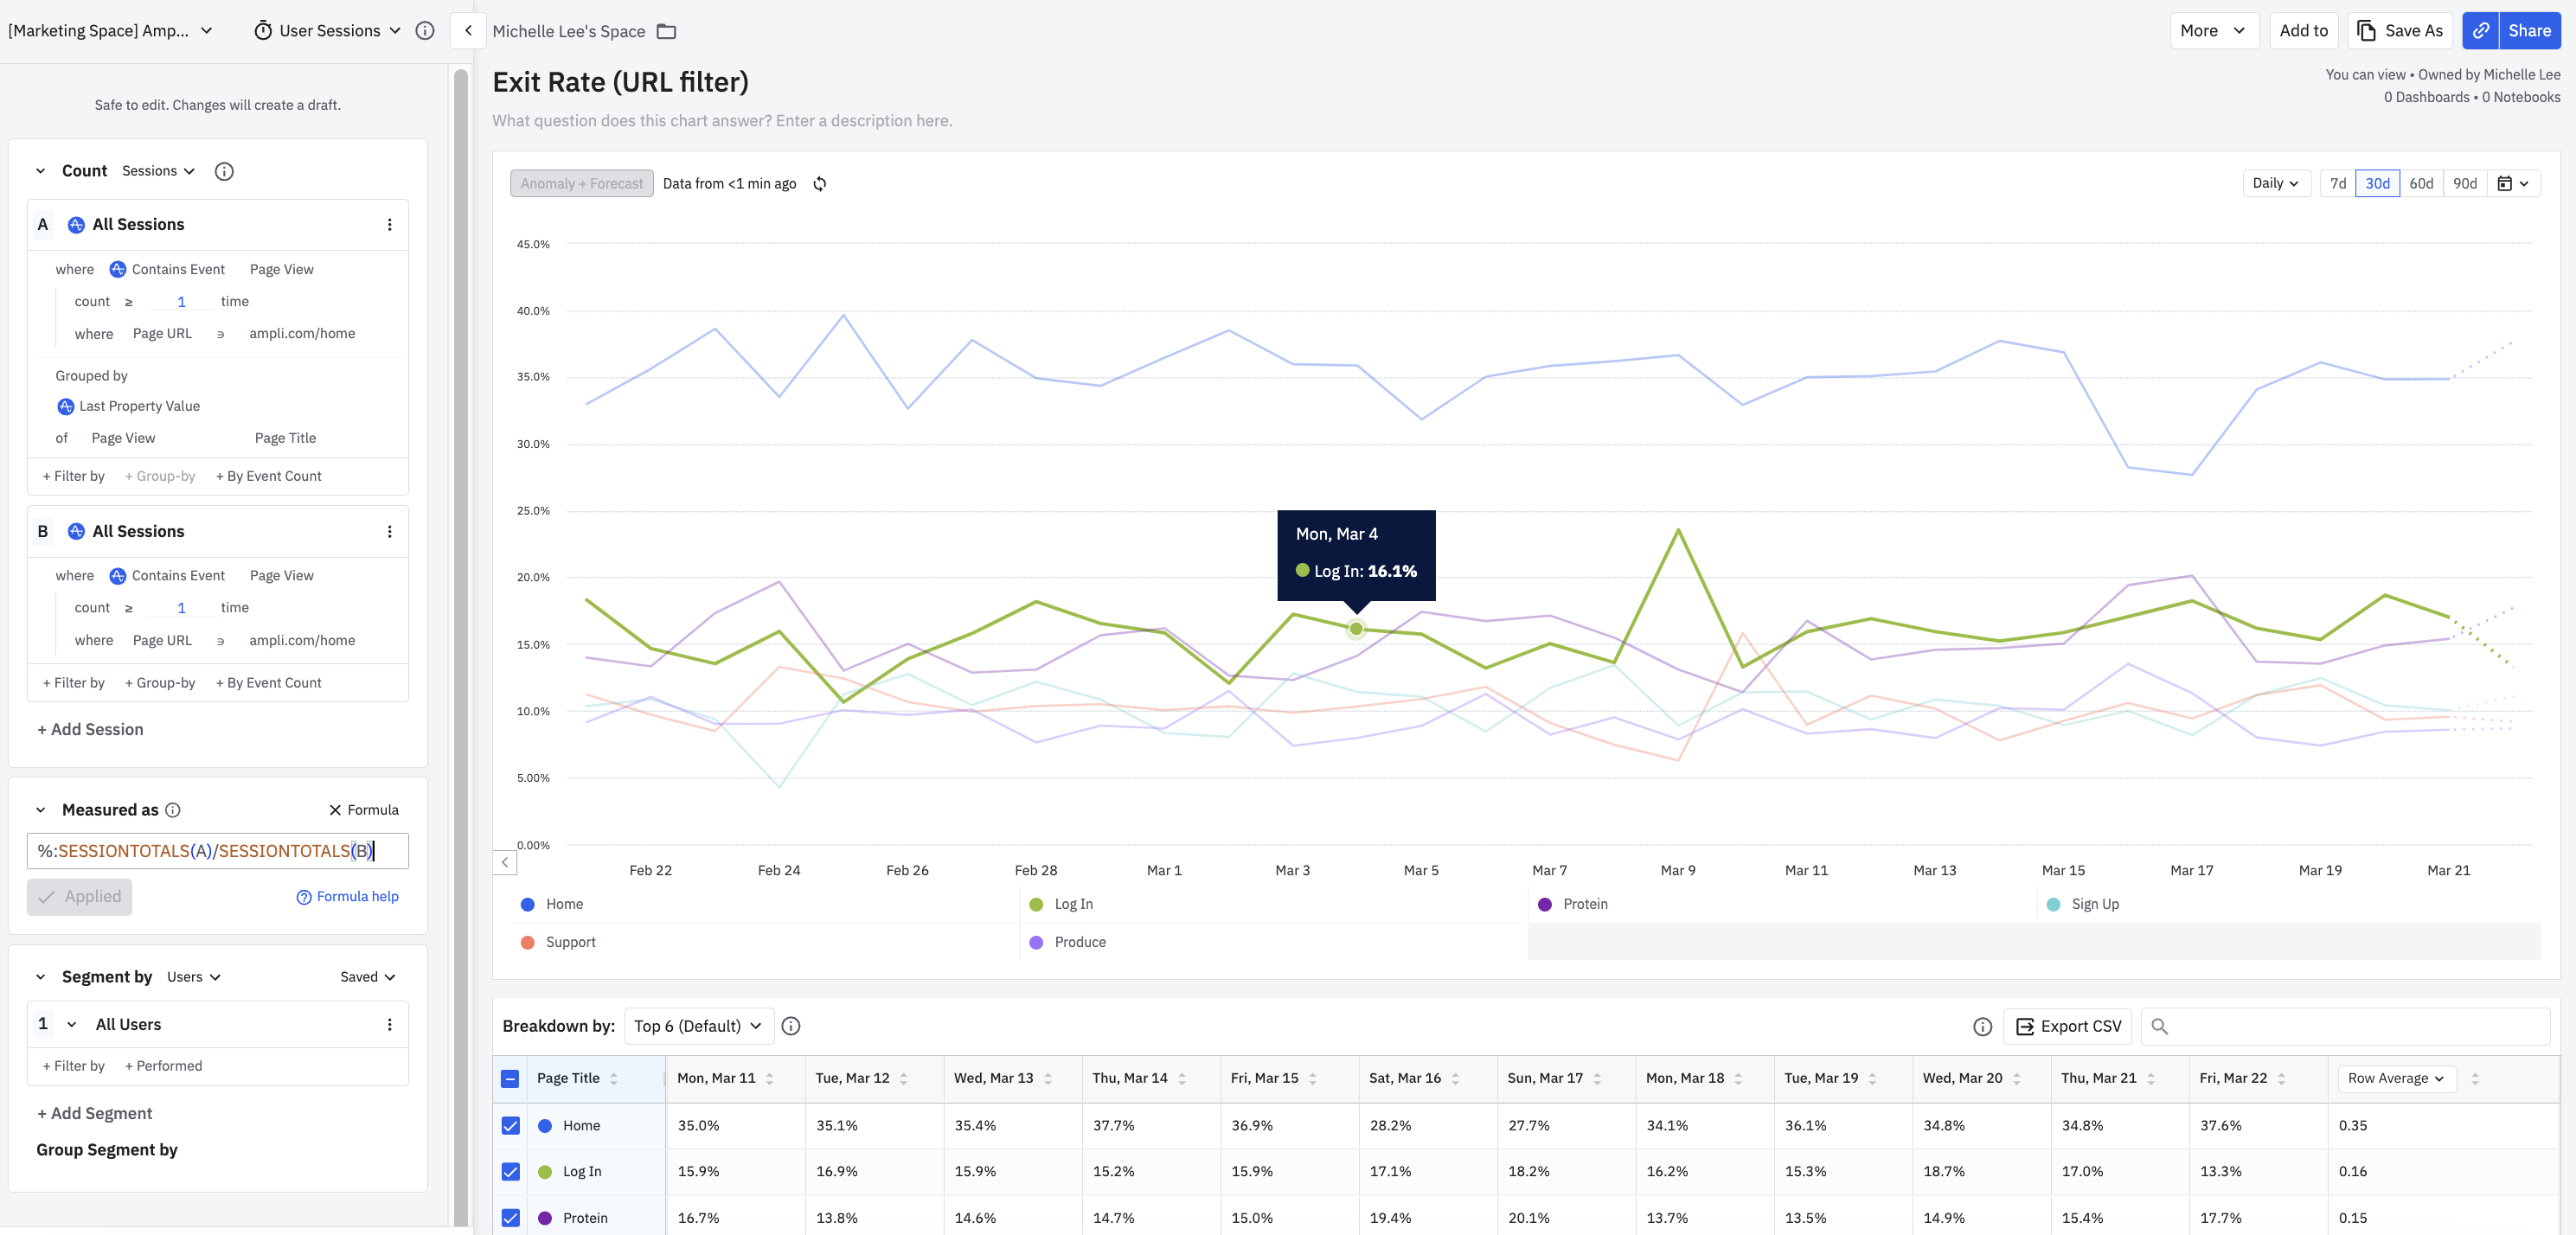
## Performance marketing metrics
Amplitude supports several common performance marketing metrics. [Create these metrics](https://amplitude.com/docs/analytics/charts/data-tables/data-tables-create-metric#create-and-configure-a-new-metric) by following the recipes in this section.
### Ad network clicks
- Metric type: `Formula`.
- Event: `Daily ad metric`.
- Grouped by: `ad_metrics.clicks`.
- Formula: `PROPSUM(A)`.
### Ad network impressions
- Metric type: `Formula`.
- Event: `Daily ad metric`.
- Grouped by: `ad_metrics.impressions`.
- Formula: `PROPSUM(A)`.
### Ad network costs
- Metric type: `Formula`.
- Event: `Daily ad metric`.
- Grouped by: `ad_metrics.costs`.
- Formula: `PROPSUM(A)`.
### Return on ad spending
- Metric type: `Formula`.
- Event A: `Complete purchase`.
- Grouped by: `Revenue`.
- Event B: `Daily ad metric`.
- Grouped by: `ad_metrics.cost`.
- Formula: %: `PROPSUM(A) / PROPSUM(B)`.
### Customer acquisition cost
- Metric type: `Formula`.
- Event A: `Daily ad metric`.
- Grouped by: `ad_metrics.cost`.
- Event B: `User Sign Up`.
- Formula: $: `PROPSUM(A) / TOTALS(B)`.
### Clickthrough rate
- Metric type: `Formula`.
- Event A: `Daily ad metric`.
- Grouped by: `ad_metrics.impressions`.
- Event B: `Daily ad metric`.
- Grouped by: `ad_metrics.clicks`.
- Formula: %: `PROPSUM(A) / PROPSUM(B)`.
================================================================================
# Interpret your User Sessions chart
URL: https://amplitude.com/docs/analytics/charts/user-sessions/user-sessions-interpret
================================================================================
# Interpret your User Sessions chart
The [User Sessions chart](https://amplitude.com/docs/analytics/charts/user-sessions/user-sessions-track-engagement-frequency) helps answer questions about your product's users, such as user frequency, user engagement length, and how those metrics differ by user segment.
## Interpret your User Sessions chart
The results in User Sessions depend on the metrics you chose while [building your chart](https://amplitude.com/docs/analytics/charts/user-sessions/user-sessions-track-engagement-frequency), such as a count of sessions or a count of events.
The example below displays a daily count of sessions with at least one `Add to Cart` event for all users over the last 30 days. The chart also filters users by `Country` (United Kingdom).
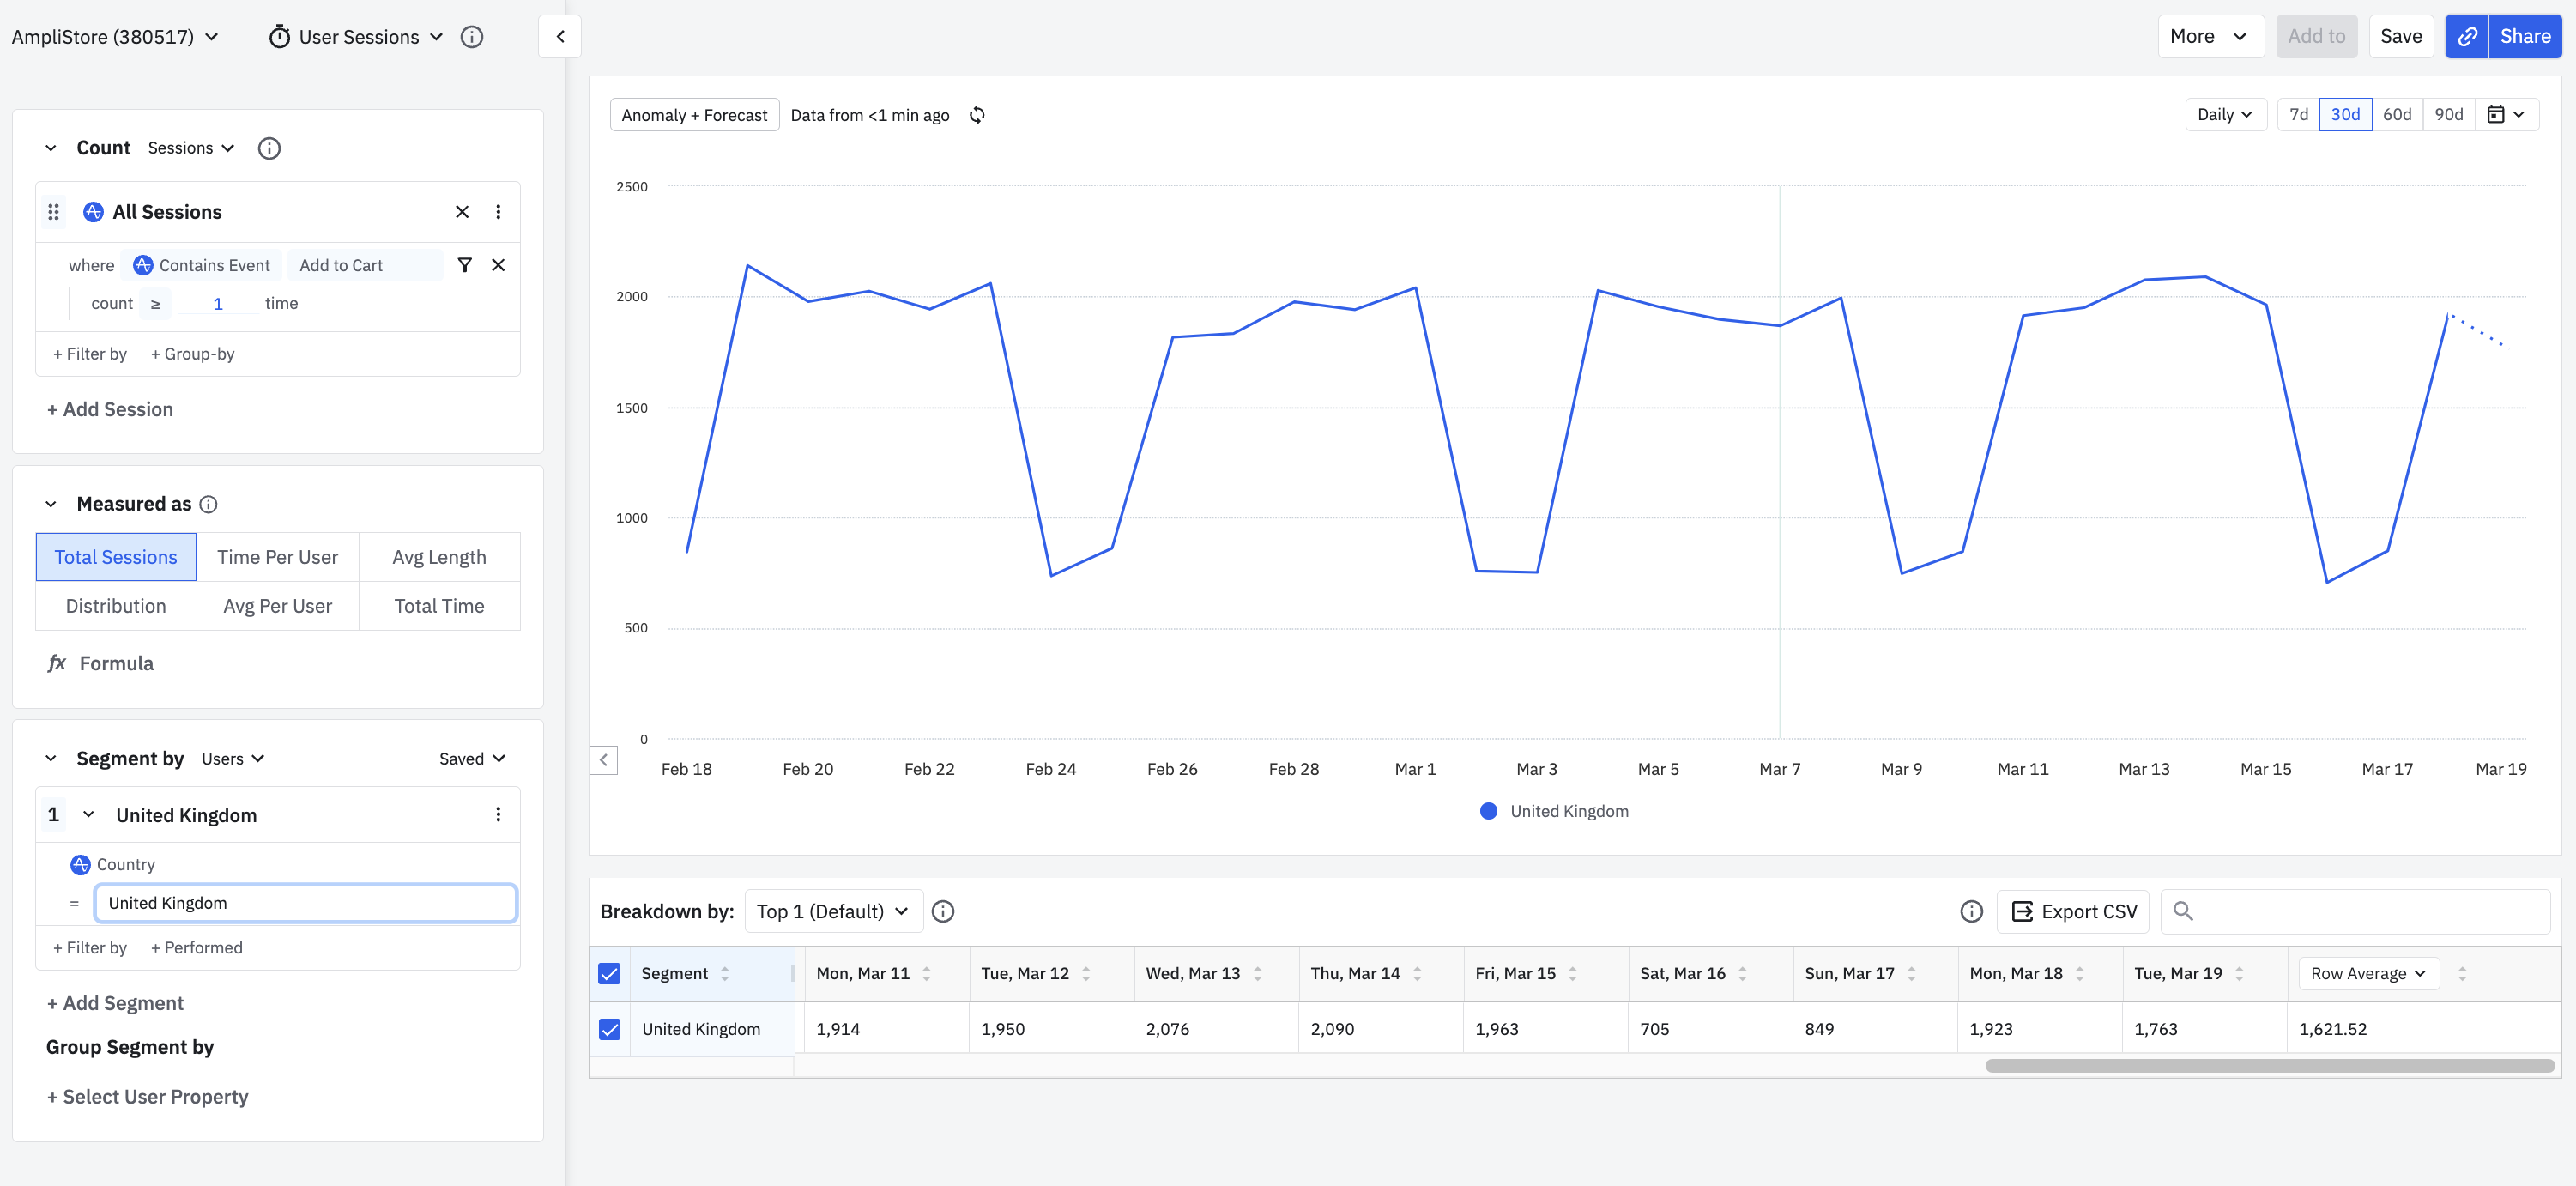
The same chart with an added group segment by `Carrier` shows the segmented carriers as different colored lines.
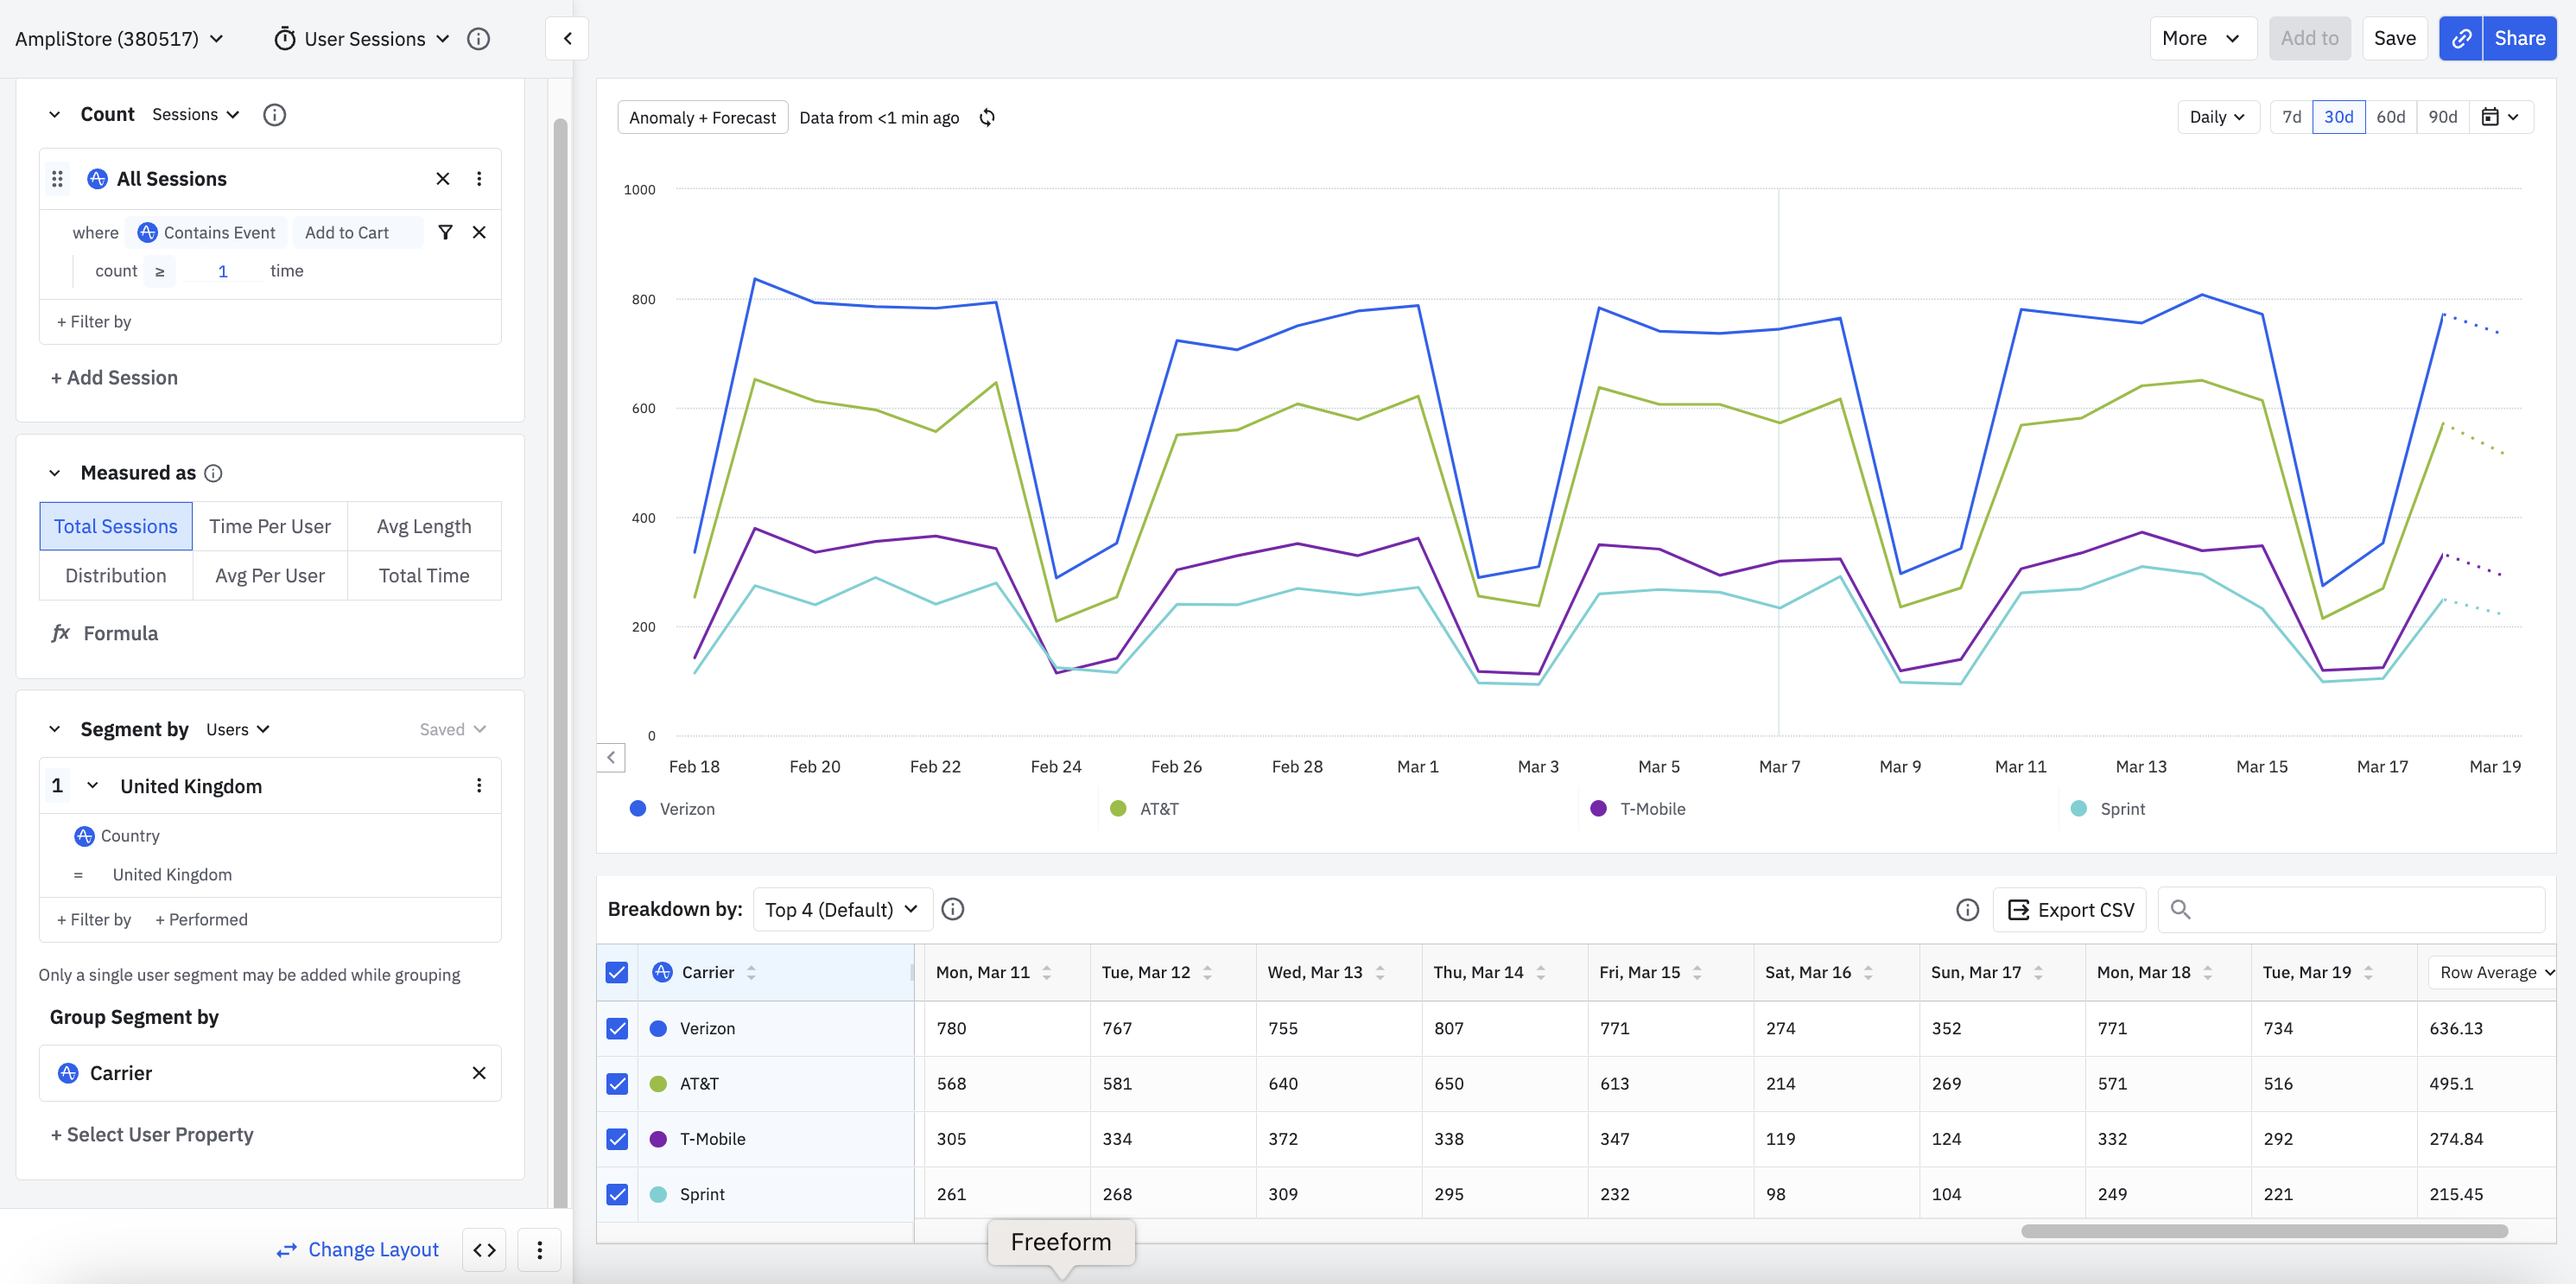
### The data table
A table of session or event data appears below the chart. To specify which segments to see in the graph, click a segment name in the [breakdown table](https://amplitude.com/docs/analytics/charts/review-chart-data). To download the table, click _Export CSV_.
Using the example above, Amplitude segmented the breakdown table's results by `Carrier`.

{% callout type="note" %}
Amplitude counts users as `(none)` if the segmented property values aren't available when the events trigger. [Read more about `(none)` or unexpected values in this FAQ article](https://help.amplitude.com/hc/en-us/articles/360016257391#Event-Properties).
{% /callout %}
## The three ways Amplitude records sessions
Amplitude records sessions on either the server side or the client side. Client-side sessions can be either mobile or web.
- **Server side:** Use the HTTP API v2 to track sessions on the server side by including a value in the `session_id` field. The `session_id` value is the number of milliseconds since epoch, counting from the start of the session.
- **Client side (mobile):** When you use Amplitude's mobile SDKs, events triggered within 5 minutes of each other count toward the current session by default. The time of the first event marks the session's start time, and the last event triggered marks the end time. For example, an 'Open App' event can mark the first event. Amplitude counts events sent within five minutes of each other toward the current session.
- **Client side (web):** When you use Amplitude's JavaScript SDK, events triggered within 30 minutes of each other count toward the current session by default. The time of the first event marks the session's start time, and the last event triggered marks the end time.
You can also define a session without instrumenting your events first, by setting a [custom session property](https://amplitude.com/docs/data/sources/instrument-track-sessions).
{% callout type="note" %}
The User Sessions chart only displays data if you send a session ID with your events. Amplitude's SDKs handle this automatically, unless you flag an event as out-of-session (assigning the session ID a value of `-1`). If you're using Amplitude's HTTP API, you must explicitly send a `session_id` with your events.
{% /callout %}
## How filtering works in the User Sessions chart
Filtering events for the User Sessions chart is a multi-step process. The order of those steps matters.
First, Amplitude filters for events that match the property filters. Amplitude then takes those events and groups them into sessions, which lets Amplitude calculate session length and count events performed each session.
Property filters apply before session filters. Amplitude filters on raw events first, then on the filtered events.
Amplitude only considers events with property filters when computing session length.
================================================================================
# User Sessions: Track engagement frequency and duration
URL: https://amplitude.com/docs/analytics/charts/user-sessions/user-sessions-track-engagement-frequency
================================================================================
# User Sessions: Track engagement frequency and duration
The User Sessions chart helps you analyze your users through session-based metrics. By showing the distribution of session lengths, average session length, and average sessions per user, it helps answer questions like:
- How frequently do users engage with your product?
- How long do they engage with your product?
- How do these metrics compare to other user segments?
{% callout type="note" heading="See also" %}
To analyze session metrics and event metrics together in a single chart, try [Metric Explorer (Beta)](https://amplitude.com/docs/analytics/charts/metric-explorer/metric-explorer-build).
{% /callout %}
## Before you begin
For more information, refer to [building charts in Amplitude](https://amplitude.com/docs/get-started/helpful-definitions) and [session IDs and how Amplitude tracks sessions](https://amplitude.com/docs/data/sources/instrument-track-sessions).
## Set up a user sessions chart
Most Amplitude charts rely on the Events Module to build an analysis. The User Sessions chart works differently because it uses a Sessions Module.
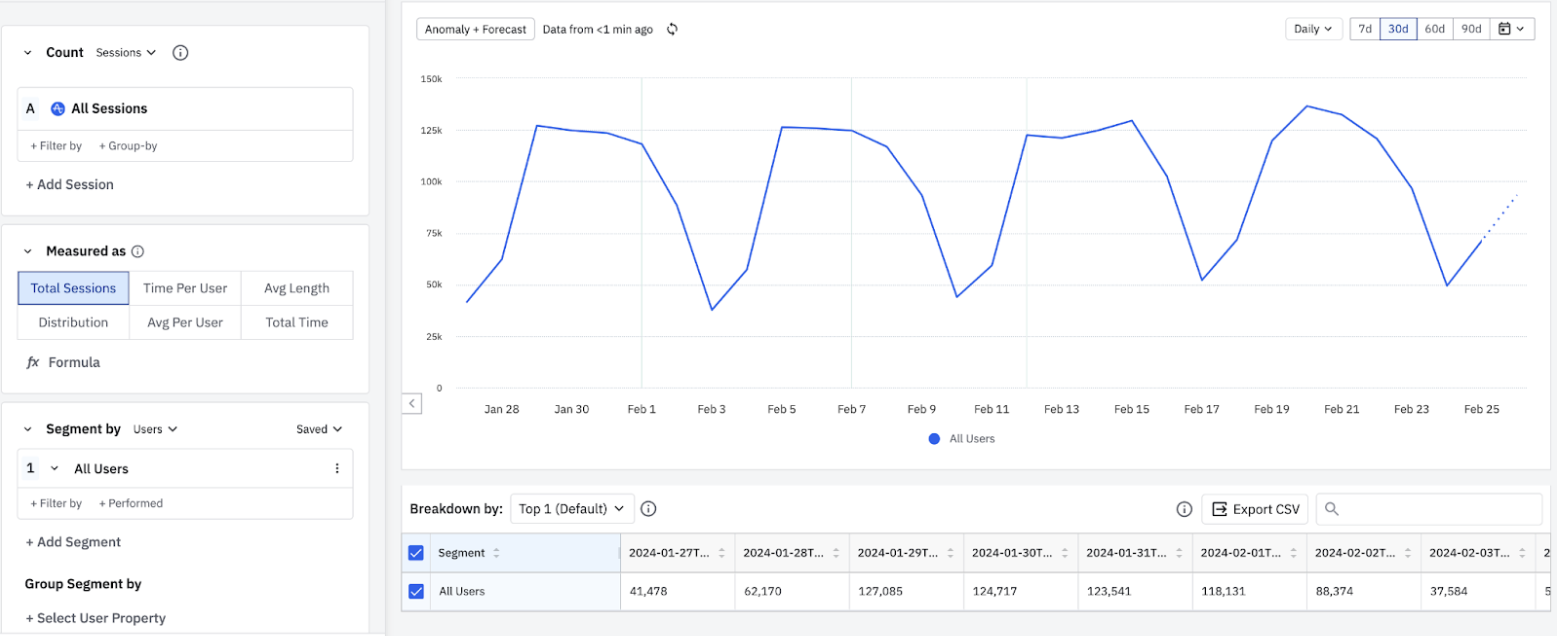
A user sessions analysis breaks out your users into groups based on characteristics of their sessions in your product.
You can also use this chart to **count the number of events users fire during their sessions**. This lets you assess engagement during a particular period of activity, instead of during an entire day, week, or month.
### Build a user sessions chart
To build your own user sessions chart, follow these steps:
1. In the Sessions Module (where you'd usually find an Events Module), use the _Count_ dropdown to specify whether your User Sessions chart measures sessions or events performed within sessions.
2. If you're **counting events performed within sessions**, specify the event to count by clicking _Select Event_ under _Event Count_. If you're measuring sessions instead, skip this step.
3. Add properties to your starting event by clicking _+ Filter by_ and choosing one of the available properties: `Session Duration`, `Contains Event`, `First Property` value, or `Last Property` value.
Enter the session's minimum length in seconds, minutes, hours, or days for `Session Duration`. Choose an event the user must trigger during each session for `Contains Event`. Or choose a property each session must contain for `First Property` value or `Last Property` value.
4. To group your sessions by a property, click **+ Group by** and choose the property. You can apply a single group-by to each Sessions object in the Sessions module, and add multiple group-bys in the Segment By module.
5. If you selected **_Sessions_** in Step 1, choose from the following options in the Measured As Module:
- **Total Sessions:** Graphs the total number of sessions across all users. Amplitude calculates this by counting the total number of valid sessions in the interval. (When session IDs are instrumented, "valid" means a session with an ID other than 'none' or `-1`.) Total Sessions doesn't count sessions containing only inactive events.
- **Time Spent:** Graphs the total sum of all session lengths in the interval.
- **Time Spent per User**: Graphs the average time spent in sessions per interval. Amplitude calculates this by taking the sum of all session lengths in the interval, and dividing by the total number of active users in the interval.
- **Avg Length:** Graphs the average session length. Amplitude calculates this by taking the sum of all session lengths in the interval, and dividing by the total number of sessions in that interval.
- **Length Distribution:** Displays the distribution of session lengths in a histogram. Customize the shape of the distribution by setting the minimum and maximum session lengths. The minimum value is inclusive, and the maximum value is exclusive. The example above shows session length distribution for sessions between 1 and 30 minutes long in 5-minute intervals.
- **Avg Per User:** Graphs the average number of sessions per user. Amplitude calculates this by dividing the total number of valid sessions in an interval by the total number of active users in the same interval.
- **Formula**: With formulas, you can create your own custom metrics, such as bounce, entry, and exit rates. The following metric formulas are available in User Sessions analyses: `EVENTTOTALS`, `HIST`, `PROPSUM`, `SESSIONTOTALS`, and `UNIQUES`. These metric formulas work like the definitions in [the custom metric formulas Help Center article](https://amplitude.com/docs/analytics/charts/event-segmentation/event-segmentation-custom-formulas), but the syntax refers to **sessions** instead of events.
If you selected **_Events performed within sessions_**, choose from the following chart options instead:
- **Average Events per Sessions**: Graphs the average number of times a selected event is performed per session. The time series plots the number of times users perform the event in a session per interval (day, week, month, and so on). Use this to analyze average engagement.
- **Total Events Across Sessions**: Graphs the total number of times a selected event is performed in sessions. Like plotting totals in Event Segmentation, this shows the number of times users have performed a particular action across all sessions in an interval.
- **Distribution**: Graphs a distribution of the number of sessions that include a selected event. The x-axis shows a range of the number of times the selected event was performed, and the y-axis plots the number of sessions in the time range. This analysis shows which of your users have the highest or lowest in-session engagement. To set individual ranges for each bucket, click _Set buckets_:
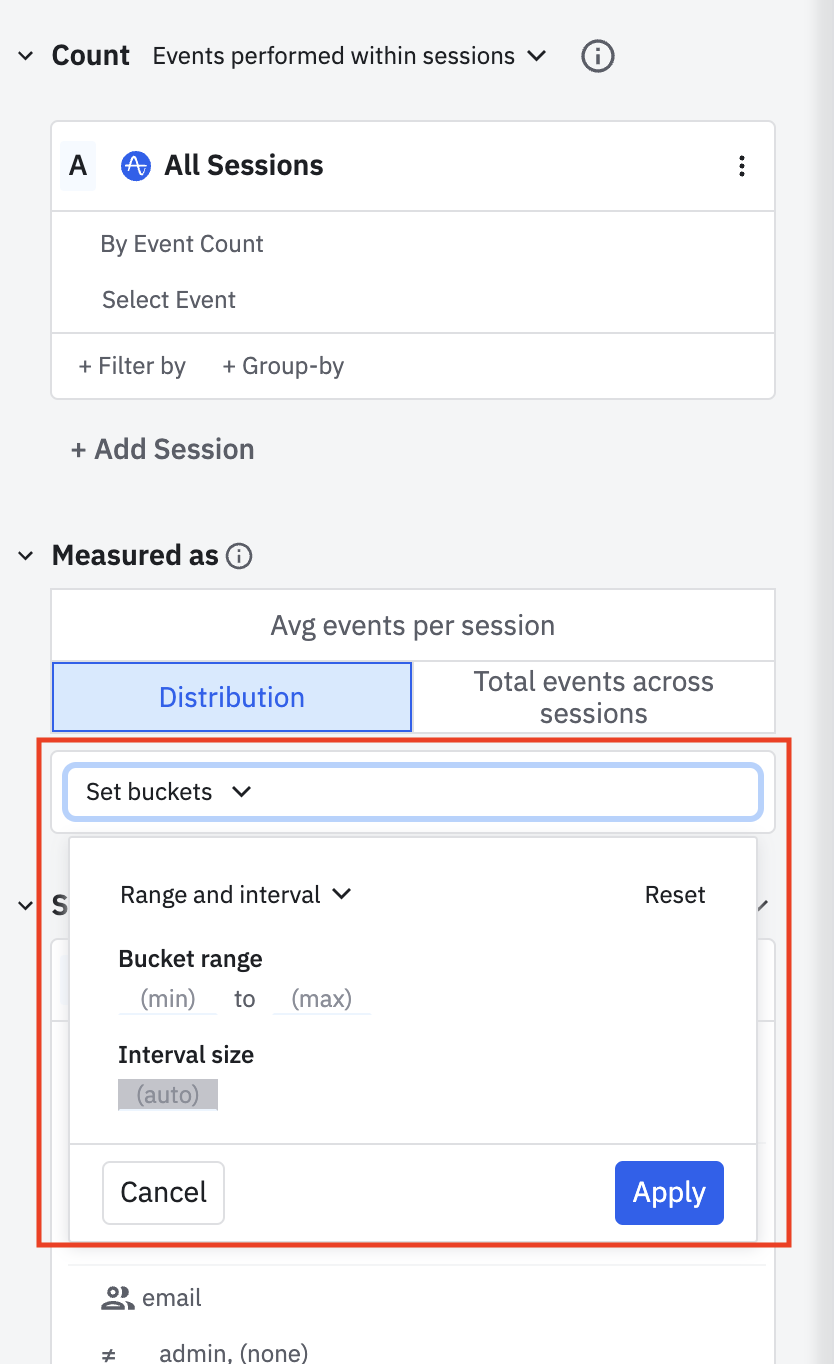
6. In the Segment By module, identify the user segment to include in this analysis. To import a previously saved segment, click _Saved_ and select the one you want from the list. Otherwise, Amplitude targets all users by default.
7. To build your own user segment instead, add properties. Click _+ Filter by_, choose the property to include, and specify the property value you're interested in.
8. To narrow the focus further to users who already performed certain actions, click _+ Performed_, then choose the event you're interested in.
9. To add another user segment, click _+ Add Segment_ and repeat steps 5 through 7.
10. Use the datepicker to set the timeframe of your analysis.
{% callout type="note" %}
Amplitude excludes sessions lasting longer than a day from analyses.
{% /callout %}
Read on to learn more about [interpreting your User Sessions chart](https://amplitude.com/docs/analytics/charts/user-sessions/user-sessions-interpret).
================================================================================
# User Sessions FAQ
URL: https://amplitude.com/docs/analytics/charts/user-sessions/faq
================================================================================
# User Sessions FAQ
## Common questions
This page answers common questions about the User Sessions chart.
### Why is my User Sessions chart empty?
The User Sessions chart requires valid session IDs for events. A valid session ID has a value other than `-1`. To check whether the events in your project have session IDs, check any user's event streams.
### Why are there so many zero-length sessions in my User Sessions chart?
Two likely causes explain a large number of users in the "0 sec" session data point in the [User Sessions](https://amplitude.com/docs/analytics/charts/user-sessions/user-sessions-track-engagement-frequency) chart.
**Potential cause #1: Out-of-session events**
Amplitude calculates session length for events sent with the [HTTP API](https://amplitude.com/docs/data/sources/instrument-track-sessions) using this formula:
`max(client_event_time) - session_id`
For these events to count as part of a session, the [session ID](https://amplitude.com/docs/data/sources/instrument-track-sessions) must be a timestamp reflecting the beginning of the session in epoch time.
**Potential cause #2: You're tracking the Start Session event, but no other events**
If your project allows sending start or end session events (which you can enable in the [Android SDK](https://help.amplitude.com/hc/en-us/articles/115002935588-Android-SDK-Installation#track-sessions) or [iOS SDK](https://help.amplitude.com/hc/en-us/articles/115002278527-iOS-SDK-Installation#track-sessions)), your app sends a `Start Session` event to Amplitude every time it launches in the foreground. If Amplitude receives no other events to log after this, it sets the [session length](https://amplitude.com/docs/data/sources/instrument-track-sessions) to zero.
Amplitude's [Microscope](https://amplitude.com/docs/analytics/microscope) feature lets you examine a user's activity, so you can quickly determine which of these causes is the issue.
### When does the Amplitude Start Session event trigger?
The event triggers when the app enters the foreground, or when the SDK initializes in the foreground.
### Why are there empty sessions with no active events in the user event streams?
When you use mobile SDKs with start or end session events enabled, you might see sessions that include only the `Start Session` and `End Session` events. A few reasons explain this:
- The user enters and leaves the app without triggering custom events.
- The user triggers events that are blocked or deleted in your tracking plan, so Amplitude doesn't ingest them.
- Certain activities in the app, like backend notifications or identify calls, can bring the app to the foreground without triggering an actual event.
### Why do some mobile sessions contain a gap of over five minutes, or why do some sessions last an unusually long time?
Some common reasons:
- The default session timeout window changed. Mobile SDKs use five minutes by default.
- Activities in the app, like backend notifications or identify calls, can bring the app to the foreground between two actual sessions, leading to unexpectedly long sessions.
### Does a change to a custom session apply retroactively?
Yes. After you change the custom session definition, Amplitude groups all sessions, including those logged before the change, based on the new definition.
### Does the custom session definition affect the raw data?
It doesn't affect the raw data, and you can revert it to the default session definition at any time.
### Does a server-side integration between Amplitude and Segment provide a Session ID automatically?
Go to [the FAQ article on Segment/Amplitude integration](https://amplitude.com/docs/data/troubleshooting/integrations-and-sources#segment-amplitude-integration) to learn more.
================================================================================
# Engagement Matrix: see how users feel about your product
URL: https://amplitude.com/docs/analytics/charts/engagement-matrix/engagement-matrix-discover
================================================================================
# Engagement Matrix: see how users feel about your product
With Amplitude's **Engagement Matrix** chart, you can develop a better understanding of feature engagement in your product, by breadth and frequency. The Engagement Matrix breaks out the top and bottom events for engagement into a four-quadrant matrix view. Use the matrix to identify features that aren't performing well so you can refactor or deprecate them, and the features that are performing best so you can extend that engagement to other areas of your product.
## Before you begin
Events don't appear in any Amplitude charts until instrumentation is complete, so finish that work first. Refer to the article on [building charts in Amplitude](https://amplitude.com/docs/get-started/helpful-definitions).
## Set up an Engagement Matrix chart
The Engagement Matrix can compare up to 100 events based on breadth and frequency of usage. Breadth is based on adoption metrics, such as % Monthly Active Users who performed a particular event. Frequency is based on the number of times or days an event was performed.
### Build your chart
To build an Engagement Matrix, follow these steps:
1. In the Events Module, choose the **events** to include in your chart. You can select up to 20 individual event types. Many Amplitude users find more exploratory value in using one of the default, out-of-the-box options:
- **[Amplitude] Top Events:** Shows the top 50 **active** events (by event totals) in your project.
- **[Amplitude] Bottom Events:** Shows the lowest 50 **active** events (by event totals) in your project.
- **[Amplitude] Top and Bottom Events:** Shows the combined top 50 and lowest 50 **active** events (by event totals) in your project, giving you a matrix view comparing frequent and infrequent feature usage.
2. If you've selected your events individually, you can add properties to them by clicking _+ Filter by_, selecting the property name, and specifying the property value you want. You can also break out your results by property values by clicking _+ Group-by_ and selecting the properties and values you want. These options aren't available for any of the default Amplitude event groups.
3. In the Segment By Module, identify the user segment you want to include in this analysis. You can import a previously saved segment by clicking _Saved_ and selecting the one you want from the list. Otherwise, Amplitude assumes your analysis targets all users.
{% callout type="note" %}
You can only include one user segment in an Engagement Matrix.
{% /callout %}
4. If you don't want to import a previously saved user segment, you can build your own by adding properties. Click _+ Filter by_, choose the property you want to include, and specify the property value you want.
5. You can narrow your focus further by including only users who have performed certain actions. Click _+ Performed_, then choose the event you want.
{% callout type="note" %}
You can use [account-level reporting](https://amplitude.com/docs/analytics/account-level-reporting) with this chart type, which you can enable from the _...performed by_ dropdown if you've instrumented groups.
{% /callout %}
6. In the Measured As Module, set the metrics from the dropdown menus, described in [Choose your metrics](#choose-your-metrics).
7. Use the date picker in the chart area to set the timezone, interval, and timeframe of your analysis.
### Choose your metrics
In the Measured As Module, you'll find a range of options to customize your Engagement Matrix analysis:
- **% of active users and Average Times Performed per day:** Decide whether to view your results by %DAU (percentage of your **daily** active users), %WAU (percentage of your **weekly** active users), or %MAU (percentage of your **monthly** active users).
To change this option, change your interval to match. For example, if your interval is set to "Monthly," you can only see your monthly active users.
{% callout type="note" %}
For some inactive events, you may see a %DAU / %WAU / %MAU value greater than 100%. This happens because the data point includes users who only fire those inactive events and may not be active in the time interval selected.
{% /callout %}
Next, choose between _Average Days Performed_ or _Average Times Performed_:
- _Average Days Performed_ displays on the Y axis the average **number of days** an event fired per unit of your interval (day, week, or month). If your interval is set to "Daily," you may see events clustered at the top of the Y axis.
- _Average Times Performed_ displays on the Y axis the average **number of times** an event fired per interval unit. The product computes this as "number of times performed within a time unit of users _that performed at least one event_ in the time unit." A value computed for each time unit then averaged for each time unit that had users. Think of it as the average of the averages.
- **Sectioned by:** This option determines how the quadrants of the Engagement Matrix are defined.
If you select _Median_, the vertical line shows the **median** percentage of daily, weekly, or monthly active users (depending on your interval) that fired each event during the timeframe of your analysis. The horizontal line shows the **median frequency** with which each event fired, calculated by taking the median of all the individual frequencies of each event.
If you select _Average_, the vertical line shows the **average** percentage of daily, weekly, or monthly active users (depending on your interval) that fired each event during the timeframe of your analysis. The horizontal line shows the **average frequency** with which each event fired, calculated by taking the average of all the individual frequencies of each event.
{% callout type="note" %}
Both of these options stay consistent when switching between a linear and a log scale.
{% /callout %}
- **Log or Linear Scale:** Specify whether you want to see the chart on a log or a linear scale, depending on which method better suits your Engagement Matrix analysis.
Next, refer to the Help Center article on [interpreting your Engagement Matrix](https://amplitude.com/docs/analytics/charts/engagement-matrix/engagement-matrix-interpret).
================================================================================
# Interpret your Engagement Matrix
URL: https://amplitude.com/docs/analytics/charts/engagement-matrix/engagement-matrix-interpret
================================================================================
# Interpret your Engagement Matrix
Before you begin, refer to [Engagement Matrix: see how users feel about your product](https://amplitude.com/docs/analytics/charts/engagement-matrix/engagement-matrix-discover) to learn how to create an engagement matrix chart.
## Interpret your engagement matrix
The quadrants on your chart categorize features and events based on their performance relative to each other. Use the quadrants to rank which events or features to focus on:
- **Top right corner:** Events performed with **high frequency** by a **high number of users**. These are likely core features in your product, and represent what many people do in your product much of the time.
- **Top left corner:** Events fired with **high frequency** by a **low number of users**. These could be power features that a small subset of users find valuable. Consider ways to improve these features and make them more accessible to other users, so you can shift these data points to the top-right corner of the matrix.
- **Bottom right corner:** Events performed with **low frequency** by a **high number of users**. These could be features many users find useful but only use once or twice. They could also be one-time events all your users fire at least once (for example, creating an account or finishing an onboarding tutorial).
- **Bottom left corner:** Events performed with **low frequency** by a **low number of users**. These are events or features to either improve or deprecate.
For example, in the previous matrix, the 'Select Facility' event seems to be a core event in the product, while the 'Welcome Page' event is in the bottom left. Your product team may want to focus on moving the 'Upgrade Plan' event to the right, perhaps by enticing users to upgrade their plans.
## Breakdown table
The [breakdown table](https://amplitude.com/docs/analytics/charts/review-chart-data) below the chart provides a tabular summary of the data displayed in your matrix.
You can perform operations on the columns. The column average or median is the same as the values the cross-sectional gray lines denote. After you select your events, you can deselect any events in the table you don't want to see in your Engagement Matrix chart. You can also export this data as a CSV file and display either the average number of times performed or the average number of days for each event.
To export the table as a .CSV file, click _Export CSV_.
## Zoom in to evaluate clusters of data
To zoom in on a cluster of data points, drag your mouse diagonally across the data points you want more detail on.
================================================================================
# Interpret your Lifecycle chart
URL: https://amplitude.com/docs/analytics/charts/lifecycle/lifecycle-interpret
================================================================================
# Interpret your Lifecycle chart
This article explains how to interpret your Lifecycle analysis. Read [setting up the Lifecycle chart](https://amplitude.com/docs/analytics/charts/lifecycle/lifecycle-track-growth) before proceeding.
{% callout type="note" heading="" %}
You can use [Global Agent](https://amplitude.com/docs/amplitude-ai/global-agent-overview) to interpret Lifecycle charts with natural language. Ask questions like "What's driving the increase in resurrected users?" or "Why did dormant users spike last week?"
{% /callout %}
## Interpret your Lifecycle chart
The Lifecycle chart's default display is a histogram with two buckets for each of your usage intervals. The blue buckets contain active users; the red bucket contains dormant users.
This is your **Growth** chart. It shows the distribution of active users and the count of dormant users for a particular day, week, or month. Use it to identify which group of users affects your active user counts the most.
All your **active users** fall into one of three groups: **new**, **current**, or **resurrected** (formerly inactive). The different shades of blue in the histogram's blue bar represent each group. Amplitude defines the three active user groups as follows:
- A **new user** (light blue) is one who is new in Amplitude as a whole within one usage interval of when they performed the event. Amplitude bases New classification on the user's Amplitude account first-seen time, not the first time the user performed the selected event. Amplitude counts that user as New for one full interval after the interval in which their first event arrives. For example, if your chart uses weekly intervals, Amplitude considers a user New during Oct 1 through Oct 7 if they fired the event and were new to Amplitude during that same interval.
- A **current user** (medium blue) is one who logged the specified event in the **current** interval and also in the **previous usage interval** (day, week, or month). For example, Amplitude considers a user who fired the specified event during Oct 1 to Oct 7 and Oct 8 to Oct 14 a **current** user on October 9.
- A **resurrected user** (dark blue) is a user who logged the specified event in the **current** interval, doesn't qualify as New because the user's Amplitude account first-seen time is older than one interval, and didn't log the event in the immediately previous interval. Because Amplitude uses the user's account first-seen time instead of the first occurrence of the selected event, a pre-existing Amplitude user who triggers a newly instrumented event for the first time can appear as **resurrected**, not **new**. For example, Amplitude considers a user who was active on September 30, didn't fire the event during the week of Oct 1 to Oct 7 (previous interval), then fired it again on October 9 (current interval) a **resurrected** user during Oct 8 to Oct 14.
You also have **dormant users**, which the red bar represents. A dormant user is one who didn't log the event you specified, but who logged the specified event during the previous time period (day, week, or month). For example, Amplitude considers a user who was active on January 1st but wasn't active on January 2nd a dormant user on January 2nd.
### Breakdown table
Below the chart is a [breakdown table](https://amplitude.com/docs/analytics/charts/review-chart-data) of lifecycle data. You can export the data table as a .CSV file by clicking _Export CSV_.

## Switch between views
The Lifecycle chart has two other views: Dormant and Pulse.
### Dormant
The Dormant chart shows the distribution of dormant users for a particular day, week, or month. For example, a dormant new user during Oct 8 to Oct 14 is a user who was new during Oct 1 to Oct 7 but became dormant on October 8.
### Pulse
The Pulse chart shows the ratio of incoming (new and resurrected) users to outgoing (dormant) users for a particular day, week, or month. The ratio shows how many active users you gain for each user who goes dormant.
Pulse uses the following formula:
`(# of new users + # of resurrected users) / (# of dormant users)`
- **Pulse > 1** means you're gaining users faster than you're losing them. Your product is experiencing growth.
- **Pulse < 1** means you're losing more users than you're gaining. Your product isn't growing.
For example, in the chart below, pulse was 0.96 during the week of Oct 8 to Oct 14. You lost more users in that interval than you gained or resurrected.
================================================================================
# Lifecycle: track the growth of your product's user base
URL: https://amplitude.com/docs/analytics/charts/lifecycle/lifecycle-track-growth
================================================================================
# Lifecycle: track the growth of your product's user base
Amplitude's **Lifecycle** chart gives you a quick, easy-to-understand overview of the growth of your product's user base over time. Lifecycle does this by breaking out your active users into subgroups: new, current, and resurrected (formerly inactive) users. All your total active users fall into one of these categories. The chart also shows a count of your inactive, dormant users.
Much of the power of a lifecycle analysis depends on an understanding of your product's **critical event**. What's the one thing your users need to do to get value from your product? For a food delivery app, the critical event might be placing an order. For a healthcare app, it might be starting or booking a session. After you identify the critical event, you can build a Lifecycle chart around it and see how your user base interacts with the event over time.
You can also get a bird's-eye view of engagement and retention by building your analysis around any active event. This approach keeps you aware of broad-based trends in your product's usage patterns.
The goal is to grow your current and resurrected user counts, either by keeping users engaged or by giving them a reason to become active again. Watch your dormant users: if this category starts growing, you may have an engagement problem.
## Before you begin
Events don't appear in any Amplitude charts until instrumentation is complete, so finish that work first. Refer to the article on [building charts in Amplitude](https://amplitude.com/docs/get-started/helpful-definitions).
You'll get more from a lifecycle analysis if you fully understand your product's critical event and its usage frequency. Refer to the blog post on [the retention lifecycle framework](https://amplitude.com/blog/2016/11/02/retention-lifecycle-framework).
## Set up your lifecycle analysis
To build a Lifecycle chart, follow these steps:
1. In the Events Module, select the starting event. Choose a specific event that's instrumented in Amplitude, or tell Amplitude to consider any event as the starting event for this analysis by selecting _Any Event_ from the list of available events.
{% callout type="note" %}
You can only include one event in a lifecycle analysis.
{% /callout %}
2. To add properties to your starting event, click _+ where_, select the property name, and specify the property value you want.
3. In the Segmentation Module, identify the user segment you want to include in this analysis. You can import a previously saved segment by clicking _Saved Segments_ and selecting the one you want from the list. Otherwise, Amplitude assumes your analysis targets all users.
{% callout type="note" %}
You can only include one user segment in a lifecycle analysis.
{% /callout %}
4. If you don't want to import a previously saved user segment, you can build your own by adding properties. Click _Users_ next to _..performed by_ to choose the type of property to segment by (Users, org ID(s), or inventory ID(s)).
5. Click _Select property..._, choose the property to include, and specify the property value you want.
6. You can narrow your focus further by including only users who have performed certain actions. Click _Select event..._, then choose the event you want.
7. In the Metrics Module, set your **usage interval**. If a user fires your selected event within the usage interval, Amplitude considers them current. Otherwise, for the purposes of this analysis, they're considered dormant. Your chart displays the results in the interval you've selected.
This example shows a daily lifecycle chart with an interval of 7 days (August 1 to August 7). Each day includes blue and red buckets defined as active users (blue) versus dormant users (red). Users can't be in more than one bucket per interval.
Read on to learn how to [interpret your Lifecycle chart](https://amplitude.com/docs/analytics/charts/lifecycle/lifecycle-interpret).
================================================================================
# Amplitude SQL: Table schema and field shortcuts
URL: https://amplitude.com/docs/analytics/charts/other-charts/other-charts-amplitude-sql-schema
================================================================================
# Amplitude SQL: Table schema and field shortcuts
## Special field shortcuts
[Amplitude SQL](https://amplitude.com/docs/analytics/charts/other-charts/other-charts-amplitude-sql) is built directly into the Amplitude chart experience, so you can use the same Amplitude interface, including the [datepicker](https://help.amplitude.com/hc/en-us/articles/18133682827419-The-datepicker) and chart saving experience. Amplitude SQL also provides special fields for shortcuts:
- **`$date`:** Applies the time range from the datepicker and updates the query over time. It refers to the event time on the event and respects the project's timezone. Otherwise, Amplitude SQL returns data in UTC. Use it with **`$events`**.
- **`$events`:** The shorthand for the table in your current project. This table automatically handles [merged users](https://amplitude.com/docs/data/sources/instrument-track-unique-users). Use it with **`$date`**.
- **`$amplitude_id`:** The original Amplitude ID for the user. Use this field to automatically handle merged users.
## Table schema
Amplitude SQL uses a one-table schema. The `$events` table handles the [merged user](https://amplitude.com/docs/data/sources/instrument-track-unique-users) mappings automatically. The merged users table is also available to view, so you can quickly check the number of users Amplitude merged into one.
The following tables show the schema of `$events` and merged users.
### $events table
- **`$amplitude_id`**
- **Data type**: NUMBER(38,0)
- **Description**: The original Amplitude ID for the user. Use this field to automatically handle merged users.
- **`adid`**
- **Data type**: VARCHAR(16777216)
- **Description**: (Android) Google Play Services advertising ID (AdID). Amplitude usually wipes this after ingestion, so it's typically blank.
- **`amplitude_attribution_ids`**
- **Description**: Anonymized hash of the advertising IDs Amplitude stores for internal purposes. This appears if advertising IDs were sent, which proves that `adid`/`idfv` existed even though they're currently wiped.
- **`amplitude_event_type`**
- **Data type**: VARCHAR(16777216)
- **Description**: Amplitude-specific identifiers based on events Amplitude generates. This is a legacy field, so `event_type` should suffice for all queries.
- **`amplitude_id`**
- **Data type**: NUMBER(38,0)
- **Description**: An internal ID Amplitude uses to count unique users.
- **`app`**
- **Data type**: NUMBER(38,0)
- **Description**: Project ID found in your project's Settings page.
- **`city`**
- **Data type**: VARCHAR
- **Description**: City.
- **`client_event_time`**
- **Data type**: TIMESTAMP
- **Description**: Local timestamp (UTC) of when the device logged the event.
- **`client_upload_time`**
- **Data type**: TIMESTAMP
- **Description**: The local timestamp (UTC) of when the device uploaded the event.
- **`country`**
- **Data type**: VARCHAR
- **Description**: Country.
- **`data`**
- **Data type**: VARIANT
- **Description**: Dictionary that stores fields like `first_event` and `merged_amplitude_id`.
- **`device_brand`**
- **Data type**: VARCHAR(16777216)
- **Description**: Device brand.
- **`device_carrier`**
- **Data type**: VARCHAR(16777216)
- **Description**: Device carrier.
- **`device_family`**
- **Data type**: VARCHAR(16777216)
- **Description**: Device family.
- **`device_id`**
- **Data type**: VARCHAR(16777216)
- **Description**: The device-specific identifier.
- **`device_manufacturer`**
- **Data type**: VARCHAR(16777216)
- **Description**: Device manufacturer.
- **`device_model`**
- **Data type**: VARCHAR(16777216)
- **Description**: The device model.
- **`device_type`**
- **Data type**: VARCHAR(16777216)
- **Description**: Device type.
- **`dma`**
- **Data type**: VARCHAR(16777216)
- **Description**: Designated marketing area (DMA).
- **`event_id`**
- **Data type**: NUMBER(38,0)
- **Description**: A counter that distinguishes events.
- **`event_time`**
- **Data type**: TIMESTAMP
- **Description**:
- Amplitude timestamp (UTC), which is the `client_event_time` adjusted by the difference between `server_received_time` and `client_upload_time`. Specifically:
- `event_time = client_event_time + (server_received_time - client_upload_time)`
- Amplitude uses this timestamp to organize events on charts.
- If the difference between `server_received_time` and `client_upload_time` is less than 60 seconds, Amplitude doesn't adjust `event_time`, and it equals `client_event_time`.
- **`event_type`**
- **Data type**: VARCHAR(16777216)
- **Description**: The assigned type of event.
- **`followed_an_identify`**
- **Data type**: BOOLEAN
- **Description**: True if there was an identify event between this current SDK event and the last SDK event seen.
- **`groups`**
- **Data type**: VARIANT
- **Description**: Group types. Refer to the [Accounts documentation](https://amplitude.com/docs/analytics/account-level-reporting) for more information.
- **`idfa`**
- **Data type**: VARCHAR(16777216)
- **Description**: (iOS) Identifier for Advertiser. Amplitude usually wipes this after ingestion, so it's typically blank.
- **`ip_address`**
- **Data type**: VARCHAR(16777216)
- **Description**: IP address.
- **`location_lat`**
- **Data type**: FLOAT
- **Description**: Latitude.
- **`location_lng`**
- **Data type**: FLOAT
- **Description**: Longitude.
- **`os_name`**
- **Data type**: VARCHAR(16777216)
- **Description**: OS name.
- **`os_version`**
- **Data type**: VARCHAR(16777216)
- **Description**: OS version.
- **`paying`**
- **Data type**: VARCHAR
- **Description**: True if the user has ever logged any revenue, otherwise '(none)'. You can modify the property value through the Identify API.
- **`region`**
- **Data type**: VARCHAR
- **Description**: Region.
- **`server_upload_time`**
- **Data type**: TIMESTAMP
- **Description**: Amplitude timestamp (UTC) of when Amplitude servers received the event.
- **`session_id`**
- **Data type**: NUMBER(38,0)
- **Description**: The session start time in milliseconds since epoch.
- **`start_version`**
- **Data type**: VARCHAR
- **Description**: App version Amplitude first tracked the user on.
- **`user_id`**
- **Data type**: VARCHAR(16777216)
- **Description**: A readable ID you specify.
- **`uuid`**
- **Data type**: VARCHAR(16777216)
- **Description**: A unique identifier per row (event sent).
- **`version_name `**
- **Data type**: VARCHAR(16777216)
- **Description**: The app version.
### Merged users table
To learn how Amplitude tracks unique users, refer to [Track unique users](https://amplitude.com/docs/data/sources/instrument-track-unique-users).
| Column | Data type | Description |
| --------------------- | ------------ | ------------------------------------------------------------------------------------------------------------------ |
| `amplitude_id ` | NUMBER(38,0) | The Amplitude ID Amplitude is merging into a user's original Amplitude ID. |
| `merge_event_time` | TIMESTAMP | The time of the event when Amplitude associated a user's new Amplitude ID with their original Amplitude ID. |
| `merge_server_time` | TIMESTAMP | The server time of the event when Amplitude associated a user's new Amplitude ID with their original Amplitude ID. |
| `merged_amplitude_id` | NUMBER(38,0) | The originally assigned Amplitude ID when the user is first created. |
================================================================================
# Amplitude SQL: Getting started with Query
URL: https://amplitude.com/docs/analytics/charts/other-charts/other-charts-amplitude-sql
================================================================================
# Amplitude SQL: Getting started with Query
The Amplitude Query product lets you query your raw data through your Amplitude-managed [Snowflake](https://www.snowflake.net/) database. Query also includes a chart type called **Amplitude SQL** that lets you write custom SQL against your Amplitude data directly inside the Amplitude platform.
Amplitude loads data into Snowflake every 30 minutes.
{% callout type="note" %}
This feature isn't available in the EU.
{% /callout %}
## Getting started
Find Amplitude SQL through _Create > Chart > View additional chart types_. You can save it, share it, and add it to a dashboard like any other chart.
{% callout type="note" %}
This feature doesn't support queuing data for [Portfolio Views](https://amplitude.com/docs/admin/account-management/portfolio).
{% /callout %}
You can also connect directly to your Snowflake database through a terminal or third-party application like SQL Workbench or the [Snowflake connector for Python](https://docs.snowflake.net/manuals/user-guide/python-connector.html). [Contact Amplitude Support](https://support.amplitude.com) or your Success Manager for your Snowflake credentials.
## Set up and syntax
The Query package uses a [simplified table schema](https://amplitude.com/docs/analytics/charts/other-charts/other-charts-amplitude-sql-schema) for Snowflake and Amplitude SQL. The schema includes a **single table** you can reference with the shorthand `$events`.
To access other tables, use the full name, which you can find under _Show Schema_.
Query tables support unlimited data fields. Query stores custom user properties and event properties as [variants](https://docs.snowflake.net/manuals/sql-reference/data-types-semistructured.html#variant), which you can query as individual columns. Custom user properties have the prefix `user_properties:`, and event properties have the prefix `event_properties:`.
{% callout type="note" %}
If your user or event properties contain a period or a space, wrap the property name in quotes: `user_properties:"first name"`.
{% /callout %}
If you're searching for a certain value, wrap the property value in single quotes: `user_properties:"plan type"='enterprise'`.
By default, Amplitude SQL shows a simple SQL query for events your users performed in the past 30 days. The SQL syntax includes the following fields:
- `$date` as _Date_ (the date of the events).
- `COUNT(DISTINCT $amplitude_id)` with the alias _Uniques_ (count of unique users).
- `COUNT($amplitude_id)` as _Totals_ (total count of users).
The SQL syntax highlighting helps you distinguish SQL commands from the rest of your query.
Amplitude SQL also supports autocomplete of columns in the table.
## Query results
After you finish building your SQL query, click _Compute_ to run it. When your query finishes running:
- Query results appear in a data table.
- A time series chart of the results appears below the table.
Use the controls below the query editor to customize the time series visualization. Your options include all the fields you return in your SQL `SELECT` statement. For example, in the query above, these are _DATE_, _UNIQUES_, and _TOTALS_.
- **X-axis column:** Select what to use for the X-axis. This must be a time series.
- **Metric column:** Select a field returned by your SQL `SELECT` statement to plot on the Y-axis.
### Applying group-bys
To group the chart by a column, enter the column name in the _Label columns_ field, then click _Compute_.
### Sharing and saving queries
To export the results as a PNG, PDF, or CSV file, go to _More > Export_. You can also save your analysis and share it with your team, or add the visualizations you create to a dashboard in Amplitude.
{% callout type="note" %}
Data table results and `.CSV` exports have a limit of 1,000 rows.
{% /callout %}
Next, learn about [**special field shortcuts** to query your Snowflake data more quickly](https://amplitude.com/docs/analytics/charts/other-charts/other-charts-amplitude-sql-schema).
================================================================================
# User Composition: View your users by common properties
URL: https://amplitude.com/docs/analytics/charts/other-charts/other-charts-user-composition
================================================================================
# User Composition: View your users by common properties
The User Composition chart shows the breakdown of active users based on a single user property or group property. This grouped view provides insight into who your users are and what properties they share.
## Before you begin
Events don't appear in Amplitude charts until instrumentation is complete, so finish that first. For more information, review [building charts in Amplitude](https://amplitude.com/docs/get-started/helpful-definitions) and [the difference between user properties and event properties](https://amplitude.com/docs/data/user-properties-and-events).
## Set up a user composition analysis
Most Amplitude charts rely on the Events Module to build an analysis. The User Composition chart isn't an event-driven analysis and doesn't have an Events Module, so it works differently.
Instead of events, a user composition analysis relies on user properties or group properties. Select the user property or group property you're interested in, then define your user segments. The User Composition chart displays a breakdown of values for that property across the user segments you specified.
The example above shows a comparison of your product's users in the United States and Germany, broken out by the most recent value for the number of communities they've joined.
To build your own user composition analysis, follow these steps:
1. In the _Composition By_ Module, select the user property or group property you're interested in.
2. In the _Segment By_ Module, identify the user segment to include in this analysis. To import a previously saved segment, click _Saved_ and select the one you want from the list. Otherwise, Amplitude targets all users by default.
3. To build your own user segment instead, add properties. Click _+ Filter by_, choose the property to include, and specify the property value you're interested in.
4. To narrow the focus further to users who already performed certain actions, click _+ Performed_, then choose the event you're interested in.
5. Click _+ Add Segment_ to add another user segment, repeating steps 2 through 4.
6. In the _Measured As_ Module, specify the property values you're most interested in:
- **Most Recent Value**: Considers your users' most recent values of that property. Amplitude draws this value from a user's most recent active event. Users can only appear in one bucket when you select _Most Recent Value_.
- **All Values**: Includes every value your active users have had for the property during the time of your analysis. The User Composition chart only includes active users, so Amplitude doesn't return property values tied to inactive events.
- **Cross Property Values**: Shows sets of properties active users have had in the time range you selected. These buckets are mutually exclusive; users can only fall into one bucket.
7. Use the date picker to specify the timezone and set the time range of your analysis.
In all cases, Amplitude breaks out the top 13 values for your property and groups other values in the _Other_ bucket. The value in the center of the chart is the column sum value in the [breakdown data table](https://amplitude.com/docs/analytics/charts/review-chart-data) below the chart. It includes only users in the top 100 property value groups by user count.
You can also view your results as a bar graph.
You can always inspect the composition of your user groups from the [Microscope](https://amplitude.com/docs/analytics/microscope).
## Common questions
### I ran an Identify API call for a user. Why isn't this reflected in the User Composition Chart
An identify call updates the user property for events moving forward without sending an event. The Identify call appears at the top of a user's profile, but doesn't appear in the User Composition chart results until another "active" event is sent after the Identify call.
### I see the user property and value in the user profile. Why isn't it showing in User Composition
The property must be available in the most recent active event. If you updated the user property using the Identify API, the user profile shows the updated value. If the user hasn't performed an "active" event, User Composition uses the user property from the most recent active event.
### Why am I seeing a high volume of 'none' values
The property wasn't available when the most recent active event was performed. To learn more about why a user is counted under '(none)', refer to [this section](https://amplitude.com/docs/data/troubleshooting/missing-data#unexpected-values-in-user-counts).
### The account shows the user property isn't null. Why does it appear null in User Composition in the last 30 days
Accounts is a special case. Many users can tie to an account, and if all the users perform active events, the user property values change constantly.
### Why doesn't the chart display all property values
The User Composition chart displays the top 100 user property values with the highest user count, listed in the breakdown table. To export the table as a `.CSV` file, click _Export CSV_ in the Breakdown Table. The `.CSV` file has a limit of 10,000 rows, so you can get the top 10,000 user property values by user count.
================================================================================
# Analytics
URL: https://amplitude.com/docs/analytics
Updated: 2024-04-16
================================================================================
# Analytics
Amplitude Analytics turns event data into charts, cohorts, and dashboards that answer product questions without SQL. It runs 17 chart types over your behavioral data, groups users into reusable cohorts, and surfaces anomalies as they happen, so product teams find what changed, who it affected, and what to ship next.
Use Analytics when you need to quantify behavior across many users: conversion, retention, engagement, cohort comparison. If you need to watch a single user's session unfold to understand why they behaved that way, use [Session Replay](https://amplitude.com/docs/session-replay) instead.
{% outcomes heading="Explore Analytics" %}
{% outcome icon="LineChart" title="Answer product questions" href="https://amplitude.com/docs/analytics/charts/find-the-right-chart" %}
Pick from 17 chart types to investigate funnels, retention, journeys, and more.
{% /outcome %}
{% outcome icon="Users" title="Reuse the segments that matter" href="https://amplitude.com/docs/analytics/behavioral-cohorts" %}
Save a group of users once, then apply it across charts, experiments, and integrations.
{% /outcome %}
{% outcome icon="ClipboardList" title="Keep your team aligned" href="https://amplitude.com/docs/analytics/dashboard-create" %}
Bring related charts into one dashboard the team can review at a glance.
{% /outcome %}
{% outcome icon="Workflow" title="Collaborate on findings" href="https://amplitude.com/docs/analytics/workspace" %}
Group charts, cohorts, and notebooks in shared spaces so the right people can act on them.
{% /outcome %}
{% outcome icon="Zap" title="Catch unexpected shifts early" href="https://amplitude.com/docs/analytics/anomaly-forecast" %}
Surface anomalies automatically and trace each one back to the change that caused it.
{% /outcome %}
{% outcome icon="Target" title="Report on accounts, not just users" href="https://amplitude.com/docs/analytics/account-level-reporting" %}
Roll usage and revenue up to the company, team, or workspace for B2B analysis.
{% /outcome %}
{% /outcomes %}
## Chart types
Every analytical question maps to a chart type. Start with [Find the right chart](https://amplitude.com/docs/analytics/charts/find-the-right-chart) if you're not sure where to begin, or jump straight to one of the most-used chart types below.
{% outcomes heading="Pick a chart type" %}
{% outcome icon="LineChart" title="Track behavior over time" href="https://amplitude.com/docs/analytics/charts/event-segmentation/event-segmentation-build" %}
Use Event Segmentation to see how often users trigger an action and break results down by any property.
{% /outcome %}
{% outcome icon="Target" title="Find where users drop off" href="https://amplitude.com/docs/analytics/charts/funnel-analysis/funnel-analysis-build" %}
Use Funnel Analysis to measure conversion across a sequence of steps and pinpoint the leak.
{% /outcome %}
{% outcome icon="Users" title="Measure who comes back" href="https://amplitude.com/docs/analytics/charts/retention-analysis/retention-analysis-build" %}
Use Retention Analysis to see how well your product keeps users coming back over days, weeks, or months.
{% /outcome %}
{% outcome icon="Workflow" title="See the paths users take" href="https://amplitude.com/docs/analytics/charts/journeys/journeys-understand-paths" %}
Use Journeys to map what users do before and after a key event in your product.
{% /outcome %}
{% outcome icon="Eye" title="Spot your power features" href="https://amplitude.com/docs/analytics/charts/engagement-matrix/engagement-matrix-discover" %}
Use the Engagement Matrix to compare adoption and frequency side by side and find what hooks users.
{% /outcome %}
{% outcome icon="FlaskConical" title="Decide which variant won" href="https://amplitude.com/docs/analytics/charts/experiment-results/experiment-results-dig-deeper" %}
Use Experiment Results to evaluate A/B tests with statistical rigor and shared metric definitions.
{% /outcome %}
{% /outcomes %}
Go to [all chart types](https://amplitude.com/docs/analytics/charts/find-the-right-chart) to browse the full catalog.
## Cohorts
A cohort is a saved group of users who share a behavior or property. Build one once, then reuse it across charts and dashboards to track how a segment performs over time.
- [Create a cohort](https://amplitude.com/docs/analytics/create-cohorts) from a chart, a user list, or a property definition.
- [Compare cohorts](https://amplitude.com/docs/analytics/compare-cohorts) to measure how two or more segments differ on any metric.
- [Track cohort changes](https://amplitude.com/docs/analytics/track-cohort-changes) to watch segments grow or shrink over time.
## Dashboards
Dashboards bring multiple charts into one view. Use them to monitor product health, share recurring reports, or run a weekly team review.
- [Create a dashboard](https://amplitude.com/docs/analytics/dashboard-create) and add charts from anywhere in your workspace.
- [Set dashboard preferences](https://amplitude.com/docs/analytics/dashboard-preferences) for filters, time ranges, and comparisons.
- [Subscribe to a dashboard](https://amplitude.com/docs/analytics/dashboard-subscribe) to get scheduled snapshots in email or Slack.
## Share and collaborate
Analytics is more useful when your whole team can act on it. Organize work in spaces, capture findings in notebooks, and push charts into the tools your team already uses.
- [Collaborate with spaces](https://amplitude.com/docs/analytics/collaborate-with-spaces) to group related charts, cohorts, and dashboards.
- [Document findings in notebooks](https://amplitude.com/docs/analytics/notebooks) that blend charts, text, and images.
- [Integrate with Slack](https://amplitude.com/docs/analytics/integrate-slack), [Microsoft Teams](https://amplitude.com/docs/analytics/integrate-microsoft-teams), or [Miro](https://amplitude.com/docs/analytics/integrate-miro) to share charts where conversations happen.
- [Share externally](https://amplitude.com/docs/analytics/share-external) with clients or stakeholders who don't have an Amplitude seat.
## Start with common questions
Use these workflows when you need a reliable starting point for product analysis.
- [Analyze feature adoption](https://amplitude.com/docs/get-started/analyze-feature-adoption) to understand which features users discover and return to.
- [Understand conversion rate](https://amplitude.com/docs/get-started/understand-conversion-rate) to measure movement through a key workflow.
- [Analyze acquisition channels](https://amplitude.com/docs/get-started/analyze-acquisition-channels) to compare which sources bring valuable users.
- [Review user activity](https://amplitude.com/docs/get-started/understand-user-activity) to investigate behavior for a single user or account.
## Keep analysis reusable
Turn one-off analysis into shared assets that teams can use repeatedly.
- Save important charts to dashboards so teams monitor the same metrics.
- Use cohorts to make segments consistent across charts, experiments, and activation workflows.
- Add context in notebooks so stakeholders understand the question, method, and outcome.
- Organize related work in spaces to keep charts, cohorts, dashboards, and notebooks together.
{% academy-link
title="Getting Started with Amplitude Analytics"
url="https://academy.amplitude.com/path/getting-started-with-amplitude-analytics-learning-path"
description="Learn the most fundamental features of Amplitude Analytics, including cohorts."
/%}
================================================================================
# Chart basics in Amplitude
URL: https://amplitude.com/docs/analytics/charts/chart-basics
================================================================================
# Chart basics in Amplitude
## Before you begin
If you haven't done so yet, stop and read [how to create a chart in Amplitude](https://amplitude.com/docs/get-started/create-a-chart) before proceeding.
Also, keep in mind some features may require a certain subscription or a paid add-on:
- Create Dynamic Group Property is a paid add-on for Plus and above.
- Monitors are available to Enterprise and are a paid add-on for Growth.
- Collaboration features are accessible to all plans.
## Start from a template
From the new Chart screen or the chart switcher, click _Templates_ at the top of the left sidebar. On the Chart Templates panel, search for an existing template, filter by goal, or browse by chart type.
When you select a template, Amplitude prepopulates the chart definition. Save the chart directly, or edit it to better meet your requirements and then save.
{% callout type="note" heading="" %}
Chart templates rely on default events and properties and work best if you use Amplitude SDKs to instrument your applications or websites.
{% /callout %}
## Share your chart
To share your chart, click the link icon to copy the chart's URL to your clipboard, or click the share icon to open the _Share your analysis_ modal.
Enter the names or emails of the stakeholders you want to share the chart with, and set their access privileges with the dropdown to the right. When you're ready, click _Modify Owners_.
## Add your chart to a dashboard or notebook
To add your chart to a new or existing [dashboard](https://amplitude.com/docs/analytics/dashboard-create) or notebook, click _+ Add to_ and scroll down until you find the dashboard or notebook you want. You can also use this chart as the basis for creating a new dashboard or notebook.
## Add custom legend labels
You can edit the legend of your chart to make it more readable. This helps when, for example, you applied multiple group-bys to a chart and want to make it easy for viewers to understand what each segment refers to.
Click the legend label you want to change, then type in the description you want. However, the segment names in the breakdown data table below the chart don't change to reflect custom legend labels.
## Customize your chart's Y-axis
If the data that comprises your chart doesn't fit the default scale, customize the chart's Y-axis for better viewability.
To customize the Y-axis, click it on the chart. The Custom Y-axis modal appears.
{% callout type="note" heading="Applicable chart types" %}
Y-axis customization is available for Event Segmentation charts.
{% /callout %}
### Axis name and values
By default, the Y-axis name comes from the displayed measurement. For example, if your chart displays event totals, the axis name is `Totals`. When you need to share the chart or provide more context, enter a more descriptive name.
To help the data fit more cleanly on the chart, set minimum and maximum values. By default, a chart's Y-axis starts at zero. Sometimes, your data might be in a small range, but with higher values.
In the examples below, the chart on the left uses the default axis values, and the chart on the right has the minimum set to `10000` and the maximum set to `15000`.
Enable **Display data out of the min and max value** to ensure that if any data falls out of the range you set, it still appears on the chart. Otherwise, chart data extends only within that range.
Customize the unit of measure that appears on a chart to ensure that the chart represents the data accurately. Choose from:
- Raw number.
- Percent.
- Currency, which defaults to the [currency set at the project level](https://amplitude.com/docs/admin/account-management/currency-unit).
- Custom (add a prefix or suffix).
### Add a second Y-axis
If the chart displays more than one event, add a second Y-axis to ensure best visibility. For example, on a chart that tracks Weekly Active Users, if you add a second event that measures new users, add a second Y-axis to ensure best visibility for both.
In this example, Weekly Active Users, measured by `Any Active Event`, falls in the range of 12,000 to 13,500. Weekly New Users has a range between 5,500 and 6,000. Adding a second Y-axis ensures both events display with enough granularity to observe increases and decreases over time.
The second Y-axis supports the same customization options as the primary Y-axis.
{% callout type="note" heading="Dual Y-axis availability" %}
Dual-Y axis is available on event segmentation line charts.
{% /callout %}
## Switch projects or chart types
To switch the project you're viewing, click the project name in the title of the chart and select a different project. Your chart reflects the data of the newly selected project. The new chart matches the controls of the original chart as closely as possible and drops any events or properties not instrumented in the new project.
You can also switch the chart type. Click the chart type name and select a different type. You can choose to preserve the events or segments you've already added to your current chart.
## Chart cache times
Amplitude caches charts and requests. The cache time depends on the time interval (daily, weekly, monthly) and the number of days from the present day. Amplitude also caches CSV downloads from charts.
Cache time depends on the interval of the chart (for example, hourly, daily, or weekly), the interval length, and whether the chart is standalone or:
- on a dashboard.
- part of a CSV export.
- retrieved from a REST API call.
Dashboards, CSV exports, and REST API calls cache content longer than individual charts.
| Interval | Interval length | Chart cache time | Dashboard, CSV, REST call cache time |
| --------- | -------------------------- | ---------------- | ------------------------------------ |
| Realtime | -- | 5 minutes | 5 minutes |
| Hourly | -- | 5 minutes | 5 minutes |
| Daily | within the last 7 days | 10 minutes | 60 minutes |
| Daily | within the last 30 days | 60 minutes | 6 hours |
| Daily | within the last 180 days | 6 hours | 18 hours |
| Daily | greater than 180 days | 12 hours | 36 hours |
| Weekly | within the last 4 weeks | 60 minutes | 6 hours |
| Weekly | within the last 12 weeks | 6 hours | 12 hours |
| Weekly | greater than 12 weeks | 24 hours | 48 hours |
| Monthly | within the last 3 months | 6 hours | 18 hours |
| Monthly | within the last 6 months | 24 hours | 48 hours |
| Monthly | greater than 6 months | 48 hours | 96 hours |
| Quarterly | within the last 2 quarters | 6 hours | 18 hours |
| Quarterly | within the last 3 quarters | 24 hours | 72 hours |
| Quarterly | greater than 3 quarters | 48 hours | 96 hours |
| Yearly | -- | 48 hours | 96 hours |
During the time when Amplitude caches a chart's results, Amplitude doesn't automatically recompute the chart. Sometimes, after the cache time expires, Amplitude may still show cached results by default while it recomputes the chart in the background. Click **Refresh** to recompute a chart at any time.
{% callout type="note" %}
If you measure time on the date picker with the "between" option, the query times listed above apply to any range of that duration, not just the most recent. For instance, a chart generated in 2023 that examines monthly data collected between January 2020 and June 2020 (a six-month span that isn't the most recent six months) caches for 24 hours.
{% /callout %}
## Releases and annotations
Click the `+` icon to the right of the x-axis on a time series chart to add an annotation. Amplitude opens a modal where you can specify the date, add a description, and set the visibility. Annotations appear as vertical lines on your chart, and as numbers under the x-axis.
Annotations help you mark the date of a feature release or a marketing campaign. Remove annotations from your project's [Settings page](https://amplitude.com/docs/admin/account-management/account-settings).
Annotations have the following limitations:
- Only users with Admin or Manager permission levels can create annotations.
- Chart-specific annotations are only available for Event Segmentation and User Sessions charts.
- Annotations don't support public links and aren't accessible in dashboards or notebooks.
Releases represent a change in your product. For more information, refer to [Releases](https://amplitude.com/docs/analytics/releases).
### Give annotations a date range
Provide a start date and end date for your annotation to apply it to specific dates and times. For example, if you ran a marketing campaign from March 4 through March 8, specify those dates in the annotation so it reflects the entire campaign.
### Categorize an annotation
Specify an annotation's category to group it with similar annotations. Annotation categories let you show and hide groups of annotations, so your chart displays only what you want.
Manage annotation categories in Project Settings. When you create a category, you can specify whether it displays by default on all charts within a project, or if users must manually enable it on each chart.
## Keyboard shortcuts
{% callout type="note" heading="Shortcut availability" %}
Keyboard shortcuts are available on the creation page for all charts, except Data Tables.
{% /callout %}
| Shortcut | Action | Description |
| ----------- | ------------------------------------ | -------------------------------------------------------------------------------------------------------------------------------------------------------------------------------------------------------------------------------------------------------------------------- |
| `Shift`+`e` | Event quick select | Opens the event selector, letting you add a new event to the chart definition. |
| `Shift`+`f` | Event filter select | Equivalent to clicking `+Filter` in an event block. If the chart definition has no events, this shortcut does nothing. If the chart definition has multiple event blocks, this shortcut selects the last event in the list and opens the property dropdown for that event. |
| `Shift`+`g` | Group by quick select | Equivalent to clicking `+Group` in an event block. If the chart definition has no events, this shortcut does nothing. If the chart definition has multiple event blocks, this shortcut selects the last event in the list and opens the property dropdown for that event. |
| `Shift`+`r` | Refresh chart data | Equivalent to clicking `Refresh` on a chart. Refreshes the chart's source data. |
| `Shift`+`s` | Save chart | Equivalent to clicking `Save` on a chart. If the chart is new and unsaved, the Save Chart modal appears. On an existing chart, the chart saves with no confirmation. |
| `Shift`+`d` | Copy chart | Equivalent to clicking `Copy` to duplicate the chart in a new tab. If the chart is new and unsaved, this shortcut does nothing. |
| `Shift`+`u` | Copy URL | Equivalent to clicking `Copy URL`. |
| `Shift`+`t` | Add to | Equivalent to clicking `Add to`. |
| `Shift`+`n` | New chart | Equivalent to clicking `New chart`. |
| `Shift`+`?` | Toggle shortcut modal | This shortcut hides or displays a modal that describes the available keyboard shortcuts. |
| `Return` | Add to chart definition | When you hover on an event or property, press `return` to add it to the chart definition. |
| `Space` | Toggle selection of a property value | When you hover over a property value, press `space` to select or deselect it. |
================================================================================
# Build charts in Amplitude: Add events
URL: https://amplitude.com/docs/analytics/charts/build-charts-add-events
================================================================================
# Build charts in Amplitude: Add events
Amplitude builds charts using three modules located along the left side of your chart. Their specific function can change from chart to chart, but they follow some general guidelines.
1. At the top is the **Events module**. This is where you select the Amplitude events and metrics you want to include in your analysis.
2. In the middle is the **Measured As module**. The appearance and features of the Measured As module vary widely from chart to chart, so this article focuses on the Events module and the Segment By module instead. To learn about the Measured As module for a specific chart type, refer to the documentation for that chart.
3. At the bottom is the **Segment By module**, where you define and identify the specific subsets of users you want to learn about.
This article explains how to use the Events module. When you're done, refer to [adding user segments to your Amplitude charts](https://amplitude.com/docs/analytics/charts/build-charts-add-user-segments).
{% callout type="note" %}
Because they're meant for different types of analyses, Amplitude's [User Composition](https://amplitude.com/docs/analytics/charts/compass/compass-aha-moment) charts don't have an Events module. For more information on how to build analyses with these charts, follow the links above.
{% /callout %}
## Events module
**Events** are the heart of any Amplitude analysis. An event is an action a user takes in your product: pushing a button, completing a level, or making a payment. Aim to track between 15 and 200 events to develop a full understanding of how users engage with your app.
Amplitude can also track inactive events, or actions the end user doesn't take but that still occur within the app or website. One example is a push notification the app sends.
### Add events to your analysis
To add an event to an analysis, go to the Events module and click _Add Event or Metric_. Amplitude opens a list of all available events. You can add up to 10 events to an analysis. Amplitude must instrument an event before it appears in this list.
Amplitude provides five default events:
- **Top Global Events:** Queries on the top 10 active events by volume with the highest counts, over the selected time period, for **all users in your project**.
- **Top Events for Segment:** Queries on the top 10 active events by volume with the highest counts, over the selected time period, for **a particular user segment** defined in the Segment By module.
- **Any Active Event:** Queries on any **active** event over the selected time period. For example, to view your daily active users, select _Any Active Event_ and change the measurement in the Measured As module to _Uniques_.
- **Any Event:** Queries on **any** event over the selected time period. This includes [non-active](https://amplitude.com/docs/admin/account-management/account-settings) events.
- **New User:** Queries on new users over the selected time period. For example, to view daily new users, select _New User_ and change the measurement in the Measured As module to _Uniques_. Amplitude considers a user "new" the moment they send their first event to Amplitude.
When you use `[Amplitude] New User` in a chart, the chart looks at all events that new users triggered during the interval when they were new. For example, in an Event Segmentation chart, if you compare uniques to event totals, you may see a higher count of events than the number of new users.
### Use wildcards to search for events
You can search the search bar for events to add to your chart. If you don't know the exact name or spelling of an event, use a wildcard or combination of wildcards to find what you're looking for. The following wildcards are available in dropdown searches:
- `*`: Use an asterisk to search for an unknown number of characters. Place it at the start or end of a search term.
- `?`: Use a question mark to search for a single alphabetic character. Place it in any position of a search term.
- `[ ]`: Use brackets to search for the characters within the brackets in any order.
Some example wildcard searches are:
- `*save` - returns results that end with "save".
- `chart*` - returns results that start with "chart".
- `*chart*` - returns results that include "chart" anywhere in the string.
- `c???t*` - returns results that start with "c", contain any three letters, followed by "t" (strings that start with "chart" or "create").
- `dat[ae]*` - returns all results that **start** with "dat" + "e" **or** "a" (strings that start with "date" or "data").
{% callout type="note" heading="Enable wildcard search" %}
To use wildcard search, change the operator to `*(glob match)`.
{% /callout %}
### Add conditions to your events
You can refine your events with the **Filter by** or **Group-by** specifications. Both use event properties or user properties to affect your analysis, but they do so in different ways.
The _Filter by_ specification conditions your event on an event property or user property that you select. Amplitude limits the results to those with properties that matched the conditions you specified at the time the event triggered.
For example, to limit the scope of an event to those triggered from an iPhone, use the _Filter by_ specification to tell Amplitude that, for this event, you only want to count those that came from an iPhone.
The properties you have available depend on the nature of your product, and on the specific information you need to understand a particular event. Common event properties among Amplitude customers include cause, description, category, type, duration, level, % completed, count, source, status, from, number, lives, authenticated, error, rank, action, and mode. Common examples of user properties include locale, referral source, plan type, number of photos uploaded, number of units of in-game currency, and current level in a game.
If you have more than one event in your Events module, using the _Filter by_ specification on one event doesn't affect any of the others. Add conditions to each event individually.
The _Group-by_ specification also uses these properties. Instead of limiting your results to those that match your conditions, _Group-by_ breaks out your results based on the property you selected. For example, if you tell Amplitude to group by country, the chart shows results for each individual country (or, more technically, for each instrumented value of that property for which any results exist).
Note the following:
- You can group each event by a maximum of five properties, and the graph displays the top 12 property value counts by default.
- Amplitude records event and user properties **at the time an event triggers**. This can lead to situations where the returned value for the property is no longer the current value.
## Next step: Add user segments
Now that you understand how the Event module works in Amplitude, refer to [adding user segments to your charts](https://amplitude.com/docs/analytics/charts/build-charts-add-user-segments).
================================================================================
# Build charts in Amplitude: Add user segments
URL: https://amplitude.com/docs/analytics/charts/build-charts-add-user-segments
================================================================================
# Build charts in Amplitude: Add user segments
{% callout type="note" %}
If you haven't done so already, read [adding events to your Amplitude charts](https://amplitude.com/docs/analytics/charts/build-charts-add-events) before continuing with this article.
{% /callout %}
Events are only half of the equation. You also need to specify the users whose behavior you want to analyze.
Amplitude's **Segmentation Module** lets you create groups of users to analyze. These groups are called **segments**, and they can be as broad as your entire user base, or narrowly tailored to match a highly specific set of user properties.
{% callout type="note" %}
Because they're designed for different types of analyses, Amplitude's [Personas](https://amplitude.com/docs/analytics/charts/compass/compass-aha-moment) charts don't have a Segmentation Module. For more information on how to build analyses with these charts, follow the links above.
{% /callout %}
Also, refer to the [advanced features available through the Segmentation Module](https://amplitude.com/docs/analytics/charts/build-charts-segmentation-module).
### Create a user segment
First, decide which category of users your segment draws from: **any users**, **active users**, or **new users**.
{% callout type="note" title="Active and New user segmentation" %}
The **Active Users** and **New Users** options are available in [Event Segmentation](https://amplitude.com/docs/analytics/charts/event-segmentation/event-segmentation-build), [Funnel](https://amplitude.com/docs/analytics/charts/funnel-analysis/funnel-analysis-build), [Retention](https://amplitude.com/docs/analytics/charts/retention-analysis/retention-analysis-build), and [Sessions](https://amplitude.com/docs/analytics/charts/user-sessions/user-sessions-track-engagement-frequency) charts. Other chart types only support **Any Users**.
{% /callout %}
If you select _Any Users_, your analysis includes all users who triggered the events you want to analyze. This is the broadest choice.
To narrow the focus, select _Active Users_. Amplitude defines an active user as one who **logged at least one event** during a specified time range. When you choose this option, Amplitude looks at events that any user triggered during the days, weeks, or months your analysis covers.
The _New User_ option is more specific. Amplitude defines a new user as a user who logs an event in Amplitude for the first time. When you choose this option, Amplitude looks at events these users triggered during the interval (days, weeks, or months) in which the user was new.
For example, if a user was new on July 17, and you set your analysis interval to _Daily_, only the events that triggered on that same day, July 17, appear on the chart, regardless of whether that user also triggered events the next day.
You can use [Accounts](https://amplitude.com/docs/analytics/account-level-reporting) to select any custom groups you have instrumented in place of _Users_.
After you decide how to measure your users, use _Filter by_ and _Performed_ clauses to define your user segments.
You have now created your first user segment.
### Filters
To learn how to use filters to refine your user segments into more precise analytical tools, refer to [Modify a user segment](https://amplitude.com/docs/analytics/charts/build-charts-modify-user-segment).
### Add more segments
Amplitude doesn't limit your analysis to a single segment. To add more segments, click _+ Add Segment_. Here, there are two segments to compare: one that includes users in the United States, and one that includes users in Brazil.
### Group by user property
The Segmentation Module also includes a _Group Segment by_ function.
If you have only one event in your analysis, it doesn't matter if you use _group by_ in the Events Module or _Group Segment by_ in the Segmentation Module. But if your analysis includes **more than one event**, adding a _Group Segment by_ condition in the Segmentation Module applies that condition to all the events in your analysis. If you don't want that, apply a _group-by_ condition in the Events Module on an event-by-event basis.
{% callout type="note" %}
Using _group-by_ in the Segmentation Module limits your analysis to one user segment. If you need more user segments, apply _group by_ conditions to each event in the Events Module.
{% /callout %}
Your chart displays the top five segments by the selected measurement. You can add or remove segments from the chart in the data table below it. In the example below, the analysis groups by device family. The graph shows the number of daily active users in the last 30 days, grouped by the device family they used.
{% callout type="note" %}
Users can fall into multiple segments if they have multiple values for a property in this time period.
{% /callout %}
You can also add more than one _group by_ condition.
### Save a user segment
After you create a user segment, you can save it for reuse in another analysis. Saved user segments are globally available to other team members.
To save a user segment, click _Saved_. Next, click _Save Segment_ and follow the prompts.
You can also search for previously saved segments in the _Saved_ dropdown. Select the one you need from the list to load it.
To make a segment your default segment (the one Amplitude automatically loads when you create a new chart), click _Set as default_ next to the segment's name.
================================================================================
# Build charts in Amplitude: Modify a user segment
URL: https://amplitude.com/docs/analytics/charts/build-charts-modify-user-segment
================================================================================
# Build charts in Amplitude: Modify a user segment
The segment you created in the [Add user segments](https://amplitude.com/docs/analytics/charts/build-charts-add-user-segments) article is functional. Depending on the breadth of your analysis, it may be all you need. But many Amplitude users prefer to drill down further and create user segments based on specific combinations of **properties**. The Segmentation Module gives you the tools to define user segments with a high level of precision.
## Add a filter
When you add properties to a segment definition, remember that you're specifying the property values at the time of each event.
For example, imagine you add the filter `where City = Amsterdam` to your segment. If a user triggers an event where `City = Amsterdam`, but more recently triggered an event where `Country = United Kingdom`, Amplitude includes only the event that matches your filter in the chart. To query an event based on a user property, set the user property before the user logs that event.
If you segment by `Device ID`, `Event ID`, `Latitude`, `Longitude`, `Server Upload Time`, `Session ID`, `User ID`, or `ID`, specify the exact values you're looking for. You can't group by the user properties `Event ID`, `Latitude`, `Longitude`, `Server Upload Time`, or `ID`.
To apply a filter to your user segment, follow these steps:
1. Click _+ Filter by_ under your user segment. Don't click _+ Filter by_ underneath your event.
2. In the _Select property..._ menu, select the [user property](https://amplitude.com/docs/data/user-properties-and-events) or [behavioral cohort](https://amplitude.com/docs/analytics/behavioral-cohorts) you want to add to the filter.
3. Select the value of the user property you want to include (or specifically exclude).
4. Select the operator that defines how the filter uses this property: `is`, `is not`, `contains`, `does not contain`, `less/greater than (or equal to)`, `set is`, `set is not`, `set contains`, `set does not contain`, and `glob match`.
{% callout type="note" %}
If you enter more than one property value, the operator acts as an OR statement. To create an `AND` statement, add another _Filter by_ clause.
{% /callout %}
- **`is` or `is not`**: Include or exclude exact property values in your segment definition.
- **`contains` or `does not contain`**: Include or exclude property values with a specific substring in your segment definition. This operator isn't case sensitive.
- **`starts with` or `does not start with`**: Include or exclude property values with a specific prefix string in your segment definition. This operator isn't case sensitive.
- **`set is` or `set is not`**: Include or exclude specific array sets.
For example, define a segment that includes users with an array set of `Movies` and `Music` as `Interests {=} Movies, Music.` This means the user's array set must exactly include `Movies` and `Music`. If the user only has `Movies`, they don't meet the definition. Likewise, if the user has `Sports`, `Movies`, and `Music`, they don't meet the definition.
- **`set contains` or `set does not contain`**: These operators match list values that contain all the selected values, or list values that don't contain all the selected values, respectively. Use these operators to view people who belong to multiple A/B test groups.
- To exclude certain values from a property array, use `set does not contain`.
- If you select multiple values, these operators apply an `AND` statement to the values. For example, with the condition `set does not contain group A and group B`, a user must be NOT in group A AND group B to qualify for exclusion. To apply an OR statement, use multiple `set does not contain` filters.
- **`glob match` or `glob does not match`**: Amplitude has a simple version of regular expressions that lets you match or exclude strings like `/org/*/chart/*` where `*` is a wildcard. You can also enter strings like `*[0-9]` or `[!a-z]*` to match values that end in a digit or start with a non-letter. For more information, refer to the [Wikipedia article on Glob](<https://en.wikipedia.org/wiki/Glob_(programming)>).
- The asterisk only matches non-`/` characters. To search for strings that contain `/`, use two asterisks instead. For example, if your URL format is `www.example.com/blogs/blog_id`, and you want to filter all URLs that contain the word "blog," use glob match and enter `**blog**`.
For more information, refer to [how array operators work in Amplitude](https://amplitude.com/docs/analytics/charts/array-operators).
To change the name of your segment, hover over its current name and click it. This also changes the segment's name in any charts that already use it.
### Using an OR clause
To filter on multiple values of the same property, add more values in the _Select value(s)..._ box. This creates an OR clause in the segment's definition. In the screenshot below, the segment now includes users who fired an event in the United States OR the United Kingdom OR Japan.
{% callout type="note" %}
This doesn't apply when you set your operator to `set is` or `set is not`.
{% /callout %}
### Using an AND clause
Adding another filter creates an AND clause in your segment definition. To add more filters, click _+ Filter by_.
================================================================================
# Microscope: Explore individual data points in your charts
URL: https://amplitude.com/docs/analytics/microscope
================================================================================
# Microscope: Explore individual data points in your charts
Microscope inspects the users behind a single data point in a chart. Hover over a data point to open a menu where you can view the user list, view user streams and paths, watch session replays, create a cohort, and drill into the point. The available options depend on your Amplitude plan. Use Microscope when you want to identify which users produced a specific value in a chart instead of only the aggregate number.
## Availability and limitations
- Microscope streams only highlight events selected in the chart's [Events Module](https://amplitude.com/docs/analytics/charts/build-charts-add-events) that occur during the date range selected.
- _View Groups_ and _Download Groups_ are only available to customers who have the [Accounts add-on](https://amplitude.com/docs/analytics/account-level-reporting).
- **Custom formula charts don't support Microscope.** If you use [custom formulas](https://amplitude.com/docs/analytics/charts/event-segmentation/event-segmentation-custom-formulas) in Event Segmentation or Data Table charts, Microscope functionality isn't available for those data points.
## Distributions
For distributions, Amplitude provides the [Probability density function (PDF)](https://en.wikipedia.org/wiki/Probability_density_function) and [Cumulative distribution function (CDF)](https://en.wikipedia.org/wiki/Cumulative_distribution_function). Use PDF and CDF when comparing distributions with different sample sizes. Amplitude normalizes them, making the comparison fair.
When comparing by counts, taller bars in one distribution may reflect a larger sample size rather than a more likely value, which can mislead your analysis. Use a normalized histogram to avoid this.
The CDF also approximates other percentiles. For example, in the time to convert chart, Amplitude shows a vertical dashed line for the median. To find the approximate 75th percentile, find the smallest bin with a `CDF >= 75%`. Use smaller bin widths for a better approximation.
## Use Microscope
To open the Microscope menu, click a data point in any supported chart.
From here, depending on the chart type, you can:
- **Zoom In** on a data point by going down to the next time interval granularity, for example when you click a data point in a weekly chart and zoom in, the chart updates to daily granularity, and the time period in the date picker update to be the same as the time period of the original data point.
- **Filter By** to quickly drill down and focus on the series.
- **Show User Journeys** to create a [Journeys](https://amplitude.com/docs/analytics/charts/journeys/journeys-understand-paths) chart based on the users in that data point.
- **View User Streams** to view individual streams from users in that data point.
- **Watch Session Replays** of those user sessions.
- **Exclude** or remove distracting or irrelevant series from the analysis.
- **Create a cohort** of the users that make up the selected data point, which you can then further analyze by applying this [cohort](https://amplitude.com/docs/analytics/behavioral-cohorts) to other charts in Amplitude. When you apply a group in the Segmentation Module, you can also create a group cohort from here.
- **View a list of all the users** in the selected data point. Click a user ID to open that user's profile in the _User Activity_ tab. If you are a customer with [account-level reporting](https://amplitude.com/docs/analytics/account-level-reporting), you can also use Microscope to view the groups in a data point. Click any group to view a list of users in that group, in the _User Activity_ tab.
- **Download all the users** (up to 1 million) that make up the selected data point, in the form of a .CSV file. This file also contains each user's most-recently sent user property values.
- **Add users to...** a [Feature Flag](https://amplitude.com/docs/feature-experiment/workflow/feature-flag-rollouts), [Feature Experiment](https://amplitude.com/docs/feature-experiment/workflow/create), [Web Experiment](https://amplitude.com/docs/web-experiment/set-up-a-web-experiment), [Guide, or Survey](https://amplitude.com/docs/guides-and-surveys).
{% callout type="note" heading="" %}
If you are conducting [account-level reporting](https://amplitude.com/docs/analytics/account-level-reporting) analysis, you can opt to download the groups included in a certain data point or bucket. The .CSV file includes the following four columns:
- `group_id`: The unique ID of a particular group name (much like Amplitude ID). When Amplitude sees a new group value or group name, Amplitude assigns a unique `group_id` to the unique group name.
- `group_name`: The group property value (like the user ID). For example, if your count-by was for the group `Company`, then the `group_name` could be `Amplitude`. You set the `group_name` values.
- `first_time`: The Unix timestamp denoting when Amplitude first saw that group.
- `creator_amplitude_id`: The `amplitude_id` that sent the event creating the group.
Additionally, you can **show user paths**, **view user streams**, and **explore conversion drivers**. Read more about them below.
{% /callout %}
## Show user paths
This option runs a [Pathfinder Users](https://amplitude.com/docs/analytics/charts/journeys/journeys-understand-paths) report based on user activity for the selected data point. This is useful for when you want to quickly see the top event paths users take after a specific event or on a particular day.
For example, you can view users who dropped off after a specific event or step in a [Funnel Analysis](https://amplitude.com/docs/analytics/charts/funnel-analysis/funnel-analysis-build) chart and see what were the top paths the dropped off users performed, instead of successfully completing the funnel.
{% callout type="note" heading="" %}
The maximum date range for _Show User Paths_ is 30 days.
{% /callout %}
To analyze what users are doing instead of triggering the `Purchase Song or Video` event in the funnel chart below, click the drop-off data point for the `Purchase
Song or Video` event and use Microscope's _Show User Journeys_ feature to view the top event paths users take after the `Select Song or Video` event:
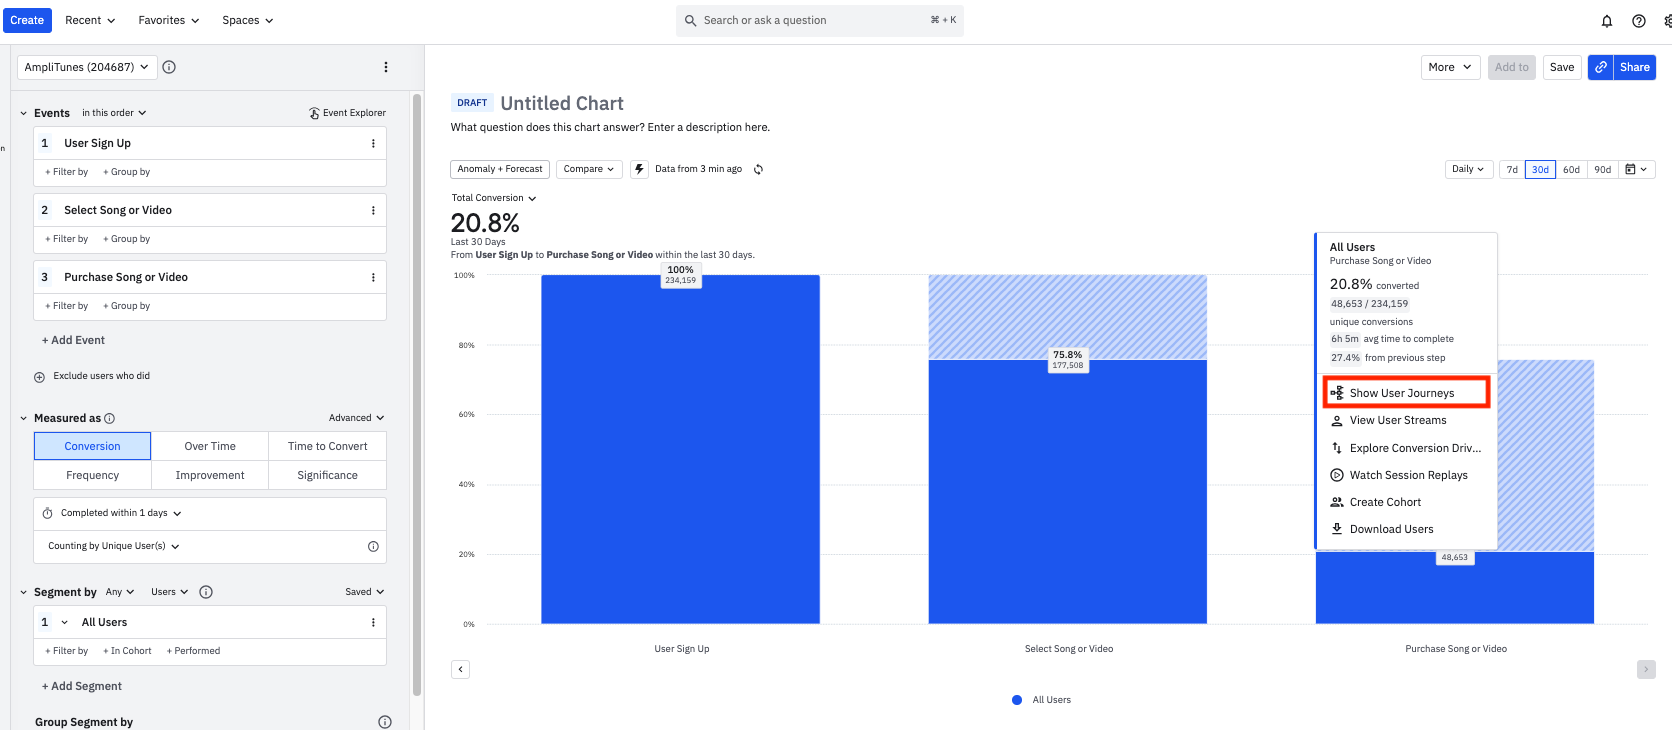
By showing user paths, it becomes clear that after triggering the `Select Song or Video` event, many users trigger either the `Download Song or Video` event or the `Play Song or Video` event. Now you can hypothesize ways to improve the product's purchase flow, like sending users an in-app message to purchase a subscription at exactly the right moment.
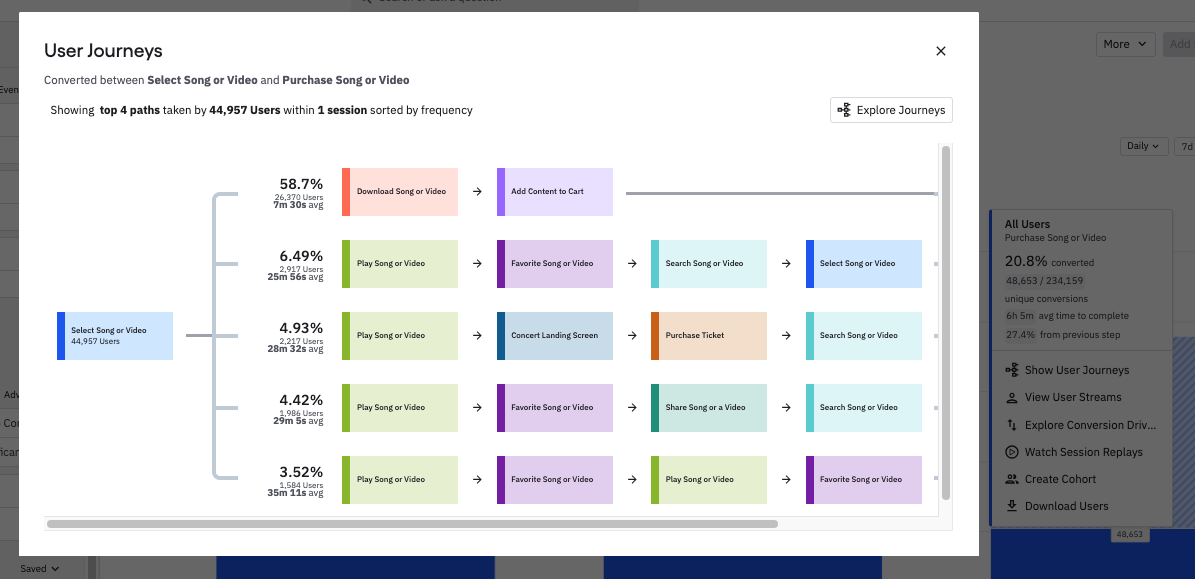
{% callout type="note" heading="" %}
Pathfinder and Journey maps don't support Microscope actions such as `View user streams` and `Create cohort` for drop-off user paths.
{% /callout %}
## View user streams
When using Microscope in an [Event Segmentation](https://amplitude.com/docs/analytics/charts/event-segmentation/event-segmentation-build) chart, you can view individual user streams in aggregate by selecting _View User Streams_. All a user's events within the date range of the data point are visible here, as well as:
- Up to 25 events before the beginning of the time range.
- Up to 50 events **after** the start of the time range.
If you select a specific event, Microscope highlights it in the user's stream. You can also choose to show certain event properties as well. Click a user ID or any event in a user's stream to view their profile in the _[User Activity](https://amplitude.com/docs/analytics/user-data-lookup)_ tab.
{% callout type="note" heading="" %}
Event names with a _sparkle_ icon indicate that Amplitude has generated a name to provide more context around the action a user is taking. These are Autocapture events ingested as `Page Viewed`, `Element Clicked`, and `Element Changed`, but Amplitude uses property information to make them more valuable in the event stream. Click any of them to understand their ingested name and properties.
{% /callout %}
### View Session Replay from a user's event stream
If you are a Growth or an Enterprise customer with the Session Replay add-on, you can launch a session replay from Microscope in the following Amplitude charts: Event Segmentation, Funnel Analysis, Journeys, Experiment, and User Sessions.
While using Microscope in a supported chart, click on _View User Streams_. Check the _Streams with session replays_ box in the modal that appears. Then click _Play Session_ in the event stream to play the events directly below it. Check out more about the Session Replay feature, and learn about restrictions in the supported charts, in this help center article. Alternatively, you can click _Watch Session Replay_.
## Explore conversion drivers
In a funnel chart, click into any step after the initial event to enable the **Explore Conversion Drivers** feature. This allows you to explore events triggered **between** funnel steps for converted and dropped-off users.
For more information, go to [Amplitude's conversion drivers feature](https://amplitude.com/docs/analytics/charts/funnel-analysis/funnel-analysis-identify-conversion-drivers).
## Create a guide or survey from Microscope
On a chart, click a data point to launch Microscope. Select _Guide these users_ or _Survey these users_ to create a guide or survey targeted to that set of users. Amplitude then:
- Creates a cohort based on the chart criteria and data.
- Creates and launches a new guide or survey, with the cohort added to targeting.
================================================================================
# Event Explorer: View event streams in real time
URL: https://amplitude.com/docs/analytics/charts/event-explorer
================================================================================
# Event Explorer: View event streams in real time
Even with clean data, knowing which data to use in an analysis isn't always straightforward. Taxonomies can be unclear or counterintuitive, out-of-date events can persist long after deprecation, and events can break unexpectedly.
{% callout type="note" %}
You may also find [this video](https://academy.amplitude.com/use-event-explorer-to-learn-about-your-taxonomy/1311428) on Event Explorer helpful.
{% /callout %}
Amplitude's Event Explorer helps you overcome these and similar challenges by surfacing events and properties in real time for any user flow, so you can see which data is relevant.
Find your test account ID and click through the area of your product you want to analyze. Event Explorer shows the events you're triggering **as you trigger them**. You'll know which events correspond with the user actions you're analyzing, and you can add them to any Amplitude chart.
{% callout type="note" heading="" %}
Free and Plus plan users have limited Event Explorer functionality.
{% /callout %}
## Who should use Event Explorer
Event Explorer helps Amplitude users who:
- Are unsure which events to use or fear drawing wrong conclusions from the wrong data.
- Are part of a large organization with a centralized team that handles most of the instrumentation others rely on for analysis.
- Are unfamiliar with their data's taxonomy, work with poor or messy data, or maintain data dictionaries that are hard to keep current.
- Want to conduct QA on instrumentation-related issues.
- Help other team members decide which events to use in their analyses.
## Event Explorer use cases
Event Explorer is most useful in two situations:
- Help new and existing users choose the right events to answer their questions and self-serve the taxonomy questions the analytics team typically handles. For example, a company can use Event Explorer to help Amplitude users in different organizations learn the taxonomy the central team created, or to onboard new Amplitude users on how to build an accurate chart or find an event.
- Quickly **verify and QA instrumentation** in real time to identify gaps or issues with events. An engineer can use Event Explorer to verify whether they implemented a new event correctly. Data and engineering teams can see in real time whether any given event fires properly, either within a flow or on its own.
## View a real-time event stream using Event Explorer
To use Event Explorer to view events as they're triggered, follow these steps:
1. Click _+ Add new user_ from the target dropdown.
2. In the modal that opens, search for a user by [IP address, user ID, device ID,](#find-your-user-id-or-device-id) or user property. IP address is the default search criteria, and returns all users with the same IP address.
If you haven't set up targeting, the _Event Explorer Setup_ modal opens when you click _Event Explorer_.
1. Choose the user you want from your search results and click _Save User For Targeting_. You only need to save a user once.
2. Log into or open your product with your IP address, user ID, or device ID, and begin using it. Open Event Explorer for the project the user is triggering events in, and watch as the events roll in, in near-real time.
{% callout type="note" %}
If you send events to Amplitude periodically (for example, batched), they don't appear until Amplitude receives them.
{% /callout %}
`Identify` events aren't visible in Event Explorer. However, you can view them with the Amplitude Event Explorer Chrome extension.
After you find the events most relevant to your analysis, add them directly to any Amplitude chart. To do so, follow these steps:
1. In Event Explorer, click the event you want to include. The properties of that event appear in the right frame.
2. Select any properties you want to include in your analysis. (This step is optional.)
3. Click _Add Event to Chart_ to add this event.
### Find your user ID or device ID
After you locate your ID, Amplitude remembers it for you, so you don't need to find it again. This ID must have been active in your product during the last 30 days.
{% callout type="note" %}
In some situations, you may want to surface events in Event Explorer while logged out. To do this, search by your device ID or IP address to locate yourself.
{% /callout %}
Methods you can use to locate your ID include:
- Searching by IP address: this is Amplitude's default search ID.
- Searching by device ID or user ID: click _IP address_ and choose either _User ID_ or _Device ID_ from the dropdown.
- Searching on any user property: click _IP address_ and choose a different property from the dropdown (for example, choose _email_ and enter your email).
**Other methods:**
- The [Instrumentation Explorer](https://amplitude.com/docs/data/chrome-extension-debug) Chrome plugin, which works for the JS SDK, identifies your user ID.
- If you use Amplitude's iOS SDK or Android SDK, [a tool](https://amplitude.com/docs/analytics/debug-analytics) identifies your user ID and device ID when running under a debug version.
- Your company may have an internal tool or method to find your ID. Consider asking someone in your organization for tips.
- Try firing events that your users are unlikely to trigger. Then use _Filter by events_ on the [User Lookup](https://amplitude.com/docs/analytics/user-data-lookup) page to locate the ID that fired those events. This is your user ID.
================================================================================
# Review chart data with the breakdown table
URL: https://amplitude.com/docs/analytics/charts/review-chart-data
================================================================================
# Review chart data with the breakdown table
Sometimes visualizing data in a chart isn't enough for all analyses. To review, interact with, and export the data that makes up your charts in Amplitude Analytics, use the **breakdown table**, which appears below your chart.
Some charts—including Data Tables, Personas, Pathfinder, Pathfinder Users, Compass, and Experiment Results—don't have a breakdown table.
## Sort your table's fields
The columns, or fields, in your breakdown table depend on multiple factors, such as:
- The type of chart you use for analysis.
- The type and number of events.
- The type of measurement.
- Whether you use segment or group-by properties.
Some columns in your breakdown table are **fixed**. A fixed column appears at the far left, highlighted in blue, and Amplitude adds or appends it depending on your analysis. For example, adding an additional event, segment, or segment group-by creates a new fixed column, but adding an additional group-by to an event only appends the event's group-by fixed column. Resize a fixed column by dragging the divider between the columns to the right or the left.
Click a column name in your breakdown table to sort the column in descending or ascending order.
{% callout type="note" %}
Amplitude sorts fixed column values as strings.
{% /callout %}
## Change the summary column
Some charts, such as Segmentation and User Sessions charts, include a **summary column**. Modify the summary column by choosing a **row aggregate** in the dropdown menu. Select from average, median, change (first row minus last row values), or sum (available only for event totals, properties, and formulas).
## Set the number of series to display
Each breakdown table interacts with your charts, and vice versa. A change to the breakdown table, such as clicking the checkbox by a row name, modifies the chart by removing the unclicked series. Clicking checkboxes near the far-left field name selects or unselects all rows, and modifies the chart by adding or removing all data.
{% callout type="note" %}
Regardless of what you select or unselect in the breakdown table, the exported .CSV includes **all** rows and values.
{% /callout %}
## Modify the table breakdown
Select the specific number of series or rows you want to display in your breakdown table. Click the _Breakdown by:_ dropdown to choose a default or enter a numerical value between 1-30. As long as it's saved, the _Breakdown by:_ selection persists through sorting and refreshing, and applies to any dashboards that include your chart. When Amplitude receives new data, the top values or events update automatically.
To turn off a _Breakdown by:_ selection, ensure only the values and events you want to keep maintain a checkmark. Your Breakdown table then notes that only a specific number are selected. Turn it back on by clicking the _Reset to top..._ hyperlink.
## Export to .CSV
Click to export your breakdown table as a .CSV file. There are [.CSV download limits](https://amplitude.com/docs/data/csv-import-export) that depend on the type of chart and group-by in use.
## Search for values
Use the search bar to search for any values in your breakdown table. Searches start automatically once you enter a value, and update when you modify or remove the value. A search result doesn't impact the chart or the data you can export.
================================================================================
# Pruning and ordering of data in Amplitude Analytics
URL: https://amplitude.com/docs/analytics/charts/prune-and-order-data
================================================================================
# Pruning and ordering of data in Amplitude Analytics
In data analytics, data **pruning** refers to the process of removing or reducing the size of a dataset by eliminating irrelevant, redundant, or low-value data. The goal of data pruning is to streamline the dataset and make it more manageable, efficient, and meaningful for analysis.
**Ordering**, also known as sorting, refers to the process of arranging data in a particular sequence based on one or more criteria. Ordered data makes patterns, trends, and relationships within the dataset easier to identify.
This article explains how Amplitude Analytics performs pruning and ordering in its charts.
## Why Amplitude Analytics prunes and orders data
Amplitude Analytics prunes and orders a chart's data whenever a group-by clause returns an excessive number of values. Imagine a chart that groups by user IDs. Since these are distinct values, this query returns every user ID in the segment you're analyzing. Including all of these values on a single chart makes it difficult to read and almost impossible to gain value from.
To maintain chart performance in these cases, Amplitude **prunes** values from the chart. For charts with one group-by clause, you can view a maximum of 100 values. For charts with two group-by clauses, you can view a maximum of 500 values.
[Read more about the group-by and how it affects pruning and ordering](https://amplitude.com/docs/analytics/charts/group-by).
Amplitude Analytics also **orders** chart results by displaying the top values only. Analytics compares user activity in the chart's time-frame to determine which values are the top values.
For example, imagine you have one chart looking at users over the last 30 days, and another looking at the last seven days. By definition, a top active user has triggered the event more often than other users. So for each of these time frames, the top users are likely different, since a top active user in the seven-day time frame might have been less active (either overall or relative to others in that larger user population) over the 30-day time frame.
{% callout type="note" %}
Amplitude Analytics prunes results **before** applying any other filters on the chart. This includes cohorts.
{% /callout %}
## View your pruned results
There are a few ways to view the query results pruned from a chart:
- **Apply more filters**: This narrows down the pool of results and surfaces more of the values you want to view.
- **Export your results**: Through the .CSV download (maximum 10,000 values) or the Dashboard REST API (maximum 20,000 values).
- **Use a single column in Data Tables**: When grouping by a property in a Data Table, using one group-by column (rather than multiple) gives you the fullest result set. With a single column, Amplitude can rank using the actual metric instead of an approximation.
## Chart-specific considerations
### Event Segmentation
- When viewing the Uniques tab in an Event Segmentation chart, all users display once and only once. There are no top users to surface.
### Funnel Analysis
- If Amplitude Analytics has pruned users on your Funnel Analysis chart, the conversion rate might seem higher than expected. This is because it's based on fewer users.
### Data Tables with persisted properties or attribution
When your Data Table includes **persisted properties** or **attribution metrics** (like last-touch), the ranking logic works differently from standard group-bys, which can make results feel off.
**How standard ranking works:** For a plain group-by with a standard metric (like Uniques or Totals), Amplitude ranks groups using the same metric it displays. The top 100 rows are genuinely the top 100 by the metric you care about.
**How ranking works for persisted properties and attribution:** Running the actual computation—assigning last-touch credit, or resolving a persisted property across a user's full event history—is expensive. Amplitude can't afford to run it just to decide which values to keep. Instead, Amplitude substitutes a cheaper proxy. It ranks groups using a plain event segmentation on "Any Event" with totals, asking "which property values appear most often across all events?" rather than "which values rank highest in my actual metric?"
This means the values Amplitude keeps may not be the ones you'd expect. Amplitude may exclude property values that rank highly in your actual metric because they're less common across all events, while including common-but-low-value groups.
**Practical implications:**
- Totals may appear lower than expected if Amplitude pruned high-value rows from the result set.
- Reordering columns (sorting by a different column) triggers a recomputation and can surface different rows. Expect this behavior.
- You can't view exactly what Amplitude pruned. Identifying pruned values requires running the full computation that pruning avoids.
{% callout type="tip" heading="Get the most complete results" %}
Use a single column (one group-by) in your Data Table when working with persisted properties or attribution metrics. With a single column, Amplitude can use the actual metric for ranking instead of a proxy, giving you the most accurate and complete result set.
{% /callout %}
================================================================================
# Customize your chart's colors
URL: https://amplitude.com/docs/analytics/charts/customize-your-charts-colors
================================================================================
# Customize your chart's colors
Update the color theme of your charts in Amplitude to match your brand's colors or give a chart a different look and feel.
## Apply a theme to a new or existing chart
1. On any individual chart, click _More_ above the chart, and select _Change Chart Color Theme_. The Change theme panel appears.
2. Select a default or org-level theme, or create your own.
3. Save the chart to apply the theme.
{% callout type="note" heading="Chart-level themes" %}
Themes you apply to charts apply to that chart only.
{% /callout %}
## Create and edit chart themes
From the Change theme panel, click _+ Create color theme_. Your organization's default theme serves as the starting point for your new theme.
Provide a theme name and add or edit colors. Use the color picker, or enter a hex value to select a color. Click _Save Theme_ to create the theme, or _Cancel_ to go back to the Change theme panel.
Themes can have between 8 and 16 colors.
### Edit or copy an existing theme
From the Change theme panel, click the pencil icon on any theme you created to edit it, or click _Copy theme_ on any theme to create a new theme based on that existing theme.
Click _Delete_ on any theme you created to remove it.
## Organization-level themes
Org administrators can set the default theme and create, edit, or delete an organization's themes.
To access organization-level themes:
1. Navigate to _Gear icon > Organization settings_.
2. Click _Chart Color Themes_.
3. Click _+_ to create a new theme, or select an existing theme and click _Apply theme to all charts_ to set it as a default.
================================================================================
# Identify users with similar behaviors
URL: https://amplitude.com/docs/analytics/behavioral-cohorts
================================================================================
# Identify users with similar behaviors
A behavioral cohort groups users by the actions they take in your product within a specific time window, such as users who watched three episodes the day they signed up. Amplitude supports two cohort types: [predictive cohorts](https://amplitude.com/docs/analytics/predictive/predictions), which use machine learning to forecast future behavior, and behavioral cohorts, which match users against event-based rules you define.
Use a behavioral cohort when the rule for membership is an observed action, like "completed checkout twice last week." Use a predictive cohort instead when you want Amplitude to forecast who is likely to convert, churn, or take an action.
You need at least one defined cohort before you can use one in a chart. If you haven't built one yet, go to [Define a new cohort](https://amplitude.com/docs/analytics/define-cohort) first.
## Behavioral cohort restrictions
- Organizations on the Plus plan have a limit of five behavioral cohorts.
After you create a cohort, you can add it as a segment in many Amplitude charts.
Examples of behavioral cohorts include:
- Users who watch three consecutive episodes of a TV show in the first day after signing up for a video streaming service
- Users who enable push notifications during onboarding
- Android users who abandoned their carts on an e-commerce site in the last month
Behavioral data reveals how engagement with your product affects retention, conversion, revenue, and other business outcomes.
Cohorts are useful across the Amplitude platform. To segment your data by cohorts, select **Cohort** in the [Segmentation Module](https://amplitude.com/docs/analytics/charts/build-charts-add-user-segments), and then choose the cohort from the dropdown list.
For any chart or query that segments on a cohort, the segmented cohort automatically recomputes whenever the chart generates. You can manually recompute the cohort at any time by clicking the refresh icon.
If you have the [Accounts add-on](https://amplitude.com/docs/analytics/account-level-reporting), you can apply a group-level cohort instead of a cohort of users. When you select a specific group type, only the cohorts it contains appear in the drop-down list on the right side of the equals sign:
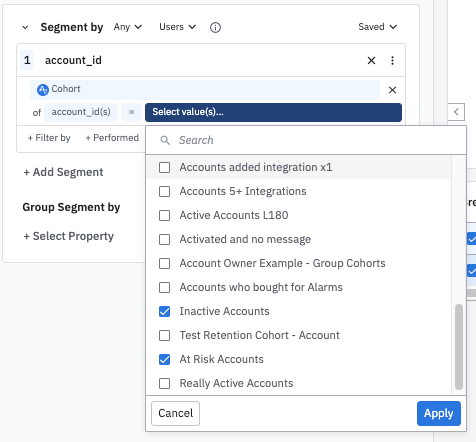
You can also create a chart using the cohort directly from the Cohort page.
================================================================================
# Define a new cohort
URL: https://amplitude.com/docs/analytics/define-cohort
================================================================================
# Define a new cohort
A [behavioral cohort](https://amplitude.com/docs/analytics/behavioral-cohorts) groups users by the actions they take in your product within a set time window, such as everyone who completed checkout twice in the last week. This page walks through defining a cohort from scratch on the new cohort page, where you combine event, property, propensity, and group conditions into a single membership rule. To build a cohort from a chart data point, a CSV file, or inline in the Segmentation module instead, go to [Create cohorts](https://amplitude.com/docs/analytics/create-cohorts).
## Define the cohort
To define a new [cohort](https://amplitude.com/docs/analytics/behavioral-cohorts), follow these steps:
1. Click _Create > Cohort_. This opens the new cohort page, where you can set cohort parameters, upload a CSV of users into a new behavioral cohort, select and edit a predictive cohort template, or [create a prediction for a predictive cohort](https://amplitude.com/docs/analytics/predictive/predictions).
2. You can click any of the conditions (performed event, had been active, had been new, had property, or had propensity) listed to begin defining your cohort. However, since this is a behavioral cohort, let's start by clicking _...performed event_. You can add other conditions to your cohort definition later.
3. Click _Select event..._ and select the event you're interested in.
4. Begin setting the parameters that define your behavioral cohort:
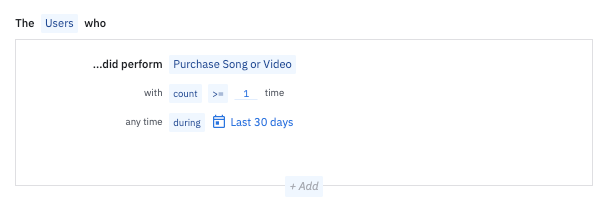
First, tell Amplitude how to count events. The **with** dropdown includes six options:
- **Count.** The number of times users trigger your event. For example, all users who triggered Favorite Song or Video more than five times during the last 30 days. Refer to the [Behavioral cohorts FAQ](https://help.amplitude.com/hc/en-us/articles/4402840043789) to learn more about creating a cohort of users who lack user properties or didn't perform an event.
- **Relative count.** Amplitude compares two different event frequencies. For example, all users who triggered Play Song or Video at a greater frequency than Favorite Song or Video during the last 30 days. You have the option to add "where" clauses for both events under comparison.
- **Total sum of property.** Filters for users who triggered events with a particular event or user property sum. These event or user properties must have numerical values. For example, all users in the last 30 days who triggered Play or Search Song with total Duration value greater than 60 seconds.
- **Distinct values of property.** Filters event or user properties down to a specific value or set of values. For example, only users who favorited a song or video on more than one device.
- **Historical count.** Your cohort contains users who triggered the event a specific number of times, between one and five. Refer to [how Historical Count works in Amplitude](https://amplitude.com/docs/analytics/historical-count-1) to learn more.
- **Count in interval**. Filter for users who triggered the event at least one time on each of the number of distinct days within a given interval. This enables you to specify behavior that occurred within distinct days in a defined time period. For example, you could filter for users who triggered the event at least once on each of a certain number of distinct days (you define how many) within a given interval. This differs from daily, weekly, or monthly behavior, which doesn't require the behavior to occur on different days.
{% callout type="note" %}
When you use an interval cohort as a segment in a chart, Amplitude evaluates the cohort for each time bucket. For each bucket in the chart (for example, each day in a daily chart), Amplitude checks whether the user meets the interval criteria for that specific bucket and includes them in that bucket's results. This means a user can appear in some time buckets but not others. The overall (collapsed) value represents the union of all users across all time buckets, not only users who meet the criteria in every bucket.
{% /callout %}
Refer to [how stickiness analysis works in Amplitude](https://amplitude.com/docs/analytics/charts/stickiness/stickiness-interpret) for more information.
5. Set the **operator** (equal to, greater than, less than, and so on) and the **value** (such as the count value) of this parameter.
6. Tell Amplitude when these events must have taken place. The **any time** dropdown includes these options:
- **During.** Includes all events triggered within the **date range** you choose in the date picker. You can use a range between two specific dates or a dynamic range, like _Last 30 Days_. In the latter case, the range updates every day and drops users who haven't triggered the event in X number of days from the cohort.
- **Since.** Includes all events triggered since the **calendar date** you choose in the date picker.
- **Within.** Looks at events triggered within each cohort member's X days of first use. This is useful when you're interested in the group of users who triggered a specific event within X days of becoming a new user.
7. You can add more events by clicking **...then** and repeating the previous steps.
Adding an event using **...then** means users must trigger both events in the specified order to qualify for the cohort. If you want to add another event **without** requiring users trigger them in a specific order, use **+ Add**, as described in the next step.
8. Add an _...or_ clause, or add another event, property, propensity, cohort, or new user. To view options for an Or clause, hover over the cohort definition. To view options for adding to your cohort definition, click _+ Add_ below your current cohort definition.
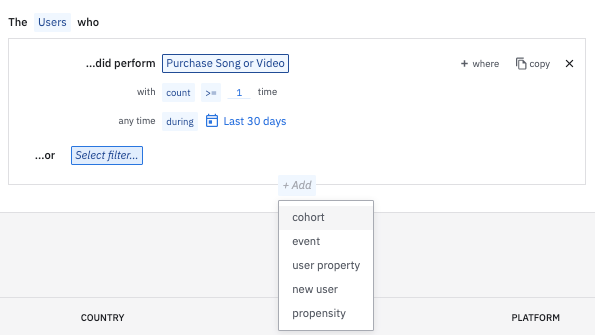
When you add a condition using an _Or_ clause, Amplitude includes users who meet **either** of those conditions. When you add to your cohort definition with _+ Add_, Amplitude treats that as an _And_ clause: A user must meet **both** conditions to be included in the cohort.
When you use _+ Add_ to add components to your cohort, you can specify inclusion or exclusion. Select _did not_ for events, user properties, and propensities; _not part_ for cohorts; and _had not been_ for new users.
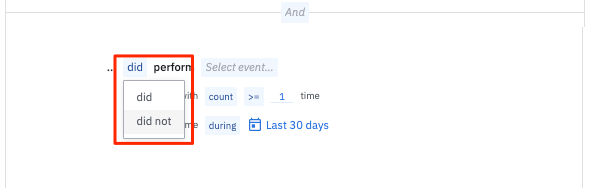
Amplitude excludes items that meet the exclusion condition from the cohort, even if the items meet all other specified conditions.
In this example, the cohort contains users who triggered the Play or Search Song event more than eight times, triggered the Favorited a Song or Video event more than four times between April 1 and April 30, and are from the United States.
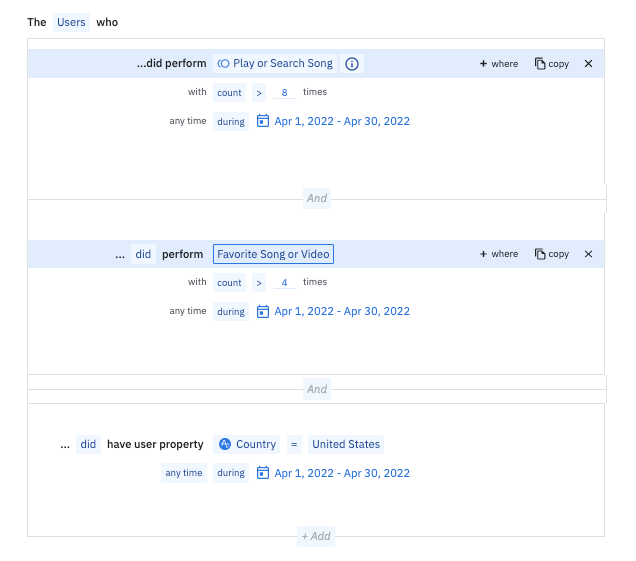
{% callout type="note" heading="" %}
For the most accurate results, put a date range around any user properties you include.
{% /callout %}
## User property clauses
When you include a user property condition in a cohort, Amplitude evaluates user properties instead of events. Amplitude includes users who had a specific value for a specific user property at a certain time. Properties and events use different options:
- **Most recently:** This selects only users whose **most recent value** for the user property you're interested in matches the value you've specified. This value comes from a user's most recent active event. This is useful if you have a user property where the values change frequently, but you want the cohort to look at the most recent value only. For example, you might want to only include users whose push notifications are enabled, since many new users (those in their first 30 days) may not have enabled them yet.
{% callout type="note" heading="" %}
For numerical property values, Amplitude interprets a missing value as 0.
{% /callout %}
- **Any time:** This selects users who had the specified value for the user property you're interested in at **any time in the date range** you select. For example, users who had the Country property of United States anytime during the last 30 days: Even if some users may have left the United States (which would mean their most recent Country property value is different), this cohort definition would still include them.
## Group-level cohorts
If you have instrumented group types, you can create group cohorts from the cohort detail page (where you define or upload a cohort). To do this, when defining your cohort, select the group name on the left side of the definition.
When applying the group cohort to a chart, add the group by clicking _+ Filter by_, and then _Cohort_. Then select the group name from the list.
Group cohorts are compatible with all Amplitude chart types except Personas and Compass.
================================================================================
# Compare and manage your behavioral cohorts
URL: https://amplitude.com/docs/analytics/compare-cohorts
================================================================================
# Compare and manage your behavioral cohorts
Cohort comparison shows how a behavioral cohort overlaps with another cohort or with all active users from the last 30 days. It surfaces side-by-side composition by user property, plus retention, average events, and active counts, so you can tell what makes one cohort different from another.
Use cohort comparison when you already have two saved cohorts (or one cohort and the active-user baseline) and want to know how they differ. If you want to define a cohort first, build it on the [Behavioral Cohorts](https://amplitude.com/docs/analytics/behavioral-cohorts) page instead.
## Compare your cohorts
Open any cohort to compare it against active users by default, then pick a second cohort or property to slice on. You can also choose user properties for side-by-side composition.
In the [Behavioral Cohorts](https://amplitude.com/docs/analytics/behavioral-cohorts) tab, click the title of a cohort to open the comparison analysis.
To view cohorts, go to _Amplitude > Users > Cohorts_.
## Manage your cohorts
You can mark cohorts you own as **discoverable** or **unlisted**. Any other user in your organization can find discoverable cohorts. Unlisted cohorts are only available to you, admins, managers, and people with a direct link to the cohort. Discoverable cohorts have a green globe icon, while unlisted cohorts have a disabled toggle.
### View where a cohort is used
The **Used by** tab shows where Amplitude uses this cohort. This helps you understand the impact of changes to a cohort before you make them.
To view which parts of Amplitude use a specific cohort, open the cohort and select the **Used by** tab. The tab displays:
- **Charts**: Analytics charts that segment by this cohort.
- **Cohorts**: Other cohorts that reference this cohort in their definition.
- **Experiments**: Feature experiments and web experiments that target this cohort.
- **Flags**: Feature flags that target this cohort.
- **Guides & Surveys**: Guides and surveys that target this cohort.
- **Predictions**: [Predictive cohorts](https://amplitude.com/docs/analytics/predictive/predictions) that use this cohort.
This visibility helps you avoid unintended consequences when modifying or archiving cohorts that are actively used in targeting or analysis.
### Archive a cohort
To archive a cohort, click _More > Archive_. To restore an archived cohort, click _More > Unarchive_.
### Delete a cohort
Only the owner of a cohort can archive and delete a cohort.
To delete a cohort, archive it first. After you archive the cohort, confirm the deletion before Amplitude removes it permanently.
### Transfer ownership of a cohort
You can transfer ownership of cohorts you own to others in your organization. You can also add more owners to a cohort. Admins and managers can transfer ownership of other people's cohorts and add owners to a cohort.
### Download a cohort as CSV
You can download any cohort as a CSV file. When you download, you can choose which user property columns to include instead of downloading every user property that exists in your project.
Selective column downloads always deliver the file by email, regardless of cohort size. Amplitude sends the download link to your account email address when the file is ready. Full-column downloads for cohorts under 10,000 users complete immediately in your browser. CSV exports from the UI support a maximum cohort size of 1 million users. For larger cohorts, use the [Behavioral Cohorts API](https://amplitude.com/docs/apis/analytics/behavioral-cohorts), which supports up to 2 million users.
{% callout type="note" heading="" %}
Group properties appear in the column selector but aren't included in the downloaded file.
{% /callout %}
To download a cohort as a CSV:
1. Open the cohort you want to download.
2. Click **Export CSV**.
3. In the **Columns** selector, choose whether to export only the columns currently displayed in the table or all configured user properties.
4. Click **Export CSV**.
================================================================================
# Create cohorts with Microscope, file import, or the Segmentation module
URL: https://amplitude.com/docs/analytics/create-cohorts
================================================================================
# Create cohorts with Microscope, file import, or the Segmentation module
A cohort is a reusable group of users that you can apply across your charts. You can create one from an existing chart data point with [Microscope](https://amplitude.com/docs/analytics/microscope), by importing a CSV or text file of user or Amplitude IDs, or inline in the Segmentation module of most chart types. These methods produce mostly static cohorts, though a few chart types still let you create behavioral cohorts. To define a behavioral cohort from scratch with your own conditions instead, go to [Define a new cohort](https://amplitude.com/docs/analytics/define-cohort).
## Create cohorts with Microscope
[Microscope's](https://amplitude.com/docs/analytics/microscope) _Create Cohort_ option lets you create a cohort that contains all users captured by the data point you selected. These are usually static cohorts. For some chart types, like basic retention and funnel analyses, you can still create [behavioral cohorts](https://amplitude.com/docs/analytics/behavioral-cohorts), but static fields are disabled.
Microscope can also create a group cohort from a data point with groups applied.
Cohorts created from within Microscope are static under the following scenarios:
- Composition with cross property values
- Retention if you have multiple returning events
- Usage interval view in retention
- Retention with calendar alignment for charts of weekly or higher intervals
- Funnels with exclusion events
- Funnels that hold a property constant
- Funnels with Combine Events Inline
- Funnels with Compare Events at Step
- Distribution views in funnels (Time to Convert + Frequency)
- Event segmentation for properties (PropSum + PropAvg)
- Any chart depending on a different cohort
## Import a cohort from a file
You can create a static cohort of users or groups by uploading a CSV or text file of [user IDs](https://amplitude.com/docs/get-started/identify-users) or Amplitude IDs. To upload a file, navigate to _Cohorts & Audiences_ and click _Import from CSV_.
If you have the [Accounts](https://amplitude.com/docs/analytics/account-level-reporting) add-on, you can also create a cohort of groups. The file must contain one ID per line, and can't contain any other text or extra spaces. The file size must be under 100MB.
If a user ID doesn't exist, Amplitude skips the user ID and doesn't include that user in the cohort. If you upload Amplitude IDs, all Amplitude IDs must be valid.
A properly formatted file has no header row, contains values only in the leftmost column, and doesn't include extra spaces or characters.
The following example shows an improperly formatted file.
After you select a file, specify whether the file contains Amplitude IDs, user IDs, or groups.
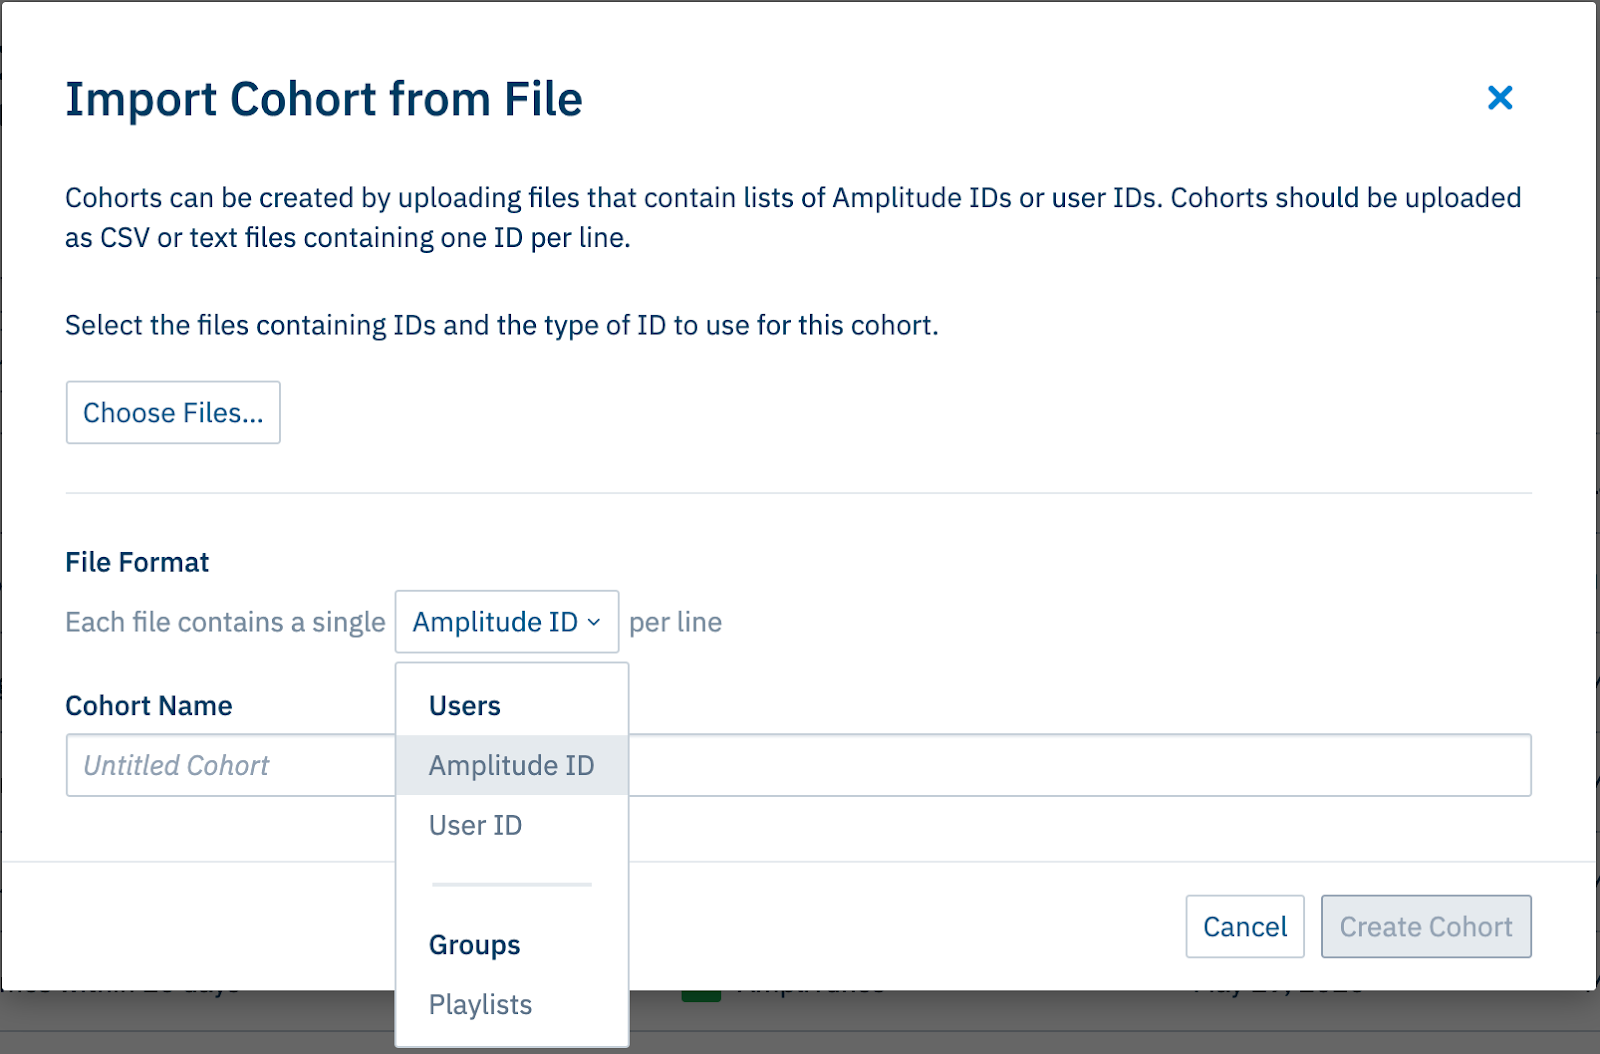
### Replace a cohort from a file
You can replace your manually uploaded cohorts. This lets you update your cohort in place, and avoid changing all your charts to point to a new cohort.
## Inline behavioral cohorts and interval cohorts
You can create simple behavioral cohorts directly within the Segmentation module of all Amplitude chart types except Compass. This lets you create a behavioral cohort in the context of a specific chart without navigating away to the [Behavioral Cohorts tab](https://amplitude.com/docs/analytics/behavioral-cohorts).
To do this, click _+ Performed_.
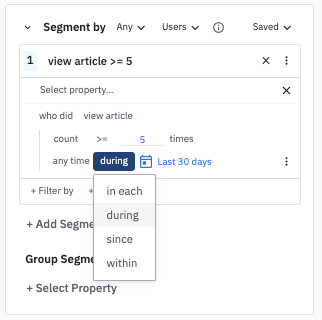
Use this to filter your charts for users who have triggered certain events.
One difference between an inline cohort and one created on the Behavioral Cohorts tab is the _in each_ clause. The _in each_ clause filters for users who triggered the selected event a certain number of times within the time interval you specify, creating interval cohorts.
For example, this cohort would filter this [Event Segmentation](https://amplitude.com/docs/analytics/charts/event-segmentation/event-segmentation-build) chart for users in the last four weeks who triggered `Download Song or Video` at least three times in a given week:
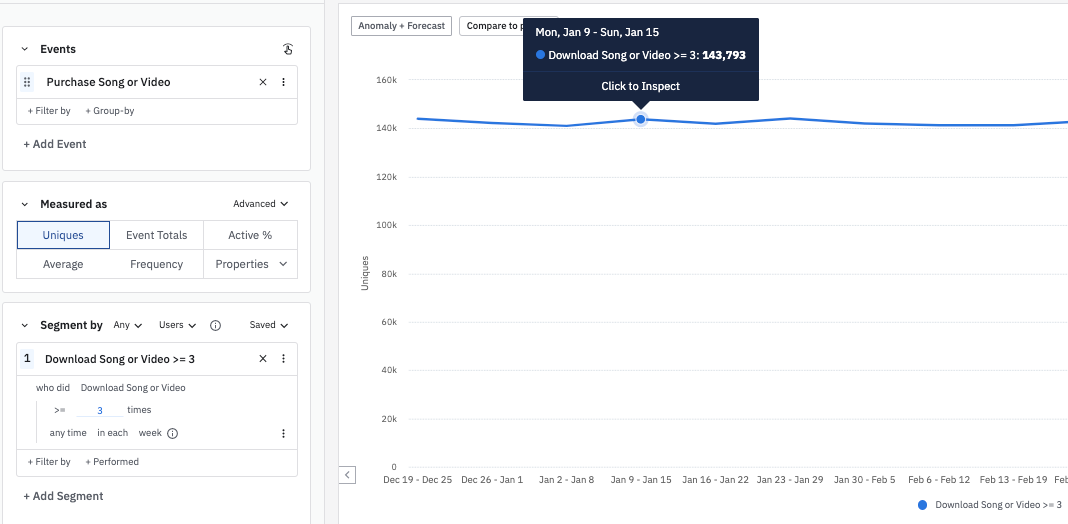
Of those users, 143,793 downloaded three or more songs or videos during the week of January 9th **and** triggered the `Purchase Song or Video` event.
Use inline cohorts to measure cohort populations over time. For example, an important milestone in your product might be playing five or more songs longer than three minutes in a single day. This is your highly engaged cohort.
From there, you can add additional _where_ filters to specify event properties or user property conditions. By looking at this behavior in each interval, you can measure the population of your highly engaged cohort over time.
{% callout type="note" %}
Amplitude evaluates interval cohorts for each time bucket in a chart. For each bucket (for example, each day), Amplitude includes users who meet the interval criteria for that specific bucket. A user can appear in some buckets but not others. The overall (collapsed) value is the union of all qualifying users across all buckets, not only users who qualify in every bucket.
{% /callout %}
Next, learn how to [compare and manage your behavioral cohorts](https://amplitude.com/docs/analytics/compare-cohorts).
================================================================================
# Track changes in your cohort populations over time
URL: https://amplitude.com/docs/analytics/track-cohort-changes
================================================================================
# Track changes in your cohort populations over time
Amplitude's cohort population over time chart shows how many users match a behavioral cohort definition on each day across a set time range. Use it to track whether a cohort, such as power users or paying users, grows, shrinks, or holds steady after you release features or launch campaigns.
Cohort population over time is part of Amplitude's [Behavioral Cohorts](https://amplitude.com/docs/analytics/behavioral-cohorts) feature.
To view changes in a cohort population over time, navigate to the *Cohort Details* page and scroll below the cohort definition:
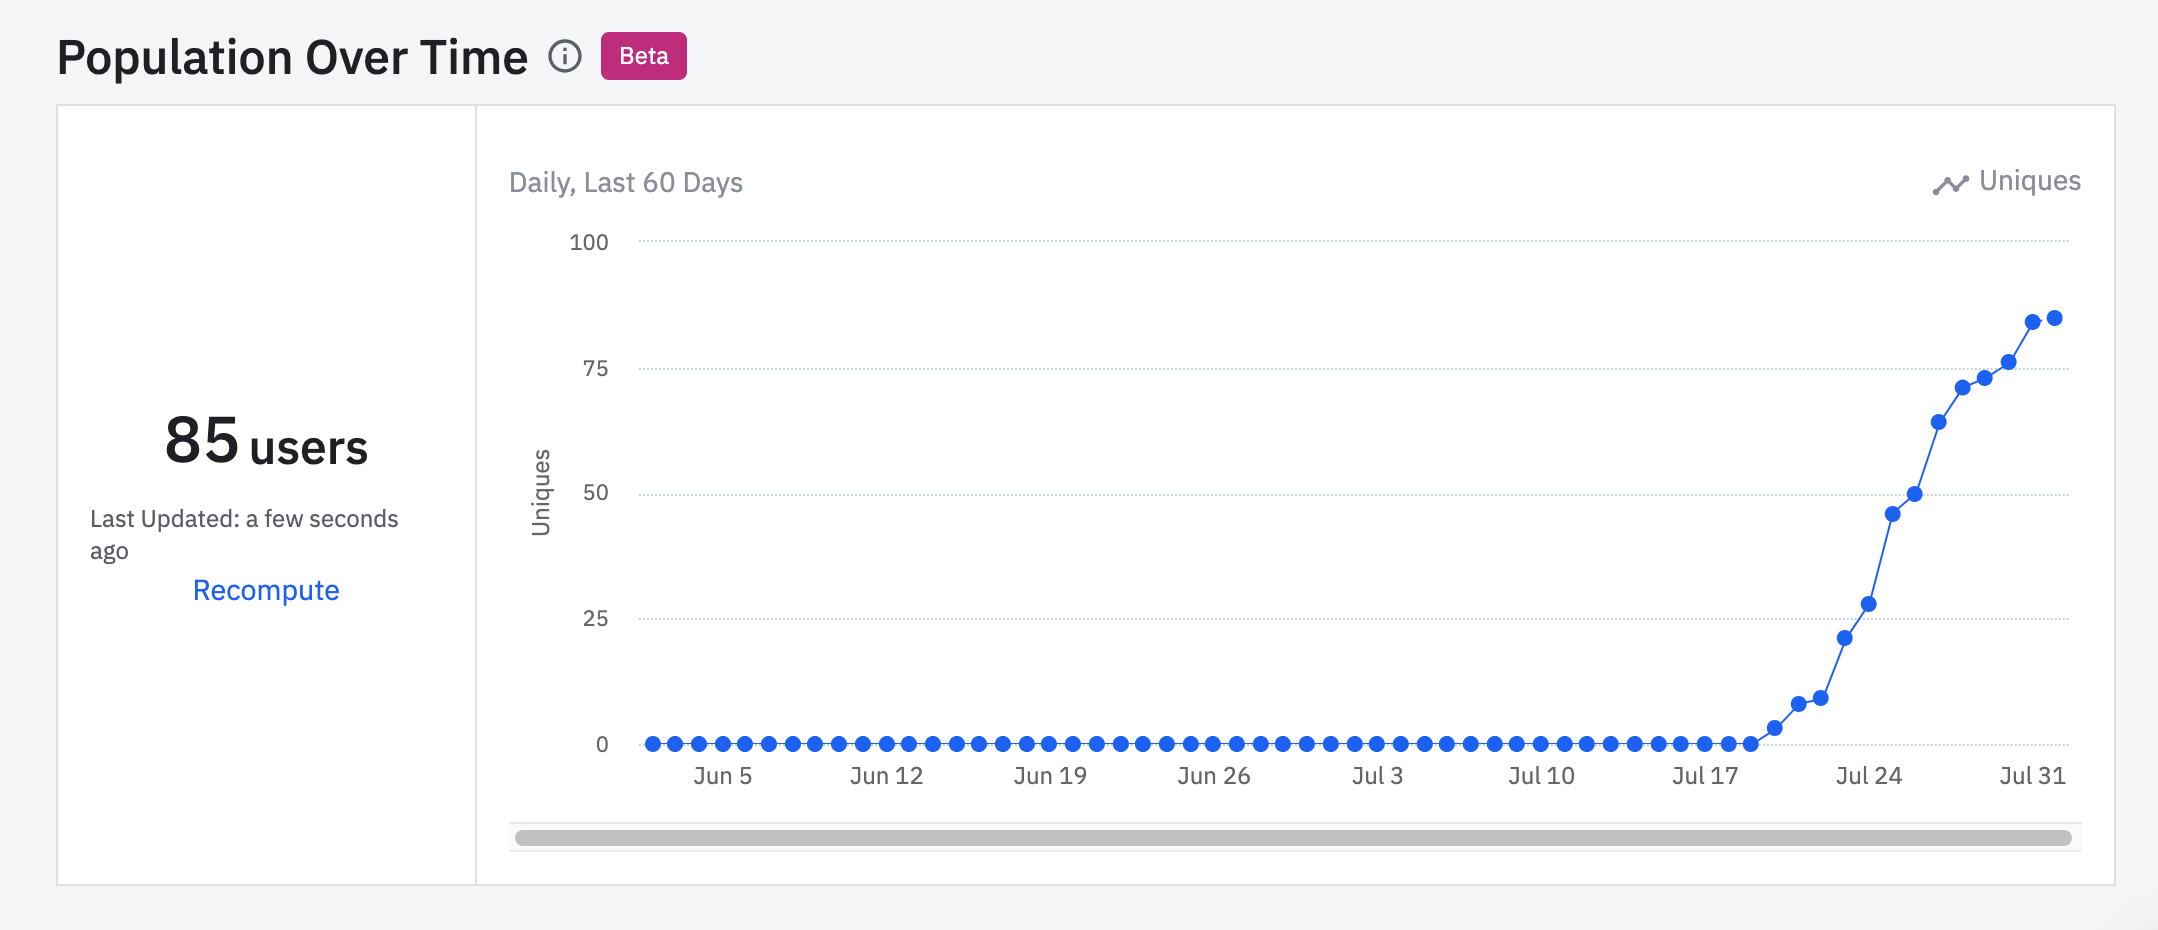
Cohort population over time shows the number of users who meet a cohort definition on each day over a predefined time.
Let’s say you want to define a [behavioral cohort](https://amplitude.com/docs/analytics/behavioral-cohorts) of power users as those who have triggered at least 50 active events in the past 30 days:
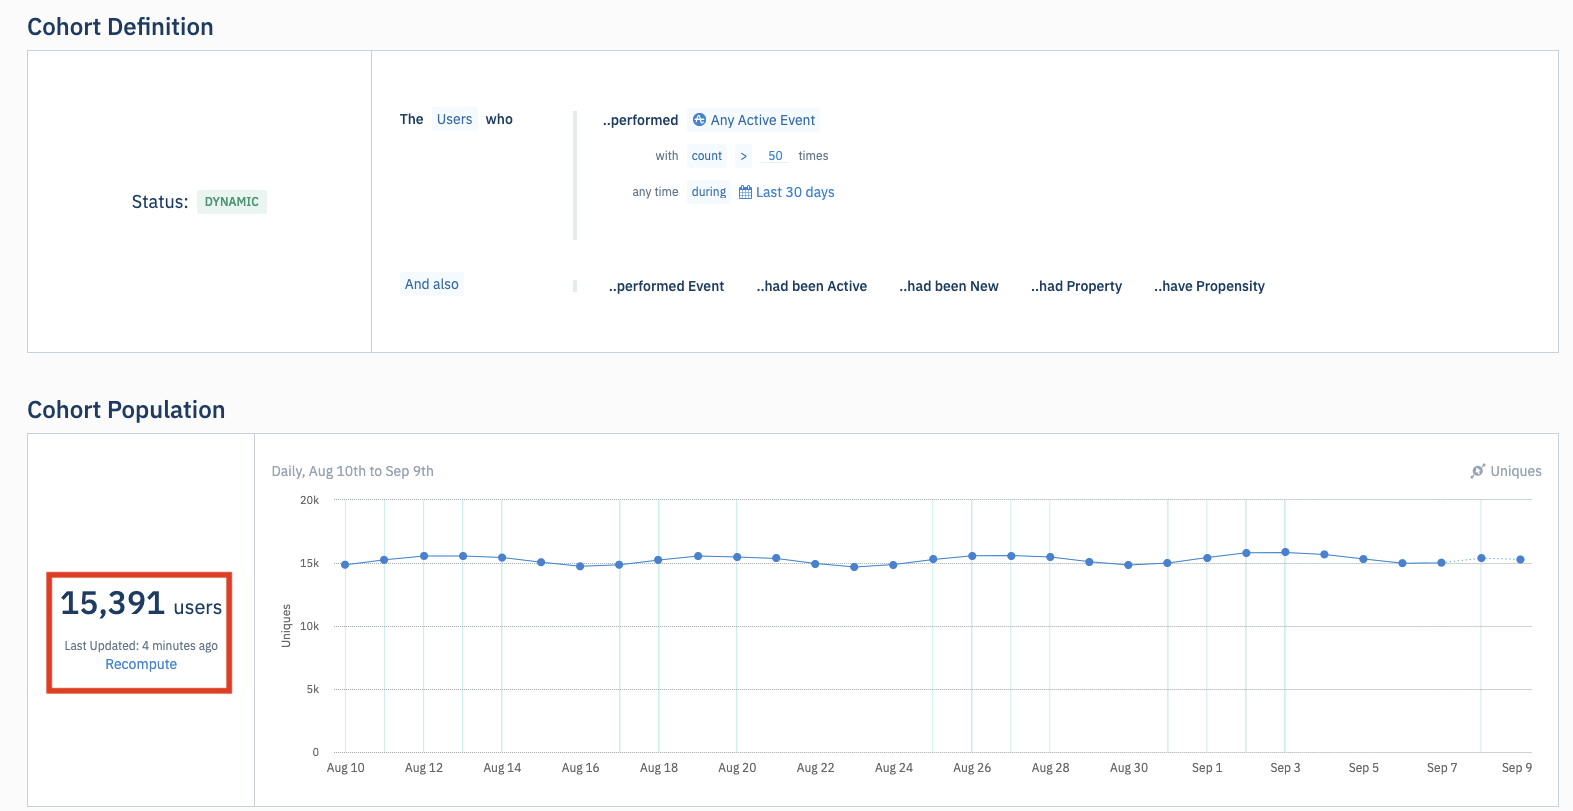
There are 15,391 users in this cohort. The cohort population over time graph shows you what that number was each day, over the past 30 days:
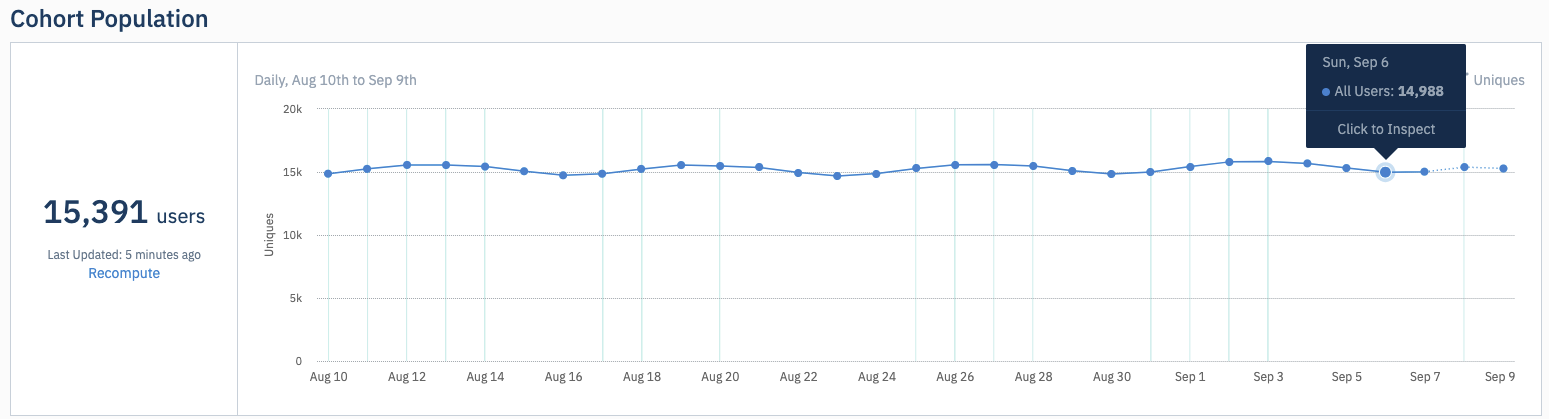
In the graph above, 14,988 users met the criteria for the 30-day period ending September 6. This means 14,988 users sent more than 50 active events between August 7 and September 6. The graph shows that your power user cohort population has been steady over the last month. This can help you assess the effectiveness of campaigns or releases from your team.
Cohort population over time can also help in other situations:
- Understanding the number of newly activated users
- Analyzing growth of paying users cohort
- Analyzing growth of [sticky users](https://amplitude.com/docs/analytics/charts/stickiness/stickiness-identify-features) cohort
- Analyzing growth of churned users cohorts
- Analyzing growth of different personas (for example, wish-list users, or single or multi-device watchers)
- Analyzing growth of cohort of users who have achieved certain milestones, like making their first purchase
## FAQs
**Can I adjust the date range or level of detail?**
No, this isn't available.
**I don’t see cohort population under my cohort. Is this expected?**
Only dynamic cohorts support listing cohort population. Amplitude recomputes these cohorts according to the specified criteria. Static cohorts don't support listing the cohort population. Examples of static cohorts include those imported from a CSV file, or created using Microscope within charts.
Amplitude also doesn't support cohorts that:
- contain "had user property most recently" in the definition
- have more than 10 OR clauses in the definition
================================================================================
# Computations: Create new user properties on the fly
URL: https://amplitude.com/docs/analytics/computations
================================================================================
# Computations: Create new user properties on the fly
Like cohorts, computations are a *segmentation tool*. Cohorts create lists of users. Computations create computed user properties that you can use in segmentation and personalization workflows.
Use computations when you want a numeric or aggregate value stored on each user profile, such as a total purchase count or average session duration. Use cohorts instead when you need a dynamic list of users that match a set of conditions.
Use computations to:
- Transform an event or event property into a *computed user property*.
- Segment your users by the computed property as a configurable filter in any Amplitude chart.
- Sync the computed property to an external personalization destination.
For example, you might want to segment users by the number of purchases they’ve made. You could create a cohort for each possible purchase count, but that approach becomes cumbersome as the number of counts grows.
Instead, create a computed property such as `number_of_orders`. The computed property stores the purchase count as a single integer on each user. For this use case, a computed property gives you a more flexible segmentation option than a set of cohorts.
{% callout type="note" %}
To use your computed property as a filter in a chart, first choose your computed property as a filter parameter in a cohort. Save the cohort. You can then select that cohort in any Amplitude chart as a segmentation parameter. You can also query directly on a computed property in a chart as a property filter or group-by option.
{% /callout %}
Grouping by computations works only on Event Segmentation, Funnel Analysis, Retention Analysis, and composition charts.
Computed properties work well for personalization campaigns. Amplitude supports three computed property types:
- **Event count**: Counts the number of times a user has fired an event over a defined period.
- **Aggregation**: Calculates the sum, minimum, maximum, or average of event property values over a defined period.
- **First/last value**: Uses only the first or last value of the selected property in charts.
{% callout type="note" %}
Computations support standard, derived, and transformed event properties only.
{% /callout %}
## Create a computed property
To create a new computed property, follow these steps:
1. Navigate to _Computations → Create Computation_.
2. Under _Computation Type_, select the type of computed property you want to create and click _Next >_.
3. Under _Select an Event_, choose the event you want to build your computed property from:
- For **event count** computed properties, you can filter the event using _+ where_ clauses to add conditions.
- For **aggregation** computed properties, select an event and the related event property you want to aggregate. Specify if you want to compute an average, minimum, maximum, or sum value.
- For **first/last value** computed properties, select the aggregation type _First Value_ or _Last Value_. Specify the appropriate event and property.
{% callout type="note" %}
Aggregation requires property values to be an integer.
{% /callout %}
4. Set the time range for your computed property. When you’re done, click _Next >_.
5. Name your computation and enter an optional description. This name appears as a user property on every user. Then click _Next >_.
6. Review your results. Amplitude generates the computation in a few seconds.
Amplitude applies the computation to all users who were *active* during your specified date range. The details view shows the computation configuration, a distribution of all users, event count distribution, and aggregation distribution by distinct binned values.
## Troubleshoot a failed computation
When a computation fails, the _Overview_ tab on the computation detail page displays a detailed error message explaining the cause. The message distinguishes between a configuration issue in your setup and an Amplitude-side problem, so you know where to focus your troubleshooting.
To view error details for a failed computation:
1. Navigate to _Computations_ in the left-side rail.
2. Click the name of the failed computation.
3. Review the error message on the _Overview_ tab.
After identifying the configuration issue, correct the settings and run the computation again.
## Delete a computation
You can delete a computation at any time after you create it. To delete a computation, follow these steps:
1. Click _Computations_ in the left-side rail.
2. Click the name of the computation you want to delete.
3. From the _More_ drop-down menu, click _Delete_.
4. Confirm that you want to delete this computation.
When you delete a computation, it no longer appears as an available user property for your cohorts. You can't sync it or filter from it within your cohorts. Deleting unneeded computations frees space for new computations.
## Use computed properties in campaigns with external destinations
Computed properties work well in *personalization campaigns*. Sync the computed property as a user property to external destinations, such as a database or third-party marketing platform.
For example, use a computed property to calculate the total number of orders a user has placed. Then use that information to trigger a different canvas in Braze when the number reaches a threshold. You can also calculate users’ average order values, sync them to the Profile API, and show different in-app interstitials based on those values.
{% callout type="note" %}
Amplitude supports Braze, S3, and the Profile API as destinations for computed property syncs. Syncing to Braze accrues more data points in your Braze plan, which may result in an additional charge from Braze.
{% /callout %}
To sync your computed property with a personalization tool, follow the instructions in [Sync to third-party destinations](https://amplitude.com/docs/data/destinations/syncs).
================================================================================
# Historical Count, part 1: Track user behavior for different instances of each user action
URL: https://amplitude.com/docs/analytics/historical-count-1
================================================================================
# Historical Count, part 1: Track user behavior for different instances of each user action
Historical Count captures the Nth instance (first through fifth) of any user event and exposes it as an event property you can filter on in charts and cohorts. Use it to compare behavior between users who performed an action once versus users who performed it three or five times, for example to isolate the conversion rate of first-time `Play Song` users against repeat listeners.
Use Historical Count when you want to filter or segment by the Nth occurrence of a specific event within a single chart or cohort. If you need to group users by total lifetime count or by behavior across multiple events, use a [behavioral cohort](https://amplitude.com/docs/analytics/behavioral-cohorts) instead.
You can also use it to identify your best customers based on the number of times they’ve taken a critical action in your product, like completing a purchase in an e-commerce platform or playing a song in a music streaming app.
For example, if your product is a music streaming platform, Historical Count could highlight the usage differences between users who have performed the `Play Song` event for the first time and those who've triggered it multiple times.
{% callout type="note" %}
Historical Count is not the same as Amplitude's behavioral cohorts. However, you can use Historical Count in a behavioral cohort.
{% /callout %}
You need instrumented events before Historical Count returns data. If you haven't instrumented events yet, go to the [Event Segmentation chart](https://amplitude.com/docs/analytics/charts/event-segmentation/event-segmentation-build) docs first.
Other important things to note about this feature:
- Historical Count supports these operators: `=` (is), `≠` (is not), `<` (less), `≤` (less or equal), `>` (greater), `≥` (greater or equal).
- You can select only one Historical Count property at a time.
- Historical Count is an event property available on the **Event Segmentation**, **Funnel Analysis**, **Pathfinder**, and **Retention Analysis** charts.
- In a funnel analysis, Historical Count works only on funnels set to _in this order_.
- You can apply an Historical Count filter only to the first event in the Pathfinder and Retention Analysis charts.
- However, you can apply it to multiple events when doing event segmentation and funnel analyses.
- Historical Count is also available in behavioral cohorts, with limitations:
- You can't use "Any Event" or "Any Active Event" with Historical Count in dynamic cohorts.
- If you create a cohort using "Any Event where Historical Count = 1", it becomes a static cohort.
This article is part 1 of a series on Historical Count. Be sure to read the next Help Center articles in the series:
- [Historical Count, part 2: Order of operations](https://amplitude.com/docs/analytics/historical-count-2)
- [Historical Count, part 3: Funnel analyses and behavioral cohorts](https://amplitude.com/docs/analytics/historical-count-3)
## How Amplitude defines Historical Count
Generally speaking, Historical Count can tell you if it's a user's first time triggering a specified event, or their fifth. But there are some constraints to be aware of here.
Amplitude's definition of ***N*th time** is itself time-limited, to include a period of **up to one year before** the beginning of the date range of your analysis.
For example, say a user performed the `Play Song` event for the first time on February 20, 2019, and then did so again on March 20, 2019. To include the user's true first performance of the `Play Song` event, your chart's date range must begin no later than February 19, 2020. If your chart covers March 1, 2020 to March 31, 2020, Amplitude treats the event performed on March 20, 2019 as the user's first interaction with the `Play Song` event.
## Apply a Historical Count filter
To apply a Historical Count filter, follow these steps:
1. In your Events Module, choose the event you're interested in. Then click _+ Filter by_.
2. Scroll down to _Amplitude Event Properties_ and select _Historical Count_.
3. Choose the correct operator and specify the _N_-value (first through fifth) that you're interested in.
In the example above, the chart includes users who performed the `Send Message` event with a Historical Count of three.
Continue to the second article in the Historical Count series: [Historical Count, part 2: Order of operations](https://amplitude.com/docs/analytics/historical-count-2).
================================================================================
# Historical Count, part 2: Order of operations
URL: https://amplitude.com/docs/analytics/historical-count-2
================================================================================
# Historical Count, part 2: Order of operations
Amplitude's Historical Count filter runs after every other filter in a chart query, which changes which events count toward a user's *N*th occurrence. Part 2 of this 3-part series covers where Historical Count sits in Amplitude's filter order of operations, how it differs from Event Historical Count (which runs first), and how it interacts with custom events.
Use Historical Count when you want the *N*th instance that survives your other filters, such as the third event triggered in Germany. Use Event Historical Count when you want the *N*th instance overall, before location, property, or segment filters narrow the result. For the filter's definition and basics, start with [part 1](https://amplitude.com/docs/analytics/historical-count-1).
{% callout type="note" %}
This article is second in a series about Historical Counts. If you haven't done so already, read [Historical Count, part 1: Track user behavior for different instances of each user action](https://amplitude.com/docs/analytics/historical-count-1).
{% /callout %}
## Historical Count in the Amplitude order of operations
Whenever Amplitude applies filters to an event (including filters in segments), it does so in a specific order. **Amplitude always applies the Historical Count filter last**.
Consider the following example.
With the Historical Count filter applied, this chart doesn't show everyone whose third time triggering that event happened in Germany. Instead, it shows the third Germany-located instance of that event. Both previous instances also took place in Germany. The event could be the user's third, eighth, or hundredth time performing that event overall, as long as it was their third Germany-located instance.
{% callout type="note" %}
Any group-bys apply to the first event selected in the Funnel Analysis, Pathfinder, and Retention Analysis charts. When you apply a group-by, Amplitude shows the user's property value at the time the user triggers the event for the Nth time.
{% /callout %}
## Event Historical Count
The Event Historical Count filter works similarly to the Historical Count filter. While both capture a user's *N*th instance of performing a specified action, Amplitude applies Historical Count **after** all other filters. By contrast, Amplitude applies Event Historical Count **first**, **before** any other filters.
This can have important implications for your analyses. Let's use the table below to illustrate the difference:
| **Time** | **Maya’s event** | **Loc’s event** |
| -------- | ---------------- | --------------- |
| 1 | run | |
| 2 | walk | walk |
| 3 | | run |
If you set up an event segmentation analysis that searches for `Any Event` where:
- `Historical Count` = `1st`.
- `Event Name` = `Run`.
This yields two results: Maya at time 1, and Loc at time 3.
{% callout type="note" %}
While you can use "Any Event" or "Any Active Event" with Historical Count in Event Segmentation charts, you can't use these event types with Historical Count when creating dynamic cohorts in Cohort Builder. If you create a cohort using "Any Event where Historical Count = 1", it becomes a static cohort rather than a dynamic one.
{% /callout %}
By contrast, consider a similar analysis that searches for `Any Event` where:
- `Event Historical Count` = `1st`.
- `Event Name` = `Run`.
This gives you only one result: Maya at time 1. This is because `Run` is Loc's **second** event, and the Event Historical Count filters out everything but first events.
## Historical Count and custom events
Amplitude considers the custom event logic before the Historical Count filter and counts all underlying events triggered by the user.
For example, imagine a `custom_event_c` that fires when a user triggers **either** `event_a` **or** `event_b`. Let's say that the user triggers events on the following days:
**Day 1:** `event_a`
**Day 3:** `event_b`
**Day 7:** `event_b`
**Day 14:** `event_a`
If you apply the Historical Count filter of 1 to `custom_event_c` within the time frame, Amplitude counts the user in the data point for **Day 1** because the user triggered `event_a` for the first time on that day. Amplitude doesn't count the user's events triggered on **Day 3**, **7**, and **14** for those days.
When you apply the Historical Count filter of 2 for `custom_event_c`, Historical Count registers **Day 3** as the day `custom_event_c` fired for the second time.
Continue to the third article in the Historical Count series: [Historical Count, part 3: Funnels and behavioral cohorts](https://amplitude.com/docs/analytics/historical-count-3).
================================================================================
# Historical Count, part 3: Funnels and behavioral cohorts
URL: https://amplitude.com/docs/analytics/historical-count-3
================================================================================
# Historical Count, part 3: Funnels and behavioral cohorts
Historical Count filters in Amplitude isolate the *N*th time a user performs an event (for example, a user's fifth workout). This article, part 3 of a 3-part series, explains how Historical Count behaves in two specific surfaces: Funnel Analysis charts and behavioral cohorts. For the filter's definition and basics, start with [part 1](https://amplitude.com/docs/analytics/historical-count-1); for syntax and Event Segmentation usage, go to [part 2](https://amplitude.com/docs/analytics/historical-count-2).
Use a Funnel Analysis with a Historical Count filter when you need to know whether a user's *N*th occurrence of a step falls inside both your date range and the conversion window. Use a behavioral cohort with Historical Count instead when you want a reusable user group defined by their *N*th lifetime occurrence, independent of a step sequence.
## Historical count in funnel analyses
In Funnel Analysis charts, a user could enter the funnel multiple times, or perform the various steps multiple times. To decide if a user counts as converted in a Funnel Analysis chart with a Historical Count filter, Amplitude considers two things:
1. The *N*th instance must be within the date picker dates; and
2. The *N*th instance must occur within the [conversion window](https://amplitude.com/docs/analytics/charts/funnel-analysis/funnel-analysis-build) of the other funnel steps.
As an example, imagine a two-step funnel. In this example, the Historical Count filter is set to 2 on `event_a`, with a date range of December 21st, 2020 to December 22nd, 2020. This means that you want to know when `event_a` was performed for the second time (Historical Count filter = 2).
The funnel is:
Step 1 = `event_a`
Step 2 = `event_b`
And the user has performed the events in this order: BBAB**A**B.
The chart looks back 12 months (to December 21st, 2019 in this example) for historical context. If the second time the event happened wasn't within the stated date range (December 21st, 2020 to December 22nd 2020) and, instead, was some time previous, the chart doesn't include the user in the chart.
The user must perform the second instance of `event_a` within the specified date range (December 21 to December 22, 2020) to be counted as converted.
If the Historical Count filter is applied to the second event (`event_b`), and the user performs the event in this order: B**B**ABAB
Then all of the following must occur for the user to appear in the chart:
- `event_a` occurred within the specified time period (December 21st, 2020 to December 22nd, 2020)
- `event_b` occurred within the specified time period
- `event_a` (the occurrence within the specified time period) happened before the second occurrence of `event_b`
If either of the events occurred outside of the specified date range, or if `event_a` didn't occur before the second instance of `event_b` within the timeframe, then the chart doesn't include the user.
{% callout type="note" %}
When using [Historical Count filters](https://amplitude.com/docs/analytics/historical-count-1) on the same events that happen within the same second, users appear to have dropped off. This is because the [funnel query](https://amplitude.com/docs/analytics/charts/funnel-analysis/funnel-analysis-interpret) doesn't distinguish between events that happen within the same second, but the Historical Count filter does.
{% /callout %}
## Historical Count in behavioral cohorts
Historical Count and behavioral cohorts are related but separate concepts in Amplitude.
A behavior cohort defines a group of users who took a specific action with a certain frequency within a specific time period. For example, users who completed a workout five times in the last 30 days. A fitness company might want to know which of its users fit this description, as it might be their definition of a recent power user.
Conversely, Historical Count lets you pinpoint a user’s fifth workout. So if they completed only two workouts in the last 30 days, but also completed three workouts before that, the most recent workout was actually their fifth. This is an important distinction, as a user’s fifth workout overall could also mark an important milestone in their overall user lifecycle in that they have now transitioned into a long-term group of users.
Amplitude lets you combine the power of both by creating a cohort with historical count as a condition. You can also see the cohort population over time.
### Limitations with "Any Event" and "Any Active Event"
When using Historical Count in Cohort Builder, you can't use "Any Event" or "Any Active Event" for dynamic cohorts. These event types work only when creating static cohorts:
- **Dynamic cohorts**: Using Historical Count in Cohort Builder creates a dynamic cohort that updates automatically. However, dynamic cohorts with Historical Count don't support "Any Event" and "Any Active Event".
- **Static cohorts**: If you create a cohort using "Any Event where Historical Count = 1", it becomes a static cohort. Static cohorts don't update automatically and represent a snapshot of users at a specific point in time.
- **Workaround**: To track users based on "Any Event" with Historical Count, create the analysis in an Event Segmentation chart first, then save it as a static cohort.
This limitation applies only to Cohort Builder. You can still use "Any Event" or "Any Active Event" with Historical Count in Event Segmentation, Funnel Analysis, Pathfinder, and Retention Analysis charts.
To add Historical Count to a behavioral cohort, review [Creating a behavioral cohort in Amplitude](https://amplitude.com/docs/analytics/behavioral-cohorts).
================================================================================
# Predictive analytics overview
URL: https://amplitude.com/docs/analytics/predictive/predictive-analytics
================================================================================
# Predictive analytics overview
Amplitude's predictive analytics features help you anticipate user behavior and act on it. Use them to segment users by what they're likely to do next and to surface the content most likely to drive each user toward a goal.
## Predictions
[**Predictions**](https://amplitude.com/docs/analytics/predictive/predictions) segment users by their likelihood to perform a future action, such as subscribing, churning, or completing a purchase. Amplitude scores each user's probability hourly based on past behavior and groups users with similar probabilities.
Use predictions to:
- Decide who to include or exclude from a campaign.
- Adjust messaging frequency, pricing, or discounts based on a user's likelihood to convert.
- Personalize content for users with the highest affinity for a category.
To get started, read [Build a prediction](https://amplitude.com/docs/analytics/predictive/predictions-build) and [Use prediction-based cohorts in your campaigns](https://amplitude.com/docs/analytics/predictive/predictions-use).
## Recommendations
[**Recommendations**](https://amplitude.com/docs/analytics/predictive/recommendations) rank the items most likely to drive each user to a predictive goal. Amplitude's AutoML system clusters similar users and assigns each user a ranked list of items based on historical conversion data.
Recommendations work best for user-based digital commerce personalization:
- **Assortment**: Rank items on a homepage or category page to increase engagement.
- **Next-best action**: Surface a second item in checkout or post-purchase email to increase conversions.
- **Cross-sell**: Rank items that signal new lifecycle stages to increase LTV.
To get started, read [Build a recommendation](https://amplitude.com/docs/analytics/predictive/recommendations-build) and [Use recommendations in personalization campaigns](https://amplitude.com/docs/analytics/predictive/recommendations-use).
## How predictions and recommendations work together
Predictions identify _which_ users are most likely to act. Recommendations identify _what_ to put in front of them. Combine them to maximize lift:
1. Build a prediction for the outcome you care about, such as a second purchase or a subscription upgrade.
2. Save the predictive cohort and sync it to your campaign destination.
3. Build a recommendation that ranks items for those users.
4. Deliver the ranked items through Amplitude's [Profile API](https://amplitude.com/docs/apis/analytics/user-profile) or a [sync](https://amplitude.com/docs/data/destinations/syncs).
## Related features
- [Computations](https://amplitude.com/docs/analytics/computations) transform an event or property into a computed user property you can segment by.
- [Behavioral cohorts](https://amplitude.com/docs/analytics/behavioral-cohorts) group users by past actions.
- [Predictive cohorts](https://amplitude.com/docs/analytics/predictive/predictions-build) group users by predicted probability ranges.
================================================================================
# Predictions: Use Amplitude's AI to help maximize lift
URL: https://amplitude.com/docs/analytics/predictive/predictions
================================================================================
# Predictions: Use Amplitude's AI to help maximize lift
**Predictions** help you optimize targeting workflows to generate lift.
Instead of segmenting users by past behavior, predictions segment users by their likelihood to perform a specific future action. Predictions are most useful for **communication frequency, dynamic pricing,** and **content personalization** workflows. Use predictions to:
- Specify which users to include or exclude in a campaign.
- Adjust messaging frequency based on a user's likelihood to convert.
- Modify pricing, offers, and discounts relative to a user's likelihood to convert.
- Fine-tune ad, email, or website content based on a user's affinity for that content type.
{% callout type="note" %}
Predictions aren't available for merged properties.
{% /callout %}
Predictions construct a mathematical model to forecast the likelihood that a user takes a specific action in your product. The model groups users who have similar probabilities.
First, decide what predictions to build.
What question should your prediction answer? In most cases, the answer connects to the objectives that guide your company. Start by mapping the user journey, including KPIs from the user's first product interaction to their last touch. Common user journey steps include signup, activation, retention, and churn.
After you identify the steps, fill in the milestones by specifying each major button interaction between those steps. Build a prediction for each step of this journey.
For example, an ecommerce product might have this user journey.
## Who should use predictions, and when
Predictions work best in specific situations:
- **When your target outcome lacks a clear funnel.** These outcomes usually result from complex user journeys and can be difficult to frame as a clear binary event. Common examples include activation, retention, engagement, and long-term value. If these metrics matter most to your product, consider predictive cohorts.
- **When you're trying to drive incremental lift to these outcomes.** A thoughtfully designed prediction can drive a 5% to 20% lift relative to a behavioral cohort.
- **If your product has over 100,000 monthly average users.** Smaller products may not generate sample sizes large enough for reliable statistical inferences.
Conversely, your company is **less likely to benefit** from predictions if you:
- Sell physical products.
- Are in the B2B space.
- Lack a marketing team.
Before you work with predictive cohorts, read [Build a prediction](https://amplitude.com/docs/analytics/predictive/predictions-build) and [Use prediction-based cohorts in your campaigns](https://amplitude.com/docs/analytics/predictive/predictions-use). The next section describes how Amplitude builds predictions.
## How predictions work
Predictions use past behavior to predict future behavior. When you build a prediction, Amplitude creates a deep learning model to distinguish between users who perform the action you specify and users who don't.
Amplitude starts with users who were in the starting cohort one period ago. Amplitude then identifies which of those users did and didn't perform the action during the period since. You can set a period to seven, 30, 60, or 90 days.
Next, Amplitude uses an advanced [transformer-based sequence model](<https://en.wikipedia.org/wiki/Transformer_(machine_learning_model)>) to compare those two user groups across four variable sets: events, event properties, user properties, and user activity sequences.
- **Events**: How often each user triggers the top 25 events related to the prediction target, every week for the last four periods.
- **Event properties**: How often each user triggers the most frequently queried event properties, every week for the last four periods.
- **User properties**: The initial value and most recent value of each user property in the last four periods.
- **User activity sequences**: Each user's activity sequence for their most recent 128 events and time intervals.
The transformer encoder processes these variables and builds an alias cohort on top of the user's activity sequence. Most [behavioral cohorts](https://amplitude.com/docs/analytics/behavioral-cohorts) rely on three to five manually designed signals. Amplitude's predictions use a transformer-based AI model with hundreds of behavioral signals.
The model calculates a probabilistic score for every user in the starting cohort. The score measures how likely each user is to perform the target action during the specified period. As the model learns and responds to seasonal data, Amplitude recalculates each user's probability score daily or hourly, depending on your configuration.
To get started, read [Build a prediction](https://amplitude.com/docs/analytics/predictive/predictions-build) and [Use prediction-based cohorts in your campaigns](https://amplitude.com/docs/analytics/predictive/predictions-use).
================================================================================
# Build a prediction
URL: https://amplitude.com/docs/analytics/predictive/predictions-build
================================================================================
# Build a prediction
Predictions allow you to segment your users based on their likelihood to perform specific events or actions in the future.
{% callout type="note" %}
For more prediction context, read [Predictions: Use Amplitude's AI to help maximize lift](https://amplitude.com/docs/analytics/predictive/predictions) and [Use prediction-based cohorts in your campaigns](https://amplitude.com/docs/analytics/predictive/predictions-use).
{% /callout %}
## Build a prediction
To build a prediction in Amplitude, follow these steps:
1. Navigate to _Users > Predictions_. Then click **+ Create Prediction**.
2. Click **Start with All Users** to apply this prediction to all users active in the last 90 days, or define your own starting cohort.
3. If you choose to define your own starting cohort, select the users to include in the cohort. Under _Define starting cohort_, select the events, properties, or statuses that users in your cohort share.
4. Specify the action you want the starting cohort to take. Under _Define future outcome_, specify the events you want users to fire or avoid firing, the properties you want them to have after taking an action, or some combination of all three. Specify the time frame for the future action.
{% callout type="tip" %}
You can also think about a prediction as a **cohort transition**: you're predicting the relative likelihood of a user moving from Cohort A, the starting cohort, to Cohort B, the future outcome, in the coming week.
{% /callout %}
5. To add optional settings, use _Advanced Model Configuration_. This section lets you further define your starting cohort by including or excluding specific user properties. Click **Add Feature** under _Include_ or _Exclude_ to search for user properties. Click **Save**.
6. Give your prediction a name and add a brief description. Then click **Save**. It takes about an hour for Amplitude to build your prediction. Amplitude sends you an email when the prediction is ready.
## Analyze your prediction
After Amplitude finishes building your prediction, review the results. Depending on the results, save the prediction as a cohort or start over with a new prediction.
1. To view the results of your prediction, navigate to _Users > Predictions_. This shows you a list of all the predictions created so far.
2. Find your prediction and click it to open the prediction explorer's _Audience analysis_ tab. This tab shows the distribution of all users in your starting cohort:
- The Y-axis shows the likelihood that a user converts, such as arriving at the future outcome you specified earlier.
- The X-axis shows the percentile of users.
You can select a range of users by percentile and review how many users fall in the range, the predicted conversion rate of users in that range, and the likelihood of conversion for those users relative to the average.
{% callout type="note" %}
Percentile and probability aren't the same thing. If you select the 80% - 100% percentile range, this doesn't mean the users in it have an 80% - 99% probability to convert. Instead, it means they're in the top 20% of users, as ranked by probability to convert.
{% /callout %}
### Feature importance
Predictions need context to be useful. Amplitude ranks the events and user properties that are most important to your predictive model in the _Feature Importance_ section below the _Audience definition_ chart.
The _Events_ tab in _Feature Importance_ houses a table with the following columns and insights:
- The _Ratio_ column ranks events or properties by importance to the model. Amplitude calculates this ranking by comparing the percentage of users in the selected percentile range who fire an event to users outside that range.
- The _Event_ column lists the ranked events.
- The _% in Range_ column specifies the percentage of users in the selected percentile range who fired the respective event. Sort by this column to rank events according to total level of engagement.
- The _% not in range_ column calculates the percentage of users who performed the event but aren't in the selected cohort.
- The _Frequency_ column displays the average number of times a user in the selected range fires an event. Sort by this column to rank events according to total level of engagement.
Click **Showing Significant Events** to narrow down your list of ranked events and modify which events you view in the table, or click the calendar icon to change the specified time frame and offset. The modified time frame applies to both the _Events_ and _User Properties_ tabs.
The _User Properties_ tab shows rankings of user properties and their importance to the prediction's model. Click **Select Property** to choose a user property for review. Like the Events table, the _User Properties_ table ranks property values by _Ratio_, _% in range_, and _% not in range_. To include hidden property values in the table, select **Show Hidden Property Values**.
### Model performance
At this point, you can evaluate the accuracy of your prediction. Amplitude provides metrics for you to do this in the _Model performance_ tab:
- **True Positive Rate**: The ratio of predicted users who convert.
- **False Positive Rate**: The ratio of predicted users who don't convert.
- **AUC**, or Accuracy: The area under the curve, a measure that weighs both true positive and false positive rates.
- **Log loss**, or predicted vs actuals: The difference between predicted conversion rates and observed historical conversion rates, in percentage terms.
Generally speaking, a good model has an accuracy of at least 70%. Any model with an accuracy of 50% or less is no better than a coin flip in its predictive ability.
### Tips for a good predictive model
- **Outcome event has at least 50 unique actions per day**: Ensure that the outcome event has at least 50, and ideally 100, unique user actions every day. If conversion numbers fall below this threshold, the model doesn't detect signals and recommends the same content for all users.
- **Targeted user cohort for Audiences has between 1K and 10M users**: If the user population is under 1K, Audiences can't use users at a 1:1 level. If the population is greater than 10M users, Amplitude filters the cohort.
- **Large enough dataset**: More data improves recommendation accuracy. Amplitude requires a minimum of 10,000 events per user to build a prediction.
- **Relevant events in Amplitude related to the target outcome**: Cross-reference the target outcome and confirm that you already instrumented the appropriate events. These events are typically `Purchase` or `Transaction completed`.
## Build a cohort from your prediction
After you have a useful prediction, you can save the prediction as a cohort. This lets you return to the cohort and use it repeatedly in targeting campaigns.
To save your prediction as a cohort, follow these steps:
1. Use the slider to select the percentile range on the chart. Then click **Save as predictive cohort**.
2. Give your cohort a name and click **Save**.
Avoid splitting the starting cohort into only two sections, such as top 20% vs bottom 80% or top 50% vs bottom 50%. Other approaches can give you more useful results:
- **Probability inflection**: Find the spot where the distribution graph spikes exponentially, and split users along the spikes. This groups users into broadly similar buckets of predicted conversion rates.
- **Sample size**: If you know how many users you want to target in a growth campaign, select that percentage on the right side of the chart. For example, if you want to target 2,000 users and you have 20,000 users in the starting cohort, select the top 10%.
- **Minimum detectable lift**: If you plan to target the selected users in a growth campaign, make sure the sample size is large enough to detect incremental lift. For example, if the top 20% of a prediction is 20,000 users, but the predicted conversion rate is 1%, you can't detect lift at statistically significant levels. Instead, you must increase the sample size to top 45% of users at 45,000 users.
{% callout type="note" %}
When a user's probabilities change, Amplitude automatically adjusts their cohort membership if they move into or out of the selected percentile range.
{% /callout %}
## Analyze your predictive cohort
After you save a prediction as a cohort, you can use it for analysis in any Amplitude Analytics chart. Try these analyses with prediction-derived cohorts:
- **Create top 20% and bottom 80% cohorts** to compare the best and worst users. Set them as different segments in the right module of any chart.
- **Event Segmentation**: Analyze the historical behavioral trends of best users vs worst users before converting.
- **Pathfinder**: Identify the different action sequences users take when they have a high likelihood vs low likelihood to convert.
- **Composition**: Break down cohort property values to compare user properties, such as which countries the best users and worst users are in.
- **Engagement Matrix**: Compare the events fired by the best users vs the worst users, based on the balance of frequency and percentage of users.
- **Funnel**: Compare relative conversion rates for any sequence of actions between the best users and worst users.
================================================================================
# Use prediction-based cohorts in your campaigns
URL: https://amplitude.com/docs/analytics/predictive/predictions-use
================================================================================
# Use prediction-based cohorts in your campaigns
A prediction-based cohort ranks users by their probability of converting, so you can target the most likely converters in an email, ad, or in-product campaign. After you save a cohort from a prediction, sync it to a destination tool and configure a campaign that treats high-probability and low-probability users differently.
Use a prediction-based cohort when you want to target users by their modeled probability of a future event, like conversion or churn. If you want to target users by behavior they've already taken, use a [behavioral cohort](https://amplitude.com/docs/analytics/behavioral-cohorts) instead.
You need a saved cohort from an existing prediction before you start. If you haven't built one, go to [Build a prediction](https://amplitude.com/docs/analytics/predictive/predictions-build) first.
Prediction-based cohorts work best with three common campaign types:
- **Inclusion criteria**: Decide who to target in, and who to exclude from, a campaign.
- **Dynamic pricing**: Adjust prices or discounts according to a user's probability of becoming a high-LTV user.
- **Content personalization**: Show the right content to the right user at the right time.
For inclusion criteria campaigns, start by excluding users unlikely to convert. This reduces unsubscribe rates in email campaigns and CPA in ads. Next, include high-probability users who are most likely to convert. This optimizes ad efficiency and rates. Finally, consider medium-probability users who are close to converting to optimize for incremental conversions.
In a dynamic pricing campaign, consider **inverse pricing**: give higher-probability users a lower discount or higher price, and give lower-probability users a higher discount or lower price. High-probability users are more likely to convert before a discount, so discounting them can reduce revenue.
In a content personalization campaign, predictive cohorts identify which users have the highest affinity for a product category. Use that information to show those users the content type. You can personalize content in ads, emails, or on-site, depending on the needs of your users and campaign goals.
## Set up your campaign
After you decide on the campaign type and channel, **sync the cohort**. To sync the cohort and configure your campaign, follow these steps:
1. From the cohort details page, click **Sync** and select the intended destination for the cohort. Then click **Next**.
2. Select a one-time sync or schedule a recurring sync. With a recurring sync, Amplitude syncs updated user probabilities in your cohort to the destination. Then click **Sync**.
3. Open your destination tool and find the synced cohort. Each platform understands and categorizes synced cohorts a little differently:
- In Facebook, a synced cohort appears as a Custom Audience.
- In Google, a synced cohort appears as a Customer List.
- In Braze, a synced cohort appears as filter criteria, "Amplitude Cohorts," within segment creation.
- In Iterable, a synced cohort appears as a User List.
4. Configure a separate, identical campaign for each user cohort. This lets you measure a campaign's effect on each cohort separately. For example, in an upgrade campaign with two predictive cohorts, sync your cohorts to Braze. Choose an existing email campaign in Braze that has relevant upgrade messaging. Then duplicate the campaign: one campaign targets the top 20% cohort, and the other targets everyone else.
5. Create a control or **holdout** group. This group includes users the campaign doesn't include. A control group lets you measure whether the email campaign increased purchases relative to no campaign. The control configuration differs by platform:
- Braze: [Multivariate Test](https://www.braze.com/docs/user_guide/engagement_tools/canvas/create_a_canvas/create_a_canvas/#step-4-use-multivariate-testing-using-canvas).
- Iterable: [A/B Experiment](https://support.iterable.com/hc/en-us/articles/205480325-A-B-experiments-overview-).
- Facebook Ads: [Holdout Lift Test](https://www.facebook.com/business/help/552097218528551?id=546437386202686).
- Google Ads: [Ad Experiments](https://support.google.com/displayvideo/answer/9040669?hl=en).
Your campaign is ready to run. Let it run for one to two weeks. If you have a smaller sample size or low-conversion events, run the campaign longer to give it a better chance to reach statistical significance.
## Measure your campaign's results
After your campaign ends, analyze the results. For top-level metrics such as open rate, click rate, unsubscribe rate, and impressions, use the channel itself. Your channel reports these metrics at an aggregate campaign level for the campaign period and shows the lift relative to the control group. If the campaign generated lift, assess whether the campaign or another factor caused the lift.
You can also import campaign metrics into Amplitude if you want to analyze campaign results over time, or evaluate different conversion events at different attribution windows. (Your channel is unlikely to offer this sort of analysis.) Amplitude can import campaign data in the following ways:
- Monitor UTM parameters automatically collected by the Amplitude SDK.
- Set up a two-way sync with Braze or Iterable to import the data.
- Download the control and variant segments from the channel, and then upload them as CSV cohorts into Amplitude.
After your campaign metrics are in Amplitude, first analyze whether the predictive cohorts behaved differently.
Load two segments that the campaign exposed: Predictive Cohort A, such as the top 20%, vs Predictive Cohort B, such as the bottom 80%. Then compare their event segmentation and funnel charts for conversion events. The cohorts should show some difference in behavior.
For example, in the screenshot below, engagement and conversion rates are higher for the top 20% predictive cohort.
Next, analyze whether the different user groups reacted to the campaign differently.
Load four segments: Predictive Cohort A (Variant) vs Predictive Cohort A (Control), and Predictive Cohort B (Variant) vs Predictive Cohort B (Control). Compare the difference in conversion rates between the variant and control segments of each cohort.
The difference between each set of segments represents the lift from receiving an email campaign vs not receiving it. The difference in the differences is equal to **relative lift**. If there is a difference in relative lift, it means a campaign has different effects on different predictive cohorts.
In the screenshot below, Predictive Cohort A has +5% lift, but Predictive Cohort B has -25% lift. This means the campaign has a positive effect on the top 20% but a negative effect on the bottom 80%. Based on these results, stop emailing the bottom 80%.
## Act on your campaign results
If both cohorts have similar organic conversion rates, the underlying predictive model may be flawed. Most Amplitude predictions are statistically accurate, and you should generally expect a higher conversion rate for the top 20% cohort.
If both cohorts had positive lift, the campaign intervention has an overall positive effect on conversions, with a higher impact on one group. In an ad campaign, reduce ad bids for the audience with lower lift or stop advertising to that audience. In an email campaign, increase email frequency for the audience with higher lift. In a product-based campaign, give lower discounts to the audience with lower lift.
If one cohort had positive lift and the other had negative lift, stop emailing, advertising to, offering discounts to, or showing campaign experiences to the audience with negative lift.
If both cohorts show no lift or negative lift from a campaign, the campaign is ineffective or actively **reducing** conversions. Stop the campaign, then identify the problem. The issue might be the channel, campaign content, underlying cohort definition, or some combination of all three.
If both cohorts show similar lift, the campaign has an equal effect on all users, regardless of their organic conversion rates. The predictive cohort doesn't add incremental gains, and segmenting by predicted likelihood doesn't benefit this campaign in this channel.
In all scenarios, use the result to improve the next campaign. Even when the results aren't what you expected, each campaign can teach you about your users and channels.
================================================================================
# Recommendations: Help users reach the goals you've set for them
URL: https://amplitude.com/docs/analytics/predictive/recommendations
================================================================================
# Recommendations: Help users reach the goals you've set for them
After you identify a predictive goal for your users, create the **recommendations** most likely to help users reach that goal. Amplitude’s AutoML determines which items are most likely to maximize each user’s predictive goal, then places those items in front of the user.
Amplitude’s machine learning algorithm clusters your selected users into groups of similar users. Shared user properties and past behaviors determine this similarity. Next, Amplitude analyzes historical data to identify which items are most likely to increase each cluster’s propensity to convert. Finally, Amplitude assigns each user a ranked list of items based on their cluster.
The algorithm retrains every hour, so it incorporates new property and behavior information into its results.
{% callout type="note" %}
Recommendations support standard event properties only. Recommendations don't support merged, derived, or transformed properties.
{% /callout %}
## Best fit for recommendations
Recommendations work best for **user-based personalization**, not account-based personalization. They’re most useful for companies that need to show an array of items, such as products, articles, or shows, in a product carousel, product list, or cart flow. Ecommerce, marketplace, B2C, and subscription software companies get the most value from recommendations.
Enterprise B2B companies, on the other hand, rarely benefit from recommendations.
## Recommended use cases
Recommendations aren’t an analytics feature. They’re a personalization feature that helps you improve in-product and digital experiences to maximize lift. Recommendations work best for three user-based digital commerce personalization types: assortment, next-best action, and cross-sell.
- **Assortment**: Ranks items to display on a homepage or within a category page. These items can be SKUs, articles, shows, and similar content. Assortments are appropriate for **increasing engagement**.
- **Next-best action**: This scheme identifies a second item the user might be interested in and places it into the checkout or carousel flow, or in an email after purchase. Here, the objective is to **increase conversions**.
- **Cross-sell**: Ranks items that signify lifecycle stages the user hasn’t yet achieved. These items are usually categories, products, or subscription types. The primary objective is to **increase LTV**.
Amplitude is developing support for other use cases, such as in-session recommendations and new item recommendations.
## Data requirements for a recommendation
A recommendation has three data components: the outcome event, the exposure event, and the event property. For recommendations to work, you **must instrument** the data behind these components in your taxonomy:
- The **outcome event** is the objective goal for your recommendation. Often, the outcome event is something like “purchase” or “subscribe.” Track this outcome as an event in Amplitude Analytics.
- The **exposure event** is an action the user takes before the outcome event. Typical exposure events include “add to cart,” “click product,” or another event with an event property that configures an item for recommendation. Track this event **upstream in the conversion funnel** of the outcome event.
- The **event property** is the “item” that appears in the recommendation. This property often has a name like “SKU,” “ID,” “name,” “category,” or “brand.” Store this information as an **event property on the exposure event**.
Work closely with your Amplitude CSM to confirm your taxonomy meets these conditions.
To learn more, refer to [Build a recommendation](https://amplitude.com/docs/analytics/predictive/recommendations-build) and [Use recommendations in personalization campaigns](https://amplitude.com/docs/analytics/predictive/recommendations-use).
================================================================================
# Build a recommendation
URL: https://amplitude.com/docs/analytics/predictive/recommendations-build
================================================================================
# Build a recommendation
Amplitude lets you create recommendations for personalization campaigns. Recommendations can increase engagement, reduce churn, and create cross-selling opportunities.
## Build a new recommendation
To create a new recommendation, open Cohorts & Audiences and click **Recommendations** in the left rail. Click **Create Recommendation** and follow these steps:
1. Select the **type of recommendation** to create:
- **Top Trending**: Generates a list of items with the highest increase in popularity over a specific period. Use this type to identify new and emerging trends.
- **Most Popular**: Creates a list of the most popular items based on usage across all users. Use this type to highlight content or products that are trending and in high demand.
- **AI Based**: Uses an AI-based model to provide personalized content to each user. This type accounts for the user's past behavior and preferences to curate a tailored list of items. This recommendation type is the most sophisticated and can significantly improve user engagement and conversion rates.
{% callout type="note" %}
Only customers with Syncs and Models plans can use the Top Trending and Most Popular recommendation types. Contact your Customer Success Manager for more information.
{% /callout %}
2. Define your outcome. The outcome is the **goal you want to reach** or the **metric you want to improve**. In the _Define starting cohort_ section, choose the cohort this recommendation trains its algorithm on. By default, Amplitude selects all users active in the last 90 days. For best results, use a more narrowly tailored cohort. To narrow the cohort, select conditions such as performed events and filters. **If you're defining a Top Trending or Most Popular recommendation type, skip to step #6.**
3. **For an AI Based recommendation type**, create your item catalog by choosing the items you want to recommend to reach your outcome. Under _Define items to be recommended_, click **Select event...** to choose the exposure event.
4. Click **Select property...** to designate the item to recommend to the user. You don't select the item itself. Instead, choose an event property associated with the exposure event. The recommendation chooses the recommended item from the values of this event property.
5. Choose the items to recommend in the _Current list of items that will be recommended_ section. By default, Amplitude chooses from the 50 most frequent values of the event property you selected in the previous step, based on 30-day uniques.
You can also configure your recommendation to use a **static list** of property values. Toggle **Create with Static List** and select the candidates from the list of options. You can exclude specific values from a dynamic recommendation and choose to exclude converted items. Click **Next >** to continue to the _Save_ section. **Skip to step #11 to complete your new AI Based recommendation.**
6. **For a Top Trending or Most Popular recommendation type**, use the _Select time range of trend_ section. Specify the time frame for the user to complete the outcome event. The default setting is the past seven days. The Top Trending type includes an offset option with a default of two days.
{% callout type="note" %}
Recommendations support cohorts with fewer than 20 million users.
{% /callout %}
7. Under _Define your outcome_, choose the outcome event for this recommendation within a specified time frame. The default time frame is one hour for the outcome. Click **Next >** to move to the _Items_ tab.
8. Create your item catalog by choosing the items you want to recommend to reach your outcome. Under _Define items to be recommended_, click **Select event...** to choose the exposure event.
9. Click **Select property...** to designate the item to recommend to the user. You don't select the item itself. Instead, choose an event property associated with the exposure event. The recommendation chooses the recommended item from the values of this event property.
For example, a music app might want users to buy concert tickets from within the app. The app might show users who followed a playlist a concert popup, based on the genre of the playlist they followed. In this case, select the `genre` event property attached to the `follow_playlist` event. More generally, the event property often has a name like `SKU`, `ID`, or `Name`.
10. **Specify the number of items to recommend to each user.** By default, Amplitude chooses from the 50 most frequent values of the event property you selected in the previous step, based on 30-day uniques.
You can also configure your recommendation to use a **static list** of property values. Toggle **Create with Static List** and select the candidates from the list of options. You can exclude specific values from a dynamic recommendation as well. Then click **Next >** to move to the next step.
11. In the _Save_ tab, give your new recommendation a name and description.
12. Use the _Control_ slider to **configure the percentage of users to include as a control**. Amplitude randomly selects these users to receive a random set of items as a recommendation. Use this control group to measure the lift this recommendation generates. To exclude the same control group across multiple recommendations, click **Link to an Existing Recommendation** and choose an existing recommendation.
13. When you’re finished, click **Build**. Amplitude takes about an hour to generate your recommendation and sends you an email when it’s ready.
## Understand your recommendation
After Amplitude finishes building your recommendation, click the recommendation to view basic information about it. The recommendation opens to the _Overview_ tab.
The confidence score represents Amplitude’s confidence that this recommendation generates statistically significant lift relative to a random list of items.
{% callout type="note" %}
If the confidence score is less than 60, don't use the recommendation.
{% /callout %}
Below the confidence score, Amplitude lists items ranked by their frequency of appearance in the recommendation. The item at the top of the list is the item this recommendation suggests most often and the item most likely to result in a conversion.
The _Performance_ tab shows four statistics across the top:
- **Accuracy**: Amplitude Experiment conducts regular training runs using recent user data, then builds a model based on that data and recent user activity. Each training run excludes data from a percentage of users. After Amplitude finishes the model, it runs the model against this holdout group to estimate accuracy.
- **Lift against Baseline**: When Amplitude deploys a model, it shows recommendations to some users and random items to others. This statistic is the ratio of conversions in the group that saw recommendations to those that didn't.
- **Recommendation CR and Control CR**: These are the conversion rates in the population of users that saw a recommendation and the population of users that saw random items, respectively.
- **Significance**: The higher this number, the more confident Amplitude is of the result. Predictions and recommendations have their own built-in mini-version of Amplitude Experiment. The test group, control group, difference in conversion rates, number of exposures, and number of conversions all go into a standard significance calculation.
## Common mistakes in creating a recommendation
- **Using the wrong cohort**. Recommending all users can be sufficient, but sometimes you need a more specific cohort. Think about your goal and which users are the best candidates to achieve it. If your goal is to optimize for a second purchase, for example, select users who have already purchased once as the starting cohort.
- **Specifying the wrong outcome**. Your outcome event dictates the rankings of the selected items. If you optimize for “product purchased WHERE amount > $100,” the recommendation prioritizes expensive items. Confirm that you want this behavior before launching the recommendation.
- **Wrong exposure event timing**. If you choose an exposure event that occurs **after** the outcome event, the recommendation doesn't train properly.
- **Wrong exposure event context**. The context for the event property depends on its exposure event. The event property’s name can easily mean different things on “product clicked” vs “button clicked.”
- **Wrong event property**. For example, Product Name and Product ID convey the same basic information, but in very different formats. Make sure the one you select matches how your CMS stores data.
- **Outcome event doesn't have enough unique actions**: Confirm the outcome event has at least 50, and ideally 100, unique user actions every day. If conversion numbers fall below this threshold, the model doesn't detect signals and recommends the same content for all users.
================================================================================
# Use recommendations in personalization campaigns
URL: https://amplitude.com/docs/analytics/predictive/recommendations-use
================================================================================
# Use recommendations in personalization campaigns
After you create a new recommendation, integrate it into your personalization campaigns. This article describes how to use the Profile API for that process.
## Deploy your recommendation
The primary destination for deploying a recommendation is Amplitude’s [Profile API](https://amplitude.com/docs/apis/analytics/user-profile). You can call this real-time API by user ID or device ID. In less than a second, Amplitude returns an array of information about the user.
To give a recommendation access to the Profile API, go to the _Syncs_ tab and select the Profile API as a destination for the recommendation.
### The API
The Profile API is a REST endpoint. Query it by user ID or device ID to receive JSON responses for each user:
`https://profile-api.amplitude.com/v1/userprofile`
To authenticate to the API, use the **Secret Key** from the project settings in Amplitude (_Settings > Projects > [select project] > General_).
Set query parameters to specify the user ID and recommendation. The API returns results as a JSON response body.
The following example request returns results for a specific user and recommendation. Find the recommendation ID in the _Details_ section of a recommendation page.
```bash
curl -H "Authorization: Api-Key Secret-Key" 'https://profile-api.amplitude.com/v1/userprofile?user_id=myuser&rec_id=s234ssg'`
```
A sample response for this query is:
```json
{
"userData": {
"recommendations": [
{
"rec_id": "s234ssg",
"is_control": true,
"items": [
"investing-101",
"mortgage-rates-primer",
"retirement-goals",
"what-is-a-cd",
"setting-up-direct-deposit"
],
"recommendation_source": "recommendations_model_v2",
"last_updated": 1614192260
}
],
"user_id": "myuser",
"device_id": "bef34a71-62cd-5b2e-af2f-58cd2eabb4d9",
"amp_props": null
}
}
```
The response contains three key pieces of information:
- `rec_id`: The unique identifier of the recommendation.
- `is_control`: A true or false result that indicates whether the user belongs to the control or treatment for the recommendation.
- `items`: An array of strings. Amplitude orders items by predicted likelihood to optimize the outcome, with the highest-probability item first.
You can also use the API to retrieve user properties, predictions, and cohort membership. The following example sends a request to retrieve a recommendation, all user properties, a prediction, and cohort memberships:
```bash
curl -H "Authorization: Api-Key Secret-Key" 'https://profile-api.amplitude.com/v1/userprofile?user_id=myuser&rec_id=s234ssg&get_amp_props=true&prediction_id=t456tth&get_cohorts=true'
```
A sample response for this query is:
```json
{
"userData": {
"user_id": "myuser",
"device_id": "bef34a71-62cd-5b2e-af2f-58cd2eabb4d9",
"amp_props": {
"country": "United States",
"city": "Springfield",
"first_used": "2019-04-30",
"language": "English",
"carrier": "Verizon",
"last_used": "2021-02-25",
"plan_type": "starter",
"device": "samsung samsung SM-N976V",
"os": "android 30",
"app_version": "6.1.0",
"gp:membership_points": "1752",
"gp:initial_utm_campaign": "abcd",
"gp:email": "user@example.com"
},
"recommendations": [
{
"rec_id": "s234ssg",
"items": [
"investing-101",
"mortgage-rates-primer",
"retirement-goals",
"what-is-a-cd",
"setting-up-direct-deposit"
],
"is_control": false,
"recommendation_source": "recommendations_model_v2",
"last_updated": 1614192260
}
],
"predictions": [
{
"name": "Likelihood to Convert",
"percentile": 97.5,
"pred_id": "t456tth",
"probability": 0.734
}
],
"cohort_memberships": ["u567uui"]
}
}
```
### Integrate the API
The Profile API makes embedding recommendations into a customer’s digital workflows extensible. To integrate the API, follow these steps:
1. Call the API:
- Pass in a user ID or device ID to retrieve a user profile.
- Make calls in real time during a user session to retrieve the most recent user profile at the moment of the call.
- Make calls at application startup and cache the profile throughout a user session. The Profile API returns with low latency and handles reasonable traffic volume, but caching can reduce latency variability. The tradeoff is that results might be less fresh. In most cases, cached results remain valid for several hours or longer.
- Don't publish the application-level secret key to client-side apps or web source code. Use a backend or proxy to validate user identity and forward requests to Amplitude’s API.
2. After the API returns a response, decide which recommended experience to serve by checking the value of `is_control`:
- If `false`, use `items` in the recommended payload.
- If `true`, default to the baseline product experience. Amplitude populates `items` with a random selection of items, which might or might not be a good baseline.
- If the `recommendations` block is `null`, or the API returns an error, default to the baseline product experience. This means either Amplitude doesn't yet know the user, or the user doesn't have enough history to provide recommendations.
3. Match the returned items from the payload with your internal CMS or feature flagging system to indicate which items to serve to the user.
4. Integrate the API with your delivery system.
- If serving users through an internal system, follow your normal delivery method.
- If serving experiences through Braze connected content, [follow these instructions](https://www.braze.com/docs/user_guide/personalization_and_dynamic_content/connected_content/making_an_api_call/#using-basic-authentication).
- If serving experiences through Movable Ink, [follow these instructions](https://github.com/movableink/Developer-Docs).
## Analyze your results
After you deploy the Profile API into a customer’s app, website, or email channels, Amplitude measures recommendation performance. Amplitude logs an event, `[Recs] Recommendation Event`, each time something calls the Profile API for that specific recommendation.
{% callout type="note" %}
This event **doesn't count** against your event volume.
{% /callout %}
To view the performance of your recommendation, open the recommendation you’re interested in and click the _Performance_ tab.
Amplitude shows summary stats from a funnel conversion chart:
- Lift against baseline.
- Recommendation conversion rate.
- Control conversion rate.
- Significance.
Amplitude defines "significance" as the value of `1 - *p*`, where _p_ comes from a two-sided _t_ test. In some cases, certain previously saved charts might still display chance to outperform to maintain consistency with past results.
This funnel compares two segments: a **control** segment and a **treatment** segment. For the control segment, `recommendations.recommendation_control = True`. For the treatment segment, `recommendations.recommendation_control = False`.
The default funnel consists of two steps: the exposure event and outcome event. You can update these steps manually if needed. The funnel shows a comparison of the two segments over time.
To determine whether the difference between the Control and Treatment segments is statistically significant, check the value in the Significance column.
Use these results to quantify each recommendation's impact.
================================================================================
# Customize the Home page
URL: https://amplitude.com/docs/analytics/customize-home-page
================================================================================
# Customize the Home page
Admins and managers can customize the Home page layout for Amplitude users on a per-project basis. Custom Home pages help project managers and project admins distribute important insights to their team members and ensure new teammates receive relevant charts when they join.
## Customize the Home page experience for a team
You must be an admin or a manager of a project to customize the Home page experience.
1. Open the project and look for a blue bar across the top. Alternatively, navigate to _Organization Settings > Project_, and find it there.
2. Click _Set Custom Homepage_. An edit screen opens. On this screen, you can remove default charts, add custom charts, and organize the layout.
3. Click _Save changes_ to finalize the custom Home page layout. All users in this project who didn't already customize their personal homepage see this new layout as the default, including all new users.
4. To return to the original layout, click the reset button in the top right.
{% callout type="note" title="Home page precedence" %}
Personal customization of a user’s Home page always takes precedence over any admin- or manager-enabled defaults.
{% /callout %}
================================================================================
# Breadcrumbs: Track, organize, and share your analyses
URL: https://amplitude.com/docs/analytics/breadcrumbs
================================================================================
# Breadcrumbs: Track, organize, and share your analyses
Complex analyses are difficult to track.
Amplitude's Breadcrumbs feature stores every step of your analysis in one place. Bookmark your chart, add a short note, and Breadcrumbs puts your analysis in an [interactive notebook format](https://amplitude.com/docs/analytics/notebooks) that you can share with your team and other stakeholders.
With Breadcrumbs, you can:
- Trace the path you took to get to an insight
- Take notes as you go
- Eliminate the need to retrace your steps before sharing results with the team
- Preserve the context of your analysis, so you can pick up where you left off
Breadcrumbs works with any Amplitude chart type.
## Breadcrumbs use cases
- **Workflow simplification:** Transferring multiple charts and analyses into a notebook at the end of the process takes time. Breadcrumbs lets you build the notebook as you go.
- **Analysis history:** Showing how a chart changed and how you reached its conclusion can help stakeholders understand the result. [Notebooks](https://amplitude.com/docs/analytics/notebooks) can help with this, and Breadcrumbs makes the process more efficient.
## Use Breadcrumbs to add charts to Notebooks
To add a chart to a notebook using Breadcrumbs, follow these steps:
1. Open Amplitude and build a chart. Breadcrumbs works with any chart type.
2. When your chart is ready, click _More > Open Notebook View_. Amplitude opens the Notebook panel on the right.
3. Click _Add chart to notebook_. A thumbnail of your chart appears in the Notebook panel.
4. Amplitude opens a new Notebook by default. To add your chart to an existing Notebook instead, click the dropdown next to the Notebook title and select the Notebook from the list.
5. In the thumbnail, click the title to edit it for the Notebook. Editing the Notebook title also changes the title of your main chart.
6. To add a note to accompany the chart in the Notebook, click _Add Note_.
7. To view and share the notebook, click the breadcrumb share icon. The Notebook view opens. Click _Share_ to share the notebook with other team members. You can return to the Breadcrumb view using the Notebook toolbar.
================================================================================
# Search: Find charts, dashboards, cohorts, and notebooks
URL: https://amplitude.com/docs/analytics/search
================================================================================
# Search: Find charts, dashboards, cohorts, and notebooks
Amplitude Search finds charts, dashboards, cohorts, notebooks, experiments, and flags across your organization, including content created by other members.
Amplitude generates results in real time as you change your search parameters, and ranks them by your recent activity and by content trending in your organization.
## Search for charts, dashboards, cohorts, and notebooks
1. In the top navigation bar, click the Search bar.
2. In the _Search_ field, enter the word or phrase you want to search for. Click the relevant result in the dropdown, or press Enter to view a full list of results. If the dropdown includes the result you want, click it. Otherwise, continue to step 3.
3. To add a filter to your query or apply advanced sorting logic, go to the _Filter_ section and set up filters for the search. Your options include:
- Limiting your search to **archived** items only
- Limiting your search to **official content** only
- Limiting your search to **templates** only
- The **space** the item belongs to
- **Type** of item (chart, cohort, dashboard, experiment, flag, or notebook)
- The **editor**, or creator, of the item
- The **project** the item belongs to
- Limiting your search to **generated content** only
- The **last edited** date (in the last week, last month, last year, or any time)
4. Click any item in the list of results to open it.
{% callout type="note" heading="" %}
If a content owner has set an item to be non-discoverable, it doesn't turn up in search results. This restriction doesn't apply to managers or admins.
{% /callout %}
{% callout type="note" heading="AI-generated content in search" %}
AI-generated content (charts, dashboards, and more) is undiscoverable by default. Search shows AI-generated content you created, and AI-generated content another user explicitly publishes as discoverable.
Amplitude introduced the `isGenerated` flag in November 2025. Content generated before that date doesn't have this flag, so it doesn't appear when you filter by generated content.
{% /callout %}
================================================================================
# Workspace: Find your charts and track your work
URL: https://amplitude.com/docs/analytics/workspace
================================================================================
# Workspace: Find your charts and track your work
Your workspace allows you to find your Amplitude analyses quickly and reliably, so you can get back to work. This page is only visible to you and includes content you have saved, as well as content you were working on but is still in draft mode.
To find your workspace, navigate to *Spaces > Personal Space*.
Open an item in your workspace by clicking it.
You can find specific types of content by using the *Filter* drop-down.
================================================================================
# Bulk manage charts with Chart Cleanup
URL: https://amplitude.com/docs/analytics/bulk-manage-charts-with-chart-cleanup
================================================================================
# Bulk manage charts with Chart Cleanup
Admins may need to identify and delete unneeded charts from various projects. The Chart Cleanup feature in organization settings lets admins search and view saved charts from all projects to determine what to delete.
## View and delete charts
Navigate to _Settings > Organization Settings > Chart Cleanup_. The chart cleanup settings area displays organization-level metrics for all saved charts, charts not viewed within the last 60 days, and charts saved by the admin.
By default, Amplitude displays a list of all saved charts in the organization. The list includes owner, project name, last updated date, and last viewed date.
Click a metric to filter the list by metric type. Search for a saved chart by its title in the search field, with optional filters for owner, space, or project name.
Delete a chart by clicking the checkbox next to its name in the list, and then clicking _Delete_. To bulk delete all charts in the list, click the checkbox next to _Name_ in the field headers. A confirmation modal appears.
Deleted charts are no longer accessible by anyone in the organization. The events used to build the deleted charts are not affected.
================================================================================
# Releases: Understand how users respond to product changes
URL: https://amplitude.com/docs/analytics/releases
================================================================================
# Releases: Understand how users respond to product changes
In Amplitude, a release represents a change in your product. Releases include major updates like the launch of a new feature, minor patches that fix small bugs, and experiment launches. Releases display as a marker in your time-series charts when they occur.
## Create a release
### Automated releases
If you're on a **Growth** or **Enterprise** plan, Amplitude continuously listens for a new value for the `Version` user property. When Amplitude detects a new value, it automatically creates a release the next day. It applies the following heuristics when creating a new release:
- A release must follow [semantic versioning format](https://semver.org/): `major.minor.patch` with `.patch` as optional. For example, `Version = 12345` doesn't automatically create a release, but `Version = 123.45.6` does.
- Amplitude excludes development projects (projects that contain names like "Test", "Development", "Staging," and so forth) from automatic release generation.
- If you send event data server-side through Amplitude's HTTP/Batch API, use the `app_version` user property.
Automated releases aren't created retroactively for backfilled data.
#### Configure an automated release
You can configure automated release detection in the _Release Timeline_ if you're an admin or manager. Click the settings icon to open the _Project Settings_ flyout panel. From there, you can enable or disable automatic release detection and automatic annotation.
### Manual releases
If your product doesn't use semantic versioning, or you're on the **Plus** plan, you can manually create a release from the [release timeline](#the-release-timeline-view) frame, or from the Microscope in a chart.
To create a manual release, click _Create Release_ and fill in the modal that appears.
- **Release name**: The name of the release. This is visible on charts and in the _Release Timeline_.
- **Version**: The `Version` user property that defines the product change. Amplitude uses this field to show you any new events introduced in the release, in the [Release Report](#the-release-report). The Version field selected must be an existing value in your data.
- **Description**: The product change brought about in the release. This is visible in the release timeline view.
- **Release date**:The date the release shipped.
- **End date**: The end date of the release rollout.
- **Platforms**: The `Platform`(s) this release applies to.
- **Visibility**: Whether the release is visible on all charts or not.
### Releases API
Create releases programmatically with the [Releases API](https://developers.amplitude.com/docs/releases-api). This allows you to integrate the creation of releases into your own internal deployment processes.
## Edit a release
Edit manually created or automatically detected releases to add context and information. To edit a release, open the release from within the release timeline view and click _Edit_.
By default, all releases are visible across all charts. You can toggle the visibility of a release from the [release report](#the-release-report) page (this view), or the release timeline view.
## The release report
From the _Release Timeline_, click a release to view the release report. A release report is a collection of metadata and analysis generated by Amplitude.
In the _Metrics_ section, you can view the number of unique users exposed to your release and the percentage of your active user base that figure represents. The percentage of active users is the number of users that have seen the release version divided by the number of users on the platform specified in the release definition.
If the release includes new events, Amplitude shows them in the table to the right of _Metrics_. The _% Active_ metric shows the percentage of your active user base triggering the new events detected since the release date.
The _Adoption_ section shows a time series depicting adoption of your release since its launch date. Amplitude limits the time series to 30 days since the start of the release.
### Add items to a release
You can link to other Amplitude content in the _Analyses_ section. This makes it easy for others in your organization to understand how the experiences you've launched have performed, and the impact they've had on your users.
Use releases to distribute both context and outcomes across your team.
To attach items to a release, click _+ Add Item_ in the _Analyses_ section of the Release Report.
## The release timeline view
The _Release Timeline_ serves as a history of all product updates your team has shipped. The timeline includes releases Amplitude automatically created and releases your team manually added.
To access the _Release Timeline_, follow these steps:
1. Navigate to _Settings> Organization settings > Projects_.
2. Find the project you're interested in and click it.
3. Open the _Releases_ tab.
{% callout type="note" %}
The release timeline view only populates new versions in real time. When backfilling historical data, Amplitude doesn't consider these releases to be new, as they happened in the past. You must manually add any backfilled releases to the timeline.
{% /callout %}
================================================================================
# Create, edit, and manage dashboards
URL: https://amplitude.com/docs/analytics/dashboard-create
================================================================================
# Create, edit, and manage dashboards
A dashboard groups multiple saved charts into one page so you can monitor related metrics side by side instead of opening each chart on its own. Dashboards also combine charts from different projects in the same view, which makes them useful for cross-product KPI tracking and executive reporting.
Use a dashboard when you need a recurring view of charts that already exist. If you want a single chart with narrative analysis around it instead, use a [notebook](https://amplitude.com/docs/analytics/notebooks).
Save the charts you want to include before you start. If you haven't created any yet, go to [Create your first chart](https://amplitude.com/docs/get-started/create-a-chart) first. Dashboards don't support [Pathfinder Users](https://amplitude.com/docs/analytics/charts/journeys/journeys-understand-paths), and Free plans cap dashboard subscriptions at 50.
## Create a dashboard
To create a dashboard, follow these steps:
1. Navigate to _Create > Dashboard_ to create a dashboard from scratch. Or click _+ Add to_ from within an existing chart and select _+ Create a new dashboard_ from the menu.
2. Type the name of your new dashboard where it reads _Untitled Dashboard_. Amplitude saves your new, still-empty dashboard.
3. To add content to your dashboard, click _Add Content_ and select the type of content you want to include from the drop-down. Then select the specific items from the panel that opens on the right.
{% callout type="note" %}
You can also build your dashboard from an existing template by clicking _Start With A Template_ and choosing from the dropdown list.
{% /callout %}
{% callout type="tip" heading="" %}
You can edit dashboards using natural language through [Global Agent](https://amplitude.com/docs/amplitude-ai/global-agent-overview) or [Amplitude MCP](https://amplitude.com/docs/amplitude-ai/amplitude-mcp). Ask Global Agent to add or remove charts, update the layout, or rename a dashboard without opening the editor.
{% /callout %}
## Edit a dashboard
If you're the owner or co-owner of a dashboard, you can edit it. Edits include adding charts or cohorts and designating the dashboard as an official source of truth within your organization.
### Add charts to your dashboard
You can add charts to your dashboard either from inside the dashboard, or from within the chart itself. To populate your new dashboard with charts **from within your dashboard**, follow these steps:
1. From within the dashboard, click *+ Add Content* and select the type of content you want to include from the drop-down. Then select the specific items from the panel that opens on the right.
2. Repeat step 1 until you've added all the content you need for your dashboard.
### Add cohorts to your dashboard
You can add a [behavioral cohort](https://amplitude.com/docs/analytics/behavioral-cohorts) to a dashboard. This displays the number of users in a cohort and the date and time of its last computation.
{% callout type="note" %}
This feature is only available to customers on a Scholarship, Growth, or Enterprise plan.
{% /callout %}
To add a cohort to your dashboard, follow these steps:
1. Save your cohort and click _+ Add to._
2. Select the dashboard you want to add this cohort to from the list.
{% callout type="note" %}
You can also add a cohort to your dashboard from within the dashboard. Select _Add Chart or Cohort_ from the _More_ menu.
{% /callout %}
You can view any cohort on your dashboard by current cohort population, or the cohort population over time. To switch to viewing the cohort population over time, click •••. Then select _Population Over Time_.
{% callout type="note" %}
For any chart or query that segments on a cohort, the segmented cohort automatically recomputes itself whenever the chart generates. Cohorts added to dashboards also refresh.
{% /callout %}
### Add a Session Replay to your dashboard
You can add a Session Replay to a dashboard or notebook from:
- From the Session Replay page itself (accessible from the homepage and Session Replay search)
- From within [User Look-Up](https://amplitude.com/docs/analytics/user-data-lookup)
- From within an individual chart
### Add an image or video to your dashboard
Amplitude dashboards support adding images or video content.
To add a video to a dashboard:
1. On the dashboard, click _+Add Content > Video_.
2. In the new section that appears, paste the URL of a Loom, Vimeo, Zoom, or YouTube video.
To add an image:
1. On the dashboard, click _+Add Content > Image_. The system tray opens.
2. Select the image file on your computer to upload. Amplitude dashboards support the following image types: `.jpg,.jpeg,.jpe,.jif,.jfif,.jfi,.gif,.png,.apng,.svg,.svgz,.bmp,.dib,.ico`.
### Designate your dashboard as "official"
In many organizations, Amplitude users need to identify charts and dashboards that the organization trusts as accurate, up to date, and relevant. In analysis-heavy organizations, the volume of ad hoc analyses can overwhelm trusted content. Official Dashboards make trusted content easier to find and reference, so newer users can find vetted analyses faster.
When you designate a dashboard as official, you tell all Amplitude users in your organization that they can trust the dashboard content as current, accurate, and vetted. Use official dashboards to track and broadcast company-wide KPIs, team-specific KPIs, final analysis for a feature or experiment, or onboarding resources for new team members.
This feature is only available for users on the Enterprise plan.
{% callout type="note" %}
Only an admin or manager can designate an official dashboard.
{% /callout %}
To label a dashboard as official, follow these steps:
1. Open the dashboard you’d like to make official.
2. Hover over the icon next to the dashboard’s title.
3. In the popup that appears, click _Confirm_.
You are now a co-owner of the dashboard; this includes editing privileges. If you aren't the original owner of the dashboard, that person receives a notification.
{% callout type="note" %}
Removing a dashboard’s official designation works the same way.
{% /callout %}
## Copy, download, export, refresh, or archive your dashboard
The _More_ menu contains several administrative functions not discussed above.
- Refreshing the dashboard updates all charts and cohorts included in your dashboard.
- When downloading a CSV of a chart, the downloaded file contains a summary of the chart, the dashboard URL, and all events, segments, and user properties.
- When exporting your dashboards, you can choose between PDF and PNG formats.
- When copying a dashboard, you own the copied version, regardless of whether you own the original version.
- The owner, an invited editor, or an organization admin can delete or archive dashboards. Viewers and members can't delete or archive dashboards.
- You should archive a dashboard when your organization no longer supports or uses it. Users can still search for archived charts in the Search tab. Archiving a dashboard doesn't archive the charts within the dashboard.
{% callout type="note" heading="" %}
Use the [Dashboard Agent](https://amplitude.com/docs/amplitude-ai/dashboard-agent) to analyze your dashboard's charts. The Dashboard Agent identifies trends, anomalies, and cross-chart correlations, and generates prioritized insights and recommendations.
{% /callout %}
## Dashboard cache times
Amplitude caches chart results. The cache time depends on the interval (daily, weekly, monthly) and the length of time covered. Refer to [chart cache times](https://amplitude.com/docs/analytics/charts/chart-basics). Cache times for dashboards and CSV downloads are twice as long as the listed chart cache times.
To manually refresh all charts and cohorts on a dashboard, click _More > Refresh Dashboard_.
================================================================================
# Filter your dashboards
URL: https://amplitude.com/docs/analytics/dashboard-filter
================================================================================
# Filter your dashboards
With filtering, you can temporarily or permanently filter all the charts in your dashboard to an alternate date range, interval, or property.
To apply a filter, follow these steps:
1. Open the dashboard where you’d like to apply a filter.
2. To filter by interval, click the _Daily_ dropdown and select the interval.
3. To filter by date range, click one of the preset values, such as last seven days, 30 days, 60 days, or 90 days. You can also set the date range manually using the date picker.
4. To filter by property, click _Add Filter_ and choose the property you want to filter on. Then enter the value. You can select more than one property to include in your filter.
After you apply a filter, click **Copy URL** to share your bulk changes with others. Opening this URL opens your dashboard with the bulk filter already applied.
================================================================================
# Change your dashboard's display preferences
URL: https://amplitude.com/docs/analytics/dashboard-preferences
================================================================================
# Change your dashboard's display preferences
Dashboard display preferences control how a dashboard presents its data. You can show each chart as a chart, KPI, or table, add target metrics that mark the values your team wants to reach, and switch to a full-screen TV mode for shared monitors.
## Dashboard display options
- Display your dashboards as charts, KPIs, or tables
- Add target metrics to your dashboards
- View your dashboards in full-screen mode
After you create and populate your dashboard with charts or cohorts, you can modify its display settings to best accommodate your team's needs.
## Display as charts, KPIs, or tables
You can display any [Event Segmentation](https://amplitude.com/docs/analytics/charts/event-segmentation/event-segmentation-build) charts, conversion Funnel charts, and User Session charts you add to your dashboard as a chart, a table, or a single KPI. To switch between display modes, click ••• in the lower-right corner of your chart, and select your display from the _Visualization_ section of the menu.
{% callout type="note" %}
Amplitude limits KPI options to Average Session Length and Average Sessions Per User for a User Sessions chart. Also, only the dashboard owner can change the display mode of any included charts.
{% /callout %}
### Display takeaway metrics
Some charts in your dashboard have the _Display takeaway metrics_ option to display summary metrics at the top of the chart. Applicable charts have these restrictions:
- **Event Segmentation**: Summary metrics aren't available for the frequency metric or bar charts.
- **Funnel Analysis**: When using "measured as conversion," summary metrics are only available for conversion charts with a single series, meaning one user segment without a group-by filter.
- **User Sessions**: Summary metrics aren't available for the distribution of session length metric.
To turn summary metrics on or off:
1. From your dashboard, choose the chart you want to display summary metrics for. Ensure the chart type is one that supports summary metrics: Event Segmentation, Funnel Analysis, or User Sessions.
2. Click ••• to open the chart's menu and click _Display takeaway metrics_ to turn them on.
3. To turn off summary metrics, reopen the chart's menu and click _Display takeaway metrics_ to turn them off.
In the Event Segmentation chart below, _Display takeaway metrics_ is on. The current day is July 25, and the chart shows total article views in the last 30 days:
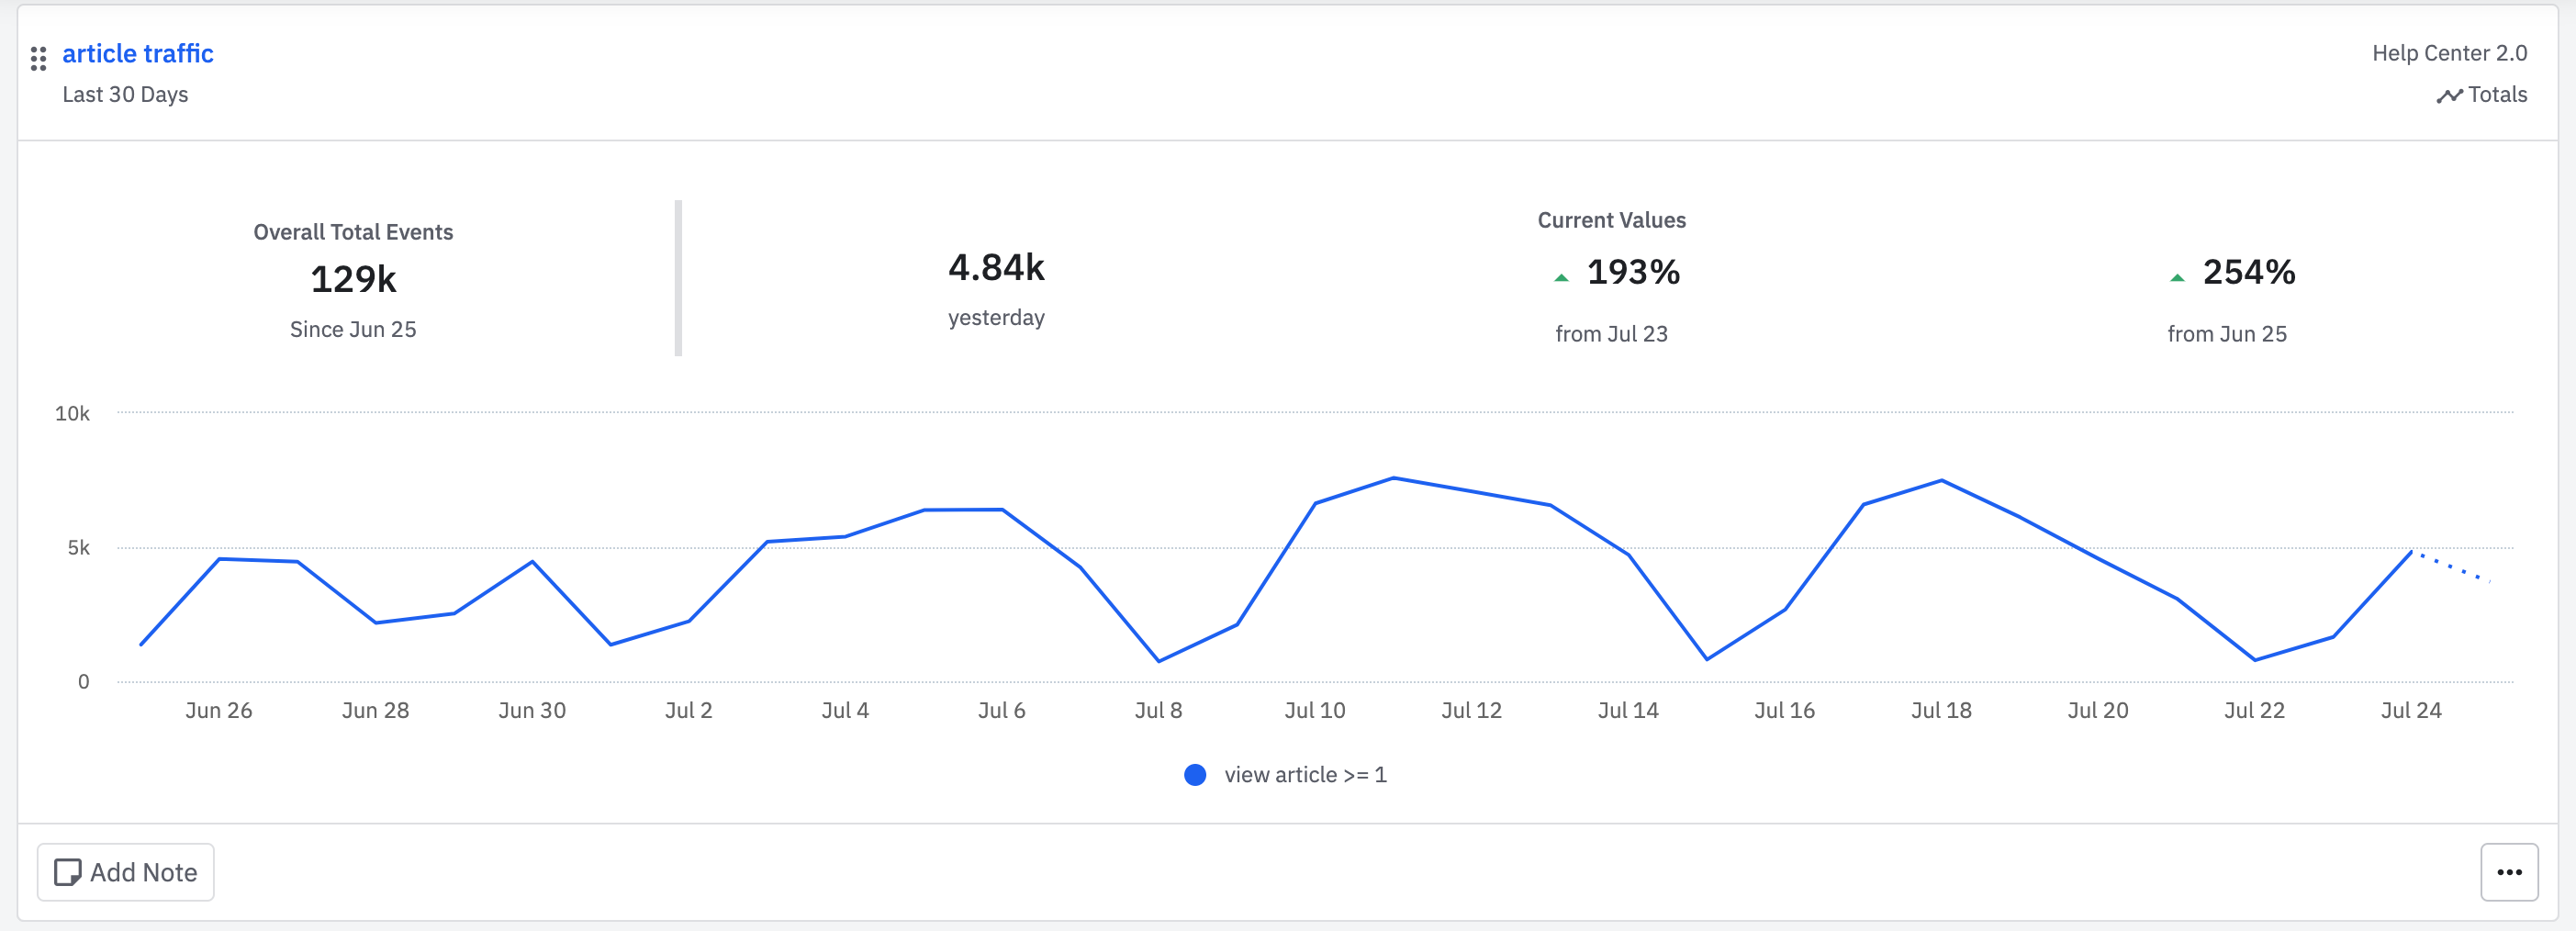
- **129k**: Total across the entire date range. In this case, there were about 129k total article views from June 26 to July 25.
- **4.84k**: The metric in the most complete interval. In the example, there were about 4.84k views on July 24.
- **193%**: The difference since the previous interval. In the example, there was a 193% increase in article views from July 24 to July 25.
- **254%**: The difference compared to the beginning of the date range. In the example, there was a 254% overall increase in new users since June 26.
In another example, look at an Event Segmentation chart with a custom formula. In this scenario, _Display takeaway metrics_ is still on, but the chart now includes an _Overall Value_ that counts active users. Although the next three examples highlight active user counts over the same 30 days, the _Overall Value_ varies because of the different windows (daily, weekly, or monthly):
- **592k**: Daily Active Users (DAU) is the number of unique users who were active on _each_ day in the last 30 days.
- **631k**: Weekly Active Users (WAU) is the unique count of users who were active in **at least 1 day in a 7-day window** in the last 30 days.
{% callout type="note" %}
The DAU and WAU overall values could have matched in this example if an underlying 7-day **lookback window** had been added to both.
{% /callout %}
- **734k**: Monthly active users (MAU) is the unique count of users who were active in **at least 1 day in the last 30 days**.
## Add target metrics
You can add a target metric for Event Segmentation, conversion Funnel, and User Session charts when using a chart visualization. Target metrics allow you to display the metric value your team is trying to achieve for the selected chart. You may also add a target date to the metric.
{% callout type="note" %}
The _Add Target Metric_ option appears on conversion funnel charts with one user segment.
{% /callout %}
To add a target metric:
1. Click ••• in the lower-right corner of the chart and click _Add Target Metric_.
2. In the _Add Target Metric_ modal, set your target for the chart's current KPI metric.
If this isn't the metric you want, change the KPI metric on the chart and try again. 3. Check _Show progress bar towards target_ to display both a visual progress bar of the distance to your goal and the baseline number for measuring your progress. 4. Click _+ Add Target Date_ to add an optional target date. 5. Click _Save_.
## View your dashboard in full-screen mode
When displaying your dashboards on TV screens or shared monitors, a full-screen view often provides the best experience. To enter full screen, click _More_ and select _Enter TV Mode_ from the dropdown menu.
{% callout type="note" %}
When using TV mode, the dashboard refreshes every five minutes. However, the charts in the dashboard refresh according to [this schedule](https://amplitude.com/docs/analytics/charts/chart-basics).
{% /callout %}
================================================================================
# Turn your dashboard into a template
URL: https://amplitude.com/docs/analytics/dashboard-create-template
================================================================================
# Turn your dashboard into a template
You can turn dashboards into templates that help teams recreate common analyses and share best practices. Templates save time when teams repeat common analyses and help new team members measure impact.
To designate a dashboard as a template, follow these steps:
1. In your dashboard, click _More_ and select _Tag as Template_ from the dropdown menu.
2. In the _Templatize Dashboard_ modal, set the discoverability toggle to on or off, and add any instructions you want to communicate to template users. If you don't add custom instructions, Amplitude uses the default boilerplate. Then click _Save_.
{% callout type="note" heading="Permissions" %}
Only dashboard owners or editors can create a template from a dashboard.
{% /callout %}
After you templatize your dashboard:
- The dashboard carries a template icon.
- The dashboard includes the template instructions you added in step 2.
- The dashboard includes a _Save As New Dashboard_ button for creating copies from the template.
You can find templates using Search or Spaces. Look for the template icon. You can also filter for dashboard templates in Search using the Template filter under _Tags_.
## Template use cases
Some common use cases for templates in Amplitude include:
- **A/B testing:** Swap out user or event properties or cohorts with each new experiment’s variants
- **Releases:** Swap out version, campaign, region, and so forth, to track performance or key metrics for new releases
- **Usage or engagement dashboards:** Segment by feature/product, region, device, customer, channels, and so forth, to analyze metrics like engagement with critical events, or specific noteworthy funnels
- **B2B or partner use-cases:** Create different dashboards segmented by customer account or partner
- **Amplitude new user onboarding:** Templates for the above use cases to help onboard new Amplitude users by acclimating them to the types of analyses most often performed by their new teams.
For more information on templates, review [Templates: Re-use your analyses](https://amplitude.com/docs/analytics/templates).
================================================================================
# Subscribe to a dashboard
URL: https://amplitude.com/docs/analytics/dashboard-subscribe
================================================================================
# Subscribe to a dashboard
When you subscribe to a dashboard, you receive an HTML-formatted email report with optional CSV files. Amplitude can send dashboard subscription emails to anyone, including people who aren't members of your Amplitude organization.
To subscribe to a dashboard:
1. From within the dashboard you want to subscribe to, click _Subscribe_. The _Subscribe to Dashboard Reports_ modal opens.
2. In the _Email_ tab, your name appears in the _Subscribe yourself_ or _Add new subscribers_ field. Set your preferred update frequency and click _Add_. For optimal performance, emailed dashboards contain images of the first eight charts on the dashboard. To view all charts, recipients can click through to the full dashboard.
{% callout type="note" %}
If you own or co-own the dashboard, you can add other subscribers. The _Subscribe yourself_ field appears as _Add subscribers_.
{% /callout %}
3. To subscribe a Slack channel to the dashboard, click the _Slack_ tab. In the _Add new subscriber(s)_ field, enter the names of the Slack channels you want to subscribe to this dashboard. Notifications take the form of automated recurring dashboard PDFs, paired with a link back to the dashboard, sent to Slack channels you designate.
Dashboard owners can add subscribers to a dashboard and set the update frequency (for example, every Monday at 12 PM UTC), with or without an attached CSV file. Dashboard owners can also customize the frequency of email reports for each person.
Navigate to *Settings > Organization Settings >* *Content Access > Dashboard Subscriptions* to view and manage your dashboards.
Admins can view and delete any dashboard subscriptions in their organization.
{% callout type="note" heading="" %}
For automated dashboard analysis with prioritized insights and recommendations, use the [Dashboard Agent](https://amplitude.com/docs/amplitude-ai/dashboard-agent). You can schedule it to run automatically and push findings to Slack or email.
{% /callout %}
================================================================================
# Collaborate on your analyses using spaces
URL: https://amplitude.com/docs/analytics/collaborate-with-spaces
================================================================================
# Collaborate on your analyses using spaces
This article explains how to use [spaces](https://amplitude.com/docs/get-started/spaces) to organize analysis work.
## Join an existing space
To subscribe to an existing space, click the **Spaces** drop-down, then click **View all Spaces**. Scroll down until you find the space you're looking for, and click **Join**.
When you join a space, Amplitude stars it automatically and adds it to your list of joined spaces. You can un-star a space and remove it from your list by clicking the star icon on the space itself.
## Move content to a new space
You can save each piece of content to a single space. Follow these steps to move content to a new space:
1. Navigate to the space where the content is. Check the box next to its name.
2. In the menu bar above the content list, click **Move**. A navigational flyout panel opens.
3. Navigate to the space or folder you want, or create a new space or folder. Then click **Move**.
## Create a shortcut
A shortcut adds content to multiple spaces and folders. Anyone can create a shortcut to a piece of content, but only an owner of the original content can move the original content to a new space.
1. Open a piece of content you'd like to share to multiple spaces.
2. Navigate to _More > Add Shortcut_.
3. Navigate to the space or folder you want, or create a new space or folder. Then click **Add Shortcut**.
## Manage space members
You can add new members to your space or manage current member permissions through **Manage Members**.
When you add a member to a space as a viewer or editor, they can view or edit all content within that space. The only exception is when the member lacks permissions for a particular project with content stored in the space. Project permissions always take priority over space-level permissions.
Spaces have three permission levels:
- **Can edit**: The user can edit, archive, and save changes to all content in the space.
- **Can add**: The user can add items or folders, or move existing content.
- **Can view**: The user can only view the content residing in the space.
To add a new member to a space, follow these steps:
1. Click _Manage Members_ to open the _Manage Members_ modal.
2. Click the _Add people_ field and select the new member from the drop-down list. Repeat this step for each new user who requires the same permissions level.
3. Set the permissions level for the new user from the drop-down menu.
4. Click _Share_.
To modify a space member's permissions, follow these steps:
1. Click _Manage Members_ to open the _Manage Members_ modal.
2. Scroll until you find the user whose permissions you want to modify. Open the drop-down opposite their name and select the new permissions level, or click _Remove_ to remove the user from the space.
## Slack integration
When you connect spaces to specific Slack channels, you receive notifications whenever your team creates new analyses. When new content gets added to that team space in Amplitude, it's posted in the Slack channel.
To do this, click _Connect with Slack_. Then follow the prompts.
To learn more, refer to [Integrate Slack with Amplitude](https://amplitude.com/docs/analytics/integrate-slack).
## Permissions
While only admins, managers, and members can create a team space, all users can add themselves to spaces, regardless of permission level.
Customers on the Growth and Enterprise plans have enhanced controls around user permissions within a space. By default, admins, managers, and members can all add content, invite users to the space, and archive a space. Admins and managers also have the option to manage the space permissions to specify which roles have permissions to add content, invite users, and archive a space.
When you invite a new user to a space, you can grant them access up to your level of access. For example, if you have the "can view" permission on a specific space, you can't invite users with "can add" or "can edit" permissions.
Archiving content from a space you own requires edit permissions within the space.
{% callout type="note" heading="Space and Project permissions" %}
Permissions set at the project level override permissions set at the space level. As a result, a user's permissions within a project may override their permissions within the space.
{% /callout %}
================================================================================
# Notebooks: Explain important insights to teammates and stakeholders
URL: https://amplitude.com/docs/analytics/notebooks
================================================================================
# Notebooks: Explain important insights to teammates and stakeholders
Notebooks help you explain insights to teammates. While [dashboards](https://amplitude.com/docs/analytics/dashboard-create) are great for monitoring metrics, **notebooks** enable you to communicate context and takeaways from analysis that help your team make better-informed product decisions.
Notebooks are documents, composed of text blocks, pictures, videos, charts, chart takeaways, and summary metrics. Teams use them to:
- Report on performance for new or changed products, features, offers, campaigns, and experiments.
- Explain ad hoc analysis, behavioral insights, or trending patterns about engagement, conversion, retention, stickiness, and so forth.
- Teach each other how to ask and answer questions with data.
## Before you begin
Notebooks do not support the .BMP Image format, or the Personas and Pathfinder Users charts.
## Create a new notebook
There are two ways to create a new notebook:
- Click _Create > Notebook_.
- From inside a chart, click *+ Add to...* Click _Create a new notebook_ to simultaneously create the new notebook and add the chart you're working on to it.
You can also scroll down to the list of existing notebooks and add the chart to one of those.
{% callout type="tip" heading="" %}
You can edit notebooks using natural language through [Global Agent](https://amplitude.com/docs/amplitude-ai/global-agent-overview) or [Amplitude MCP](https://amplitude.com/docs/amplitude-ai/amplitude-mcp). Ask Global Agent to add charts, update sections, or rename a notebook without opening the editor manually.
{% /callout %}
## Edit an existing notebook
To **add new content** to your notebook, hover over it in the spot you'd like the new content to appear. Click the icon that appears to add a chart, cohort, header, text block, image, or video in that spot.
To **edit a chart** in your notebook, hover over the chart and click the pen icon to enter edit mode.
From there, you can select the type of callout box that appears above the chart (or opt for no callout box at all), add text to that callout, and include metrics from the _Metric Trackers_ drop-down list.
You can also **rearrange content** in your notebook using the drag-and-drop feature.
## Formatting text
Text blocks are rich text formatted by default. Highlight a piece of text to display a toolbar to apply styling. Text blocks also support common keyboard shortcuts, like _CMD/CTRL + B_ to bold text.
Notebooks also support markdown formatting for text blocks. Just type your markdown notations directly into the text box.
You can paste hosted images directly into a text element through the clipboard.
================================================================================
# Templates: Re-use your analyses
URL: https://amplitude.com/docs/analytics/templates
================================================================================
# Templates: Re-use your analyses
In Amplitude Analytics, templates help teams recreate common analyses and share best practices without building identical dashboards from scratch.
You can create templates from any saved dashboards and choose any events, properties, cohorts, dates, projects, or titles appearing in those charts to templatize. You and your teammates can standardize reporting and create new dashboards from those templates.
Save time when repeating common analyses and make it simpler for new team members to measure impact:
- Create a standard A/B test process so anyone can see and evaluate the results
- Establish a common set of analyses for new releases to measure performance and adoption
- Roll out regional dashboards for leadership and local teams.
- Replicate KPI measurements across accounts, platforms, and core features
## Create a template
To create a template, you must start from a dashboards. For detailed instructions, see the section on [templatizing a dashboard in this Help Center article](https://amplitude.com/docs/analytics/dashboard-create).
If you're new to Amplitude, you can take advantage of a set of pre-built **starter templates.** These dashboard templates come with pre-formatted charts, so you can quickly acclimatize yourself to analyses of common product questions. The starter templates vary by type, **use case** or **industry**:
### Use case
- Funnel analysis
- Feature adoption
- Getting Started KPIs (Web)
- Product KPIs
- Session engagement
- Marketing analytics
- User activity
### Industry
- B2B SaaS
- FinTech
- E-commerce
- Media
- Marketing analytics
## Use an existing template
After you templatize your dashboard, you can temporarily update the data in the charts your template contains. To add more parameters, under _Find & Replace_, you can update any properties, events, projects, or text parameters of your templated dashboard's charts. This doesn't affect the values in the original charts.
After you make changes, click _Reset to Default_ to revert to the original chart definitions, or _Save onto Charts_ to push your updates onto the original charts.
To share the template with a colleague, either click _Share_ or copy the URL and send them that.
## Common template use cases
Some common use cases for templates include:
- **A/B testing:** swap out user or event properties or cohorts with each new experiment’s variants
- **Releases:** swap out version, campaign, region, and so forth, to track performance or key metrics for new releases
- **Usage or engagement dashboards:** segment by feature/product, region, device, customer, channels, and so forth, to analyze metrics like engagement with critical events or specific funnels that are notable to a feature or company
- **B2B or partner use cases:** create different dashboards segmented by the customer account or partner
- **Amplitude new user onboarding:** companies often build templates for the above use cases to help onboard new Amplitude users at their company to their teams’ common analyses
## Template permissions
Permissions for templates function the same way they do for dashboards:
- Admins can edit all templates.
- If a template includes charts from a project you don't have access to, you can't view it.
- Templates can have multiple owners. Click _Share_ to add an owner.
- All users can create templates, but only members and above can publish them to the gallery. As a viewer, you may still share a direct link to your template with others.
================================================================================
# Out-of-the-box Marketing Analytics
URL: https://amplitude.com/docs/analytics/ootb-marketing-analytics
================================================================================
# Out-of-the-box Marketing Analytics
Amplitude's Out-of-the-box Marketing Analytics tracks page engagement and session-based metrics with default views, using common KPIs such as page views, session duration, and bounce rate. Custom settings let you:
- **Filter by domain**: Filter metrics by a specific domain to target a specific website for analysis.
- **Track conversions**: Easily define a conversion funnel, enable detailed tracking, and visualize conversion metrics with data tables and charts.
- **Uncover deeper insights with nested group-bys**: Add additional detail to your top-level channels or campaigns analytics with nested group-bys.
{% callout type="note" heading="Find e-commerce analyses" %}
For Purchase by Product and Product Discovery, refer to [Out-of-the-box E-commerce Analytics](https://amplitude.com/docs/analytics/ootb-ecommerce-analytics).
{% /callout %}
### Permissions
Your ability to edit views in Marketing Analytics depends on your role within the project.
| Role | Default view | Custom view (yours) | Custom view (others) |
| ------- | ------------ | ------------------- | -------------------- |
| Admin | ✅ | ✅ | ✅ |
| Manager | ✅ | ✅ | ✅ |
| Member | ❌ | ❌ | ❌ |
## Configure Out-of-the-box Marketing Analytics
Before you start, make sure you understand the basics of building charts in Amplitude.
Read the sections below to get started configuring Marketing Analytics. If your organization has more than one team, consider using views to enable each team to customize their settings.
### Views
Out-of-the-box Marketing Analytics uses Views to set and maintain settings. Views enable the different teams that use your project to ensure they can view the data that's most important. To create a view:
1. In the Marketing Analytics breadcrumbs, locate the current view to the right of the project. If this is your first time using Marketing Analytics, the profile is `Default`.
2. Click the current view, and click _+ Create New View_.
3. Update the settings on each tab to meet your team's needs.
{% callout type="note" heading="Views availability" %}
Views support Growth and Enterprise plans. Users with the Administrator or Manager role can create and update views.
{% /callout %}
## Analyze industry-standard metrics
Out-of-the-box Marketing Analytics offers four sets of insights with default metrics, as well as optional goals or key outcomes, that you are driving users to:
- **Traffic by Channel**: Provides an overview of users visiting your product by channel. Metrics include visitors, bounce rate, session totals, average session duration, sessions per user, and marketing analytics views.
- **Traffic by Campaign**: Provides an overview of the users visiting your product by campaign. Metrics include visitors, bounce rate, session totals, average session duration, sessions per user, and any defined goals.
- **Ad Performance**: Provides an overview of your ad campaigns (for example, Google Ads and Facebook Ads) with key metrics like Impressions, Clicks, Click-Through Rate (CTR), Cost Per Click (CPC), Customer Acquisition Cost (CAC), and Return on Ad Spend (ROAS), plus flexible settings for acquisition and revenue tracking.
- **Page Engagement**: Details user engagement by page. Metrics include visitors, page views, bounce rate, page views per session, entry rate, exit rate, and any defined goals.
- **Conversion**: Provides over-time and aggregated analyses of user conversion based on your defined funnel. Metrics include total conversion and step-by-step conversion.
{% callout type="note" heading="If your CAC and ROAS are 0" %}
CAC and ROAS may display as `0` if your ads haven't led to conversions, or if the UTM parameters in your campaigns don't match those in your events.
For example, if `utm_content` in a Facebook ad is `image_xyz`, but the value you set in Amplitude is `xyz`, Amplitude can't accurately track that campaign.
To ensure accurate results, ensure the UTM properties you use in your campaigns match what you [configure in Amplitude](#configure-utm-properties). If you notice a discrepancy, you can update the property definition in Amplitude. For more information, go to [Fix your data with Transformations](https://amplitude.com/docs/data/transformations#rename-property-values).
{% /callout %}
Each insight displays a time series chart and an aggregated data table below it.
{% callout type="note" %}
Visit the [Marketing metrics recipes article](https://amplitude.com/docs/analytics/charts/user-sessions/marketing-metrics-recipes) for a more detailed explanation of commonly used marketing analytics and how to replicate them in Amplitude charts.
{% /callout %}
Follow these steps to analyze metrics in Out-of-the-box Marketing Analytics:
1. Click _Marketing Analytics_ from the navigation bar and select the insight you'd like to view.
2. (_Optional_), go to _Add segment > Amplitude segments_ to filter your analysis by user type:
- **All users**: Users who triggered any event during the selected date range.
- **Active users**: Users who triggered at least one active event during the selected date range.
- **New users**: Users who triggered at least one new user event during the selected date range.
- **Mobile web**: Users who triggered events on a web platform from an Apple iPad, Apple iPhone, or Android device.
- **Desktop web**: Users who triggered events on a web platform from a Mac or Windows device.
From there, use the data table to further your analysis:
- Click _Open in Data Table_ to view your results in a separate chart.
- For traffic by channel or conversion insights, select the channel you'd like to analyze from the Default Channels dropdown.
For conversion insights, you can also:
- View the data table fields by channel or campaign.
- Display total conversions or conversion rate.
### Ad metric definitions
Here are the default Ad metrics available in Out-of-the-box Marketing Analytics, along with the high-level formulas and definitions:
| Metric | Formula | Definition |
| --------------- | ------------------------------------------------------- | --------------------------------------------------------------------------------------------------------------------------------------------------------------- |
| **Impressions** | `PROPSUM(ad_metrics.impressions)` | Total number of times your ad is served (shown) to users. **Derived from Daily Ad Metrics**. |
| **Clicks** | `PROPSUM(ad_metrics.clicks)` | Total number of times users click your ad. **Derived from Daily Ad Metrics**. |
| **CTR** | `%: (ad_metrics.clicks / ad_metrics.impressions) * 100` | Click-through rate. Shows the percentage of impressions that result in a click. **Derived from Daily Ad Metrics**. |
| **Ad Spend** | `PROPSUM(ad_metrics.cost)` | Total amount spent on your ad campaign. **Derived from Daily Ad Metrics**. |
| **CPC** | `ad_metrics.cost / ad_metrics.clicks` | Cost per click. Shows how much you pay, on average, for each click on your ad. **Derived from Daily Ad Metrics**. |
| **CAC** | `ad_metrics.cost / [Acquisition Event]` | Customer Acquisition Cost. Shows how much you pay, on average, to acquire a single new user. **Cost from Daily Ad Metrics; acquisition event set in Settings**. |
| **ROAS** | `[Revenue Property] / ad_metrics.cost` | Return on Ad Spend. Shows how much revenue you earn for every dollar spent on advertising. **Cost from Daily Ad Metrics; revenue property set in Settings**. |
## Modify settings and create goals
Out-of-the-box Marketing Analytics uses default events and properties from the Browser SDK or Ad Networks, but admins or managers can modify them in settings.
Follow these steps to manage settings, create goals, or customize tracked events:
1. Click _Customize_.
2. Select the type of setting you'd like to modify:
- If _Page View and Filter_, choose the event and property that you'd like to use. This affects all page-related metrics.
- For _Breakdown_, choose the default channels you want to display, as well as your campaign and page engagement properties.
- Set _Conversion Funnel_ settings by choosing the events that make up your funnel.
- For Ad Performance, select events and properties to calculate CAC and ROAS metrics, along with properties such as ad source, campaign, and content.
If _Goals_, choose the key events or metrics you'd like to set up as additional metrics. Break down goals by channels, campaigns, or pages.
## Advertising metrics and properties
To view insights on ad performance, connect to an ad network (for example, Google or Facebook). For more information, go to the [Source Catalog](https://amplitude.com/docs/data/source-catalog).
Amplitude associates advertising metrics with an event called `Daily Ad Metrics`. This event includes both user properties and event properties that you can use for campaign analysis.
### User properties
The following user properties display by default in the breakdown table on the **Ad Performance** tab. Use these properties to link ad spend to user behavior across your product.
| Property | Description |
| -------------- | ------------------------------------------------------------------------------------------------------------ |
| `utm_campaign` | The campaign name from UTM tracking. Identifies which marketing campaign drove the user. |
| `utm_content` | The ad content or variation from UTM tracking. Distinguishes between different ads within the same campaign. |
| `utm_medium` | The advertising or marketing medium. For example, `cpc`, `email`, or `social`. |
| `utm_source` | The source that referred the user. For example, `google`, `facebook`, or `newsletter`. |
| `utm_term` | The search term or keyword from UTM tracking. Identifies which keywords drove clicks. |
{% callout type="tip" heading="Use UTM properties as breakdowns" %}
To gain insight on both ad metrics and product metrics, use UTM properties as the breakdown.
{% /callout %}
### Event properties
The `Daily Ad Metrics` event includes two types of event properties: numeric properties for computing metrics, and descriptive properties that identify the ad and campaign.
#### Numeric properties
Use these properties to compute advertising metrics like CTR, CPC, CAC, and ROAS.
| Property | Description |
| ------------------------- | ------------------------------------------------- |
| `ad_metrics.impressions` | Total number of times the ad appeared to users. |
| `ad_metrics.clicks` | Total number of times users clicked the ad. |
| `ad_metrics.cost` | Total amount spent on the ad. |
| `ad_metrics.conversions` | Total number of conversions attributed to the ad. |
| `ad_metrics.interactions` | Total number of user interactions with the ad. |
#### Descriptive properties
These properties identify and describe ads and campaigns. Property values match what you see in your ad network (for example, Google Ads). Property names may vary slightly between ad networks.
| Property | Description |
| ----------------------------------- | ---------------------------------------------------------------------------------- |
| `ad_id` | Unique identifier for the ad. |
| `ad_name` | Name of the ad. |
| `ad_platform` | The advertising platform. For example, `google` or `facebook`. |
| `ad_group_id` | Unique identifier for the ad group. |
| `ad_group_name` | Name of the ad group. |
| `ad_group_type` | Type of the ad group. |
| `ad_segment_device` | Device type used to view the ad. For example, `mobile` or `desktop`. |
| `campaign_id` | Unique identifier for the campaign. |
| `campaign_name` | Name of the campaign. |
| `campaign_advertising_channel_type` | The advertising channel type for the campaign. For example, `search` or `display`. |
| `campaign_start_date` | The start date of the campaign. |
| `campaign_end_date` | The end date of the campaign. |
| `final_url` | The final destination URL of the ad. |
| `tracking_url_template` | The tracking URL template used for the ad. |
{% callout type="tip" heading="Amplitude recommends UTM properties" %}
Amplitude recommends that you use UTM properties to track the full user journey from impression to in-product action.
The `Daily Ad Metrics` event supports other properties like `ad_platform` or `campaign_name`. These properties let you measure ad-level metrics like impressions and clicks, but don't support values for CAC, ROAS, or any custom goals you define that tie to Amplitude events. Those require UTM-based matching within the `Daily Ad Metrics` event.
{% /callout %}
### Configure UTM properties
To ensure your UTMs end up in Amplitude:
1. Add UTM parameters to your ad campaign URLs.
2. Instrument those UTMs as user properties in Amplitude.
3. Ensure the UTM values match between your advertising URLs and the event data you see in Amplitude.
If you don't see results, ensure the following:
- You ran an ad campaign during the selected date range.
- You added UTM parameters to your ad campaign URLs.
## Create a web experiment for specific URLs
On the Page Engagement tab of Marketing Analytics, when you break down your data by Page URL, you can create a [web experiment](https://amplitude.com/docs/web-experiment/set-up-a-web-experiment) from the table.
Click the flask icon in the Action column of the table, and the New Web Experiment dialog appears pre-populated with the targeted page URL.
================================================================================
# Out-of-the-box Ecomm Analytics
URL: https://amplitude.com/docs/analytics/ootb-ecommerce-analytics
================================================================================
# Out-of-the-box Ecomm Analytics
Amplitude's Out-of-the-box Ecomm Analytics is a centralized hub where e-commerce teams can analyze purchase behavior, item-level conversion, and the discovery methods that drive revenue.
The hub provides two out-of-the-box analyses:
- **Purchase by Product**: Analyze conversion, cart drop-off, revenue, and average order value (AOV) at the SKU, product, or category level.
- **Product Discovery**: Understand how each UTM, search term, promo, or product-finding method drives item-level revenue, AOV, and conversion.
Custom settings let you:
- **Filter by domain**: Scope analyses to a specific storefront.
- **Define a purchase funnel**: Build a funnel with steps like *Add to Cart → Begin Checkout → Complete Purchase*.
- **Add cart and item-level properties**: Break down each analysis by product, category, brand, or any custom dimension.
### Permissions
Your ability to edit views in Ecomm Analytics depends on your role within the project.
| Role | Default view | Custom view (yours) | Custom view (others) |
| ------- | ------------ | ------------------- | -------------------- |
| Admin | ✅ | ✅ | ✅ |
| Manager | ✅ | ✅ | ✅ |
| Member | ❌ | ❌ | ❌ |
## Before you begin
To use Ecomm Analytics, your Amplitude implementation must send cart data as arrays. For more information, refer to [Cart Analysis](https://amplitude.com/docs/analytics/charts/cart-analysis).
Arrays let you send structured product information like `product_id`, `sku`, `price`, and `category` without creating hundreds of event properties. Each item in the array represents a product in the cart.
## Configure Ecomm Analytics
Before you begin, configure Ecomm Analytics to ensure the provided analyses meet your needs.
Read the sections below to configure each analysis. If your organization has more than one team, consider using views to enable each team to customize their settings.
### Views
Out-of-the-box Ecomm Analytics uses Views to set and maintain settings. Views enable the different teams that use your project to focus on the data that matters most to them. To create a view:
1. In the Ecomm Analytics breadcrumbs, locate the current view to the right of the project. If this is your first time using Ecomm Analytics, the profile is `Default`.
2. Click the current view, and click _+ Create New View_.
3. Update the settings on each tab to meet your team's needs.
{% callout type="note" heading="Views permissions" %}
Users with the Administrator or Manager role can create and update views.
{% /callout %}
## Purchase by Product
The Purchase by Product hub helps e-commerce teams analyze purchase behavior at the SKU, product, or category level. It gives you a detailed view of your purchase funnel, allowing you to understand where users drop off and how revenue performs across products.
Unlike the Conversion analysis in [Marketing Analytics](https://amplitude.com/docs/analytics/ootb-marketing-analytics), which focuses on overall funnel performance, Purchase by Product adds e-commerce-specific granularity. You can:
- Break down your purchase funnel by product name, SKU, or category.
- Measure conversion and cart drop-off rates.
- Analyze revenue and average order value (AOV) at an item level.
This hub supports e-commerce use cases where you need to track multiple products or product categories within a single checkout flow.
### Configure Purchase by Product
To begin, navigate to _Ecomm Analytics > Purchase by Product_.
1. Click **Select event** to create a new configuration, or **Customize** to edit an existing configuration.
2. Complete the **Purchase funnel** setup:
1. Define the funnel steps. Start with an event like `View Product` and end with `Complete Purchase`.
2. Identify your `Add to Cart` step. Selecting this step enables the Cart drop-off rate metric, which includes the percentage of users who abandon their cart between this step and the last step.
3. Select a unique identifier. This identifier helps Amplitude understand your individual products. For example, you could choose a property like `product_id`.
4. Add revenue detail. Select the event that includes your revenue property. If you don't track revenue, you can create a [derived property](https://amplitude.com/docs/data/derived-properties) that multiplies price and quantity, and stores the result as the value of a property.
{% callout type="tip" heading="Example purchase funnel events" %}
A purchase funnel may have events like:
1. `Add Item to Cart`
2. `Begin Checkout`
3. `Complete Purchase`
{% /callout %}
If you pick a step that doesn't include a cart item property, Amplitude displays the error message *Breakdown may be incomplete: this event doesn't include an item property.* To avoid this, ensure your event follows the [Cart analysis](https://amplitude.com/docs/analytics/charts/cart-analysis) structure.
### Results
After you complete setup, the hub displays:
- A funnel visualization that shows conversion at each step.
- Average Order Value (AOV) and total revenue metrics.
- Cart drop-off rate for your `Add to Cart` step.
- A breakdown table that shows performance by product, category, or brand.
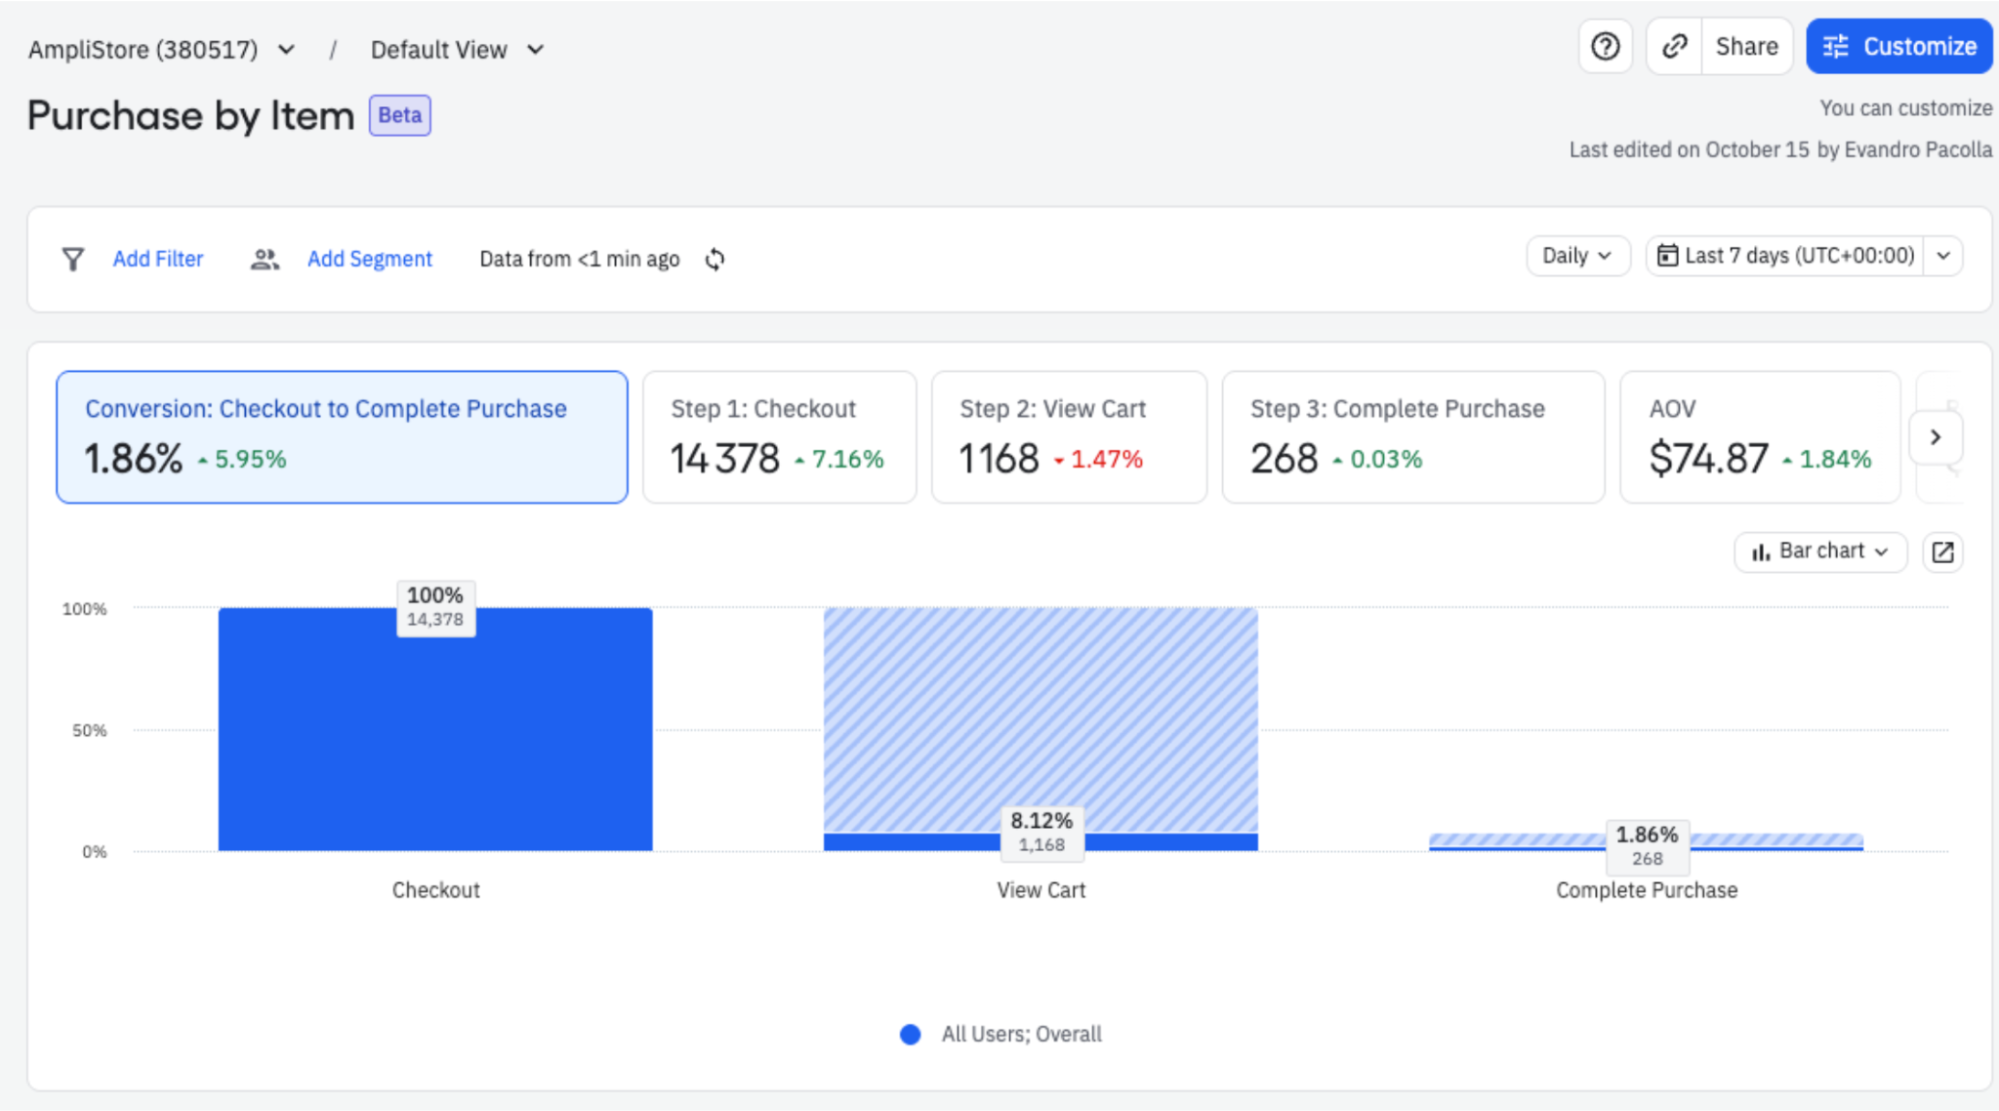
{% callout type="note" heading="Metric definitions" %}
- **Total revenue**: The sum of the item revenue for the row. For example, if the row is `Digital Content`, revenue equals the revenue value for the `Digital Content` items in the cart.
- **AOV**: Revenue divided by the number of orders that contain that item.
{% /callout %}
The breakdown table includes:
- Conversion rate between steps.
- Average order value (AOV).
- Total revenue.
- Cart drop-off rate.
### Next steps
The Purchase by Product hub is a starting point for e-commerce analysis. To explore deeper:
- Click **Open as chart** to view the underlying funnel or table.
- Adjust the filters, metrics, or visualizations to refine your analysis.
- Save your custom chart to a [Space](https://amplitude.com/docs/get-started/spaces) for ongoing tracking.
## Product Discovery
The Product Discovery hub helps e-commerce teams understand which discovery paths drive conversion. It shows how each UTM, search term, promo, or product-finding method drives item-level conversion, AOV, and revenue.
Where Purchase by Product answers *what items did people buy*, Product Discovery answers *what engagement led them to buy each item*.
This hub supports use cases where multiple discovery paths compete for credit within a single checkout session. You can:
- Break down revenue and conversion by discovery method, search term, promo, or recommendation zone.
- Understand which discovery paths lead to the highest cart-add and purchase rates.
- Attribute revenue to the correct discovery source at the item level using [persisted properties](https://amplitude.com/docs/data/persisted-properties).
### Before you begin
In addition to the article-level prerequisites above, the Product Discovery hub requires at least one [persisted property](https://amplitude.com/docs/data/persisted-properties) configured with item-level attribution. For setup details, refer to [Persisted Properties](https://amplitude.com/docs/data/persisted-properties#advanced-item-level-attribution). If this prerequisite is missing, the Product Discovery hub surfaces a guided setup checklist.
{% callout type="tip" heading="Set up persisted properties first" %}
Product Discovery shows results only after you configure at least one persisted property with item-level attribution and that property begins collecting data. Complete this setup before you expect the hub to populate.
{% /callout %}
### Configure Product Discovery
To begin, navigate to _Ecomm Analytics > Product Discovery_.
1. Click **Select event** to create a new configuration, or **Customize** to edit an existing configuration.
2. Complete the **Purchase funnel** setup, the same as [Purchase by Product](#configure-purchase-by-product).
3. Configure **Which properties describe how users discover your product?** Select the [persisted property](https://amplitude.com/docs/data/persisted-properties) (or properties) that carry discovery context, such as `search_term`, `banner_id`, or `promo_code`.
{% callout type="note" %}
Amplitude uses the selected persisted properties with item-level attribution to credit each product's revenue to the correct discovery source.
{% /callout %}
### Results
After you complete setup, the hub displays:
- A breakdown of revenue and conversion by discovery source.
- Cart-add and purchase rates by discovery source.
- A funnel-level view of how each discovery source converts.
### Next steps
The Product Discovery hub connects discovery behavior to purchase outcomes. To explore further:
- Click **Open as chart** to view the underlying funnel or table.
- Set up additional [persisted properties](https://amplitude.com/docs/data/persisted-properties) with item-level attribution to enable more discovery-level revenue attribution.
- Save your custom chart to a [Space](https://amplitude.com/docs/get-started/spaces) for ongoing tracking.
================================================================================
# Out-of-the-box Product Analytics
URL: https://amplitude.com/docs/analytics/product-analytics
================================================================================
# Out-of-the-box Product Analytics
Out-of-the-box Product Analytics groups four prebuilt views (Product Overview, Onboarding, Feature Engagement, and Retention) into one workspace in Amplitude, so you can monitor new and active users, conversion, engagement, and retention without building charts from scratch. Each view shares filtering and segmentation controls, and teams can fork their own views to track the metrics that matter to them.
Use Out-of-the-box Product Analytics when you want a curated, shared dashboard for the standard product-health metrics every team tracks. If you need a custom metric or a one-off exploration, build a [chart](https://amplitude.com/docs/analytics/charts) or [dashboard](https://amplitude.com/docs/analytics/dashboard-create) instead.
## Feature availability
This feature supports all Amplitude plans.
### Permissions
Product Analytics permissions for editing views depend on both your role within a project, and your organization's [plan](https://amplitude.com/pricing).
{% accordion title="Product Analytics edit permissions" %}
**Free and Plus**
| Role | Default view | Custom view (yours) | Custom view (others) |
| ------- | ------------ | ------------------- | -------------------- |
| Admin | ✅ | ✅ | ✅ |
| Manager | ✅ | ✅ | ✅ |
| Member | ✅ | ✅ | ✅ |
**Enterprise**
| Role | Default view | Custom view (yours) | Custom view (others) |
| ---------- | ------------ | ------------------- | -------------------- |
| Admin | ✅ | ✅ | ✅ |
| Non-Admmin | ❌ | ✅ | ✅ |
{% /accordion %}
## Configure Out-of-the-box Product Analytics
Read the sections below to get started configuring Product Analytics. If your organization has more than one team, consider using views to enable each team to customize their settings.
### Views
Out-of-the-box Product Analytics uses Views to set and maintain settings. Views enable the different teams that use your project to ensure they can view the data that's most important. To create a view:
1. In the Product Analytics breadcrumbs, locate the current view to the right of the project. If this is your first time using Product Analytics, the profile is `Default`.
2. Click the current view, and click _+ Create New View_.
3. Update the settings on each tab to meet your team's needs.
{% callout type="note" heading="Views availability" %}
Views support Growth and Enterprise plans. Users with the Administrator or Manager role can create and update views.
{% /callout %}
### Basic settings
1. On the Basic Settings page, select the event that represents an active action in your product. By default, Amplitude sets `[Amplitude] Any Active Event` as the event.
2. Select the retention intervals that are most meaningful to you. Set both Daily and Weekly intervals. Use Amplitude's [usage interval analysis](https://amplitude.com/docs/analytics/charts/retention-analysis/retention-analysis-usage-interval) to learn how long users go between triggering your critical event.
3. Configure breakdown properties for the Product Overview, Onboarding, and Retention views. Select up to three.
4. Click **Save** to commit changes.
### Onboarding funnel
Select events that represent the steps in your onboarding funnel.
For example start with a broad event like `App installed` and move down the funnel to more specific actions that users can take as part of onboarding, like `Profile completed`. Add up to five events to your funnel.
### Features
Select specific features for which you want to track engagement. Define features with tracked events (including custom events) or [Feature Flags](https://amplitude.com/docs/feature-experiment/workflow/feature-flag-rollouts) that are part of an experiment running in your product. Features you define appear on the Feature Engagement tab.
##### To create a new feature based on an event:
1. From the Features tab of the Customize page, click **Create Feature**.
2. Choose to define the feature with an event.
3. Name the feature, and select the Value Moment, or the event that represents when a user realized value from the feature.
## Product Analytics views
Out-of-the-box Product Analytics provides four views, each of which share filtering and segmentation controls.
- Product overview
- Onboarding
- Feature engagement
- Retention
The Product Overview, Onboarding, and Retention views also take advantage of the breakdown properties you defined during configuration.
### Product overview
The product overview displays the baseline metrics:
- Active users (unique)
- New users (unique)
- Avg. session duration
- New user retention, based on the interval you set.
- Weekly active users
### Onboarding
Onboarding displays a conversion funnel based on the events you defined during configuration.
Break down conversion with the properties you defined during configuration. Breakdown shows conversion rate per value, and raw conversion numbers for each event.
### Feature engagement
{% callout type="note" heading="" %}
Features are a specific function or characteristic of a product that provides value to customers.
{% /callout %}
Feature engagement displays an engagement matrix that enables you to compare the features you define. The matrix plots features according to adoption (or the percentage of active users that engaged with the feature), and the average frequency with which users engaged with the feature. For more information, go to [Engagement Matrix](https://amplitude.com/docs/analytics/charts/engagement-matrix/engagement-matrix-discover).
### Retention
Retention contains three tabs that reflect your product's user retention, retention over time, and usage interval.
Retention over time uses the retention interval values you set during configuration. For more information, go to [Interpreting your retention analysis](https://amplitude.com/docs/analytics/charts/retention-analysis/retention-analysis-interpret)
================================================================================
# Metrics
URL: https://amplitude.com/docs/analytics/metrics
================================================================================
# Metrics
The Metrics library gives you a central place to find, explore, and manage the metrics that matter most to your business. Amplitude surfaces all project metrics in a single searchable list, and each metric has a dedicated detail page with a chart view, its definition, and the charts and experiments that use it. Amplitude also provides [out-of-the-box metrics](https://amplitude.com/docs/analytics/out-of-the-box-metrics) for common business use cases.
To access the Metrics library, go to _Amplitude > Metrics_.
## Metrics home page
The Metrics home page lists all metrics in your project. From here you can:
- Browse and search metrics by name.
- Filter by last modified date, editor, or events used.
- Select any metric to open its detail page.
## Metric detail page
Select a metric to access the detail page.
The detail page for a metric contains the following tabs:
### Overview
The Overview tab shows a chart visualization of the metric over time. Use the date range picker and segment selector to adjust the view. The tab also shows the current metric value and percentage change for the selected period, and lists [experiments](https://amplitude.com/docs/feature-experiment/experiment-quick-start) that use this metric.
### Definition
The Definition tab shows the metric's configuration in read-only mode. Select **Edit Metric** to open the metric editor and make changes.
### Used by
The Used by tab lists the charts and other Amplitude objects that include this metric, so you can quickly understand where a metric appears across your project.
### Activity
The Activity tab shows a chronological history of all changes to the metric. Each entry shows who made the change, when they made it, and what changed. For example: the initial creation and any subsequent edits to the metric's name, type, or parameters.
## Create and manage metrics
Create metrics either directly in the Metrics page:
1. Go to the main Metrics page.
2. Click **Create Metric**.
3. Name the metric and add a short description about what the metric does.
4. Specify the **Metric Type**. You can specify the following types of metrics:
- **Event Segmentation**: Event Totals, Property Sum, Uniques, and so on.
- **Formula**: Custom formulas.
- **Funnel Analysis**: Conversion metrics.
- **Retention**: Retention metrics.
- **Revenue**: Total revenue, Average order value, Revenue per user, and so on.
- **Sessions**: Session totals, Bounce rate, Sessions per user, and so on.
- **Time Spent**: Total time spent, Time spent per user, Time spent per page, and so on.
- **Warehouse**: Warehouse metrics.
5. Select **Add Event** to specify the events you want to associate to your metric.
6. Specify the **Key Properties** for your metric.
For example, your key property could be _Country_ or _Platform_.
7. Select **Save**.
================================================================================
# Out-of-the-box Metrics
URL: https://amplitude.com/docs/analytics/out-of-the-box-metrics
================================================================================
# Out-of-the-box Metrics
Amplitude’s Out-of-the-Box (OOTB) metrics provide consistent, validated definitions for common performance indicators. OOTB metrics share one synced definition across all your Amplitude projects. When you edit an OOTB metric once, it updates everywhere within a project—saving you time, reducing errors, and aligning teams around a single source of truth.
## Advantages of OOTB metrics
- **Consistency and alignment**: These metrics are both dynamic and synced. You don't need to worry about mismatched definitions or manual updates in more than one place.
- **Speed and scalability**: Amplitude provides default metrics, so you can start analyzing key performance indicators quickly, and keep consistent definitions across teams and projects.
## Available metrics
Amplitude provides the following metrics for marketing analytics, which use the `[Amplitude] Page Viewed` event:
- Visitors
- Page Views
- Bounce Rate
- Entry Rate
- Exit Rate
- Page Views per Session
- Session Entries
- Session Exits
{% callout type="note" heading="Metrics available to event segmentation charts" %}
Event Segmentation charts support the Visitors and Page Views metrics.
All metrics appear in a data table.
{% /callout %}
Regardless of where you use them, for example in a [Data Table](https://amplitude.com/docs/analytics/charts/data-tables/data-tables-attribute-credit), [Event Segmentation](https://amplitude.com/docs/analytics/charts/event-segmentation/event-segmentation-build) chart, or OOTB Marketing Analytics, they reference the same underlying definitions. Updates you make to the metric definition in one place applies everywhere else you use that metric.
## Edit existing metrics
Access OOTB metrics from a [Data Table](https://amplitude.com/docs/analytics/charts/data-tables/data-tables-attribute-credit), [Event Segmentation](https://amplitude.com/docs/analytics/charts/event-segmentation/event-segmentation-build) chart, or the Marketing Analytics settings. To edit an OOTB metric:
1. Add the metric to the chart.
2. Hover over the metric name and click the pencil icon, or click **Edit Metric** on the _More options_ menu.
3. The Metric dialog appears. Update the definition and click **Save**.
The updated definition applies across your project. This includes changes to the label. Changes apply to charts you create going forward, and any chart that includes the metric definition.
For information about creating metrics from scratch, see [Create a metric](https://amplitude.com/docs/analytics/charts/data-tables/data-tables-create-metric)
{% callout type="note" heading="Permissions" %}
Editing an OOTB metric requires the **Manager** [role](https://amplitude.com/docs/admin/account-management/user-roles-permissions) or higher.
{% /callout %}
================================================================================
# Share dashboards within your company
URL: https://amplitude.com/docs/analytics/share-dashboards
================================================================================
# Share dashboards within your company
After you build your dashboard, you can share it with others in your organization.
## Directly share a dashboard
To copy the URL of your dashboard to the clipboard, click the link icon next to _Share_. Then paste it into an email or Slack message.
To share the dashboard directly, follow these steps:
1. Click _Share_. In the _Share_ tab of the modal that appears, enter the names or email addresses of everyone you want to share the dashboard with.
2. In the right-side drop-down, set the permissions for everyone you're sharing the dashboard with. To make them co-owners, select _Can edit_. To limit their permissions to read-only, select _Can view_.
Adding co-owners to individual charts is a one-by-one process. There is no way to bulk-add a new co-owner to multiple charts at once.
3. To create a live, public link that's usable by others without an Amplitude account, click **Manage Public Links**. For more information, go to the article on [public links in Amplitude](https://amplitude.com/docs/analytics/share-external).
Public links are only available to customers on a Scholarship, Growth, or Enterprise plan.
4. Click **Save**.
## Embed a dashboard
To embed a dashboard in a document, Slack message, or elsewhere, follow these steps:
1. Click _Share_.
2. In the _Embed_ tab of the modal that appears, toggle the public embed switch to On.
3. Click _Copy Embed Code_ to copy the code to your clipboard. You can now paste the embed code elsewhere.
## Remove co-owners from your dashboard
While a dashboard must have at least one owner, it can also have many co-owners. You grant co-ownership status to other users through the Share feature.
To remove co-owners from your dashboard, click _Share_ and find the user you want to remove. Click _Can edit_ and change the dropdown to _Remove_. Amplitude saves the change automatically.
{% callout type="note" %}
Admins can modify ownership of dashboards that do not belong to them.
{% /callout %}
================================================================================
# Share charts, dashboards, and notebooks with stakeholders outside your company
URL: https://amplitude.com/docs/analytics/share-external
================================================================================
# Share charts, dashboards, and notebooks with stakeholders outside your company
To share Amplitude charts, dashboards, and notebooks with people outside your organization, create a public link or embed code that anyone can open without an Amplitude account. Use public links or embed code when your audience isn't part of your Amplitude organization; to share with people inside your organization, [share the dashboard directly](https://amplitude.com/docs/analytics/share-dashboards) instead.
## Considerations
* Anyone can view a public link until you revoke it. On the Enterprise plan, anyone with the password can access your links before their expiration.
* After you revoke a link, you can't re-enable it. Amplitude redirects users who click a revoked link to a 404 page.
* If you share a public link to a notebook or a dashboard that contains a [Journeys](https://amplitude.com/docs/analytics/charts/journeys/journeys-understand-paths) chart, that chart isn't visible to the recipient of that link. Use the direct link to the journey chart to share it.
* Amplitude caches charts for 10 minutes.
* Experiment results charts don't support access by public link.
## Create a public link
##### To create a public link to a chart, dashboard, or notebook
1. Click **Share** in the top right corner of the menu bar.
2. In the modal that appears, click **Public Link**, then **Create link**.
3. Set the link's expiration date, and optionally set a password. Click **Create Link**.
Amplitude generates a link to the content. Click **Copy Public Link** to copy the URL to your clipboard.
## Generate embed code for your content
Another way you can share your charts, notebooks, and dashboards with external stakeholders is by embedding your analysis into a document you create outside Amplitude Analytics. Paste the Amplitude-generated embed code into a tool that accepts embeds, like WordPress, Confluence, or wikis. Your Amplitude content becomes visible to unauthenticated users, in much the same way as public links.
To generate this embed code, follow these steps:
1. After saving your chart, dashboard, or notebook, click **Share**.
2. In the Share modal, click the **Embed** tab and flip the toggle switch to **On**.
3. Click **Copy Embed Code**. You can now paste the embed code from your clipboard.
4. To revoke external permissions to view the content, flip the toggle switch to **Off**. The embed code no longer works in any of the documents where it appears.
## Copy, edit, or delete a public link
You can manage public links from two locations:
**From the Share modal**:
1. Click **Share** in the top right corner.
2. Navigate to the **Public Link** tab.
3. Click the three-dot menu (kebab menu) next to your public link.
4. Select **Copy URL**, **Edit**, or **Delete** from the dropdown.
**From Organization Settings**:
Navigate to *Settings > Organization Settings > Content Access*. You can remove public links from this page by hovering over the link and selecting the **Remove** button. To edit a link's password or expiration date, open the chart and use the Share modal.
## Set public link permissions
Admins on Enterprise plan accounts can control whether members need to set a password and/or expiration date when creating a public link. When setting an expiration, you can control how long public links exist before they expire.
Even if your account doesn't require passwords or expirations, you can set either when creating a public link. Review [Create a public link](#create-a-public-link) for details.
Passwords aren't recoverable. If you forget your password, you can edit the link and choose a new one. If you choose to set an expiration date, any recipients receive an error message when opening the link after your selected date. You can always edit your link and choose a new expiration date if you need to extend access.
## Visual links and unfurling public links on Slack
For more information, review [Integrate Slack with Amplitude](https://amplitude.com/docs/analytics/integrate-slack).
================================================================================
# Use Atlassian Smart Links with Amplitude
URL: https://amplitude.com/docs/analytics/atlassian-smart-links
================================================================================
# Use Atlassian Smart Links with Amplitude
You can include previews of your Amplitude charts in Confluence documents or Jira tickets. Paste the chart URL into Confluence, Trello, or Jira, and choose whether you want the preview to display inline or as a card. Atlassian calls this feature [Smart Links](https://community.atlassian.com/t5/Confluence-articles/Smart-Links-a-richer-way-to-hyperlink/ba-p/1412786).
Smart Links support all Amplitude chart types except Personas, Pathfinder, Data Tables, and Experiment Results.
To create previews of your Amplitude charts with Smart Links, follow these steps:
1. Copy the URL of the chart you want to share, then paste the URL into your Confluence document, Trello card, or Jira ticket.
2. If this is your first time trying to use the Smart Links feature from your Amplitude account, click _Allow_ to let Atlassian access Amplitude.
3. After you paste your URL, the Smart Link menu appears directly below it.
To disconnect from Smart Links, navigate to [Atlassian connected apps](https://id.atlassian.com/manage-profile/apps) and look for "Atlassian Links - Amplitude."
================================================================================
# Embed Amplitude charts in Notion documents
URL: https://amplitude.com/docs/analytics/chart-embed-notion
================================================================================
# Embed Amplitude charts in Notion documents
Notion is an all-in-one workspace that combines essential work tools like notes, docs, wikis, and project management into one collaborative and customizable place. Teams use Notion to collaborate on user research, feature releases, experimentation, and more.
Amplitude users can bring Amplitude charts and data into existing Notion workflows by pasting a link into Notion.
## Embed charts in Notion
To embed an Amplitude chart into a Notion document, follow these steps:
1. In Amplitude, copy the URL of the Amplitude chart you want to share.
2. Open your Notion document and paste the URL into it.
3. Select how you want Notion to handle the Amplitude URL in the document. You can post as a **preview** (a fully unfurled chart), a **mention** (a snippet that doesn't show the fully unfurled chart), or a **link** (the URL).
4. If this is the first time you're using this integration, click _Connect to Amplitude to update_. Notion initiates a short authentication flow to ensure you have the appropriate Amplitude permissions to view the chart you're pasting.
Click _Allow_ to proceed.
Your link appears in the Notion document in the format you specified in step 3.
{% callout type="note" heading="" %}
Only charts that belong to the Amplitude organization you're logged into are visible to you. Other charts generate an "Access Denied" error. If you're logged into the wrong organization or with the wrong email, log out of Amplitude and complete the authentication flow again.
{% /callout %}
To learn more about Notion, [visit their Help Center](https://www.notion.so/help).
================================================================================
# Integrate Miro with Amplitude
URL: https://amplitude.com/docs/analytics/integrate-miro
================================================================================
# Integrate Miro with Amplitude
With Amplitude's Miro integration, you can search for and add Amplitude charts directly onto your Miro boards without switching between the two platforms.
To use the integration, find and install the Amplitude plug-in from the Miro Marketplace.
## Install and use the integration
To set up the Miro integration, follow these steps:
1. From within a Miro board, click _>>_ in the left rail to begin the installation process. A fly-out panel with a list of installed and available apps appears. Find the Amplitude plug-in and click it. If the plug-in isn't immediately visible, click _Get more apps_ to browse the Miro Marketplace.
2. Next, you’ll authenticate the plug-in. In Miro, click the Amplitude icon in the left rail. In the _Manage Amplitude Charts_ modal that appears, click _Authenticate_.
Once authentication is complete, click the Amplitude icon to manage your Amplitude charts. Begin typing in the search field to see a dynamically updated list of Amplitude chart names, which you can sort by creation or modification date.
To add an Amplitude chart to your Miro board, select it from the list of search results.
================================================================================
# Integrate Slack with Amplitude
URL: https://amplitude.com/docs/analytics/integrate-slack
================================================================================
# Integrate Slack with Amplitude
{% callout type="tip" heading="Amplitude Global Agent" %}
The Amplitude Slack app supports the Amplitude Global Agent. For more information, refer to [Global Agent in Slack and Microsoft Teams](https://amplitude.com/docs/amplitude-ai/slack-teams).
{% /callout %}
With Amplitude's app for [Slack](https://www.slack.com/), you can:
- Unfurl chart and cohort links into detailed previews
- Add charts to dashboards or pin dashboards to your sidebar without ever leaving the conversation
- Connect Amplitude Team Spaces to specific Slack channels and receive notifications whenever your team creates new analyses
To connect Amplitude to Slack, you can either follow the steps below, or you can use the Amplitude integration in the Slack app store.
{% callout type="note" heading="" %}
If your company uses Amplitude's EU data center, there is a different Slack app intended specifically for EU customers. Find it in the Slack app directory under “[Amplitude - EU](https://amplitude.slack.com/apps/A042J2XCRS9-amplitude-eu).” Install it by clicking [Install Amplitude EU for Slack](https://links.amplitude.com/ZFSte8rMWtuwkP5jE/l/0POygAjvJypciVq4d?messageId=6nK7UeyixFZbdLPAQ&rn=&re=gIt92YuUGZ1RXasBXbhB0cul2akVnauYmZlpmI&sc=false), or by following the instructions below.
{% /callout %}
## Connect to Slack
Follow these steps whether you are integrating Amplitude and Slack for the first time, or updating to the current Amplitude app for Slack experience.
To connect your Amplitude account to Slack, follow these steps:
1. Navigate to _Settings > Personal Settings_.
2. Click _Profile,_ then _Connect to Slack_.
3. In the new browser tab that opens, click _Allow_ to grant Amplitude access to your Slack account.
You immediately receive a Slack message from Amplitude, including a link to a brief explanation of how to use the integration.
After you authenticate, Slack unfurls any links to Amplitude charts, both in Slack channels and direct messages.
Slack doesn't unfurl Pathfinder, Compass, and Persona charts.
### Connect an Amplitude Data project to Slack
You can also subscribe a Slack channel to real-time notifications of all branch changes or publishing updates occurring within an Amplitude Data project’s tracking plan. These include:
- Branch Created / Deleted / Merged / Approved
- Version Published
To receive these notifications, set up the Amplitude app for Slack for the Amplitude Data project you want to receive updates from.
##### Configure notifications
1. In Amplitude, navigate to _Data > Catalog > Integrations_.
2. If you haven’t previously enabled the Amplitude Slack App, grant Amplitude permission to your Slack workspace. Specify the channel you want Amplitude to send notifications to.
3. Click _Add_ to complete the process.
### Turn on link previews
If a shareable link doesn't unfurl when you post it in Slack, you may need to enable link previews in your Slack settings. To do this, review [Slack's documentation](https://get.slack.help/hc/en-us/articles/204399343-Sharing-links-in-Slack).
## Update your Slack connection
As Amplitude adds new features to the Slack integration, the app occasionally requires updated permissions, called "scopes," to support new functionality. If you installed the Amplitude Slack app before January 1, 2026, you may need to re-authorize the connection to enable the latest features, including Global Agent.
### About scopes
Scopes are permissions that define what a Slack app can do. For example, scopes let the app post messages in channels, send direct messages, or read channel information. When Amplitude releases new Slack features, those features may require additional scopes that weren't part of the original authorization. Until you re-authorize, those new features don't work correctly.
### When you might need to update
You likely need to update your connection if any of the following apply:
- You installed the Amplitude Slack app before January 1, 2026.
- New features like Global Agent don't respond as expected in Slack.
- Your Amplitude profile settings show an **Update Slack** button instead of **Connect to Slack**.
### IT admin approval
Some Slack workspaces require admin approval before granting an app new permissions. If your organization has this policy, the update process automatically sends an approval request to your IT or Slack admin team on your behalf. You don't need to contact them separately.
- Select **Update Slack** in your Amplitude profile settings.
- Slack displays an authorization screen that lists the new scopes Amplitude requests.
- If your workspace requires admin approval, Slack automatically submits the request to your IT admin. You don't need to take any other action beyond selecting **Allow**.
- Your IT admin reviews and approves the scope update. This is typically a fast, routine approval.
- After approval, Amplitude fully updates your Slack connection, and all new features become available immediately.
### How to update
1. Navigate to _Settings > Personal Settings_, then select _Profile_. You can also go directly to [your profile settings](https://app.amplitude.com/analytics/amplitude/settings/profile).
2. Select **Update Slack** on your profile page.
3. In the Slack OAuth screen, select **Allow** to grant the updated permissions. This refreshes your connection and grants any new scopes the latest features require.
4. Open a direct message with the Amplitude bot in Slack and ask any question to confirm everything works.
## Connect with team spaces
Connect Amplitude team spaces to specific Slack channels to receive notifications when your team creates new analyses. When someone adds new content to that team space, it appears in the Slack channel. Click _Connect with Slack_ from within a team space to set this up.
To disconnect your team space from Slack, click the same button, which now reads _Connected to [YourTeamSpaceName]_, and select _Disconnect Slack_.
## Global Agent requirements
The Amplitude Global Agent feature requires a paid Slack plan to access within the Slack app container. This is due to Slack's platform requirements for AI-powered features. However, all other Amplitude features continue to work on free Slack plans.
The Amplitude Global Agent feature uses Large Language Model (LLM) technology to answer questions about your Amplitude data. While designed to be helpful, AI-generated responses may occasionally be inaccurate or incomplete. Always verify critical business insights directly in your Amplitude workspace.
{% callout type="note" heading="" %}
You can use [Global Agent in Slack and Microsoft Teams](https://amplitude.com/docs/amplitude-ai/slack-teams) to ask natural-language questions about your product data, create and refine charts, and find existing dashboards—all from your chat platform.
{% /callout %}
## Ask Amplitude in Slackbot (MCP)
Connect your AI workflows to Amplitude's behavior analytics and experimentation platform. The [Amplitude MCP](https://amplitude.com/docs/amplitude-ai/amplitude-mcp) server connects AI assistants to your product data, so you can search, analyze, and query charts, dashboards, experiments, feature flags, and metrics directly from the [Slackbot MCP Client](https://slack.com/blog/news/slackbots-mcp-client).
After you connect, ask Slackbot a question in plain English. Slackbot calls Amplitude's tools on your behalf and returns the answer inline. You approve each tool call before it runs, and every action respects your existing Amplitude permissions. Commonly used tools include:
- **Query charts and data**: Ask "What was signup conversion last week?" and get the answer inline.
- **Search your workspace**: Find charts, dashboards, cohorts, experiments, and events by name.
- **Look up users**: Pull a user's profile and event timeline, or find users who performed a specific event.
- **Cohorts**: Create and retrieve behavioral cohorts.
- **Experiments and feature flags**: Check experiment results and feature flag status.
- **Dashboards and notebooks**: Create, edit, and comment on dashboards and notebooks.
- **Session Replays**: Find and summarize replays of specific user behaviors.
================================================================================
# Integrate Microsoft Teams with Amplitude
URL: https://amplitude.com/docs/analytics/integrate-microsoft-teams
================================================================================
# Integrate Microsoft Teams with Amplitude
{% callout type="tip" heading="Amplitude Global Agent" %}
The Amplitude Microsoft Teams app supports the Amplitude Global Agent. You can ask natural-language questions about your Amplitude data, create and refine charts, and find existing dashboards—all from Microsoft Teams. For more information, refer to [Global Agent in Slack and Microsoft Teams](https://amplitude.com/docs/amplitude-ai/slack-teams).
{% /callout %}
With Amplitude's app for Microsoft Teams, you can:
- Get answers to natural-language questions about your Amplitude data.
- Unfurl chart and cohort links into detailed previews directly in Teams channels.
- Receive notifications and analysis from Amplitude Agents.
- Receive notifications and updates about Dashboards you subscribe to.
- Receive alerts about experiment feature flag changes.
To connect Amplitude to Microsoft Teams, follow the steps below, or search for "Amplitude" in the [Microsoft Marketplace](https://marketplace.microsoft.com/en-us/marketplace/apps?product=teams) and install it from there.
## Connect to Microsoft Teams
Follow these steps whether you're integrating Amplitude and Microsoft Teams for the first time, or updating to the Amplitude app for Teams.
To connect your Amplitude account to Microsoft Teams:
1. Navigate to _Settings > Personal Settings_.
2. Click _Profile_, then click **Connect to Microsoft Teams**.
3. In the new browser tab that opens, click **Allow** to grant Amplitude access to your Microsoft Teams account. If you see the **Consent on behalf of your organization** checkbox, enable it to grant access for all members of your organization.
4. The Amplitude bot sends you a Teams message that confirms the connection and explains how to use the integration.
After you authenticate, Teams unfurls any links to Amplitude charts in Teams channels and direct messages. Teams doesn't unfurl Pathfinder, Compass, and Persona charts.
## Install the Amplitude app in Microsoft Teams
After you connect your Amplitude account, install the Amplitude app in your Microsoft Teams workspace.
1. On the _Profile_ page in Amplitude (_Settings > Personal Settings > Profile_), click **Install app**. This opens the Amplitude app listing in the Microsoft Teams App Store.
2. Click **Get it now**, then confirm the installation.
### Admin approval
If you're a Microsoft Teams admin, the installation process redirects you to the Microsoft Teams admin center. If you aren't an admin, Teams sends an approval request to your organization's admin.
To approve the app, the admin navigates to the _Manage apps_ section of the Microsoft Teams admin center and sets the Amplitude app permission policy to allow **Everyone**.
{% callout type="note" heading="" %}
The admin may experience a delay before receiving the approval request, and another delay before the app becomes available after approval.
{% /callout %}
## Add the Amplitude bot to a team
After you install the Amplitude app and your admin approves it, add the Amplitude bot to the team where you want to use it.
1. In Microsoft Teams, open the team you want to add the bot to. Click **Apps** in the bottom-left corner of the Teams sidebar.
- Alternatively, type `@` in the message compose box of any channel and select **Get agents and bots**.
2. Search for "Amplitude" and follow the on-screen instructions to add the bot to your team.
After you add the bot, a welcome message appears in the team channel. When you type `@Amplitude` in the message compose box, the mention displays as a blue tag, which indicates the bot is active.
### Verify bot availability
To confirm the bot is active in a team, type `@Amplitude hi` in any channel under that team. If the text displays in black instead of as a blue tag, the bot isn't available in that team yet.
You can also check the _Apps_ section within the team's settings to verify that Amplitude appears in the list of installed apps.
### Use the Amplitude bot
Tag the bot with `@Amplitude` in any channel where it's active, followed by your question or request. The bot responds in the channel with answers based on your Amplitude data.
## Turn on link previews
If a shareable link doesn't unfurl when you post it in a Teams channel, you may need to enable link previews. Ensure the Amplitude Teams app has the necessary message extension permissions in your Teams admin center. Confirm that your organization's Teams policies don't disable link unfurling.
## Connect with team spaces
Connect Amplitude team spaces to specific Teams channels to receive notifications when your team creates new analyses. When someone adds new content to that team space, it appears in the Teams channel.
Click **Connect with Teams** from within a team space to set this up.
To disconnect your team space from Teams, click the same button—which reads _Connected to [YourTeamSpaceName]_—and click **Disconnect Teams**.
## Global Agent requirements
The Amplitude Global Agent feature in Microsoft Teams uses Large Language Model (LLM) technology to answer questions about your Amplitude data. AI-generated responses may occasionally be inaccurate or incomplete. Always verify critical business insights directly in your Amplitude workspace.
{% callout type="note" heading="" %}
You can use [Global Agent in Slack and Microsoft Teams](https://amplitude.com/docs/amplitude-ai/slack-teams) to ask natural-language questions about your product data, create and refine charts, and find existing dashboards—all from Microsoft Teams.
{% /callout %}
================================================================================
# Sync your Amplitude data to Google Drive and Sheets
URL: https://amplitude.com/docs/analytics/google-drive-sync
================================================================================
# Sync your Amplitude data to Google Drive and Sheets
Sometimes you need to share refreshable chart data with team members or sync chart images into presentations. Amplitude's Sync to Drive and Sheets extension, available in the [Google Workspace Marketplace](https://workspace.google.com/marketplace/app/amplitude_sync_to_drive_and_sheets/998012258772), lets you export chart data to Google Sheets and chart images to Google Slides.
## Sync your Amplitude data to Google Sheets
After you download the extension, follow these steps to sync your chart data with Google Sheets:
1. From within a Google spreadsheet, navigate to *Extensions >* *Amplitude Sync to Drive and Sheets.* Then click *Start Exporting Amplitude Data.*
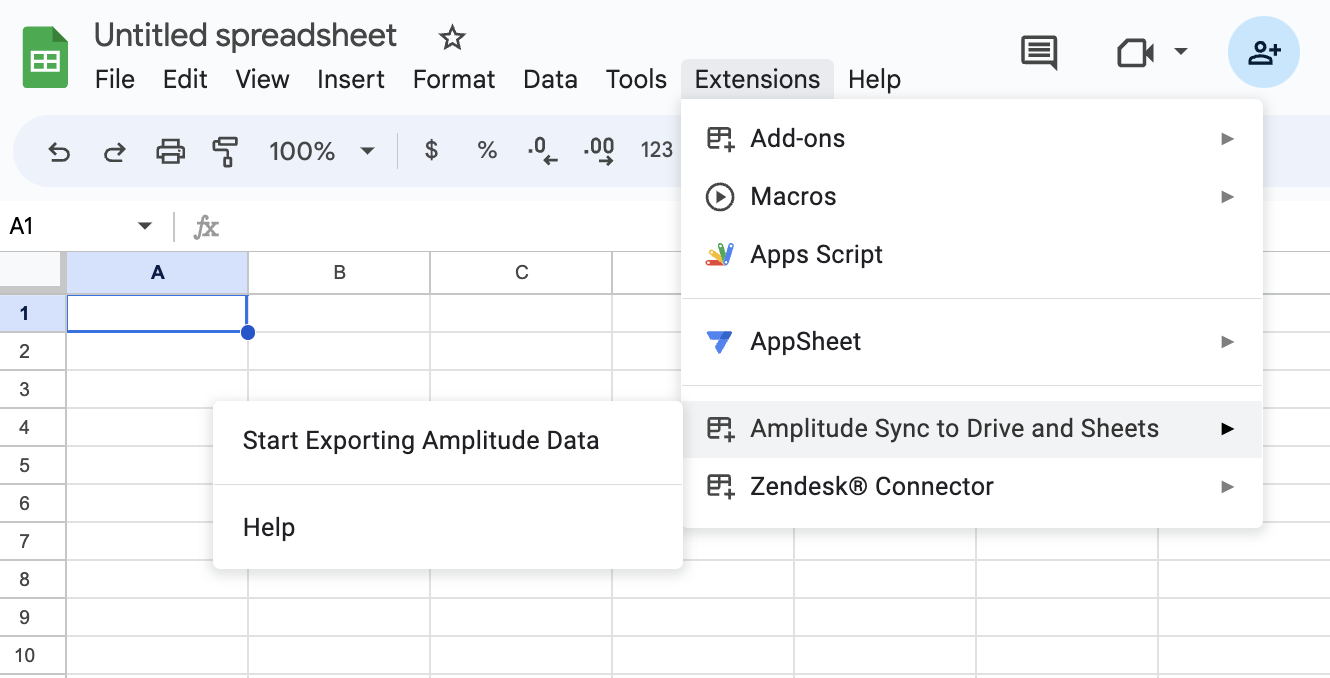
2. In the modal that appears, click _Sign in with Google_.
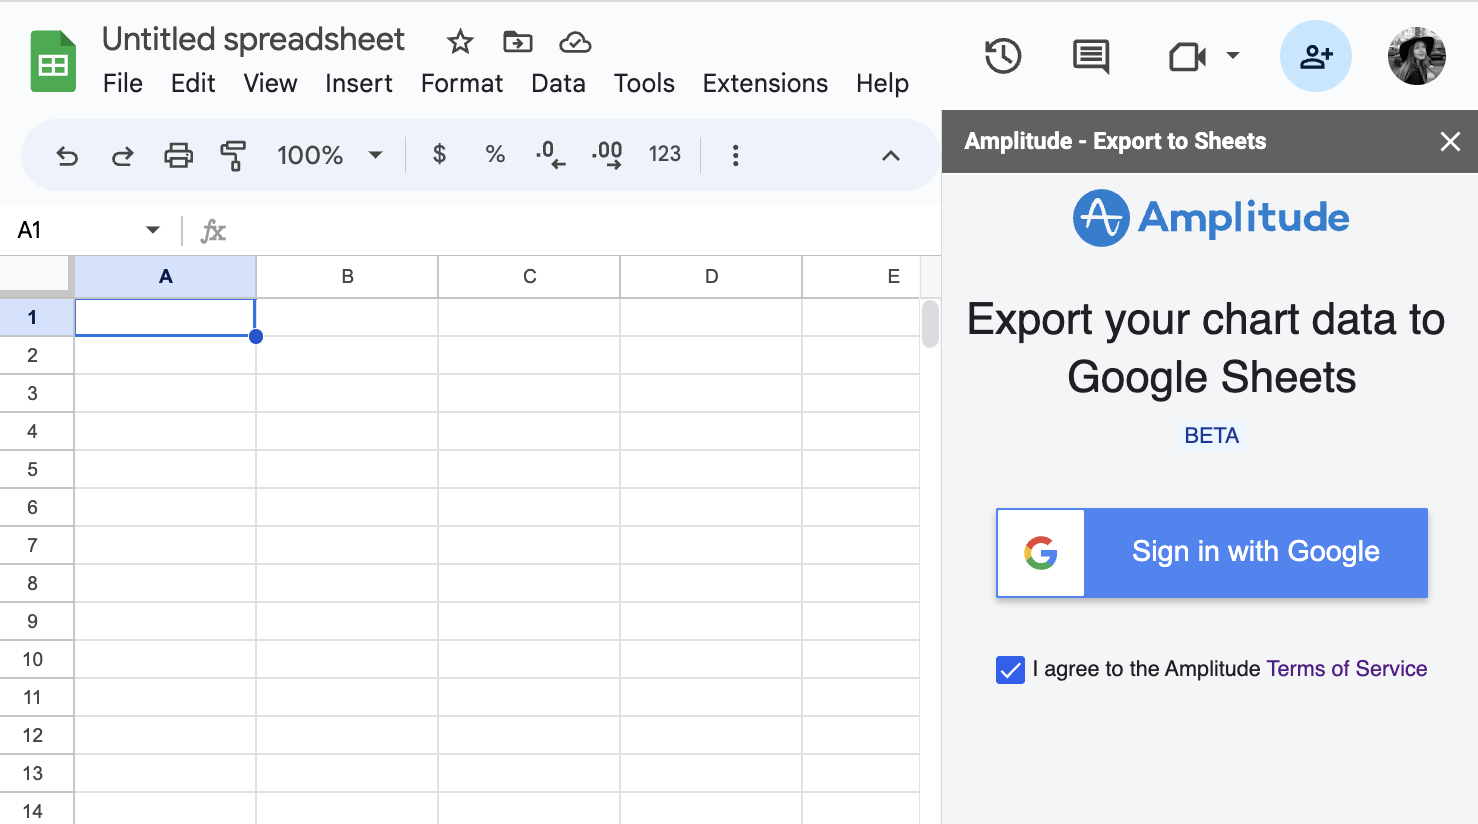
{% callout type="note" %}
Use the same email to sign into Google Sheets that you use to log in to your Amplitude account. If the emails don't match, you won’t be able to export data from your organization.
{% /callout %}
3. Next, allow Amplitude access to your Google account.
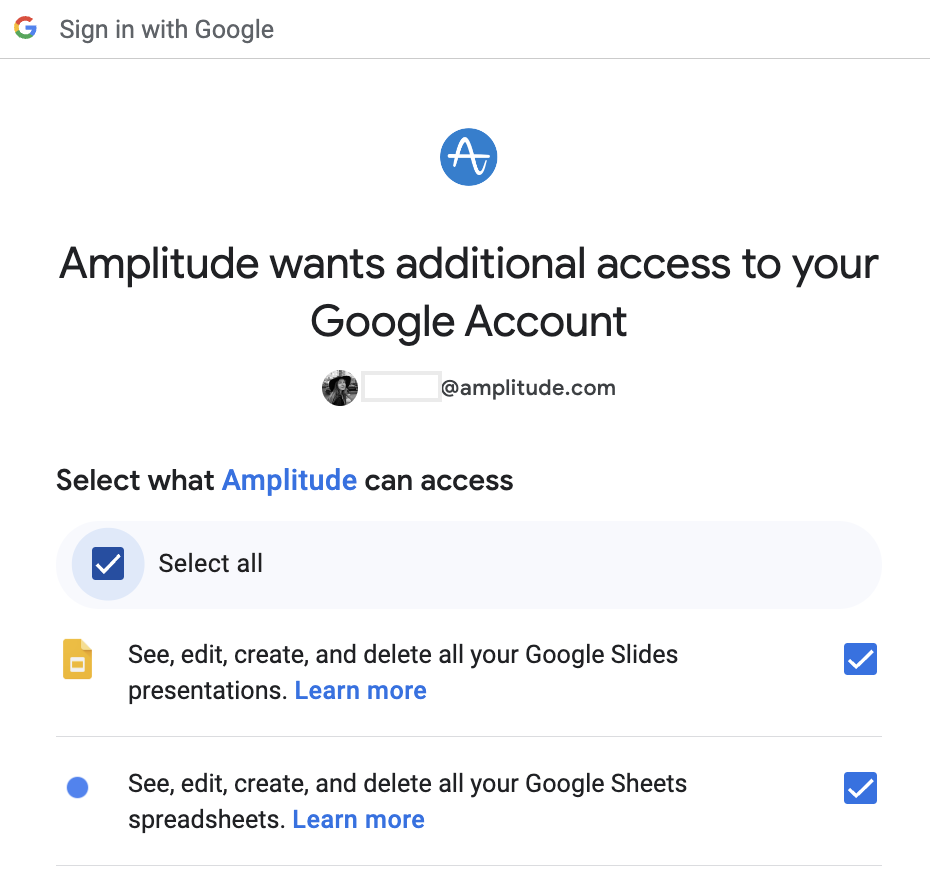
4. Choose your organization. Hover over the chart's name and click _Add_ to export its data. You can select multiple charts for the same export.
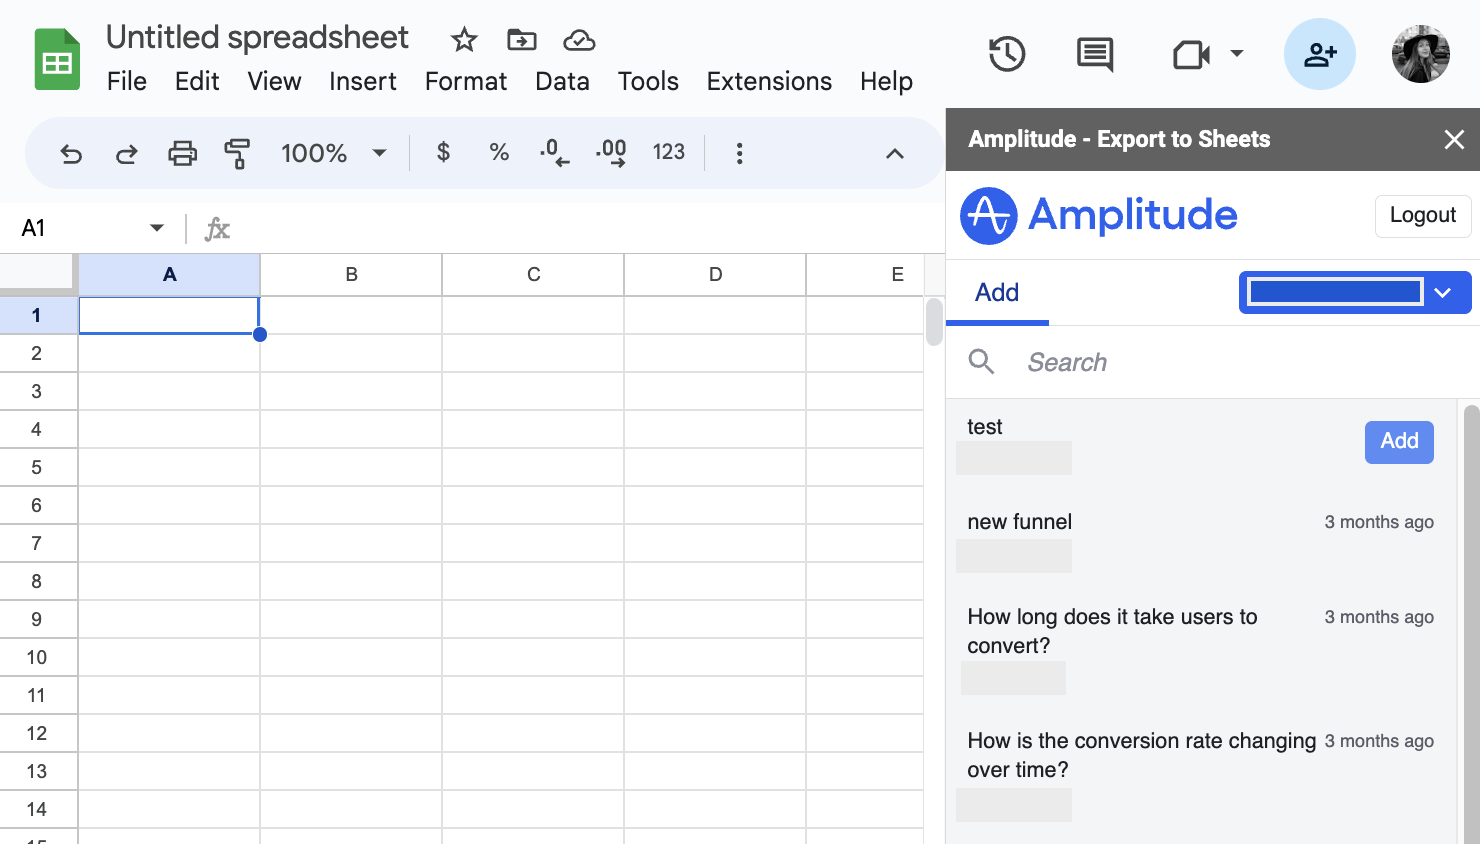
5. A tab in your Google spreadsheet populates with the selected chart's data. This tab is titled _Amplitude [DO NOT EDIT]_.
6. Use _Manage_ to refresh or delete selected charts from the sheet. Click the refresh icon to refresh and the delete icon to delete.
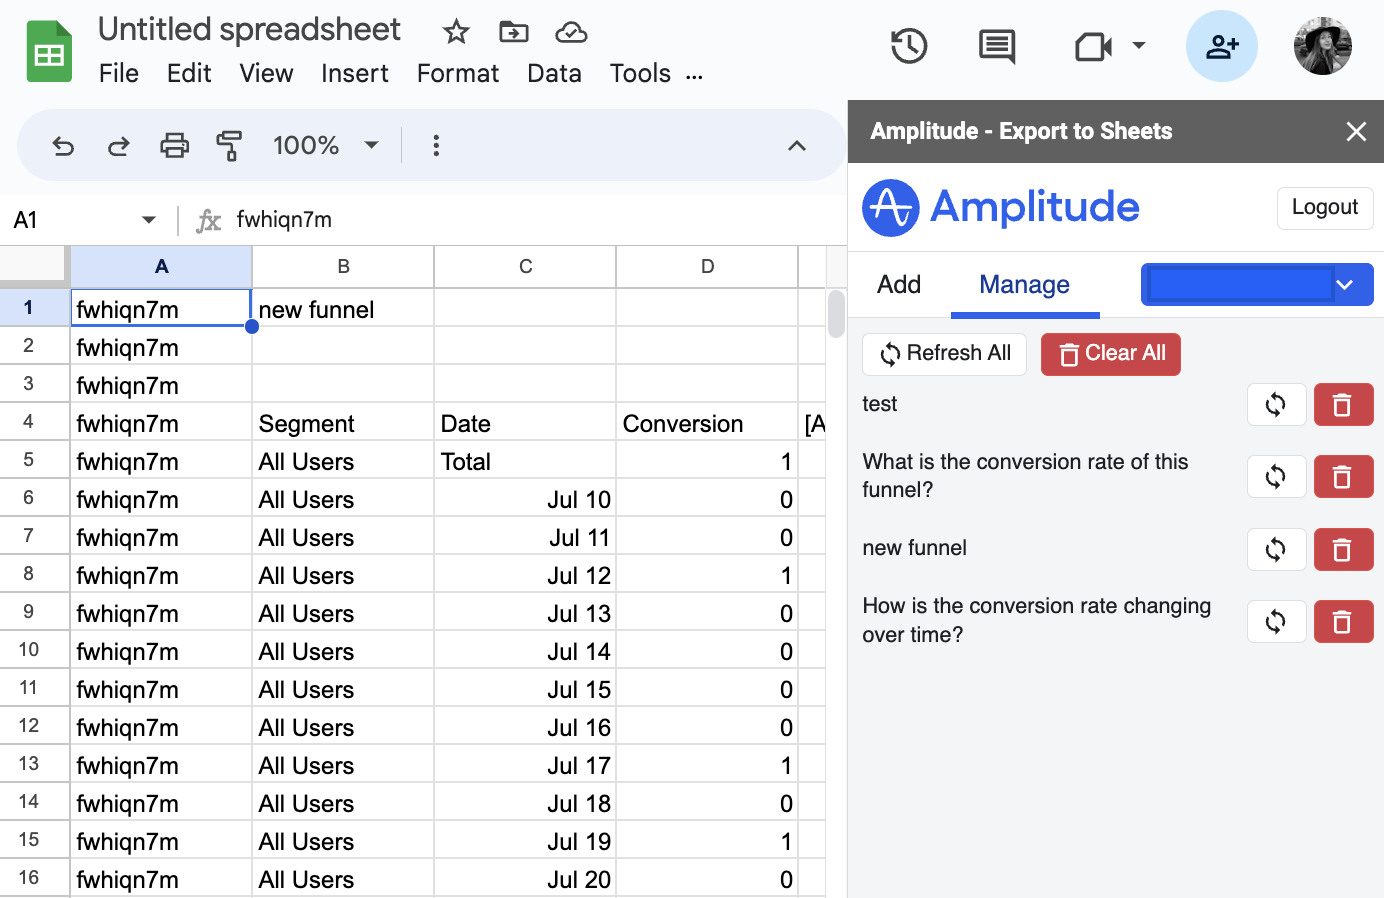
{% callout type="note" %}
Export to Sheets uses Amplitude's [Dashboard REST API](https://amplitude.com/docs/apis/analytics/dashboard-rest) to generate results, so ensure your charts abide by the same limits.
{% /callout %}
## Sync your Amplitude data to Google Slides
After you download the extension, follow these steps to sync your chart images with Google Slides:
1. From within a Google Slides presentation, navigate to *Extensions >* *Amplitude Sync to Drive and Sheets.* Then click _Start Exporting Amplitude Data_.
2. As with steps 2 and 3 in the previous section, Amplitude prompts you to sign into Google in the modal that appears. You should then allow Amplitude access to your Google account when prompted.
3. Next, choose your organization. Hover over the chart's name and click _Add_ to export its data. You can select multiple charts for the same export.
Your presentation populates with chart images, one per slide, depending on how many charts you chose for export.
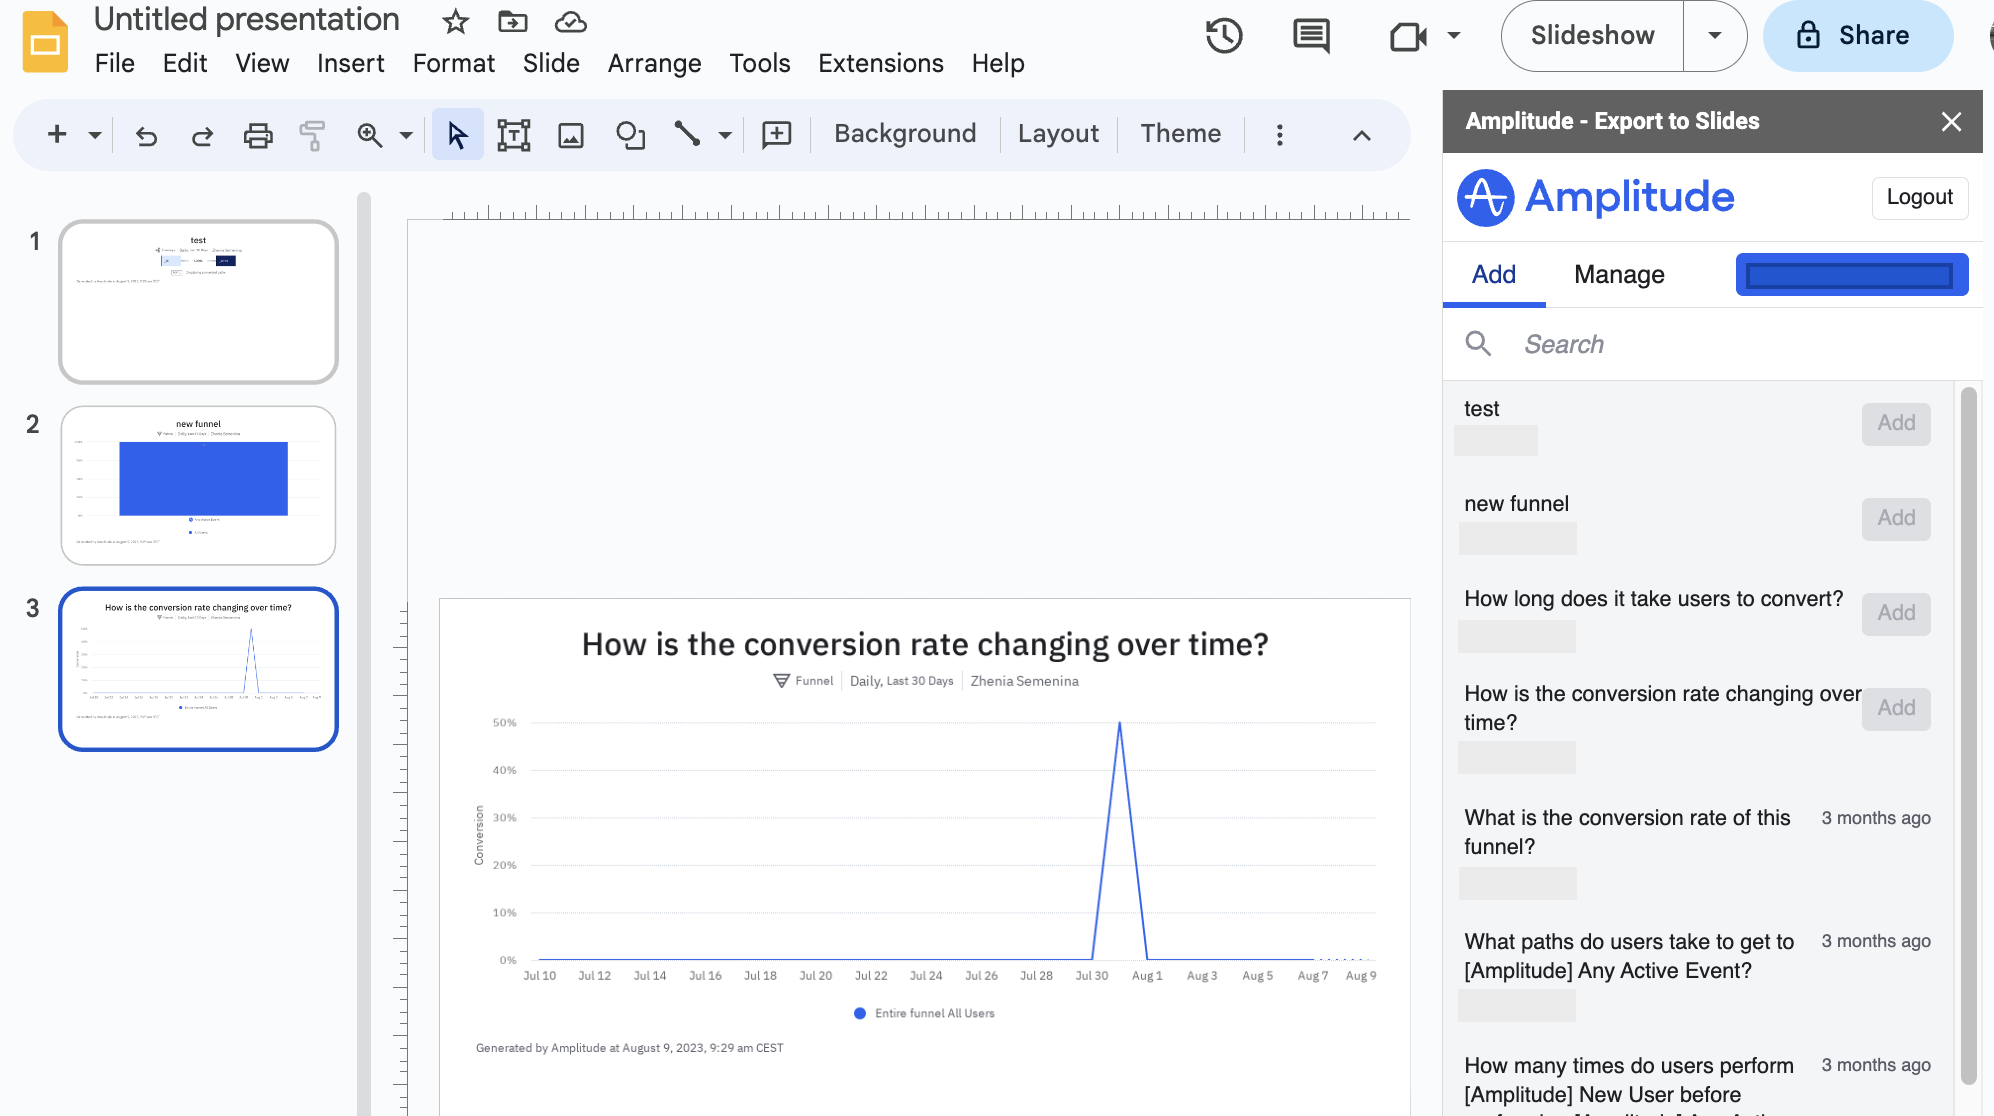
{% callout type="note" %}
Charts with a lot of data might take longer to export.
{% /callout %}
5. Use _Manage_ to refresh or delete selected charts from the sheet. Click the refresh icon to refresh and the delete icon to delete.
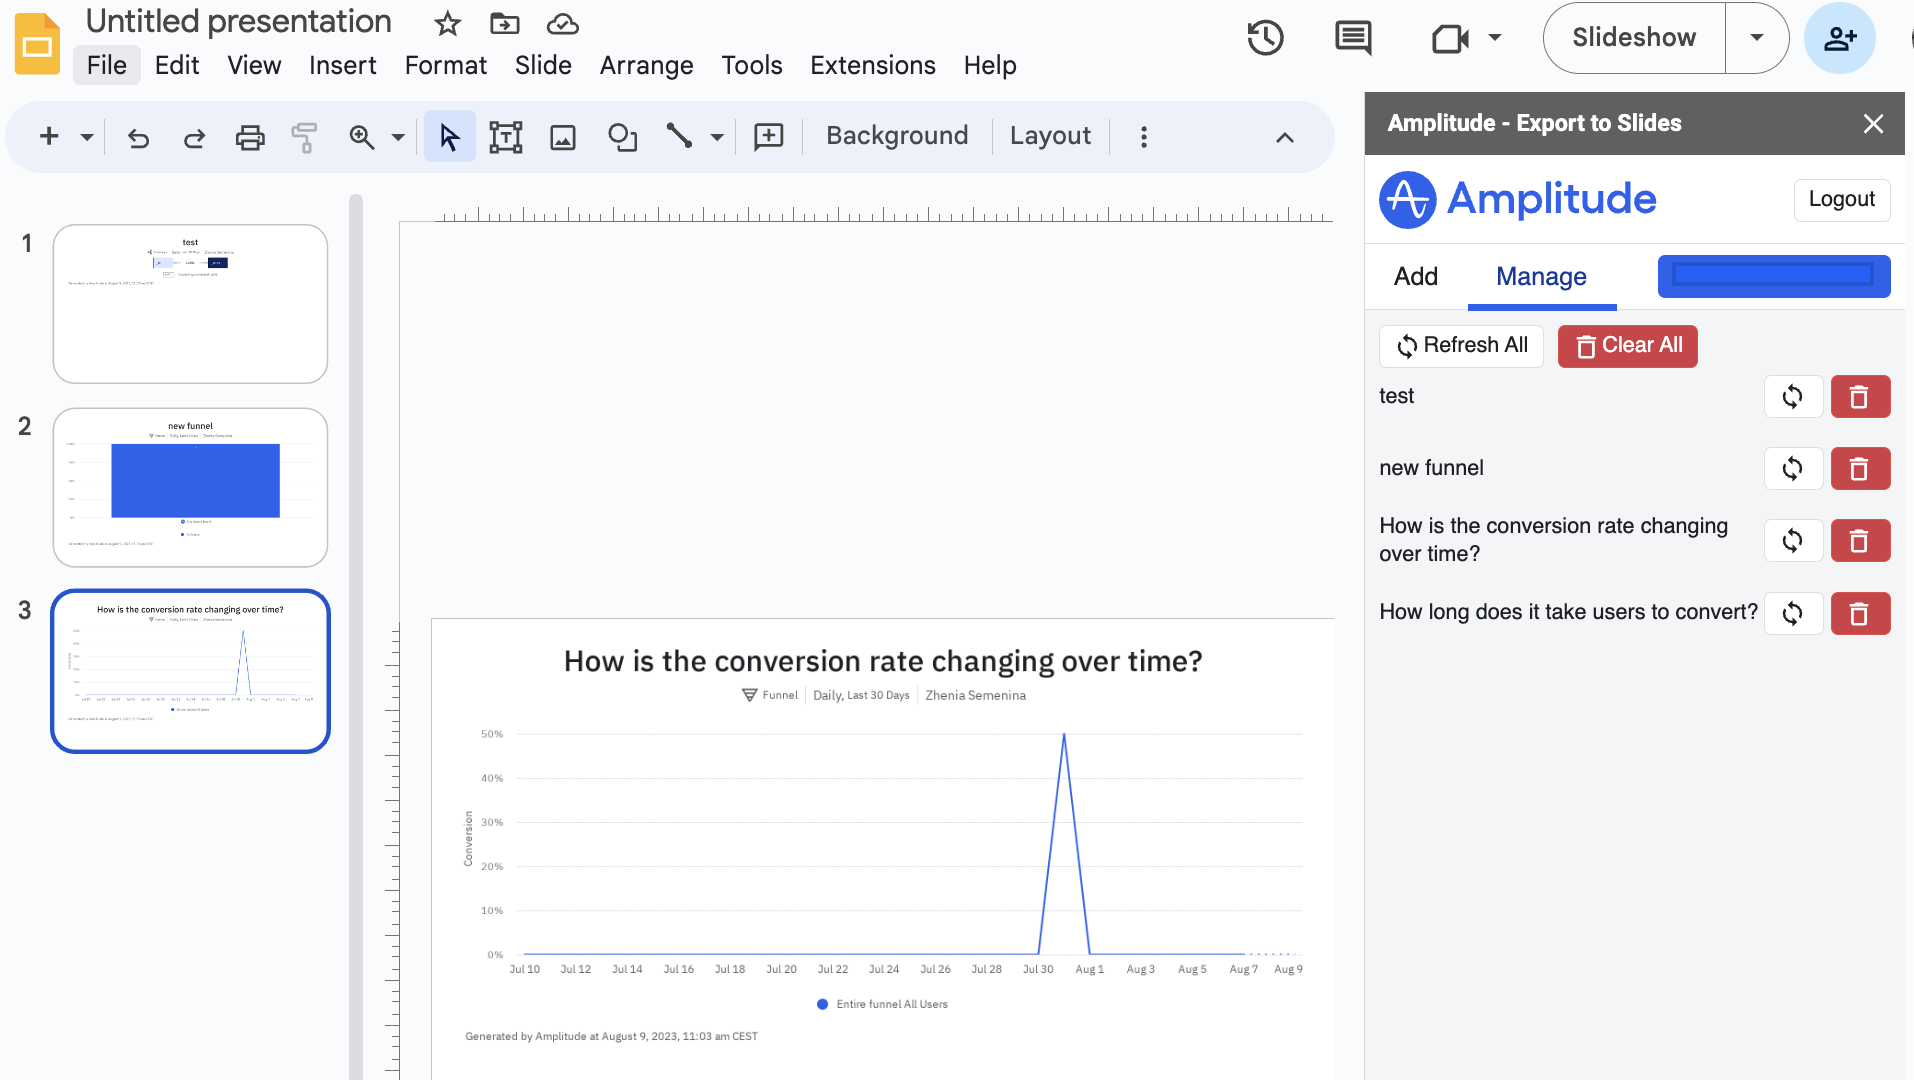
================================================================================
# Account-level reporting in Amplitude
URL: https://amplitude.com/docs/analytics/account-level-reporting
================================================================================
# Account-level reporting in Amplitude
Account-level reporting analyzes product usage by group, such as a company, team, or account, instead of by individual user. Amplitude reports on individual users by default, but the Accounts add-on adds group-level analysis, so you can build reports around an aggregated unit, such as accounts, order IDs, or charts.
A group is an object that a set of users can belong to, such as a company of customers, a team of users, or a playlist with listeners. Group-level analysis shows how specific accounts interact with your product, instead of only the individual users within those companies. Use account-level reporting when your questions are about accounts rather than individual people, such as how many distinct companies are active or whether a group converts through a funnel across several members. For questions about individual behavior, use the default user-level reporting instead.
To turn on the Accounts add-on and instrument your groups, refer to [set up account-level reporting](https://amplitude.com/docs/analytics/account-level-reporting-setup).
## Limits
- With the Accounts add-on, you can instrument up to five group types per project. Manage and remove groups in Amplitude Data.
- Account-level properties have a limit of 1000 per project.
- Changes to account groups and group properties apply to new data and don't affect historical data.
## How group-level reporting works
After you [set up groups](https://amplitude.com/docs/analytics/account-level-reporting-setup), Amplitude includes them in a drop-down list in the [Segmentation Module](https://amplitude.com/docs/analytics/charts/build-charts-add-user-segments). From there, you can report at the group level instead of the individual user level.
An analysis using group-level reporting counts distinct user property groups. Common use cases include:
- Analyzing how many distinct accounts were active or sent a certain event (group by account ID)
- Tracking how many charts users in your organization copy, save, and modify, then identifying which charts people use most often (group by chart ID)
- Discovering how conversion rates change between different order types (group by order ID)
- Using group-level reporting in funnel analyses:
- such as determining how many accounts have converted from free trials to paid accounts (group by either account ID or project ID), or tracking how frequently users draft posts they don't publish in your social media platform (group by post ID)
In a standard [funnel analysis](https://amplitude.com/docs/analytics/charts/funnel-analysis/funnel-analysis-build), the same person must complete all steps of the funnel to count as a conversion. With group-level reporting, different members of the group can complete different steps in the funnel, and Amplitude still interprets that as a conversion.
Group-level reporting is useful for multi-sided marketplaces or B2B2C companies whose conversion processes involve multiple people. For example, a product for medical practices might include a conversion funnel with "send invoice" and "send payment" steps. An admin sends the invoice, while the patient sends the payment. In workflows like this, group-level reporting accurately measures total invoice conversion.
### Event-level vs user-level group definitions
Amplitude supports event-level and user-level group definitions.
- An **event-level** group is one that **only** includes specific events in the users' journey. The events don't affect the users, so Amplitude doesn't add the users' future events to the group unless you explicitly assign them.
- By contrast, membership in a **user-level** group is **independent** of specific events. After the [Identify API](https://amplitude.com/docs/apis/analytics/identify) assigns users to the group, they remain in it for all future events. This is useful when you want to attribute all events a user triggers to a particular group.
{% callout type="note" %}
You can't un-set a user's group type. You can only overwrite it.
{% /callout %}
### Add groups to charts
All chart and report types in Amplitude support [group-level reporting](#how-group-level-reporting-works), except the Personas and Compass reports. To use an instrumented group in your chart, select the group in the _Users_ dropdown in the [Segmentation Module](https://amplitude.com/docs/analytics/charts/build-charts-add-user-segments).
For example, to track the number of daily active organizations and group them by region, set up an [Event Segmentation](https://amplitude.com/docs/analytics/charts/event-segmentation/event-segmentation-build) chart like this:
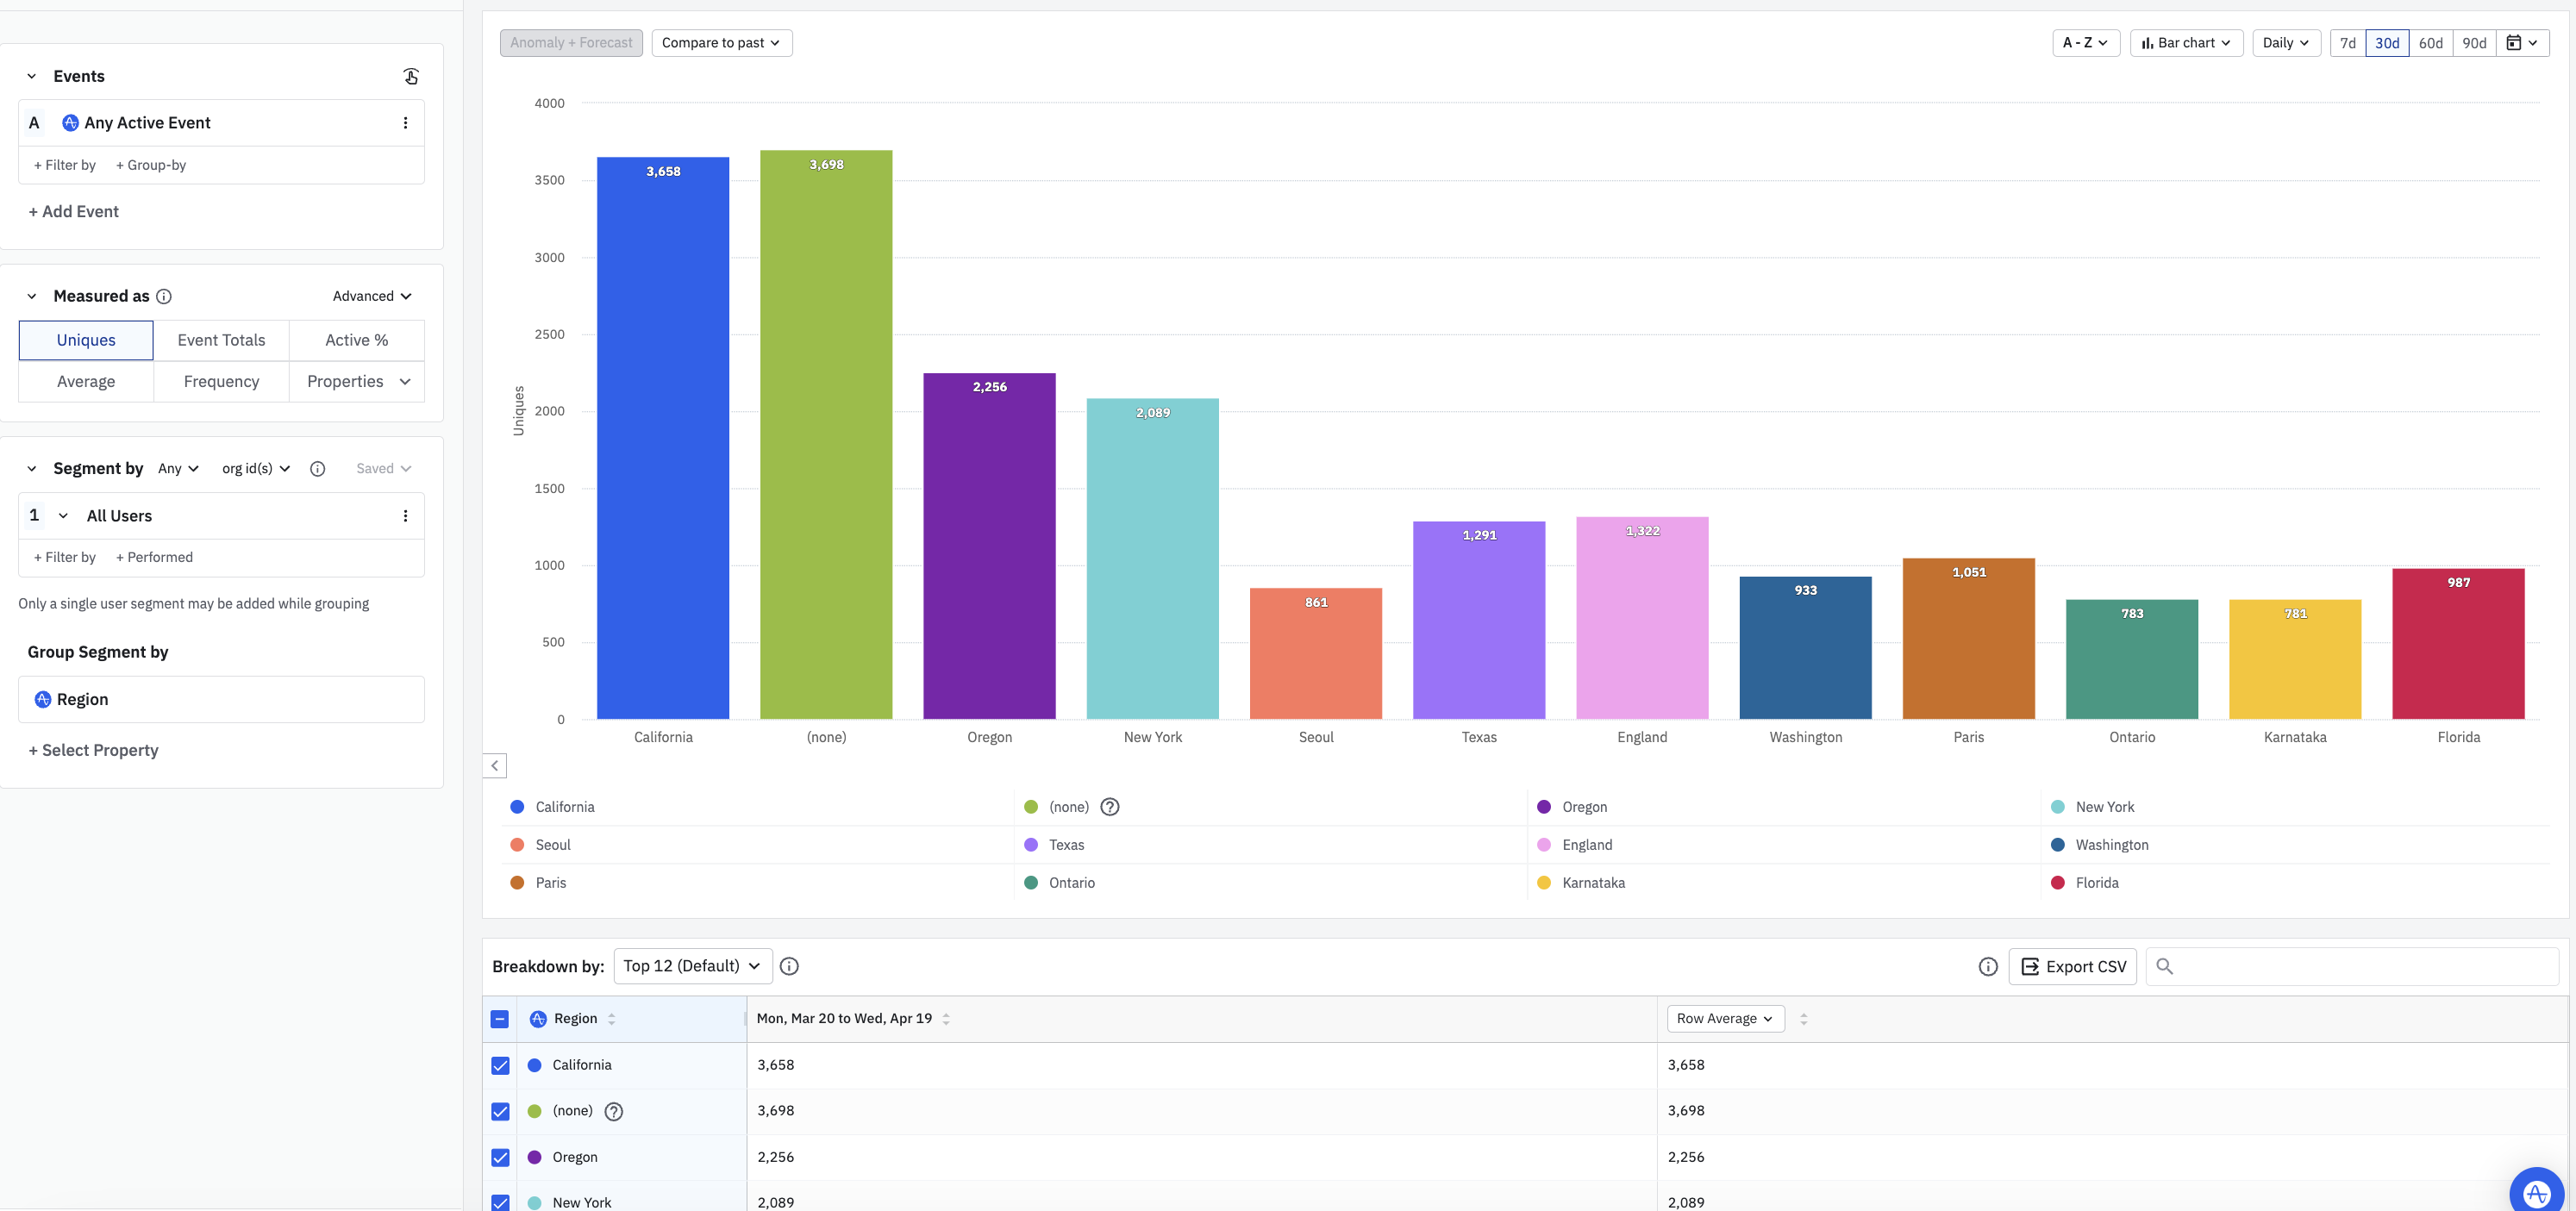
### Groups in Experiment
{% early-access %}
This feature is in Early Access. This feature may continue to evolve. This documentation may not yet reflect the latest updates.
{% /early-access %}
{% callout type="note" %}
Groups in Experiment have two usages:
1. What property to randomize on
2. What unit to analyze on
For example, as a B2B company, you may want to randomize and analyze by customer ID. If you analyze an onboarding funnel, you might not care whether one person completes step 1 and another person completes step 2, as long as both people belong to the same company. Refer to [how to evaluate groups and group properties](https://amplitude.com/docs/feature-experiment/data-model#users) for more details. Refer to [setting the bucketing unit](https://amplitude.com/docs/feature-experiment/overview) for configuration instructions.
{% /callout %}
### Create group-level behavioral cohorts
To create a group-level [behavioral cohort](https://amplitude.com/docs/analytics/behavioral-cohorts), use the dropdown on the left to specify the group for the cohort.
For example, you could create a behavioral cohort of companies that triggered the event `Create customized report`. Then, apply that cohort to a Retention Analysis chart to compare retention between companies that sent that event and companies that didn't.
You can also import a cohort of groups from a file. The file must contain exactly one group name per line.
### View and download groups with Microscope
You can also use [Microscope](https://amplitude.com/docs/analytics/microscope) with account-level reporting. Microscope is useful when you perform an account-level analysis and want to inspect a single data point or bucket.
For example, imagine you have an instant messaging application and you want to increase new user invites. Create a funnel analysis with steps from `Activate Account` to `Invite New Contact`.
Then use Microscope to view the groups in the last step's drop-off, or download the groups to understand why those groups drop off before inviting additional co-workers. You can also create a group-level cohort of those accounts, apply that cohort to other charts, or open [Investigate Conversion Drivers](https://amplitude.com/docs/analytics/charts/funnel-analysis/funnel-analysis-identify-conversion-drivers) for detailed analysis.
## Explore the behavior of a specific account
Accounts let you inspect a single group's behavior, similar to the User Activity section.
To access the Accounts tab:
1. Click _User > Group Profiles_.
2. Click any of the groups you have instrumented.
3. Optionally, search for a specific group or group property.
Group property searches must follow the syntax of `name = value`. These searches cover only groups that have been active in the last six months. Amplitude searches across all historical values held by the property, not only the most recent group property value. Use quotes for multi-word strings. Avoid delimiters like commas or semicolons when possible. Spaces are optional.
Clicking on an account takes you to that account’s page, where you can view the account’s properties and activities.
Find the account’s most recent properties in the top panel. Set the account's properties with one of the following:
- The [Group Identify API](https://amplitude.com/docs/apis/analytics/group-identify).
- The [Salesforce integration](https://amplitude.com/docs/data/source-catalog/salesforce-group).
- Event Segmentation to create dynamic properties.
Use these properties to describe the account as a whole (for example, `30 day active users`, `account manager`, `plan type`, or `renewal date`).
## Set properties at the group level
Group properties are account-level properties. These properties apply to all users who belong to that account.
### Dynamic group properties
You can turn your KPIs into dynamically updating group properties. Add group properties such as “Last 7 Day Active Users” or “Monthly Active Users” to each account in your product. Admin-level users create dynamic group properties through an [Event Segmentation](https://amplitude.com/docs/analytics/charts/event-segmentation/event-segmentation-build) chart, with the following steps:
1. **Save a single time series Event Segmentation chart**: Save a user-level chart with a single time series metric that you want to track.
Amplitude doesn't support dynamic properties on frequency and property distribution metrics, or on custom formulas.
2. **Determine time interval**: Set the time interval you want to update the group property on. For example, a rolling window of "last 7 day active users" updates every day, while "weekly active users" updates after every calendar week.
Amplitude doesn't support dynamic properties on static time ranges.
3. **Name group property**: Choose your group type and name for the group property.
Editing the chart that creates the dynamic group property doesn't affect the property.
### Create group properties using the Salesforce integration
To learn how to create **group properties** using Amplitude's Salesforce integration, refer to [Salesforce Group](https://amplitude.com/docs/data/source-catalog/salesforce-group) in Amplitude Sources.
================================================================================
# Plan your Accounts Instrumentation
URL: https://amplitude.com/docs/analytics/plan-your-accounts-instrumentation
================================================================================
# Plan your Accounts Instrumentation
Plan the group types and group properties you need before you instrument account-level reporting. By default, Amplitude reports on the individual user. Unless you specify otherwise, your charts and analyses draw on individual-user data.
Often that's enough, but sometimes you need reports built around an aggregated unit such as accounts, order IDs, or charts. The Amplitude Accounts add-on provides that reporting at the group level.
A group is an object that a set of users might belong to, such as a company of customers, a team of users, or a playlist with listeners. A group type defines the group, for example `organization_id`, `account_id`, `playlist`, or `company`. Groups can help you understand how specific accounts interact with your product, instead of only viewing individual users in those companies.
This guide aims to help you plan your Accounts instrumentation and also offers guidance for using Amplitude Accounts with Segment and Salesforce.
## Considerations
- Changes to account groups and group properties apply only to new data moving forward.
- Historical data can't be retroactively updated to include account groups and group properties.
- Amplitude recommends that you make a copy of this [planning workbook](https://docs.google.com/spreadsheets/d/1-SpVgrNip3Wy3FfmGlBn4HaETUcamKF1evvvZPio7Jc/edit#gid=376832599) to help plan your Accounts implementation.
## Limits
- You can instrument up to 5 different group types per project.
- You can have up to 1000 account-level properties per project.
## Plan your instrumentation
Before you instrument groups, decide whether you should define event level or user level groups.
### Event level group
- Creates a group that incorporates only specific events in the user's journey.
- Amplitude assigns users to a group when it receives the event.
- Users remain part of the group unless you explicitly remove the group from the event payload when you send the event.
{% callout type="example" heading="Use case" %}
Multi-product companies who only want users events related to a specific product to be associated with a group.
{% /callout %}
Amplitude recommends taking the following approach for event level groups.
- Tie users to a group when you send an event. Use an event-level group if users can leave groups or occasionally perform events without a group association.
- Send events server-side to the [HTTP V2 API](https://amplitude.com/docs/apis/analytics/http-v2) or [Batch API](https://amplitude.com/docs/apis/analytics/batch-event-upload), or using an SDK.
{% callout type="note" heading="" %}
The group association doesn't persist for the user. Pass it with each relevant event.
{% /callout %}
### User level group
- Groups users regardless of the event.
- Useful when you want to attribute all events performed by a user to a particular group.
- Amplitude assigns users to the group once, and users remain part of the group for future events. You can't remove users from user-level groups.
{% callout type="example" heading="Use case" %}
You want to associate all users who work for "Acme Company" with a particular group.
{% /callout %}
Amplitude recommends taking the following approach for user level groups.
#### Identify
Tie users to a group with identify calls.
- Send identify calls server-side to the [Identify API](https://amplitude.com/docs/apis/analytics/identify) or using an SDK.
- Once set, the group association persists for the user **forever**. Users can't be removed from user-level groups.
{% callout type="note" heading="" %}
Updates to groups aren't retroactive.
{% /callout %}
#### Group Identify
- Set and update group properties with group identify calls.
- Send group identify calls server-side to the [Group Identify API](https://amplitude.com/docs/apis/analytics/group-identify) or using an SDK.
{% callout type="note" heading="" %}
Group properties persist for the group until they're explicitly updated or unset. Updates to group properties aren't retroactive.
{% /callout %}
## Dynamic group properties
Amplitude's Dynamic Group Properties feature turns your existing KPIs into dynamically updating group properties. Using this feature, you can add group properties such as "Last 7 Day Active Users" or "Monthly Active Users" to each group.
Refer to [Dynamic Group Properties](https://amplitude.com/docs/analytics/account-level-reporting) for more details and full instructions for using this feature.
## Best practices
### Use a test project first
Historical data can't be retroactively updated so it's important that you test and validate your instrumentation before promoting to production.
Validate your test instrumentation using the [Taxonomy & Data QA](https://docs.google.com/spreadsheets/d/1U4tXFWBzl1LETzjYR_DLBamwgpYt4kRSXyS9K4qdaU0/edit#gid=2101347389) tab in the Accounts Implementation Workbook.
### Group values
Group values must be unique and because of this are typically numeric. Amplitude recommends that you send a group property that's human-readable and clearly distinguishes the group from others so you can segment and group by this property in Amplitude.
{% callout type="example" heading="Group prop" %}
Consider this example where you send an "Account Name" group property. You can use the "Account Name" property for a human-readable version of the group value.
- Group Type: Company
- Group Value: 123456789
- Group Property: Account Name = Amplitude
{% /callout %}
## Salesforce integration
If you use the [Salesforce integration](https://amplitude.com/docs/data/source-catalog/salesforce-group), you can set and update group properties using both the integration and the Group Identify API.
- You can use the Group Identify API to set group properties not available in Salesforce and also use the Salesforce integration to manipulate properties simultaneously.
- The group value in Amplitude is the key used to sync with Salesforce. The group value in Amplitude needs to exist in Salesforce to use the integration and pull in group properties.
- Amplitude runs a daily job (every morning UTC time) that updates all group properties whose pickup dates are the current date. When the Salesforce integration is activated, the first sync is executed the next day in the morning (UTC).
- You can update the sync interval to the number of days you'd like, such as: daily, weekly, monthly or a specific number of days. For example, if the last update was on September 1, 2017 and the interval is 7 days, then the next pickup date is September 8, 2017.
## Segment integration
Segment can also accommodate structuring groups at the event level or user level and the instrumentation approach varies depending on your customer's approach.
### Amplitude Actions
{% callout type="tip" heading="Segment documentation for Amplitude (Actions)" %}
This content comes from Segment's documentation and is high-level. Refer to the [Segment documentation](https://segment.com/docs/connections/destinations/catalog/actions-amplitude/#group-identify-user-1) for complete details on using Groups with Segment.
{% /callout %}
To use Amplitude’s groups with Segment, you must enable the following Action settings and make sure to include the data values they need to function. These settings act as a mapping from Segment group traits to Amplitude group types and values.
- **“Amplitude Group Type”**: This specifies what trait in your Group calls contains the Amplitude “group type”. In other words, it’s how you tell Segment which trait to use as the group type.
- **“Amplitude Group Value”**: This specifies what trait in your Group calls contains the Amplitude “group value”. It’s how you tell Segment which trait to use as the group value.
For event level groups, update your Track, Screen, and Page Call mappings in your Amplitude Destination to include the “Groups” key-value pair, for example `group type - group value`. For user level groups, update your Identify Call mapping to include the “Groups” key-value pair. To send group properties, update the Group Identify User mapping.
Refer to the [Segment documentation](https://segment.com/docs/connections/destinations/catalog/actions-amplitude) for full instructions about the Amplitude (Actions) Destination.
### Amplitude Classic
{% callout type="tip" heading="Segment documentation for Amplitude (Classic)" %}
This content comes from Segment's documentation and is high-level. Refer to the [Segment documentation](https://segment.com/docs/connections/destinations/catalog/amplitude/) for complete details on using Groups with Segment.
{% /callout %}
#### User level groups
To enable sending user level groups, customers using Segment must first configure [group calls](https://segment.com/docs/connections/spec/group/). If you have configured group calls, you must enable the following destination settings in Segment. These settings act as a mapping from Segment group traits to Amplitude group types and values.
- **Amplitude Group Type Trait**: This specifies what trait in your Group calls contains the Amplitude "group type". In other words, it's how you tell Segment which trait to use as the group type.
- **Amplitude Group Value Trait**: This specifies what trait in your Group calls contains the Amplitude "group value". It's how you tell Segment which trait to use as the group value.
For example, if you specified `group_type` as the "Amplitude Group Type Trait", and `name` as the "Amplitude Group Value Trait", then the example group call is structured as follows:
```js
analytics.group("082108b9-f41d-486g-9d2d-b5ab68bb3d5o", {
group_type: "Organization",
name: "ExampleCorp, LLC",
employees: "20",
email: "hello@example.com",
});
```
The example creates group properties for `group_type`, `name`, `employees`, and `email`.
If you don't provide "Amplitude Group Type/Value Trait", or one of the traits wasn't provided in your call:
- Segment associates the user with a group with the type "[Segment] Group", with the value "(Group Id)".
- No properties are associated with that group.
#### Event level groups
You can also use Segment to set event-level groups. This means the group designation only applies for the specific event you are recording, and doesn't persist on the user. Groups get specified by providing an integration-specific `groups` property with key-value pairs corresponding to the `groupType`-`groupValue` pairs you want to appear in Amplitude.
```js
analytics.track("Clicked Benefits Dropdown", {
dropdownColor: "blue";
},
{
integrations: {
Amplitude: {
groups: {
onboarding_cohort: "Summer 2022"
}
}
}
});
```
================================================================================
# Set up account-level reporting
URL: https://amplitude.com/docs/analytics/account-level-reporting-setup
================================================================================
# Set up account-level reporting
With [account-level reporting](https://amplitude.com/docs/analytics/account-level-reporting), you can set up aggregated, group-level analyses. This article explains the setup steps for each data source.
## Before you begin
Before you use account-level reporting, instrument groups in your Amplitude project.
After you instrument groups, supported charts include a group dropdown in the chart control panel. Use the dropdown to choose whether the chart counts events by users or groups.
Amplitude has a limit of five group types per project.
## SDKs
Follow instructions for each [Amplitude SDK](https://amplitude.com/docs/sdks/analytics) to enable and configure account-level reporting.
### Identify API
If you send data to Amplitude server-side, use the `groups` key in your identification object. The `groups` key associates a user with a group. For more information about instrumenting groups with the Identify API, refer to the [Identify API](https://amplitude.com/docs/apis/analytics/identify) documentation.
### HTTP API
If you send data to Amplitude server-side, use the `groups` key in your event object. The `groups` key adds event-level groups that persist only on that event. For more information about instrumenting groups with the HTTP API, refer to the [HTTP API](https://amplitude.com/docs/apis/analytics/http-v2) documentation.
## Segment
To set group types in Amplitude through Segment, enable these Amplitude destination settings and provide the relevant values:
- **Group Type Trait:** The trait in your Segment `group` calls that contains the group type.
- **Group Value Trait:** The trait in your Segment `group` calls that contains the group value.
You can set groups and group properties using Segment's `group` call. Refer to [Segment integration](#segment) for more information about instrumenting groups with Segment.
## Create groups using the Group Identify API
Using the Group Identify API, you can create a new group with expected group properties or update group properties for an existing group. In the example requests, parameters and keys appear in _italics_. Replace the underlined values with the parameters you need.
For more information about instrumenting groups with the Group Identify API, review the [Group Identify API](https://amplitude.com/docs/apis/analytics/group-identify) documentation.
================================================================================
# Anomaly + Forecast: Find anomalies in your data
URL: https://amplitude.com/docs/analytics/anomaly-forecast
================================================================================
# Anomaly + Forecast: Find anomalies in your data
Amplitude's Anomaly + Forecast feature highlights statistically significant deviations from expected metric values, based on historical data, and forecasts where each metric is heading. When core metrics fluctuate, it tells you whether a change is meaningful or random noise.
This can help you:
- Determine whether a change is truly meaningful
- Catch instrumentation errors
- Study seasonal trends
- Monitor the impact of product releases
Forecast projects metrics into the future, which helps you set realistic goals for your team and product.
## Before you begin
Anomaly detection and forecast work with time-series data within the following Amplitude charts: Event Segmentation, Conversion over Time (when counting by unique users for the entire funnel), User Sessions, Retention over Time, and Stickiness over Time.
Within Event Segmentation, Anomaly + Forecast works with rolling windows, rolling averages, growth percentage, and custom formulas that support time-series analyses.
Anomaly detection isn't compatible with cumulative time series charts, or charts comparing two different time periods.
If you're using an hourly interval, Anomaly + Forecast supports a maximum of one group-by.
## Set up anomaly detection
Anomaly + Forecast uses an anomaly detection technique based on the extensively tested open source tool [Prophet](https://facebook.github.io/prophet/). Prophet forecasts time-series data and handles missing data points, trend shifts, and large outliers.
You can find the control for this feature on the left hand side, right above the main chart area. If your chart isn't supported by the Anomaly + Forecast feature, the button isn't clickable.
To set up anomaly detection, follow these steps:
1. Click _Anomaly + Forecast_ to enable the feature. The button turns orange when you engage the feature.
2. Click the drop-down arrow to the right of the _Anomaly + Forecast_ button.
3. Select the mode. Your options are **agile**, **robust**, and **custom**. **Agile** mode adjusts more quickly to recent trends, using a 95% confidence interval and 120 days of training data before the chart's date range. **Robust** mode works best for stable metrics because it uses a full year of extra training data and better accounts for seasonality. **Custom** lets you change the confidence interval and training duration. Higher significance levels usually result in fewer anomalies on the chart.
{% callout type="note" %}
Amplitude automatically detects seasonality in each mode. The duration depends on the amount of data used to train the model. Agile mode typically uses daily and weekly durations, while Robust mode looks for monthly and yearly durations. In cases where enough data isn't available, Amplitude may not detect or apply seasonality.
{% /callout %}
4. Add a forecast, if you prefer. Forecast projects your metrics into the future, while anomalies apply only to historical data. To add a forecast, enter the number of months for the forecast in the _Forecast Period_ field.
5. Click _Apply_ to begin detecting anomalies.
### Set up automated project alerts
You can request an emailed digest of all anomalies in a project. These digests are automated, and you can set them up for multiple projects. After you switch them on, the digests continue until you turn them off.
To set up automated alerts for anomalies in your projects, navigate to _Organization settings > Projects_, find the project you're interested in, and click it. Then click the _Automatic Alerts_ tab and flip the toggle switch to subscribe to project alerts.
When alerts are active, Amplitude displays a table on this page that lists all alerts automatically generated by the project. Click an alert to open the chart where the alert occurred and view the alert in context.
## Interpret your results
Charts with a single series display a light blue band (the confidence interval) and a dashed line representing the expected value beside the solid blue line for your actual data. Detected anomalies appear in orange outside the confidence band. You can describe an anomaly this way: "Based on 120 days of training data, this data point represents an unexpected change with 95% confidence."
If no orange dots are present, all data points are within the confidence interval.
You can run Anomaly + Forecast with multiple series on a chart. Hover over each series to view its confidence band (these appear in different colors as well).
For forecasts, you see solid lines representing actual data and the confidence intervals until the current date. After the current date, the forecast displays only dashed lines representing anticipated future values. Prophet projects metrics by assuming the size and frequency of past changes are similar in the future, with a certain degree of confidence.
You can describe forecast results this way: "Based on the trend from the last 120 days of data, we're 95% confident that this metric is between [high value] and [low value] on [a future date]."
### Determine anomaly causes
Identifying an anomaly is only the first step. You probably want to know what caused it in the first place.
Start by looking at a few related metrics to see if you observe anomalies on those as well. In particular, look at the events that fire before or after the step in the funnel. You could also use group-bys on any properties that might yield more insights into why these anomalies occurred.
A third option is to examine the business context surrounding the anomaly. For example, did a new feature ship that day? Could that have been the cause?
Finally, [Amplitude's Root Cause Analysis feature](https://amplitude.com/docs/analytics/root-cause-analysis) is a powerful tool for tracking down the causes of anomalies.
## Training data
Amplitude uses different default training durations for different time intervals and modes. In custom mode, you can configure this and add it to the chart date range.
For example, using a daily interval and looking at the last 30 days of data on the chart, the default training data duration for daily charts is 120 days before the chart date range starts. In this case, Amplitude uses a total of **150 days** of data to train the model.
In agile mode, Amplitude uses the following default data training durations:
| **>Time interval used on the chart** | **Default training duration** |
| ------------------------------------ | ----------------------------- |
| Real time | Not Available |
| Hourly | 7 days |
| Daily | 120 days |
| Weekly | 26 weeks |
| Monthly | 6 months |
| Quarterly | 2 quarters |
In robust mode, Amplitude uses the following default data training durations:
| **>Time interval used on the chart** | **Default training duration** |
| ------------------------------------ | ----------------------------- |
| Real time | Not Available |
| Hourly | 7 days |
| Daily | 365 days |
| Weekly | 52 weeks |
| Monthly | 12 months |
| Quarterly | 4 quarters |
The **upper limit** of training data (prior periods + chart duration) used for each interval is as follows:
| **>Time interval used on the chart** | **Training duration limits** |
| ------------------------------------ | ---------------------------- |
| Real time | Not Available |
| Hourly | 14 days |
| Daily | 395 days |
| Weekly | 56 weeks |
| Monthly | 13 months |
| Quarterly | 5 quarters |
If you have a specific training duration in mind that agile or robust modes don't offer, you can set that duration by choosing the custom mode.
## Insights package
If you need alerting for anomalies, Amplitude's Insights package includes automatic and custom monitor alerts. Refer to [Insights](https://amplitude.com/docs/analytics/insights) for more information.
================================================================================
# Insights: Spot anomalies in your metrics quickly with alerts
URL: https://amplitude.com/docs/analytics/insights
================================================================================
# Insights: Spot anomalies in your metrics quickly with alerts
Insights alerts automatically detect anomalies in your metrics and notify you when a value falls outside its expected range. To do this, alerts use [Prophet](https://facebook.github.io/prophet/), a data mining and machine learning technique that first identifies expected values and the confidence intervals around them, then analyzes the trend of the data and combines it with the weekly trend.
## Requirements and limitations
Alerts have the following requirements and limits:
- You can set alerts for multiple events and user segments at the same time.
- If you use a group-by on a property, your alert tracks metrics against the top 1,000 segments only.
- Custom alerts support [Event Segmentation](https://amplitude.com/docs/analytics/charts/event-segmentation/event-segmentation-build) and [Funnel Analysis](https://amplitude.com/docs/analytics/charts/funnel-analysis/funnel-analysis-build) charts, and only on charts set to a daily or hourly frequency.
- A Funnel Analysis must measure conversion over time with percentage to support alerts.
- In an Event Segmentation chart, if you need to track weekly or monthly KPIs, use a 7-day or 30-day rolling window. Amplitude doesn't support alerts for the Frequency and Formula tabs, or for the bar chart visualization. Amplitude supports some custom formulas if they produce a chart with an X-axis time series.
- Only chart owners can set alerts. If someone else created a chart you want to receive alerts for make a copy and save it before setting up an alert. Additionally, any changes you make to a chart apply to the alert tracking it.
## Set an alert
There are three types of alerts in Amplitude: **automatic**, **custom**, and **smart**.
Amplitude creates an automatic alert for every event you instrument. This helps you track all events for anomalies and unexpected trends. Automatic alerts require no setup.
Amplitude monitors an event for anomalies when it reaches a volume of 100 or more events per day in at least 15 of the last 30 days. Amplitude considers an anomaly to have occurred when an event's value falls outside of the 99% confidence interval of historical data. Amplitude uses 120 training days for automatic monitors.
Automatic event monitoring applies **only** to individual events. The Amplitude-defined `Any Event` doesn't qualify for anomaly monitoring.
To subscribe to automatic alerts and receive emails when Amplitude detects an anomaly, navigate to _Settings > Projects,_ find the project you want to monitor, and open the _Automatic Monitors_ tab. Switch the _Not Subscribed_ toggle to _Subscribed_.
To set a **custom** or **smart** alert for a chart you own, follow these steps:
1. Navigate to the chart you want to set an alert for. Save the chart before you set an alert for it.
2. Select _Set Alert_ from the bell icon and select either a **smart** alert or a **custom** alert:
- A **smart alert** looks for unexpected changes outside of a 99% confidence interval.
- A **custom alert** allows you to be more specific about the conditions under which you receive a custom alert: whether it's above or below a specific value, or whether it differs from a previous value by a specified amount. You can also set a custom alert based on confidence interval.
3. If you set up a custom alert, specify your alert conditions (these relate to the chart's current value either exceeding or falling below a specific value, or to changes in the confidence interval). If you are setting up a smart alert, skip this step.
4. Add the emails of everyone who should receive this alert, and click _Set Alert_.
For custom or smart alerts, the training duration is 120 days for daily interval charts and 14 days for hourly interval charts.
### Confidence intervals and statistical significance in custom alerts
When you set up a custom alert, choose to receive alerts when the value breaches significance thresholds of 95%, 98%, or 99%. Amplitude determines these confidence intervals by taking your historical data and identifying where 95%, 98%, and 99% of all data points fall.
The higher the required significance, the less "noisy" your alerts are. In charts, the blue band represents the range of the confidence interval. A 95% confidence interval has a narrower band than a 99% confidence interval, because the 99% confidence interval captures more historical data points.
## View and manage alerts
To see a list of a project's recently triggered alerts, click _Notifications_ in the top right corner of the screen, and navigate to the _Alerts_ tab. Use the project switcher on the left to change to a new project.
To see a list of all existing alerts for a project, click _Manage Custom Alerts_. Open _Custom Monitors_ to update custom alerts, or _Automatic Monitors_ for smart alerts. Click an individual alert to update it.
## Alert emails
When an alert triggers, Amplitude sends an email to everyone subscribed to receive them by 8:00 AM in the project's timezone for daily metrics. For hourly metrics, the alert notification sends in the hour period after Amplitude detects the anomaly. For example, if your metric dips significantly at 1:15 PM, Amplitude’s alerting service identifies that anomaly at 2:00 PM, and sends you a notification by 3:00 PM at the latest.
Click a chart in the email to go directly to that chart in Amplitude. A side panel reiterates the issue Amplitude alerted you about.
## Slack notifications
You can also set up an alert to post to one or more Slack channels.
When you configure or modify an alert, you can select Slack channels in the _Notification_ section at the bottom of the modal.
If you haven't set up the [Slack integration](https://amplitude.com/docs/analytics/integrate-slack), connect your Amplitude account by clicking the _Connect to Slack_ button.
## Frequently asked questions
### Why are my alert notifications delayed?
Several factors can cause alert notifications to arrive later than expected:
- **Alerts evaluate on a fixed schedule, not in real-time.** Amplitude evaluates daily chart alerts at a scheduled time. Hourly chart alerts evaluate once per hour. Amplitude doesn't evaluate alerts continuously, so there's always a window between when an anomaly occurs and when Amplitude detects it.
- **Alerts on Funnel charts wait for the conversion window to close.** If your Funnel Analysis chart has a conversion window (for example, "Completed within 1 day"), Amplitude waits until that window closes before it evaluates the alert. This ensures Amplitude uses complete data but adds delay equal to the length of the conversion window.
- **Date offsets on charts shift alert evaluation.** If your chart uses a calendar offset in the datepicker (for example, "Last 30 days offset by 3"), Amplitude evaluates the alert on the shifted date. This adds delay equal to the offset amount, and stacks with other delays such as funnel conversion windows.
### Why are my alerts based on incomplete data?
If your system sends events to Amplitude after the event occurs (for example, by batching events and uploading them hours or days later), Amplitude may evaluate alerts before it receives all event data for that time period. Amplitude calls this _server upload delay_; it can cause alerts to fire on incomplete data or miss anomalies that only become visible after all events arrive.
To reduce the impact of server upload delay:
- **Send events as close to real-time as possible.** The most effective solution is to minimize the gap between when events occur and when your system uploads them to Amplitude.
- **Add a date offset to your chart.** Use the datepicker to add an offset (for example, "Last 30 days offset by 1") that shifts the alert evaluation window back. This gives Amplitude more time to receive late-arriving events before it evaluates the alert. The offset should match the typical delay in your event ingestion.
- **Contact Amplitude support to configure an evaluation delay.** Amplitude can add an evaluation delay at the organization level for hourly or daily alerts, or adjust your project's alert evaluation time. This shifts when Amplitude evaluates your alerts without requiring changes to your charts.
### Why does the alert email show a different value than my chart?
Alert emails may include a `server_upload_time` filter that shows the data point's value at the exact time the alert triggered. Depending on when additional events arrive, the value in the alert email may differ from the data point's end-of-day or final value. This is expected behavior and doesn't indicate an error.
================================================================================
# Root Cause Analysis: Track down anomalies in your data
URL: https://amplitude.com/docs/analytics/root-cause-analysis
================================================================================
# Root Cause Analysis: Track down anomalies in your data
Root Cause Analysis (RCA) automatically finds the properties and user segments that explain an anomalous data point in a chart, so you don't have to manually pivot through breakdowns to track down what changed. RCA analyzes the properties of anomalous events, adds external context like country-specific holidays and product releases, and then explains the anomaly or rules out obvious causes.
Without RCA, finding that explanation isn't always easy. For example, you might need to navigate from _Platform > OS > Device family_ to discover that users on a specific device type drive an observed change. RCA surfaces that segment for you, so you can tell whether an anomalous data point is random noise or the beginning of a shift in user behavior.
Use RCA to answer questions like "Which user groups best explain this change?" or "How are other correlated metrics affected?"
- This feature supports Event Segmentation charts only. It doesn't support formulas.
## Analyze an anomalous data point
To use RCA, you must have an analysis in Amplitude that displays anomalous data.
For example, this Event Segmentation chart has an unusual-looking peak for December 30th:
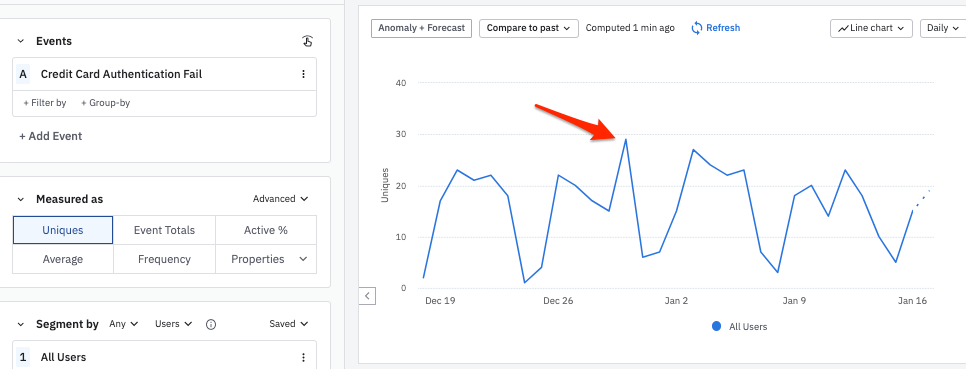
To examine this anomalous data point using Root Cause Analysis, follow these steps:
1. Click [_Anomaly + Forecast_](https://amplitude.com/docs/analytics/anomaly-forecast) to confirm that the result you're interested in is actually a statistical anomaly. Amplitude enhances the chart to display the statistically-expected values for each day, as well as a range of values that would not be considered anomalous (in other words, values that could be attributable to random chance).
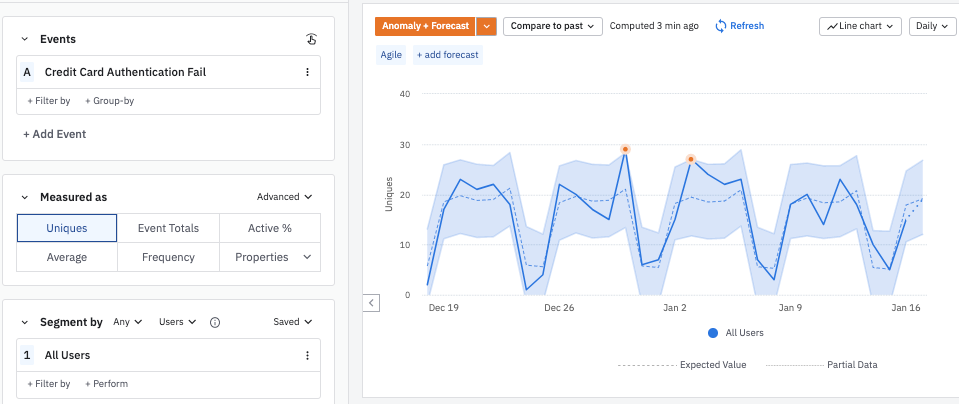
In this example, the December 30 data point is inside the range of statistically normal values, but close to the edge.
2. Click on the data point to bring up the Microscope. Then click _Run Root Cause Analysis_. Scroll down to view the _Root Cause Analysis_ tab.
Amplitude scans the properties of the anomalous event and compares them to a baseline. It then generates a time-series graph for each property, so you can understand how each value tracks with the anomalous data point.
You can **expand** any of these graphs into a standalone Event Segmentation chart by clicking _Open Chart_ for the graph you're interested in.
You can also give **feedback** on the chart by clicking the thumbs-up or thumbs-down icon. This tells Amplitude whether you found the chart useful or not, and helps improve the ranking algorithm over time.
RCA scans event properties in batches of 30 to present the most relevant properties first. RCA automatically pauses scanning to avoid overwhelming you with graphs. To scan more properties, click _Continue Scanning_.
{% callout type="tip" %}
Holidays are frequently the cause of anomalous data points. The Microscope alerts you if the anomaly you're investigating falls on a holiday.
{% /callout %}
## Configure your analysis
Amplitude automatically starts scanning with the thirty most-queried properties. If you'd like a specific event property to be included in future scans, click _Configure_ to open the _Configure Analysis_ modal. Then click _Select property..._ and select the property you're interested in from the list.
================================================================================
# Debug Analytics
URL: https://amplitude.com/docs/analytics/debug-analytics
================================================================================
# Debug Analytics
Debug Amplitude instrumentation with three tools: the Ingestion Debugger inspects requests and throttling in real time, User Lookup shows the full event stream for a single user, and the Instrumentation Explorer Chrome extension captures events as you click through your site. Use these tools to confirm events arrive, verify their properties, and trace instrumentation bugs to a specific trigger.
Use the Ingestion Debugger when you suspect events aren't arriving at Amplitude. Use User Lookup when events arrive but properties or counts look wrong for a specific user. Use the Instrumentation Explorer when you want to inspect events live in the browser before they leave the client.
You need at least one instrumented event before any of these tools show data. If you haven't instrumented events yet, set up a test app first.
## Ingestion debugger
Use the Ingestion Debugger in Amplitude to check requests, events and identify counts, and throttled users or devices:
1. Log in to Amplitude.
2. Click **Data** in the top nav bar and select [**Sources**](https://data.amplitude.com/amp-dev-docs/sources) from the left nav bar.
3. Click the **Ingestion Debugger** tab.
The ingestion debugger shows three charts: successful requests, events and identify counts, and error requests for the endpoints you specify. You can specify a timeframe of one hour or one week.
Below the ingestion debugger, Amplitude lists throttled users and devices from the last 30 minutes, plus silenced device IDs.
## User lookup
### Step 1: Find yourself
After you instrument your events, trigger some of those events on your own device. Then open Amplitude Analytics and navigate to [_Users > User Profiles_](http://analytics.amplitude.com/amp-dev-docs/activity). Search for yourself by user ID or device ID.
### Step 2: Analyze the event stream
In the user profile, the [event stream](https://amplitude.com/docs/analytics/user-data-lookup#activity) displays a user's entire event history, grouped by session. The most recent activity appears at the top of the list, and events populate the stream in ten seconds to one minute.
Clicking an event gives you detailed information about it, including the user property and event property values **at the time of that event**.
Because the event stream can update in real time, you can use it to make sure you're capturing new events correctly, or to troubleshoot or debug instrumentation errors. For example, if you trigger an event only one time but the event stream consistently displays two instances of the event, there could be an instrumentation error.
Click _Raw_ to see more information and the event's raw data.
## Instrumentation Explorer
The Amplitude Instrumentation Explorer is an extension in the Google Chrome Web Store that helps you examine and debug your Amplitude Browser SDK instrumentation by interacting with your product. It captures each Amplitude event you trigger and displays the event in the extension popup. [Download the Instrumentation Explorer](https://chrome.google.com/webstore/detail/amplitude-event-explorer/acehfjhnmhbmgkedjmjlobpgdicnhkbp).
### View your triggered events
In the Instrumentation Explorer, the **Events** tab is where you can find detailed insights into the parameters of each event you trigger on your website. This includes `user_id`, `device_id`, `event_properties`, and `user_properties`.
### Session Replay debug panel
The Session Replay debug panel is part of the [Instrumentation Explorer Chrome extension](https://chrome.google.com/webstore/detail/amplitude-event-explorer/acehfjhnmhbmgkedjmjlobpgdicnhkbp), so it runs in your browser on the page you're testing, not inside the Amplitude app. On any page that has Session Replay activity, turn on the debug panel to confirm that Session Replay is active and inspect how Amplitude captures the page. The panel floats over the page itself.
The panel shows:
- The current replay ID.
- The Session Replay SDK version.
- The Session Replay plugin version.
- The sample rate.
- The default and effective masking settings.
Because the panel runs on the live page, you can verify capture in context, then open the matching replay in the Amplitude app directly from the panel.
================================================================================
# Use Domain Proxy to relay events
URL: https://amplitude.com/docs/analytics/domain-proxy
================================================================================
# Use Domain Proxy to relay events
A domain proxy is a self-owned service that relays Amplitude events through your own domain, such as `your.domain.com/amplitude`, before forwarding them to Amplitude. Routing events this way gives you control over the data you collect, including the ability to filter, anonymize, or block events before they reach Amplitude.
{% callout type="info" heading="" %}
This guide focuses on building a proxy to Amplitude’s HTTP V2 API (`api2.amplitude.com`). This configuration sends events directly from the proxy service to Amplitude.
Talk with your developer operations and information security teams before choosing and deploying a proxy server.
{% /callout %}
## How Domain Proxy works
A proxy service relays requests between a client and another service, acting as an intermediary step.
Building a proxy service for your Amplitude org lets you proxy requests to the Amplitude API through your own domain.
For example, you can send requests on client browsers to `your.domain.com/amplitude` instead of directly to `api2.amplitude.com`. A proxy service relays the requests to the Amplitude platform.
You can integrate proxy services into existing API endpoints or build them as standalone services. Many cloud providers have tools for flexible and reliable proxy service configuration.
Sending data through a self-owned proxy service gives you more control over the data you collect and send to Amplitude. A proxy service can provide these benefits:
- Ability to toggle event flow to Amplitude.
- Self-owned audit logging of data.
- Easier debugging, filtering, and blocking of events.
- Anonymizing end-users. For example, remove originating IP address, location, userID, and more.
## Proxy services and the JavaScript snippet
You can build a proxy that supports the loading of the Amplitude JavaScript Snippet, but Amplitude recommends that you bundle Amplitude into your production builds using the [npm distribution](https://www.npmjs.com/package/amplitude-js).
## Available services on major cloud providers
Most major cloud providers have services for developing and deploying scalable APIs. You can also use API services to set up outbound traffic to Amplitude. If you use a cloud provider to deploy API services, refer to its documentation to set up a proxy service:
- Amazon Web Services: [API Gateway](https://aws.amazon.com/api-gateway/resources/)
- Microsoft Azure: [API Management](https://docs.microsoft.com/en-us/azure/api-management/api-management-key-concepts)
- Google Cloud: [API Gateway](https://cloud.google.com/api-gateway/docs)
## Build a proxy solution
The example in this guide uses [NGINX](https://nginx.org/en/) to build a proxy server. NGINX is an open-source proxy solution.
If you already have a Node API server, you could consider using the [Node SDK](https://github.com/amplitude/Amplitude-Node/) to pass events from your own endpoint to the main Amplitude event servers.
### Set up an NGINX server
First, install NGINX for local development. Then, configure NGINX to proxy requests on a particular URL to Amplitude.
This example `nginx.conf` file proxies requests from the `/amplitude` route to `api2.amplitude.com`:
```nginx
worker_processes 1;
error_log logs/error.log;
error_log logs/error.log notice;
error_log logs/error.log info;
events {
worker_connections 1024;
}
http {
include mime.types;
default_type application/octet-stream;
sendfile on;
keepalive_timeout 65;
server {
listen 8080;
server_name localhost;
location /amplitude {
proxy_pass https://api2.amplitude.com/;
}
}
}
```
### Validation and deployment
After you create the configuration file, start and test your proxy. Using the Amplitude HTTP API, send the requests to your endpoint instead of Amplitude's endpoint.
{% callout type="info" heading="" %}
The HTTP API uses a slightly different endpoint from the SDKs, so to test, you need to temporarily set `proxy_pass` to `https://api2.amplitude.com/2/httpapi/`.
{% /callout %}
This curl command tests your reverse proxy:
```curl
curl -X POST http://localhost:8888/amplitude -H "Content-Type: application/json" --data '{"api_key":"API_Key","events":[{"user_id":"12345", "event_type":"test_proxy_event", "time":1396381378123}]}
```
This call should return a `200` response code. In the web app, confirm that Amplitude received the event using User Lookup.
After you confirm that the proxy works locally, deploy the configuration to a production server. Refer to the [NGINX deployment guides](https://docs.nginx.com/nginx/deployment-guides/) for more help.
### Configure the SDKs to work with alternate endpoints
After the proxy works correctly, configure your SDK. Amplitude's SDKs are open source and have built-in options to send events to your defined server endpoint.
The SDKs point to special endpoints for their custom payloads. Find the endpoint for your SDK in this table:
| SDK | Endpoint | Set server url |
| ------------------------------------------------------------------- | -------------------------------------- | ------------------------------------------------------------ |
| [Amplitude-JavaScript](https://amplitude.com/docs/sdks/analytics/browser/javascript-sdk) | `https://api.amplitude.com` | Set the `apiEndpoint` option when initializing the SDK. |
| [Amplitude-Node](https://amplitude.com/docs/sdks/analytics/node/node-js-sdk) | `https://api2.amplitude.com/2/httpapi` | Set the `serverUrl` option when initializing the SDK. |
| [Amplitude-Android](https://amplitude.com/docs/sdks/analytics/android/android-sdk) | `https://api2.amplitude.com/` | Use the `setServerUrl` function to configure the server URL. |
| [Amplitude-Java](https://amplitude.com/docs/sdks/analytics/java/jre-java-sdk) | `https://api2.amplitude.com/2/httpapi` | Use the `setServerUrl` function to configure the server URL. |
| [Amplitude-iOS](https://amplitude.com/docs/sdks/analytics/ios/ios-sdk) | `https://api2.amplitude.com/` | Use the `setServerUrl` function to configure the server URL. |
| [Amplitude-TypeScript](https://amplitude.com/docs/sdks/analytics/browser/browser-sdk-2) | `https://api2.amplitude.com/2/httpapi` | Set the `serverUrl` option when initializing the SDK. |
| [Amplitude-Kotlin](https://amplitude.com/docs/sdks/analytics/android/android-kotlin-sdk) | `https://api2.amplitude.com/2/httpapi` | Set the `serverUrl` option when initializing the SDK. |
| [Amplitude-Swift](https://amplitude.com/docs/sdks/analytics/ios/ios-swift-sdk) | `https://api2.amplitude.com/2/httpapi` | Set the `serverUrl` option when initializing the SDK. |
| [Amplitude-Python](https://amplitude.com/docs/sdks/analytics/python/python-sdk) | `https://api2.amplitude.com/2/httpapi` | Set the `server_url` option when initializing the SDK. |
| [Amplitude-Go](https://amplitude.com/docs/sdks/analytics/go/go-sdk) | `https://api2.amplitude.com/2/httpapi` | Set the `serverUrl` option when initializing the SDK. |
After you configure the SDK, you can send events through your proxy and see them logged in Amplitude.
================================================================================
# Look up event data for individual users
URL: https://amplitude.com/docs/analytics/user-data-lookup
================================================================================
# Look up event data for individual users
User profiles shows the full event history and current property values for any single user in a project or portfolio. Search by user ID, device ID, or property values, then inspect that user's session-grouped event stream, replays, cohort membership, experiment assignments, and feature flags.
Use user profiles when you need to inspect one user's exact event history, current property values, or session context, for debugging instrumentation, investigating a support ticket, or verifying a test account. To analyze behavior across a group of users instead, use a [segmentation chart](https://amplitude.com/docs/analytics/charts/event-segmentation/event-segmentation-build).
## Search for specific users
Find users by ID, device ID, or build conditions to find users based on the events they perform.
To search for a specific user:
1. Navigate to _Users > User Profiles_.
2. In the search box above the active user list, enter the user ID or device ID, or click **Advanced Search** to search by user property values.
Searching by user property values displays a list of users who match the criteria you specified, and who triggered at least one active event in the last six months.
When you find the user you're looking for, click their ID to view their user profile. The profile has two sections: the User Details section—where the user's most-recent properties are visible—and the User History section, which contains the user's entire event history and displays all events received from them for a given day, which you can specify using the date picker.
## User details
User details displays properties that describe the user, and allows you to customize the default list of properties in the display. Pin properties to display them by default, or unpin them to move them "below the fold". Use the embedded search to find specific properties or values more easily.
## User history
The user history panel has six tabs: Activity, Insights, Session Replays, Cohorts, Experiments, and Flags.
### Activity
The event stream displays a list of all the events the user performed in your application. Filter the list by event type or a specific device ID. Enable _Live event updates_ for a real time feed of the user's activity in your application.
Amplitude groups the event stream by session, and orders it in reverse chronological order, placing the session property with the most recent activity at the top of the list. Blue events in a session are all connected by a line. Green, out-of-session events stand alone. Customize the events you want to view in the event stream by choosing to show all events, highlight specific events, or only show specific events. You can also filter on a particular device ID.
There are two available views: Info view, which gives a digestible view of the event data, and the Raw view, which displays the raw JSON file Amplitude received, along with any user properties that persisted from previous events or Identify requests. This is useful for debugging the data your product sends to Amplitude.
{% callout type="note" heading="Group properties" %}
Group properties are only visible in the raw event view.
{% /callout %}
This is useful for sharing potential bugs in instrumentation. Click **Get Link** to copy a link to a specific event's details. This is useful for sharing potential bugs in instrumentation.
#### Chart a user's event stream
You can choose up to ten events from a user's event stream to view in a funnel or segmentation chart. Follow these steps from the user's event stream in User Look-Up:
1. Check the boxes next to the events you'd like to visualize in a chart.
2. Click **Create Chart** and choose **Segmentation** or _Funnel_ to visualize the user's event stream data.
{% callout type="note" heading="Generated names" %}
Event names with a _sparkle_ icon indicate that Amplitude has generated a name to provide more context around the action a user is taking. These are Autocapture events ingested as `Page Viewed`, `Element Clicked`, and `Element Changed`, but Amplitude uses property information to make them more valuable in the event stream. Click any of them to view their ingested name and properties.
{% /callout %}
#### Raw data fields
Amplitude uses different timestamps to ensure it reports your data accurately:
- `client_event_time`: Local timestamp (UTC) when the device logged the event.
- `client_upload_time`: Local timestamp (UTC) when the device uploaded the event.
- `server_received_time`: Amplitude timestamp (UTC) when Amplitude's servers receive the event. Amplitude defaults to `server_received_time` if the event doesn't contain a `client_upload_time`.
- `server_upload_time`: Amplitude timestamp (UTC) when the event is ingested into Amplitude's ingestion system. This timestamp isn't used to calculate `event_time`, but it's available to reference in the raw data.
- `event_time`: Amplitude timestamp (UTC) that adjusts `client_event_time` by the difference between `server_received_time` and `client_upload_time`:
```text
event_time = client_event_time + (server_received_time - client_upload_time)
```
{% callout type="note" heading="" %}
If the difference between `server_received_time` and `client_upload_time` is less than 60 seconds, Amplitude doesn't adjust `event_time` and sets it equal to `client_event_time`. If that difference is greater than 60 seconds, Amplitude assumes the `client_event_time` is incorrect, likely because of a wrong system clock, and updates the timestamp.
This occurs automatically for projects with a [project ID](https://amplitude.com/docs/admin/account-management/manage-orgs-projects#view-and-edit-your-project-information) of 243704 or higher. To apply this 60-second cutoff time to an older project, contact Amplitude Support.
[Go to this blog post for more detail](https://amplitude.com/blog/dont-trust-client-data).
{% /callout %}
Daily exported files use `server_upload_time` and all dashboards use `event_time`. Queries on raw data should use `event_time`.
### Insights
The Insights tab provides a series of customizable charts to help visualize the user's activity in your application. Click a chart title to open the chart and customize it. Click a replay to open it in a new tab.
### Session replays
The Session Replays tab shows a list of all [replays](https://amplitude.com/docs/session-replay) captured for the selected user. Set the date range, and filter by event, event property, cohort, or session duration.
### Cohorts
The _Cohorts_ tab enables you to check if the user is in any of your project's cohorts. To check if the user is in a cohort:
1. Navigate to the _Cohorts_ tab.
2. Use the selector to choose one or more cohorts.
3. Click **Check**.
### Experiments
The Experiments tab shows any [feature or web experiments](https://amplitude.com/docs/feature-experiment/experiment-quick-start) of which the user is a part.
### Flags
The Flags tab lists the [feature flags](https://amplitude.com/docs/feature-experiment/workflow/feature-flag-rollouts) enabled for this specific user.
## Portfolios
User event streams support both projects and portfolios. To find a user stream in a portfolio, navigate to the User & Account Look-Up tab and select the portfolio from the dropdown.
{% callout type="note" heading="Portfolio project limits" %}
Portfolios support up to five projects. If your use case requires more, contact your account team to unlock up to 10 projects in a portfolio.
{% /callout %}
User properties are viewable at a project (not portfolio) level. This is because properties may be different for the same user in different projects.
================================================================================
# Use sessions, channels, and attribution to drive marketing analytics
URL: https://amplitude.com/docs/analytics/marketing-analytics
================================================================================
# Use sessions, channels, and attribution to drive marketing analytics
Amplitude uses sessions, channel classifiers, and attribution models to measure how users reach and engage with your product. Sessions group a user's events into a single visit and close after a period of inactivity, channel classifiers assign a marketing channel to each event, and attribution models credit the channels that drive conversions. Amplitude counts each of these differently, and the examples below show how it defines, counts, and distinguishes them.
## Sessions
Events are at the core of Amplitude Analytics, but tracking users and sessions also help to build the full picture of user engagement and the customer journey:
- **Users**: Distinct individuals who interact with your product. Amplitude identifies users through cookies, device IDs, or other tracking mechanisms. [Read more about how Amplitude tracks unique users in this article](https://amplitude.com/docs/data/sources/instrument-track-unique-users).
- **Events**: Individual actions or interactions that occur within the product, such as page views, button clicks, form submissions, or purchases. Each event is timestamped and carries relevant attributes that Amplitude calls properties. Refer to [Determine events to track](https://amplitude.com/docs/get-started/select-events) for more details.
- **Sessions**: A series of events that represent a user's visit or engagement with your product. Sessions group events together chronologically. Sessions typically have a start time (the first event) and an end time (after a period of inactivity). Refer to [session definitions](https://amplitude.com/docs/data/sources/instrument-track-sessions) for more information.
To better understand the differences between users, events, and sessions, look at an example of how they’re tracked.
The following timelines illustrate **five distinct sessions** completed by **two unique users**, User 1 and User 2:
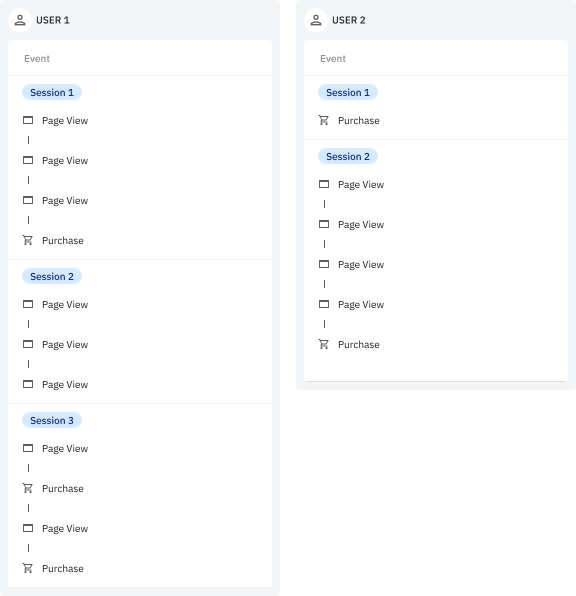
Notice that both User 1 and User 2 completed similar events during their sessions, such as page views and purchases.
The table below shows the unique counts and overall totals for both users' events:

The unique counts are tied to the count of distinct users, and the event totals are a cumulative sum of both users’ events. User 1 and User 2 both triggered purchases, so there's a unique count of two. User 1 completed three purchases and User 2 completed two purchases, giving us a purchase event total of five.
## Channel Classifiers
Channel classifiers can help to uncover what is driving the most traffic to your product. They apply to **individual events**, and are defined as a sequential (executed top to bottom) set of rules that determine the marketing channel that originated each event.
{% callout type="note" %}
Channel classifier rules are applied to the events at query time, meaning that the assigned values aren't persisted and may be changed if the classifier rules are changed. [Read more about channel classifiers in this article](https://amplitude.com/docs/data/channels).
{% /callout %}
The timelines below show sessions for User 1 and User 2 with their respective channels:
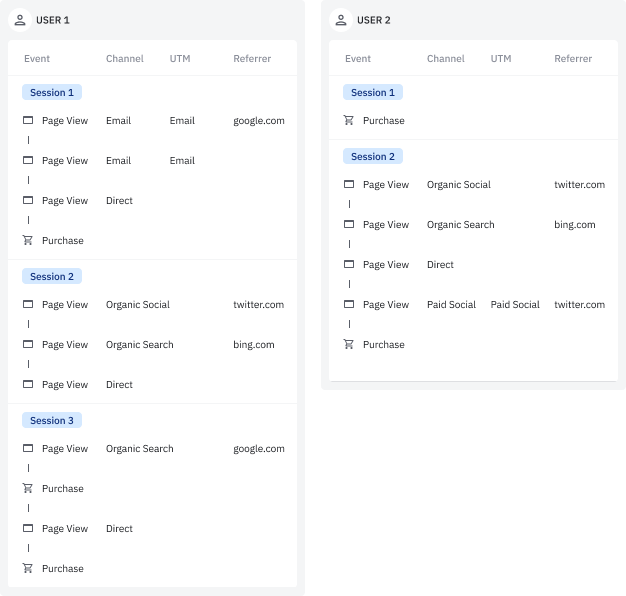
For example, User 1’s first session included four events with two distinct channels, email and direct.
This table shows how these channels are defined based on UTM and Referrer values:
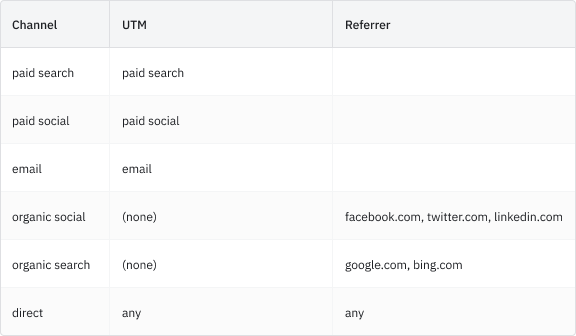
{% callout type="note" %}
Values that are blank or not present on the event aren't the same as `(none)`.
{% /callout %}
Notice that the organic search channel has rules in place to include referrer values of google.com and bing.com.
Since channel classifiers apply to **events**, this table shows the differences between unique counts and page view event totals by channel:
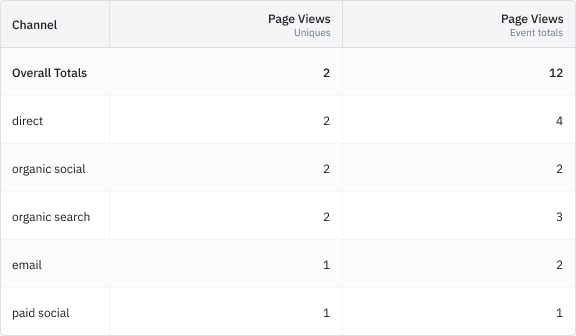
There were two unique page views based on two distinct users. The event totals, however, are a cumulative sum of all events and can tie to each channel. Since both User 1 and User 2 triggered page view events through the direct channel, there were two unique page views and four total page views for direct.
## Session metrics
Amplitude also tracks the following session-based metrics:
- **Session Totals**: The sum of sessions by each observed property value. Amplitude attributes each session to the property values that occur during the session. The sum of group-by values may exceed the total number of sessions.
- **Session Entries**: The first non-null property value observed within a session, also known as the entry point for the session.
- **Session Exits**: The final non-null property value observed within a session, also known as the exit point for the session.
These session-based measures help you understand how users first and last engage with your product, and how much time they spend in it. Refer to [session definitions](https://amplitude.com/docs/data/sources/instrument-track-sessions) for more information.
{% callout type="note" heading="See also" %}
To analyze session metrics alongside event metrics in a single chart, including hybrid formulas that combine event and session inputs, try [Metric Explorer (Beta)](https://amplitude.com/docs/analytics/charts/metric-explorer/metric-explorer-build).
{% /callout %}
The next example showcases sessions for User 1 and User 2, but notice the channel for each event, as well as each session’s entry and exit points:
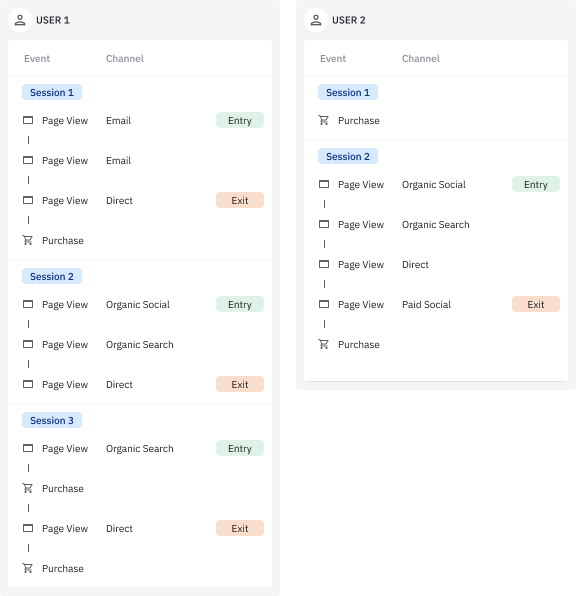
User 1's first session's entry point was the email channel, while User 2's second session's entry point was an organic social channel.
This table shows the overall totals of these session-based measures by channel:
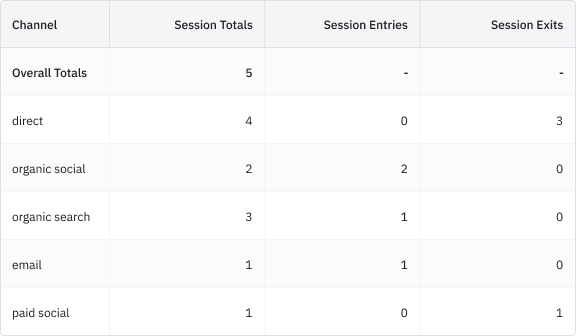
There were five distinct sessions, but each event and session can tie to a channel. For example, the direct channel tied to four of the five sessions, while the organic search channel tied to three.
{% callout type="note" %}
Session totals for channels are tied to each distinct session. This is why the session total for the email channel is one and not two.
{% /callout %}
## Attribution models
Attribution models help pinpoint which activities lead your users to target outcomes. Similar to channel classifiers, attribution is linked to individual events and doesn't apply to sessions or users. Refer to [how Amplitude uses attribution models to give credit to acquisition touch points](https://amplitude.com/docs/analytics/charts/data-tables/data-tables-attribute-credit).
In this final example, consider two attribution models:
- **First-touch**: Credits the **initial marketing channel** a user encountered within a lookback window, highlighting the journey's starting point.
- **Last-touch**: Attributes the purchase to the **final marketing channel** a user interacted with before conversion, emphasizing the crucial closing touch point.
The timelines below visualize sessions for User 1 and User 2, attributing purchase events to marketing channels and first and last touch points:
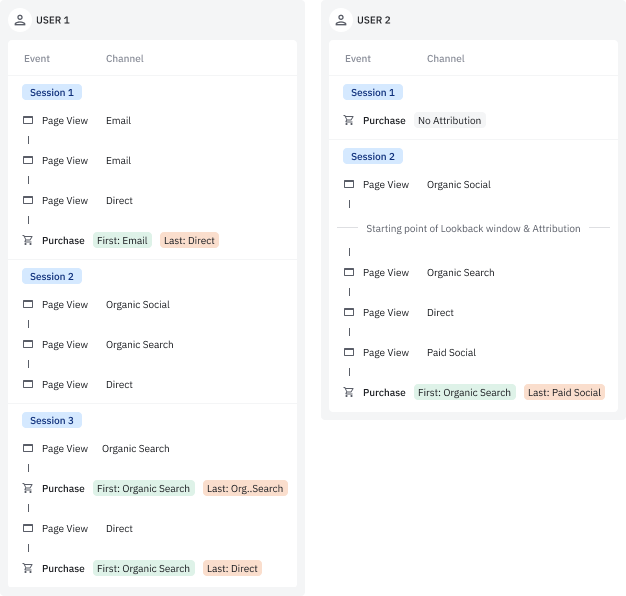
For sessions with attribution, notice the first and last touches defined. User 1’s first session had a first-touch of email and a last-touch of direct. User 2’s second session had a first-touch of organic search and a last-touch of paid social.
The unique counts and event totals by channel and attribution are seen in the table below:
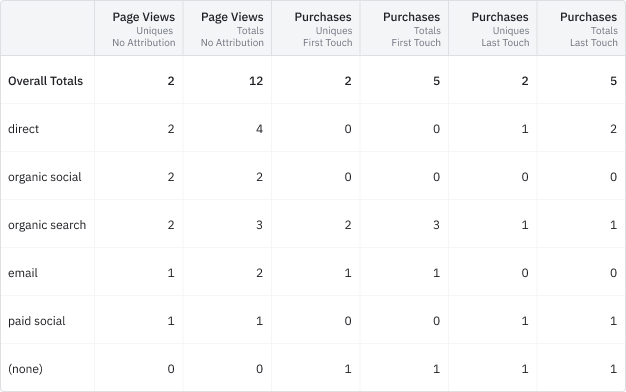
This example's unique counts are tied to the distinct users and the totals are a cumulative sum that can also be tied to relevant channels. The direct channel demonstrates this, showing two unique page views, four total page views, one unique last-touch purchase, and two total last-touch purchases. This is because both User 1 and User 2 triggered page views during sessions with no attribution, but only User 1 completed purchases after a last-touch from a direct channel.
================================================================================
# Amplitude AI
URL: https://amplitude.com/docs/amplitude-ai
================================================================================
# Amplitude AI
Amplitude AI is the agentic layer woven across the platform, turning natural-language questions into charts, replays, feedback summaries, and recommendations. Connect your own AI tools through MCP, or measure how your brand appears in answers from ChatGPT, Claude, Gemini, and Perplexity.
{% callout type="note" %}
Amplitude AI helps your team analyze your own product data with agents like the Global Agent, Dashboard Agent, and Amplitude MCP. To embed an AI helper that answers your end users' questions inside your product, go to [AI Assistant](https://amplitude.com/docs/assistant) instead.
{% /callout %}
{% outcomes heading="Explore Amplitude AI" %}
{% outcome icon="MessageSquare" title="Get an answer in plain language" href="https://amplitude.com/docs/amplitude-ai/global-agent-overview" %}
Ask the Global Agent a product question and get a chart, a cohort, or a follow-up investigation back.
{% /outcome %}
{% outcome icon="Workflow" title="Stand up a dashboard in minutes" href="https://amplitude.com/docs/amplitude-ai/dashboard-agent" %}
Hand the Dashboard Agent a goal and get a layout of charts and KPIs to refine, not a blank canvas.
{% /outcome %}
{% outcome icon="Eye" title="Find UX problems hiding in replays" href="https://amplitude.com/docs/amplitude-ai/session-replay-agent" %}
Let the Session Replay Agent watch thousands of sessions and surface the friction patterns worth fixing.
{% /outcome %}
{% outcome icon="Users" title="Hear what users are telling you" href="https://amplitude.com/docs/amplitude-ai/customer-feedback-agent" %}
Use the Customer Feedback Agent to group verbatims into themes, sentiment, and trends across every source.
{% /outcome %}
{% outcome icon="Plug" title="Use Amplitude where you already work" href="https://amplitude.com/docs/amplitude-ai/amplitude-mcp" %}
Connect Amplitude to Claude, Cursor, and other MCP clients so product data is in the tools you use.
{% /outcome %}
{% outcome icon="Target" title="See how AI talks about your brand" href="https://amplitude.com/docs/amplitude-ai/ai-visibility" %}
Track how often and how favorably your brand shows up in answers from ChatGPT, Claude, Gemini, and Perplexity.
{% /outcome %}
{% /outcomes %}
## Choose the right AI surface
Amplitude AI supports different workflows depending on where you want to ask questions and what kind of answer you need.
- [Global Agent](https://amplitude.com/docs/amplitude-ai/global-agent-overview) helps you explore Amplitude data in chat, generate charts, and investigate follow-up questions without leaving the workspace.
- [Specialized agents](https://amplitude.com/docs/amplitude-ai/specialized-agents-overview) focus on specific jobs, such as dashboard analysis, session replay review, customer feedback synthesis, and website conversion opportunities.
- [Amplitude MCP](https://amplitude.com/docs/amplitude-ai/amplitude-mcp) connects Amplitude to AI tools like Claude and Cursor, so teams can query product data from the tools where they already work. To decide which interface to use when you build an AI agent, refer to [Choose an interface for AI agents](https://amplitude.com/docs/amplitude-ai/amplitude-mcp#choose-an-interface-for-ai-agents).
- [AI Visibility](https://amplitude.com/docs/amplitude-ai/ai-visibility) tracks how often LLM answers mention your brand, competitors, and topics that matter to your market.
## Access and availability
Where you open each Amplitude AI surface, and what controls whether you have it:
| Surface | Where to open it | Availability |
| --- | --- | --- |
| [Global Agent](https://amplitude.com/docs/amplitude-ai/global-agent-overview) | Floating button, *Chat* in the left nav, or `⌘/Ctrl+Shift+K` | On by default; admins control it in [AI Controls](https://amplitude.com/docs/amplitude-ai/ai-controls) |
| [Specialized Agents](https://amplitude.com/docs/amplitude-ai/specialized-agents-overview) | The *Agents* tab | On by default on all plans; some agents need related features |
| [Custom Agents](https://amplitude.com/docs/amplitude-ai/custom-agents) | The *Agents* tab | Same as Specialized Agents |
| [Amplitude MCP](https://amplitude.com/docs/amplitude-ai/amplitude-mcp) | An AI client over OAuth, such as Claude or Cursor | On by default; admins restrict it in *Settings > Content Access > MCP* |
AI Assistant is a separate, end-user-facing product. Go to [AI Assistant](https://amplitude.com/docs/assistant) to set it up for your app.
## Prepare your data and context
AI workflows work best when Amplitude has clear data, useful project context, and enough product activity to analyze.
- [Set up and onboard agents](https://amplitude.com/docs/amplitude-ai/setup-and-onboarding) to create agents, add instructions, configure schedules, and send findings to Slack or email.
- [Add AI context](https://amplitude.com/docs/amplitude-ai/ai-context) to help agents understand your product, business goals, terminology, and metrics.
- [Prepare data for AI ingestion](https://amplitude.com/docs/amplitude-ai/preparing-data-for-ai-ingestion) to improve the quality of answers and recommendations.
- [Add context to agents](https://amplitude.com/docs/amplitude-ai/adding-context) when you want agents to focus on a specific dashboard, product surface, audience, or business question.
## Manage trust and control
Amplitude AI follows the access controls, privacy settings, and governance rules in your Amplitude organization.
- [Review privacy and security](https://amplitude.com/docs/amplitude-ai/privacy-and-security) to understand tenant isolation, no-training controls, model usage, and data residency.
- [Configure AI controls](https://amplitude.com/docs/amplitude-ai/ai-controls) to manage whether AI features appear in your organization.
- [Use agent modes](https://amplitude.com/docs/amplitude-ai/agent-modes) to decide how much autonomy an agent has before it takes an action.
- [Send feedback on AI outputs](https://amplitude.com/docs/amplitude-ai/ai-feedback) to help teams improve prompts, context, and agent behavior.
================================================================================
# Global Agent Overview
URL: https://amplitude.com/docs/amplitude-ai/global-agent-overview
================================================================================
# Global Agent Overview
Global Agent is an AI agent built into every page of Amplitude. Ask it a product question in plain language and it queries your data, builds and edits charts, creates cohorts, and runs multi-step investigations without leaving your workspace. Use Global Agent for ad-hoc questions in the moment. For recurring analysis that runs on a schedule and delivers findings to your inbox, email, or Slack, use [Specialized Agents](https://amplitude.com/docs/amplitude-ai/specialized-agents-overview) instead.
## Access Global Agent
You can access Amplitude’s Global Agent on every page in Amplitude. It’s accessible through:
- A floating action button in the lower right-hand corner of the screen
- The "Chat" option in the left-side navigation bar
- The keyboard shortcut `⌘+Shift+K` on Mac or `Ctrl+Shift+K` on Windows/Linux.
{% callout type="note" heading="Don’t see Global Agent?" %}
Contact your Amplitude administrator to see if it’s enabled in your workspace. Admins control Global Agent availability and can monitor all user activity through the [AI Controls](https://amplitude.com/docs/amplitude-ai/ai-controls) page.
{% /callout %}
## Global Agent vs chatbots
Global Agent provides value beyond typical chatbot capabilities in several ways.
### Context-aware intelligence
Global Agent understands the content of any page you're viewing in Amplitude, whether that's a chart, dashboard, or experiment. You don't need to explain the page context because Global Agent already has it. Answers are specific to your data, not generic responses.
### Data-grounded responses
Actual data from your Amplitude project backs every response. Global Agent provides links to charts, dashboards, and analyses as evidence. It never fabricates or guesses. It reports what the data shows.
### Action-oriented
Global Agent creates charts, builds analyses, generates insights, and explains your data. It also edits existing dashboards and notebooks. Use natural language to add or remove charts, update layouts, rename items, and make structural changes. Global Agent suggests next questions to deepen your exploration and searches past analyses to learn from your team's existing work.
### Analytics expertise built-in
Global Agent understands product analytics concepts like retention, funnels, and cohorts. It interprets trends and patterns, not only numbers, and explains why data matters. Depending on your prompt, Global Agent can return quick summaries or deeper analyses that include statistical significance.
### Comparison with chatbots
| Feature | Standard Chatbot | Amplitude Global Agent |
| ----------- | ------------------------- | --------------------------------------------------- |
| Context | Requires full explanation | Knows what you're viewing |
| Data access | Generic responses | Your actual Amplitude data |
| Actions | Provides instructions | Creates and edits charts, dashboards, and notebooks |
| Evidence | No data backing | Every claim linked to data |
| Expertise | General knowledge | Product analytics specialist |
| Integration | Separate tool | Embedded in your workflow |
## Core capabilities
Global Agent can help with four main types of tasks:
### Interpret existing analysis
Use Global Agent on existing charts or dashboards to:
- Explain what a chart or metric means
- Identify trends, spikes, or anomalies
- Provide context for data patterns
### Answer analytical questions
Global Agent can answer questions like:
- "Why did retention drop last month?"
- "How many active users do we have?"
- "What's our conversion rate for mobile users?"
### Create new analysis
Start from scratch by using Global Agent to:
- Build charts from natural language requests
- Modify existing charts (change time ranges, add filters, switch metrics)
- Generate multi-chart comparisons
### Create Guides and Surveys themes
Global Agent can generate a [Guides and Surveys theme](https://amplitude.com/docs/guides-and-surveys/themes#create-a-theme-with-global-agent) from a text description, a reference image, or both. Global Agent produces both brand-level and component-level settings. Open the generated theme in the theme editor to review and refine it before you publish.
### Edit dashboards and notebooks
Global Agent can edit existing dashboards and notebooks through natural language. You don't need to navigate into the editor manually. Ask Global Agent to:
- **Add or remove charts**: "Add a retention chart to the KPI dashboard."
- **Update layout and structure**: "Move the DAU chart to the top of the overview dashboard."
- **Edit metadata**: "Rename the KPI dashboard to Q2 Growth Metrics."
- **Update notebook content**: "Add a text section explaining the funnel drop-off to the onboarding notebook."
These edits apply to dashboards and notebooks you own or to which you have edit access.
### Explore your data
Global Agent has access to your entire project and can help:
- Discover relevant events and properties
- Find existing dashboards and analyses
- Understand your data taxonomy
## Key features
### Intelligent search
Global Agent finds relevant existing work before creating duplicates. It searches across charts, dashboards, notebooks, and cohorts, and uses your team's past analyses. It prioritizes “Official” and highly viewed content in the organization.
AI-generated content follows the same discoverability rules as search. AI-generated charts, dashboards, and similar content are undiscoverable by default. Global Agent finds AI-generated content you created, and AI-generated content another user explicitly publishes as discoverable.
Amplitude introduced the `isGenerated` flag in November 2025. AI-generated content created before that date doesn't have this flag, so it doesn't appear in generated-content filters.
### Evidence-based insights
Every claim includes a link to supporting data. Chart links render as visual previews, making Global Agent transparent about data sources and calculations.
### Plain language interface
You don't need SQL or technical jargon. Ask questions naturally, as you would a colleague. Global Agent provides concise, actionable responses.
### Guided exploration
Global Agent suggests logical next questions, helps you dig deeper into insights, and adapts to your analysis workflow.
## Get started with Global Agent
### Access Global Agent
1. Open any chart or dashboard, or navigate to your Amplitude home page.
2. Look for the Global Agent interface, a floating button in the lower-left side of the screen.
3. Type your question in plain language.
### Ask your first question
Start with a simple question about your current context:
- "What does this chart show?"
- "Why did this metric spike last week?"
- "How many users completed this funnel?"
Global Agent responds with a concise answer (2-5 sentences), supporting data and links, and optional follow-up question suggestions.
### Best practices
Follow these guidelines to get the most from Global Agent:
- **Be specific about time ranges and segments** when your question requires them. For example: "What's our retention rate for mobile users in the last 30 days?"
- **Reference "this chart" or "this dashboard"** for context-specific questions. Global Agent understands what you're viewing.
- **Ask follow-up questions** to refine your analysis. Each question builds on the previous context.
### Example use cases
Here are common scenarios where Global Agent can help:
- **Understanding a spike in user activity**: "Why did daily active users increase by 30% last Tuesday?"
- **Comparing conversion rates across segments**: "How does conversion rate differ between iOS and Android users?"
- **Building a retention analysis from scratch**: "Show me 7-day retention for users who signed up in December."
- **Finding existing work on a specific topic**: "Are there any dashboards about checkout funnel performance?"
- **Editing an existing dashboard**: "Add a retention chart to the KPI dashboard and remove the DAU chart from the overview."
## Understand Global Agent responses
### Response structure
Each Global Agent response includes three components by default:
1. **Concise answer**: 2-5 sentences that directly address your question.
2. **Supporting data and links**: Charts, dashboards, or analyses that back up the answer.
3. **Follow-up suggestions** (optional): Logical next questions to deepen your exploration.
Response formats vary depending on your prompt. If you want a deeper answer, specify that in your prompt.
### Chart links and previews
When Global Agent references a chart, it embeds a visual preview you can interact with. Select the preview to access the full chart details. Save analyses that Global Agent generates to your workspace for future reference.
### Global Agent creates and edits content
When Global Agent creates a new chart or analysis for you:
- Amplitude saves charts to your personal space by default
- You can share or publish AI-generated work like any other Amplitude content
- Always review and validate AI-created analyses before using them in important decisions
When Global Agent edits an existing dashboard or notebook, changes apply immediately to the saved content. Review edits after Global Agent completes them to confirm accuracy.
## Tips for success
Keep these tips in mind as you work with Global Agent:
- **Start with your current context** (chart or dashboard) for fastest results. Global Agent uses this context to provide more relevant answers.
- **Use your team's analyses**. Global Agent searches for existing work, so you can benefit from analyses others have already created.
- **Allow time for complex questions**. Global Agent may take 30-60 seconds to research and generate comprehensive answers.
- **Validate the data**. All generated content includes links so you can verify the analysis and explore deeper.
{% callout type="note" heading="Global Agent and Data Privacy" %}
For information about how Global Agent handles your data, review [Amplitude's Security and Privacy](https://amplitude.com/trust#:~:text=Trust%20in%20Amplitude%20AI).
{% /callout %}
================================================================================
# Agent Modes
URL: https://amplitude.com/docs/amplitude-ai/agent-modes
================================================================================
# Agent Modes
Global Agent runs each question in one of three modes: Fast, Default, or Investigate. These modes trade response time for analytical depth. Pick Fast for simple lookups and existing-chart reads, Default for most analytical questions and new charts, and Investigate for multi-step root-cause research.
## Fast mode
Fast mode delivers quick answers to simple questions in 2-10 seconds.
### When to use Fast mode
Use Fast mode for:
- Quick lookups and simple questions.
- Reading data from existing charts without modifications.
- Basic context queries (event names, properties, definitions).
- Checking current metric values.
- Simple comparisons on existing data.
### How Fast mode works
Fast mode uses direct data queries with minimal exploration. It's limited to 2-4 tool calls and focuses on answering your immediate question. This mode performs minimal taxonomy exploration, which keeps responses fast but less comprehensive.
### Limitations
Fast mode has several limitations:
- It doesn't create new charts or complex analyses.
- It's less thorough in exploring alternative interpretations.
- It may not discover related insights.
- It works best for simple, well-defined questions.
### Example questions for Fast mode
- "What's the current DAU?"
- "How many users are in this cohort?"
- "What does this metric measure?"
## Default mode (recommended)
Default mode is the recommended choice for most use cases. It balances speed with analytical depth, typically responding in 30-60 seconds.
### When to use Default mode
Use Default mode for:
- Most analytical questions.
- Creating new charts and analyses.
- Modifying existing charts (filters, segments, time ranges).
- Multi-chart comparisons.
- Questions requiring data exploration.
- Understanding trends and patterns.
### How Default mode works
Default mode balances speed with analytical depth. It uses 4-6 tool calls on average and searches for existing relevant work before creating new content. This mode can create charts, run queries, and explore your taxonomy while providing context-aware insights.
### Capabilities
Default mode can:
- Create new visualizations from natural language.
- Modify chart parameters (metrics, intervals, segments).
- Compare data across dimensions.
- Discover and use relevant events and properties.
- Suggest logical follow-up questions.
### Example questions for Default mode
- "Show me weekly active users for the last quarter."
- "Compare conversion rates between mobile and web."
- "Why did retention drop last month?"
- "Create a funnel from signup to first purchase."
## Investigate mode
Investigate mode performs deep research on complex questions. It takes 4-5 minutes to deliver comprehensive analysis.
### When to use Investigate mode
Use Investigate mode for:
- Complex analytical investigations.
- Root cause analysis.
- Multi-dimensional trend analysis.
- Anomaly investigation requiring extensive exploration.
- Questions needing thorough, comprehensive research.
- Strategic decision support.
### How Investigate mode works
Investigate mode performs comprehensive, multi-step analysis using up to 10 or more tool calls. It conducts extensive taxonomy exploration, tests multiple hypotheses, explores data from multiple angles, and synthesizes findings into detailed insights.
### Capabilities
Investigate mode can:
- Analyze complex patterns in depth.
- Explore multiple potential explanations.
- Perform comprehensive segmentation analysis.
- Identify non-obvious correlations.
- Provide strategic recommendations.
### Trade-offs
Investigate mode requires a longer response time (4-5 minutes). Use it sparingly for truly complex questions. Simple queries don’t require the same level of analysis that Investigation mode provides.
### Example questions for Investigate mode
- "Conduct a deep analysis of why our conversion rate dropped 15% in Q3."
- "Investigate what's driving the spike in churn among enterprise customers."
- "Thoroughly analyze user engagement patterns across all platforms and segments."
- "What are all the factors contributing to our retention improvement?"
### Mode comparison
| Feature | Fast | Default | Investigate |
| ---------------------- | -------- | --------- | ----------- |
| Response time | 2-10 sec | 30-60 sec | 4-5 min |
| Tool calls | 2-4 | 4-6 | 10+ |
| Creates charts | No | Yes | Yes |
| Searches existing work | Limited | Yes | Yes |
| Taxonomy exploration | Minimal | Standard | Extensive |
| Multi-step reasoning | No | Limited | Yes |
| Hypothesis testing | No | Limited | Yes |
## Choosing the right mode
Start with Default mode if you're unsure. It handles most questions and provides a good balance of speed and depth.
### Use Investigate mode when
- Default mode's answer prompts deeper questions.
- You need comprehensive analysis for important decisions.
- The question involves "why" with multiple potential factors.
- You're investigating unexpected changes or anomalies.
### Use Fast mode when
- You need a quick number or fact.
- You're already looking at the right chart.
- Time is critical and you need immediate answers.
- The question is purely informational (no analysis needed).
### Decision guide
Follow this decision process to choose the right mode:
1. **Is your question simple and factual?**
- If yes, use Fast mode
- If no, continue to step 2
2. **Does it require creating charts or moderate analysis?**
- If yes, use Default mode
- If no, continue to step 3
3. **Does it require deep investigation across multiple dimensions?**
- If yes, use Investigate mode
- If no, use Default mode (safest choice)
## How modes behave
All modes share these characteristics:
- They respect your current context (chart, dashboard, page).
- They provide evidence-based answers with links to supporting data.
- They follow your organization's AI context settings.
You can switch modes mid-conversation if you need different depth. To improve efficiency, Amplitude recommends being intentional about using Investigate mode. Not every question requires the depth it provides.
================================================================================
# Adding Context
URL: https://amplitude.com/docs/amplitude-ai/adding-context
================================================================================
# Adding Context
Page context enables Global Agent to understand what you're viewing in Amplitude. Global Agent captures details about your chart, dashboard, notebook, or experiment so you can ask questions naturally without manually explaining the context.
{% callout type="note" heading="Organization context" %}
This article focuses on adding context to individual queries. Organization administrators can also set organization-wide context. For more information, review the [AI Context](https://amplitude.com/docs/amplitude-ai/ai-context) article.
{% /callout %}
## Page context improves responses
Page context makes your interactions with Global Agent more natural and efficient in several ways.
### Eliminates the need to describe your current view
You can ask "What does this spike mean?" instead of "What does the spike in my DAU chart for October 2025 mean?" Global Agent already knows which chart, metrics, and time range you're viewing.
### Makes answers specific to your exact analysis
Global Agent references the actual events, properties, and segments in your current chart. It understands applied filters and can explain their impact. It knows which metrics you're measuring and how they're configured.
### Enables natural, conversational questions
With page context, you can ask questions like:
- "Why did this drop?" → Global Agent knows which metric and time period.
- "Add a filter for mobile users" → Global Agent knows which chart to modify.
- "Show me this by country" → Global Agent understands the current analysis and knows which properties to segment.
### Provides more actionable recommendations
Global Agent suggests relevant follow-up analyses based on what you're viewing. It recommends specific events or properties from your current context and offers next steps tailored to your current workflow.
## Information included with page context
The information included in page context varies by page type.
### For charts
Page context includes:
- Chart type (segmentation, funnel, retention, and so on).
- Events and metrics being measured.
- Time range and interval.
- Applied segments and filters.
- Group-by dimensions.
- Chart name and description.
### For dashboards
Page context includes:
- Dashboard name and description.
- All charts included in the dashboard.
- Dashboard-level filters.
- Layout and organization.
### For session replays
Page context includes:
- Page URLs visited in the session.
- Page titles and domains.
- UI elements and interactions.
- Previous page navigation flow.
- HTML and component-level details.
### For all pages
Page context always includes:
- Current page URL and path.
- Page title.
- Navigation history (where you came from).
- Applied global filters or settings.
## Get the most value out of page context
Page context is especially useful in these scenarios:
### Interpreting existing analysis
- "What does this chart tell me?"
- "Why is there a spike on October 15th?"
- "Is this trend significant?"
### Modifying current work
- "Change this to weekly intervals."
- "Add a breakdown by device type."
- "Filter to only premium users."
### Exploring related questions
- "Show me the same analysis for mobile users."
- "How does this compare to last quarter?"
- "What happened before this drop?"
### Debugging or investigating
- "Why are these numbers different from the dashboard?"
- "What filters are applied here?"
- "Which events are included in this metric?"
## Page context compared to manual context
Page context provides significant advantages over manually describing your analysis. In this example scenario, you’re viewing a retention chart for mobile users in Q4 2025.
### With page context (automatic)
- Global Agent knows the chart you're viewing.
- You ask: "Why did week 2 retention drop?"
- Global Agent analyzes the specific chart, time period, and segment in the chart.
### Without page context (manual)
- You explain: "I'm looking at a retention chart for mobile users from October to December 2025, and I see week 2 retention dropped from 45% to 38%..."
- More typing creates more room for miscommunication.
- Global Agent may not have access to the actual chart configuration.
## Privacy and data considerations
Page context respects your privacy and follows Amplitude's security model.
### Respects your Amplitude permissions
Page context only includes data you already have access to view. It follows the same role-based access controls as the rest of Amplitude.
### Session-specific
Context only applies to your current conversation. It isn't shared with other users or sessions.
### No sensitive data exposure
Page context includes metadata and configuration, not raw user data. Global Agent accesses data only when it runs queries you request.
## Best practices for using page context
Follow these practices to get the most from page context:
### Navigate to the relevant page first before asking questions
Open the chart, dashboard, or analysis you want to discuss. When you open Global Agent, it adds your context to the chat. The current context appears in the chat dialog box.
### Use contextual references
Use words like "this," "here," and "current":
- "Explain this chart" instead of describing the chart.
- "Add a filter here" instead of specifying which chart.
- "What's driving this trend?" instead of repeating the metric name.
### Ask follow-up questions naturally
Page context persists through the conversation. You can ask multiple related questions without re-explaining context.
### Switch pages to change context
When you navigate to a different chart or dashboard, Global Agent automatically updates to your new context.
================================================================================
# MCP Connectors for Global Agent
URL: https://amplitude.com/docs/amplitude-ai/global-agent-connectors
================================================================================
# MCP Connectors for Global Agent
MCP connectors let [Global Agent](https://amplitude.com/docs/amplitude-ai/global-agent-overview) reach into the tools where your team plans, ships, and talks, so it can ground answers in product specs, tickets, and conversations alongside your Amplitude data and [page context](https://amplitude.com/docs/amplitude-ai/adding-context). Use connectors to ask cross-source questions like "Which retention drop correlates with the Jira incidents last sprint?" and to take action in those tools without leaving Amplitude. This is useful for product managers connecting analytics to ongoing work, and for technical teams who want the agent to read and update tickets, docs, and repositories.
## Supported connectors
Global Agent supports the following MCP connectors:
| Connector | What Global Agent can do |
| -------------------------------- | ------------------------------------------------------------------------------------- |
| **Atlassian** (Jira, Confluence) | Read Jira tickets and Confluence pages, create and update issues, and comment. |
| **GitHub** | Read pull requests, issues, and code, open issues, and comment on pull requests. |
| **Granola** | Read meeting notes and transcripts to bring discussion context into the conversation. |
| **Linear** | Read issues and projects, and create and update issues. |
| **Notion** | Read pages and databases, and create and update pages. |
| **Sentry** | Read error and issue details to connect production problems with analytics. |
| **Slack** | Search and read channels and threads, and post messages. |
{% callout type="note" heading="Need another tool?" %}
To connect a tool that isn't on this list, add a [custom connector](#custom-connectors).
{% /callout %}
Organization Admins control which of these connectors org members can authorize from the **Connectors** tab in [AI Settings and Controls](https://amplitude.com/docs/amplitude-ai/ai-controls). For more detail, refer to [Manage available connectors](#manage-available-connectors).
## How MCP connectors work
Global Agent uses the [Model Context Protocol (MCP)](https://modelcontextprotocol.io) to connect with external services. Each connector exposes a set of tools that Global Agent can call during a conversation. Tools fall into two categories:
- **Read tools** pull information into the conversation, like fetching a Jira ticket, reading a Notion page, or searching a Slack channel.
- **Write tools** take action in the connected service, like creating a ticket, updating a doc, or posting a message.
You authorize each connector through [OAuth](https://oauth.net/2/), so Global Agent acts on your behalf and respects the same permissions you have in the connected tool. Once connected, that service's tools stay available to Global Agent in every conversation until you disconnect the connector.
## Use cases
- **Correlate analytics with product work**: Ask Global Agent to compare a retention drop against Jira incidents or Linear bugs from the same sprint.
- **Ground analysis in product specs**: Pull a Notion or Confluence spec into the conversation, then ask Global Agent to find the matching funnel or cohort.
- **Close the loop on insights**: Turn an analysis into a Jira ticket, Linear issue, or Slack post without leaving Global Agent.
- **Summarize cross-tool context**: Ask Global Agent to combine a GitHub PR description, the related Linear ticket, and an Amplitude chart into a single summary.
### Take action with write tools
Connectors support both read and write tools, so Global Agent can do more than retrieve context. You can ask Global Agent to:
- Create a Jira or Linear ticket from an insight.
- Update a Confluence or Notion page with findings from an analysis.
- Post a summary to a Slack channel.
- Open a GitHub issue or comment on a pull request.
Global Agent confirms write actions before it runs them, so you stay in control of what changes in the connected tool.
## Prerequisites
- Global Agent enabled for your organization. Organization Admins manage availability from [AI Settings and Controls](https://amplitude.com/docs/amplitude-ai/ai-controls).
- An account in the external service you want to connect, with permission to authorize third-party apps.
## Set up a connector
1. Open Global Agent.
2. Click the **Select Mode** icon and then select **Connectors > Add Connectors**.
3. Select the connector you want to enable, then click **Connect**.
4. Complete the OAuth flow in the popup window to authorize Global Agent.
5. Return to Global Agent. The connector now appears as available in the Connectors panel.
Repeat for each connector you want to use. Connectors only need authorization one time for each account.
## Manage available connectors
By default, every supported MCP connector is on your organization's allowlist, so any org member can connect any service. Organization Admins manage the allowlist from [AI Settings and Controls](https://amplitude.com/docs/amplitude-ai/ai-controls) to restrict which connectors org members can authorize.
1. Go to _Settings > AI Controls_.
2. Open the **Connectors** tab to view the connectors available to your org members.
3. To remove a connector from the allowlist, open the more-options menu (**...**) on its row and remove it. Org members can no longer connect a removed service from Global Agent.
4. To add a connector back, click **Browse MCP** and select it from the catalog.
## Custom connectors
If the tool you need isn't a supported connector, you can bring your own. Any service that exposes a remote [MCP server](https://modelcontextprotocol.io) can become a custom connector, so Global Agent reads from and writes to tools beyond the built-in set.
1. In a Global Agent chat, click the plus sign (**+**).
2. Select **Connectors > Manage Connectors**.
3. Click **Add custom MCP server**.
Custom connectors appear alongside built-in connectors, and Organization Admins manage them from the **Connectors** tab in [AI Settings and Controls](https://amplitude.com/docs/amplitude-ai/ai-controls).
## Frequently asked questions
{% accordion title="Which connectors does Global Agent support?" %}
Global Agent supports built-in MCP connectors like Atlassian (Jira and Confluence), GitHub, Granola, Linear, Notion, Sentry, and Slack. If Global Agent doesn't support the tool you need, add a [custom connector](#custom-connectors). For what each connector can do, refer to [Supported connectors](#supported-connectors). Your Organization Admin controls which connectors you can authorize.
{% /accordion %}
{% accordion title="Do I need to authorize a connector every time I use it?" %}
No. You authorize each connector one time for each account. After you complete the OAuth flow, that service's tools stay available to Global Agent in every conversation until you disconnect the connector.
{% /accordion %}
{% accordion title="Can Global Agent make changes in my connected tools?" %}
Yes. Connectors support both read tools that pull information into the conversation and write tools that take action, such as creating a ticket, updating a page, or posting a message. Global Agent confirms each write action before it runs, so you stay in control of what changes in the connected tool.
{% /accordion %}
{% accordion title="What can Global Agent access in a connected service?" %}
Global Agent acts on your behalf and respects the same permissions you have in the connected tool. It can't read or change anything you can't already access yourself.
{% /accordion %}
{% accordion title="Why don't I see a connector I expected?" %}
Organization Admins manage which connectors org members can authorize from the **Connectors** tab in [AI Settings and Controls](https://amplitude.com/docs/amplitude-ai/ai-controls). If a connector you expected isn't available, your admin may have removed it from the allowlist. Ask your Organization Admin to add it back.
{% /accordion %}
{% accordion title="Are connectors available in the EU Data Center?" %}
Yes. Organizations provisioned in Amplitude's EU Data Center can use MCP connectors. For how Amplitude handles your data in the EU, refer to [Privacy and security](https://amplitude.com/docs/amplitude-ai/privacy-and-security).
{% /accordion %}
{% accordion title="Is my connected-tool data stored or used to train models?" %}
Amplitude doesn't store your data with third-party AI providers, and Amplitude and its partners never use your data for model training. For more detail, refer to [Privacy and security](https://amplitude.com/docs/amplitude-ai/privacy-and-security).
{% /accordion %}
================================================================================
# Global Agent in Slack and Microsoft Teams
URL: https://amplitude.com/docs/amplitude-ai/slack-teams
================================================================================
# Global Agent in Slack and Microsoft Teams
Global Agent in Slack and Microsoft Teams runs Amplitude's AI assistant inside your chat platform. Ask product questions, create charts, and surface existing dashboards without leaving the channel. It queries Amplitude with the same analytics engine as the web app and returns concise answers with links back to the underlying data.
Use Global Agent in Slack or Teams when you want product insights in context, without switching to a browser tab. If you need advanced chart controls, notebook analysis, or full dashboard editing, open Amplitude in the web app instead.
Global Agent in Slack requires a paid Slack workspace; Microsoft Teams doesn't. Your Amplitude organization must have Global Agent enabled, and you need a chat-platform connection through _Settings > Personal Settings > Profile_. For platform setup, refer to [Integrate Slack with Amplitude](https://amplitude.com/docs/analytics/integrate-slack) or [Integrate Microsoft Teams with Amplitude](https://amplitude.com/docs/analytics/integrate-microsoft-teams).
## Get started
Follow these steps to start using Global Agent:
1. Message Amplitude in any channel where you've added the Amplitude app, or in a direct message.
2. Ask your first question. Type a natural-language question about your data, such as:
- "What are our weekly active users?"
- "How is sign-up to purchase conversion trending this month?"
3. Choose your project.
- The first time you use Global Agent, Amplitude prompts you to select a **project**.
- This project acts as your default context for that conversation or channel.
- You can change it later with the **Change project** button that appears in Global Agent responses.
After you complete these steps, you can @mention Amplitude in any channel to use Global Agent in that channel.
## What you can do
Global Agent in Slack and Teams gives you a subset of the in-product Global Agent capabilities, optimized for chat.
### Ask natural-language questions about your product data
Use plain language to ask about product usage, growth, and engagement:
- "What's our DAU trend over the last 30 days?"
- "Which countries have the fastest user growth?"
- "How is retention for users who signed up in the last 7 days?"
Global Agent interprets your question, queries Amplitude with the same analytics engine available in the product, and returns a concise summary with links back to supporting charts or dashboards.
### Create and refine charts
Global Agent can generate or adjust analyses without leaving your chat platform:
- "Create a funnel from signup to first purchase."
- "Add a filter to show only mobile users on this chart."
- "Break this down by pricing plan."
Global Agent creates or edits charts in your Amplitude project and returns direct links. Open the chart in Amplitude to explore it further, adjust configurations, or share it with your team.
### Find and share existing content
Use Global Agent as a discovery layer over your saved work:
- "Find our retention dashboard for the mobile app."
- "Show me revenue trend charts."
- "Locate dashboards about onboarding experiments."
Global Agent surfaces existing charts and dashboards and shares them back into your channel, making it easy to reuse analyses instead of rebuilding them.
## Link previews and chart unfurls
When Amplitude links appear in Slack or Teams, your chat platform can unfurl them into rich previews so teammates can quickly review the referenced content. This applies to links from Global Agent replies and links you paste directly.
### Slack Work Objects
When you paste an Amplitude chart or dashboard link into a Slack channel, Slack displays a **Work Object**: a modernized interactive preview that shows key details about the linked content at a glance. Work Objects replace the legacy Amplitude link preview experience in Slack.
Work Objects also include **Global Agent nudges**: prompts that let you open a conversation with Global Agent directly from the preview, so you can ask follow-up questions about the linked content without switching to the Amplitude web app.
Work Objects support standard and EU data center (EUDC) deployments. Charts and dashboards unfurl as Work Objects; Amplitude plans to add support for additional content types.
To trigger a Work Object, paste any Amplitude chart or dashboard link into a Slack channel where you've installed the Amplitude app.
### Microsoft Teams link previews
When Global Agent includes Amplitude links in its replies in Teams, they unfurl into rich previews so teammates can quickly review the referenced content.
{% callout type="note" heading="" %}
Some legacy chart types (including Pathfinder, Compass, and Persona) don't unfurl as rich previews, even when you enable link previews.
{% /callout %}
If previews aren't showing, check the setup for your platform:
- **Slack**: Confirm that you've enabled link previews in Slack for your workspace and client. For setup details, refer to [Turn on link previews](https://amplitude.com/docs/analytics/integrate-slack#turn-on-link-previews).
- **Microsoft Teams**: Ensure the Amplitude Teams app has the necessary message extension permissions in your Teams admin center, and that your organization's Teams policies don't disable link unfurling. For details, refer to [Turn on link previews](https://amplitude.com/docs/analytics/integrate-microsoft-teams#turn-on-link-previews).
## Permissions and context
Global Agent in Slack and Teams uses the same assistant that runs in the Amplitude web app:
- It uses your organization's Global Agent context and settings (such as default organization or project context).
- It respects existing Role-Based Access Control (RBAC) and Space permissions. Global Agent returns only results based on data you can already access in Amplitude.
- Links that Global Agent generates open directly in Amplitude, where you can access the full chart, dashboard, or notebook experience if you have the required permissions.
For sensitive or high-impact decisions, always open the linked chart or dashboard in Amplitude and validate the underlying data and configuration.
## Troubleshooting
If Global Agent isn't behaving as expected, try the following checks:
- **No response from @Amplitude.**
- Verify that you've connected your account in _Settings > Personal Settings > Profile_ in Amplitude.
- Confirm that you've added the Amplitude app to the channel.
- Make sure your Amplitude organization has Global Agent enabled.
- **Slack only:** Confirm that your Slack workspace is on a paid plan.
- Disconnect and reconnect your Slack or Microsoft Teams account in _Settings > Personal Settings > Profile_ in Amplitude to refresh the connection.
- **Answers seem incomplete or irrelevant.**
- Check which project Global Agent shows in its response and, if needed, select **Change project** to switch to a more relevant project.
- Rephrase your question with more context (for example, specify platform, date range, or key segments).
- **Work Objects or link previews aren't showing.**
- **Slack:** Ensure that you've enabled link previews in Slack. For details, refer to [Turn on link previews](https://amplitude.com/docs/analytics/integrate-slack#turn-on-link-previews). Work Objects appear only for charts and dashboards; Amplitude doesn't yet support other content types.
- **Microsoft Teams:** Ensure the Amplitude Teams app has message extension permissions and that your organization's Teams policies don't disable link unfurling. For details, refer to [Turn on link previews](https://amplitude.com/docs/analytics/integrate-microsoft-teams#turn-on-link-previews).
- Confirm that the link points to a supported chart or dashboard type.
- Disconnect and reconnect your Slack or Microsoft Teams account in _Settings > Personal Settings > Profile_ in Amplitude to refresh the connection.
If issues persist, contact your Amplitude administrator or reach out to Amplitude Support.
## Data verification
Global Agent helps you move faster by summarizing and exploring your Amplitude data. However, like any AI system:
- Responses may sometimes be incomplete or inaccurate.
- The model may misinterpret ambiguous questions or rely on misconfigured charts.
For critical business decisions:
- Always open the linked charts and dashboards in Amplitude.
- Confirm that filters, segments, and date ranges match what you expect.
- Use Global Agent as a starting point or accelerator, not as the final source of truth.
## Platform setup guides
For detailed instructions on connecting Amplitude to your chat platform, refer to:
- [Integrate Slack with Amplitude](https://amplitude.com/docs/analytics/integrate-slack).
- [Integrate Microsoft Teams with Amplitude](https://amplitude.com/docs/analytics/integrate-microsoft-teams).
================================================================================
# Specialized Agents Overview
URL: https://amplitude.com/docs/amplitude-ai/specialized-agents-overview
================================================================================
# Specialized Agents Overview
Specialized Agents are purpose-built AI agents that each analyze a single domain, such as a dashboard, session replays, a website conversion flow, or customer feedback, on a recurring schedule. Each agent pushes summaries, opportunities, and recommended actions to your Agent Inbox, email, or Slack. Unlike [Global Agent](https://amplitude.com/docs/amplitude-ai/global-agent-overview), which serves as a unified entry point for exploration and ad-hoc analysis, Specialized Agents work proactively without waiting for you to ask.
## Available Specialized Agents
Amplitude offers four Specialized Agents, each tuned to a specific workflow:
- **[Dashboard Agent](https://amplitude.com/docs/amplitude-ai/dashboard-agent)**: Points at any existing Amplitude dashboard and continuously analyzes each chart for meaningful changes. It surfaces top trends, runs root-cause analyses on specific metrics, and supports natural-language follow-up questions with ad-hoc chart creation.
- **[Session Replay Agent](https://amplitude.com/docs/amplitude-ai/session-replay-agent)**: Analyzes session replays at scale across your chosen funnels or events. It identifies behavioral patterns, friction signals like rage clicks and dead clicks, and delivers actionable themes with curated playlists of the most relevant session clips.
- **[Website Conversion Agent](https://amplitude.com/docs/amplitude-ai/website-conversion-agent)**: Continuously analyzes key digital conversion flows such as signup and checkout. It identifies drop-offs and behavioral anomalies, uses session replay signals to diagnose root causes, and can initiate actions like launching experiments or creating cohorts.
- **[Customer Feedback Agent](https://amplitude.com/docs/amplitude-ai/customer-feedback-agent)**: Analyzes qualitative feedback from surveys, support tickets, and other [AI Feedback](https://amplitude.com/docs/amplitude-ai/ai-feedback) sources. It identifies themes, tracks sentiment shifts, and connects qualitative insights back to behavioral data.
## Access Specialized Agents
Find Specialized Agents under the _Agents_ tab in Amplitude. The _Agents_ tab contains:
- **Agent Inbox**: A unified, in-product inbox for all Specialized Agent activity. Review agent threads, scheduled run outputs, alerts, and generated artifacts asynchronously without monitoring agents in real time.
- **Shared Agents**: Discoverable, reusable agent instances at the organization level. Use shared agents directly or share them across teams for consistent workflows. Shared Agents follow existing Amplitude permissions, and Amplitude manages them at the organization level.
## Share agents with your team
You can share any Specialized Agent so others in your organization can view its insights and reports. There are two ways to share an agent:
- **Make it discoverable**: Set an agent as discoverable across your organization. All discoverable agent threads appear in every user's Agent Inbox on the _Agents_ overview page, so anyone in the org can see the insights and reports the agent generates.
- **Add specific users**: Add individual users to the agent. Those users see the agent's scheduled threads in their Agent Inbox and can edit the notification settings for themselves.
To share an agent, configure the sharing options when you create the agent, or update them from the Agent Inbox on an existing agent.
### Discover agents from dashboards
On any dashboard, you can see which Specialized Agents other users have created and made discoverable for that dashboard. Select an agent to view its latest insights and reports directly from the dashboard.
## How Specialized Agents work with Global Agent
Specialized Agents and Global Agent form a complementary system:
1. **Specialized Agents surface insights continuously**: Each agent monitors its domain on a schedule and delivers findings proactively.
2. **Global Agent enables exploration and action**: Use Global Agent to ask follow-up questions about what Specialized Agents find, dig deeper into specific insights, and take action like creating cohorts, launching experiments, or building dashboards.
This creates a loop from insight detection to exploration to action, shifting analytics from a reactive process to a proactive, agent-driven system.
## Admin oversight and guardrails
Specialized Agents include built-in controls for visibility and human oversight:
- **Admin visibility**: Admins can view and audit all user input and agent output across the platform.
- **Human approval for user-impacting actions**: Specialized Agents don't take action that affects your end-users without explicit human approval. When an agent recommends an action, like launching an experiment or creating a cohort, a human must approve it before Amplitude executes it.
- **Inherited access controls**: Specialized Agents assume the [Data Access Controls (DAC)](https://amplitude.com/docs/data/data-access-control) and [permissions](https://amplitude.com/docs/admin/account-management/role-based-access-controls-rbac) defined in your Amplitude org.
## Scheduling and notifications
Each Specialized Agent supports flexible notification options:
- **Email**: Add subscribers to receive scheduled reports.
- **Slack**: Connect a Slack channel to receive agent outputs.
- **Agent Inbox**: All agent activity appears in the _Agents_ tab for async review.
Set the recurring frequency, day, time, and time zone when you create or configure an agent. Scheduled agents analyze data at each run and push summaries and recommendations through your configured channels.
================================================================================
# Dashboard Agent
URL: https://amplitude.com/docs/amplitude-ai/dashboard-agent
================================================================================
# Dashboard Agent
The Dashboard Agent analyzes your Amplitude dashboards to surface the most important insights and trends for product decision-making. Select a dashboard and optionally provide custom focus instructions (like "focus on onboarding drop-off" or "emphasize mobile user behavior"). The agent analyzes every chart to identify patterns, anomalies, and executive-level takeaways. It generates a list of prioritized insights and recommendations, highlighting what changed, why it matters, and the user segments most affected.
Use the Dashboard Agent when you want automated, recurring analysis of an existing Amplitude dashboard. If you want to ask ad-hoc questions across your data without a saved dashboard, use [Global Agent](https://amplitude.com/docs/amplitude-ai/global-agent-overview) instead.
{% accordion title="Agent summary" %}
As you get started with the Dashboard Agent, keep the following in mind:
| | |
| --------------- | ----------------------------------------------------- |
| **Target user** | Product managers, marketers |
| **Requires** | Analytics (input) |
| **Tools** | Analyze Dashboard, Chart Deep Dive, General Analytics |
{% /accordion %}
## Capabilities
- **Comprehensive Dashboard Analysis**: Automatically examines all charts in a dashboard to identify trends, conversion rates, user behavior patterns, and cross-chart correlations in a single executive summary.
- **Chart Deep Dive**: Provides detailed root-cause analysis and explanations for specific charts, investigating anomalies, funnel drop-offs, and trend drivers using advanced analytics.
- **General Analytics Questions**: Creates new charts and queries event data to answer ad-hoc questions that go beyond existing dashboard content.
## Creating and configuring the agent
1. Click **Create New Agent** on the AI Agents tab.
2. Click **Dashboard Agent**.
3. Select a dashboard from the dropdown menu to start configuring your analysis. Add custom instructions to focus the analysis on specific areas of interest or provide context about what you use the dashboard for.
4. Configure how the agent sends you notifications. Set the email recipients, connect to Slack, and set the recurring report frequency.
5. After the initial analysis, ask follow-up questions like "What caused the conversion drop?" or "Investigate further" and the agent autonomously drills into the most relevant data to provide comprehensive explanations.
{% callout type="tip" heading="Agents benefit from detail" %}
The more detail you provide to the agent, the better it can return the most useful information. Ask follow up questions to help distill the best insights.
{% /callout %}
6. Optionally, schedule the agent to run automatically and proactively monitor key business metrics.
## Week-over-week comparison
When you schedule a Dashboard Agent to run on a recurring basis, it automatically compares the current run against the previous one. This comparison generates a diff that highlights:
- **New insights**: Trends, anomalies, or patterns that didn't appear in the last run.
- **Key differences**: Metrics or behaviors that changed between runs, with context on what shifted and why it matters.
- **Consistent findings**: Insights that remained stable week over week, helping you distinguish ongoing trends from one-time changes.
This comparison helps you track how your product metrics evolve over time without manually reviewing past reports.
## Limitations
The comprehensive dashboard analysis reviews existing dashboards without modifying chart configurations or date ranges. It focuses on pattern recognition and correlation identification rather than predictive modeling. This limitation doesn't apply to the chart deep dive and general analytics capabilities.
================================================================================
# Session Replay Agent
URL: https://amplitude.com/docs/amplitude-ai/session-replay-agent
================================================================================
# Session Replay Agent
The Session Replay Agent analyzes your recorded sessions to surface friction points, drop-offs, and engagement patterns tied to specific UI elements. It samples replays within a funnel or event scope, runs friction detection, navigation flow mapping, and content engagement analysis across them, then returns structured findings with highlight-reel clips and quantified impact.
Use the Session Replay Agent when you want automated, recurring analysis across many replays at once. If you want to review individual sessions yourself, watch them directly in [Session Replay](https://amplitude.com/docs/session-replay).
You need [Session Replay](https://amplitude.com/docs/session-replay) enabled on your project before this agent can run. If your project doesn't have it yet, set up Session Replay first.
{% accordion title="Agent summary" %}
As you get started with the Session Replay Agent, keep the following in mind:
| | |
| --------------- | --------------------------------------------------------------------------------------------------------------------------- |
| **Target user** | Product managers, UX Designers, Growth teams |
| **Requires** | [Session Replay](https://amplitude.com/docs/session-replay) |
| **Tools** | Session Replay Analysis, Friction Detection, Navigation Flow Analysis, Content Engagement Analysis, HTML Context Extraction |
{% /accordion %}
## Capabilities
- **Session replay insights**: Analyze replays to surface concrete, evidence-backed findings with highlight reels, UI element context, and quantified impact.
- **Multi-phase analysis**: Conducts systematic analysis through data gathering, structured analysis with specialized analyzers, insight refinement, and documentation.
- **Friction detection**: Identifies rage clicks, dead clicks, form abandonment, and other user frustration signals across your application.
- **Navigation flow mapping**: Analyzes page-to-page user journeys, drop-off points, and element-to-element interaction patterns to understand user behavior.
- **Content engagement profiling**: Measure scroll depth, dwell time, and element interactions to reveal which article structures drive copy intent.
- **Product context integration**: Automatically extracts page HTML and UI component information to provide specific, actionable recommendations tied to your actual interface elements.
## Creating and configuring the agent
1. Click **Create New Agent** on the AI Agents tab.
2. Click **Session Replay**.
3. **Agent name**: Enter a descriptive name for the agent.
4. Select one of the following to provide a scope to the agent to explore each run:
- **Funnel**: Select an existing funnel to filter available replays to those that contain the events that constitute the funnel.
- **Event**: Specify the key event or user interaction you want to analyze. For example, Add to Cart, Pricing Page Viewed, Form Submitted, or any other event in your taxonomy.
5. Optionally instruct the agent to focus on a specific user behaviors or flows. For example a new feature, a recent redesign, or users who abandon their carts.
6. Configure how the agent sends you notifications. Set the email recipients, connect to Slack, and set the recurring report frequency.
7. Click **Create Agent**. The agent begins to collect a representative sample of session replays where the event or action you selected occurs. Where possible, the agent adds relevant context like user paths, page URLs, and interaction metadata.
The agent’s advanced algorithms analyze the sessions and try to identify:
- Navigation flows and drop-off points.
- Signs of user frustration like rage clicks and repeated errors.
- Engagement with specific content or features.
- Differences between successful and unsuccessful user journeys.
When the analysis is complete, the agent returns:
1. **Structured insights**: Individual findings with titles, impact assessments, and specific UI element references.
2. **Highlight reels**: Curated session replay clips that demonstrate each identified pattern or issue.
3. **Actionable recommendations**: Specific next steps tied to actual page elements, buttons, and flows in your application.
4. **Quantified impact**: Statistical evidence showing how many sessions and what percentage of users each finding affects.
## How the agent runs
The Session Replay can operate in two modes:
### Interactive mode
Chat directly with the agent to explore specific questions about your users' behavior. The agent responds to your requests in real time, helping you investigate particular insights or explore different analytical angles as the conversation develops.
### Scheduled runs
When running on its configured schedule, the agent acts like a product manager exploring your data with fresh eyes. It automatically selects an analytical focus area within your configured funnel or event scope, choosing from different research approaches like friction detection, user journey mapping, or content engagement analysis.
This simulated product manager perspective helps surface insights you might not have thought to investigate. The agent conducts multiple rounds of in-depth analysis to uncover actionable patterns. Each scheduled run explores a different analytical angle, ensuring comprehensive coverage of potential opportunities and issues within your specified scope.
## Limitations
Session Replay analyzes recorded sessions within your retention window, so coverage depends on available replays. Some pages or elements may be missing or obfuscated, and the agent never surfaces raw session IDs or internal references. Page HTML and selectors come from sampled sessions, so they may not reflect every variant. The agent identifies patterns and correlations and works with your connected product data. Large data requests can be slow or fail, so the agent may recommend using smaller samples.
## Platform compatibility
The Session Replay Agent analyzes replay data to surface interaction insights and behavioral summaries. Its capabilities depend on the type of replay data available.
- **Web apps**: Fully supported. The agent can reliably analyze clicks, navigation, text interactions, and produce aggregate insights.
- **Mobile WebView and in-app browsers**: Supported. Session Replay captures web content rendered inside a native app shell the same way as standard web, so the agent works as expected.
- **Native mobile apps (iOS and Android)**: Not yet supported. Native mobile replays capture visual frames and raw gesture coordinates, but don't include the structured element-level data the agent needs to identify what users interacted with. You can still watch native mobile replays for qualitative review, but agent-powered analysis and aggregates aren't yet available.
================================================================================
# Customer Feedback Agent
URL: https://amplitude.com/docs/amplitude-ai/customer-feedback-agent
================================================================================
# Customer Feedback Agent
The Customer Feedback Agent finds common customer requests, bugs, complaints, and praise from your [AI Feedback](https://amplitude.com/docs/amplitude-ai/ai-feedback) sources. It reviews feedback from surveys, support tickets, and sales calls to spot key themes and changes in sentiment. By combining this feedback with user behavior data, it helps you understand user motivations and sends prioritized recommendations by email or Slack.
{% accordion title="Agent summary" %}
As you get started with the Customer Feedback Agent, keep the following in mind:
| | |
| --------------- | ----------------------------------------------------------------------------- |
| **Target user** | Product managers, customer experience teams, growth teams |
| **Requires** | [AI Feedback](https://amplitude.com/docs/amplitude-ai/ai-feedback) (at least one connected source) |
| **Tools** | Feedback Analysis, Theme Identification, Sentiment Tracking |
{% /accordion %}
## Capabilities
- **Automated feedback analysis**: Analyzes incoming qualitative feedback from connected AI Feedback sources and identifies key themes, sentiment shifts, and emerging issues without manual review.
- **Qualitative-quantitative connection**: Connects qualitative insights to behavioral data so you understand what users do and why.
- **Theme grouping**: Groups feedback into categories---feature requests, bugs, complaints, loved features, and pain points---instead of requiring you to read through hundreds of responses.
- **Prioritized recommendations**: Generates actionable, customer-informed recommendations on improvements to ship, ranked by impact and frequency.
- **Async reporting**: Delivers scheduled reports through email or Slack so you stay informed without manually checking dashboards.
## Prerequisites
The Customer Feedback Agent requires at least one connected [AI Feedback source](https://amplitude.com/docs/amplitude-ai/ai-feedback#setting-up-a-data-source). Set up your feedback sources before you create the agent.
## Create and configure the agent
1. Select **Create New Agent** on the _AI Agents_ tab.
2. Select **Customer Feedback Agent**.
3. **Agent Name**: Enter a descriptive name for the agent.
4. **Keywords**: Optionally add one or more keywords to guide the agent toward specific types of feedback insights and comments. For example, add keywords like "onboarding", "pricing", or "mobile app" to focus the agent's analysis and report on those topics.
5. Define the customer insights you want the agent to identify. Describe the types of feedback, sources, and time ranges you want the agent to monitor. For example, "top bugs from Zendesk this month" or "feature requests from support tickets in the last week."
Use a starter prompt to get started quickly:
- **Top Weekly Feedback Themes**: Surfaces the most common feedback themes each week.
- **Feature-Specific Deep Dive**: Focuses analysis on feedback about a specific feature.
- **Customer Love Stories**: Highlights positive feedback and loved features.
- **Urgent Product Bugs**: Prioritizes bug reports and critical issues.
- **Sentiment Score & Trend Analysis**: Tracks sentiment shifts and trends over time.
6. Configure how the agent sends you notifications.
- **Email**: Add subscribers by entering names or email addresses.
- **Slack**: Select a Slack channel to receive reports.
- Set the recurring report frequency, day, time, and time zone.
7. Select **Create Agent and Run Agent**.
{% callout type="tip" heading="Agents benefit from detail" %}
The more detail you provide about the feedback types and sources you care about, the more relevant the agent's insights are. Ask follow-up questions in the chat to refine the analysis.
{% /callout %}
## How the agent runs
The Customer Feedback Agent connects to your [AI Feedback](https://amplitude.com/docs/amplitude-ai/ai-feedback) sources and operates in two modes:
### Interactive mode
Chat directly with the agent to explore specific questions about your customer feedback. Ask questions like "What are the top complaints this week?" or "Show me feature requests related to onboarding" and the agent responds in real time with evidence-backed findings.
### Scheduled runs
On its configured schedule, the agent analyzes recent feedback across your connected sources and delivers a report that includes:
1. **Theme summary**: The most common feedback themes grouped into categories like feature requests, bugs, complaints, loved features, pain points, and key takeaways.
2. **Sentiment shifts**: Changes in customer sentiment compared to the previous reporting period.
3. **Emerging issues**: New or growing patterns that need attention.
4. **Actionable recommendations**: Prioritized suggestions on what to build, fix, or investigate next, based on feedback volume and customer impact.
## Limitations
The Customer Feedback Agent analyzes feedback from connected AI Feedback sources only. The quality and completeness of insights depend on the volume and variety of feedback available in your sources. The agent identifies patterns and themes from qualitative data but doesn't modify your feedback sources or AI Feedback configuration. Large volumes of feedback may take longer to process, and the agent may recommend smaller time ranges for more focused analysis.
================================================================================
# Website Conversion Agent
URL: https://amplitude.com/docs/amplitude-ai/website-conversion-agent
================================================================================
# Website Conversion Agent
{% callout type="warning" heading="Early Access" %}
The Website Conversion Agent is under active development. The quality of the proposed strategies may vary.
{% /callout %}
The Website Conversion Agent guides you through optimizing website conversion metrics by helping you select high-impact pages, define clear goals, and generate tailored experiment strategies. It streamlines the process of creating, testing, and deploying web experiments or guides, making it easy for product and growth teams to identify, implement, and measure changes that improve user engagement and business outcomes.
{% accordion title="Agent summary" %}
As you get started with the Dashboard agent, keep the following in mind:
| | |
| --------------- | ------------------------------------------------------------ |
| **Target user** | Growth/Product Managers |
| **Requires** | Analytics (input), Experiment, Guides and Surveys (optional) |
{% /accordion %}
## Requirements
- To generate recommended pages, the organization must have a target conversion event that includes a URL path property configured in the Agent Settings.
- To view the suggested variants, the target site needs the Experiments SDK or Chrome extension.
- To create an experiment, the account must have Experiments enabled.
- To create a guide, the account must have Guides and Surveys enabled.
## Create and configure the agent
1. When you create the agent, specify the conversion event that you want to optimize for. The agent uses this information to recommend pages that receive a high volume of the event you select.
2. Choose the page you want to optimize or input a custom URL in the chat.
3. The agent analyzes data captured about the page you specify and proposes strategies to increase conversion based on the event you selected in step 1.
1. Strategies can be implementations of an experiment or a guide, and the agent provides a level of confidence for each.
2. Expand each strategy for details.
3. Give feedback on the agent’s strategies by clicking **Generate New Strategies** or providing instructions in the chat.
4. Click **Explore this Strategy** to instruct the agent to develop an implementation plan.
4. If you select an Experiment Strategy:
1. The agent creates variants based on the strategy you select.
2. Review the variants. Click a variant to view an expanded summary, and open the target page to preview the variant if you have Web Experimentation enabled. If a variant isn’t relevant, remove it from the experiment.
- To iterate on a variant, click **Create New with Feedback**. Tell the agent what you want to change about the variant.
- Click **Remove** to remove a variant from the experiment.
3. When you have the variants you want to include in your experiment, click **Create draft experiment**. The agent creates a new experiment in draft.
4. To launch the experiment, view the experiment in the Experiment View and start it.
5. If you select Guide strategy:
1. The agent creates and saves a draft of the guide.
2. To deploy the guide, view the guide in the Guides and Surveys view and deploy it.
================================================================================
# Custom Agents
URL: https://amplitude.com/docs/amplitude-ai/custom-agents
================================================================================
# Custom Agents
Automate the recurring analysis you'd otherwise repeat by hand each week by building your own AI agent. You describe what the agent does, give it access to your Amplitude data and connected tools, and put it on a schedule, so it monitors releases, grooms a backlog, tracks a funnel, or summarizes customer research on its own. Product managers, analysts, and technical teams who run the same workflow again and again use Custom Agents to do that job for them.
Build a custom agent when no [Specialized Agent](https://amplitude.com/docs/amplitude-ai/specialized-agents-overview) already covers the workflow you want to repeat. For one-off questions and ad-hoc exploration, use the [Global Agent](https://amplitude.com/docs/amplitude-ai/global-agent-overview) instead.
## How Custom Agents work
A custom agent is a saved, named configuration: a set of instructions, a model, the tools it can use, and an optional schedule and delivery destination. When the agent runs, it follows your instructions against live Amplitude data plus any external tools you connect, then returns its findings in Amplitude and, if you configure it, in Slack or email.
Custom Agents sit alongside the other agents in Amplitude AI and complement them:
- **Global Agent** is the always-on chat entry point for ad-hoc exploration and one-off questions.
- **Specialized Agents** are the agents Amplitude builds and tunes for a specific job, such as the [Dashboard Agent](https://amplitude.com/docs/amplitude-ai/dashboard-agent), [Session Replay Agent](https://amplitude.com/docs/amplitude-ai/session-replay-agent), [Customer Feedback Agent](https://amplitude.com/docs/amplitude-ai/customer-feedback-agent), and [Website Conversion Agent](https://amplitude.com/docs/amplitude-ai/website-conversion-agent).
- **Custom Agents** are the agents you author yourself when no built-in agent matches the workflow you want to automate.
## Use cases
Teams across product, engineering, and go-to-market build custom agents to automate recurring work:
- **Product management**: Cluster customer feedback into themes and file ranked Jira or Linear tickets, or detect experiments that reach significance and draft a decision doc.
- **Engineering**: Run a post-deploy release health check that compares each feature's funnel, error rate, and adoption against baseline and files a regression ticket to the author, or find feature flags stuck at full rollout and file cleanup tickets to the owning team.
- **Customer success and marketing**: Flag strategic accounts with slipping engagement and alert the owner with the drop-off point, or detect newly dormant users, build the cohort, and draft a win-back campaign for approval.
## Prerequisites
- Amplitude AI enabled for your organization. Amplitude enables it by default unless your organization opted out of AI features.
- Access to the data the agent analyzes. An agent inherits your [Data Access Controls](https://amplitude.com/docs/data/data-access-control) and [permissions](https://amplitude.com/docs/admin/account-management/role-based-access-controls-rbac), so it can only use data you can already access.
- For external tools, an authorized [connector](https://amplitude.com/docs/amplitude-ai/global-agent-connectors) for each app you want the agent to use.
## How to create a custom agent
You can create a custom agent in three ways:
- **From the builder**: In Amplitude, go to *Agents*, then create a new agent and configure it from scratch.
- **From chat**: Turn a Global Agent conversation into a saved agent, or type the `/create-custom-agent` command followed by a description to generate a draft.
- **From a template**: Start from a prebuilt template in the [Agent Library](https://amplitude.com/agent-library), such as churn monitoring or feature adoption tracking, and adjust it for your workflow.
Each path produces a draft you can edit before you publish it.
## How to configure a custom agent
Open the agent in the builder to set up how it behaves:
- **Name and description**: Identify the agent and describe what it does.
- **Instructions**: Write natural-language instructions that tell the agent its goal and how to approach it. Reference Amplitude assets with an `@mention` to pull a specific chart, dashboard, or cohort into the agent's context.
- **Model**: Choose the model that powers the agent.
- **Tools and connectors**: Give the agent access to Amplitude tools and to external apps you connect through [Agent Connectors](https://amplitude.com/docs/amplitude-ai/global-agent-connectors), such as Slack, Jira, Linear, GitHub, Notion, Confluence, Granola, and Sentry. Connectors let an agent both read from and write to those tools, so it can investigate across your stack and then act, like filing a ticket or updating a doc. The builder shows only the connectors your organization authorizes, and an agent reaches only the data you can already access in each connected tool. If a connector you need isn't available, you can create a custom connector.
- **Capabilities**: Turn on the capabilities the agent needs:
- **Memory**: Carry context across runs.
- **Customer Context**: Use product and business context you provide.
- **Long Conversations**: Support extended, multi-step runs.
- **Extended Thinking**: Allow deeper reasoning on complex tasks.
The more specific your instructions and context, the more accurate and useful the agent's output. Add two or three detailed lines about the product area, goals, and metrics that matter.
{% callout type="note" heading="" %}
Connectors and the [Amplitude MCP server](https://amplitude.com/docs/amplitude-ai/amplitude-mcp) work in opposite directions: connectors let an agent query your other tools from inside Amplitude, while the MCP server lets other tools query Amplitude data. Amplitude doesn't store the data an agent reads through a connector.
{% /callout %}
## How to schedule a custom agent
Put a published agent on a recurring cadence so it runs unattended. Set the agent to run daily or weekly, and choose the day, hour, and time zone. At each run, the agent analyzes your data and pushes its summary and recommendations to the destinations you configure.
Deliver results to Slack and email under the agent's notification settings.
{% callout type="note" heading="" %}
To deliver findings to Slack, invite the `Amplitude` Slackbot to the target channel. Without it, the agent can't post to the channel.
{% /callout %}
## Share and manage agents
Amplitude creates custom agents on a per-user basis, and each agent respects your individual permissions. By default, custom agents are private to the user.
- A **draft** agent is in progress while you build and test it.
- You can share a **published** agent with your organization, so teammates can view its insights and reports.
Manage your agents from the *Agents* page, where the **All Agents** tab lists every agent you can access and the **My Agents** tab lists the ones you created. As the owner, you control the agent's schedule and configuration.
For agents that recommend actions, a human reviews and approves any change that affects end users, such as launching an experiment or creating a cohort, before Amplitude runs it. Admins can view and audit agent input and output across the organization.
================================================================================
# Agent Analytics Overview
URL: https://amplitude.com/docs/amplitude-ai/agent-analytics/overview
================================================================================
# Agent Analytics Overview
Measure and improve the AI agents you ship to your users. Agent Analytics decomposes agent traces into events, runs configurable evaluators on every interaction, and links AI session data to product event data on shared user identity. Product managers connect agent behavior to business outcomes. Engineers catch regressions before they reach production.
Because AI session data shares Amplitude user identity with product event data, you can connect agent quality to retention, conversion, and revenue. Agent quality covers topics, hallucinations, task completion, and tool errors. Pure observability tools can't make that connection, and pure product analytics tools don't measure agent quality with enough rigor.
### Use cases
- A growth PM filters sessions where the support agent failed to answer a billing question, then builds a cohort. The PM runs a retention chart to compare that cohort against users with successful sessions.
- An ML engineer ships a new system prompt, watches the task-completion evaluator drop 8 points overnight, and rolls back before the next standup.
- A finance lead breaks down LLM spend by topic and finds that returns-related sessions cost 3 times more than recommendations sessions while scoring lower on satisfaction.
- A platform team replaces weekly manual interaction sampling with automated evaluators that score every session for hallucinations, tool errors, and task completion.
- A vendor management team evaluates a third-party AI provider against the same evaluators it uses for in-house agents to compare quality on equal terms.
- A research team plugs in its own offline evaluators through `customer_enriched` mode to score sessions on custom dimensions that the default evaluators don't cover.
## How Agent Analytics works
Agent Analytics models each agent interaction as a hierarchy of events. The same user identity flows through this hierarchy and into your existing Amplitude product data, so you can analyze agent sessions alongside everything else you track.
- **Session**: One unit of work that a user hands the agent to complete from start to finish, such as a chatbot conversation, a resolved support ticket, or a completed coding task. Amplitude identifies a session with the `[Agent] Session ID` property, which you set from an ID you already track.
- **Turn**: A single back-and-forth exchange within a session: a user message, the agent's tool calls, and the AI response.
- **Span**: A sub-turn unit: a tool call, vector search, rerank, guardrail, or custom step.
- **Agent**: A named orchestration unit. Agents can have child agents.
Every user message, AI response, and tool call lands as an independent Amplitude event. This per-turn event model is the structural difference from trace-centric observability tools. You can use agent events directly in funnels, cohorts, retention charts, and Session Replay links without decomposing a trace first.
{% callout type="note" heading="Agent session vs. standard-analytics session" %}
An agent session isn't the same as Amplitude's standard-analytics session.
The agent session, `[Agent] Session ID`, is a single unit of work that the user hands to the agent. Amplitude's standard-analytics session, `$session_id`, is the user's app or web visit that powers Session Replay and product reports. For example, when you open Amplitude, you start your standard-analytics session. When you start Global Agent from within Amplitude, you start your agent session. The two are independent: a standard-analytics session can contain several agent sessions, and a single agent session can span several standard-analytics sessions. You set the agent session from your own thread, ticket, call, or run ID.
{% /callout %}
On top of this structure, Amplitude measures quality in three ways:
- **Signals**: Always-on enrichments that Amplitude runs on every session, including task completion, response quality, user friction, and safety. You don't configure them.
- **Evaluators**: Scorers you define and calibrate in the Amplitude UI for product-specific criteria, using rules or LLM-as-judge. You can also bring your own evaluators through `customer_enriched` mode.
- **Scores**: Explicit user feedback (thumbs up or down, optional comment) attached to a session or message. Scores capture reactions to the agents you build, similar to how [AI Feedback](https://amplitude.com/docs/amplitude-ai/ai-feedback) captures reactions to Amplitude's built-in AI. You send scores from your app; Amplitude doesn't generate them. To learn how, refer to [Send user feedback (scores)](https://amplitude.com/docs/sdks/agent-analytics/sdk#send-user-feedback-scores).
Instrument with the Node or Python SDK. Setup details live on the [setup page](https://amplitude.com/docs/amplitude-ai/agent-analytics/setup).
## Manage access with RBAC
Admins control who can use Agent Analytics through [role-based access control (RBAC)](https://amplitude.com/docs/admin/account-management/role-based-access-controls-rbac). Three permissions apply to Agent Analytics:
- **View Agent Analytics Objects**: View sessions, evaluators, and related objects. A role needs this permission to use Agent Analytics at all.
- **Manage Inactive Evals and Runs**: Create, update, and delete draft evaluators, and launch dry runs.
- **Activate Evals**: Mark evaluators as active and archive live evaluators.
## Get started
- [Set up Agent Analytics](https://amplitude.com/docs/amplitude-ai/agent-analytics/setup) covers choosing an instrumentation path, setting a privacy mode, and verifying your data.
- [Analyze agent results](https://amplitude.com/docs/amplitude-ai/agent-analytics/results) covers evaluators, scores, and connecting agent data to product cohorts and charts.
================================================================================
# Agent Analytics quickstart
URL: https://amplitude.com/docs/amplitude-ai/agent-analytics/quickstart
================================================================================
# Agent Analytics quickstart
Install the SDK, run one command, and your agent's traffic shows up in Amplitude in about five minutes. You need a project with Agent Analytics enabled and its API key, and nothing else. Anonymous user and session IDs are fine.
This page contains the fast installation path with limited customizations. To instrument production with full identity and privacy controls, go to [Set up Agent Analytics](https://amplitude.com/docs/amplitude-ai/agent-analytics/setup) and the [SDK reference](https://amplitude.com/docs/sdks/agent-analytics/sdk) instead.
## Install the SDK
{% tabs tabs="Node, Python" %}
{% tab name="Node" %}
```bash
npm install @amplitude/ai @amplitude/analytics-node
```
{% /tab %}
{% tab name="Python" %}
```bash
pip install amplitude-ai
```
{% /tab %}
{% /tabs %}
## Run the setup agent
Run this, paste the printed prompt into your coding assistant (Cursor, Claude Code, Windsurf, GitHub Copilot, or Codex), and approve the change it proposes.
{% tabs tabs="Node, Python" %}
{% tab name="Node" %}
```bash
npx amplitude-ai
```
{% /tab %}
{% tab name="Python" %}
```bash
amplitude-ai
```
{% /tab %}
{% /tabs %}
The agent finds every LLM call site and the session lifecycle, instruments them, and prints a dry-run report of the events and field fill rates before anything ships.
## Patch one line instead
No coding assistant handy? One call at startup monkey-patches supported provider clients (OpenAI, Anthropic, Gemini, and more), so the SDK tracks your existing LLM calls with no other code changes.
{% tabs tabs="Node, Python" %}
{% tab name="Node" %}
```typescript
import { AmplitudeAI, patch } from "@amplitude/ai";
const ai = new AmplitudeAI({ apiKey: process.env.AMPLITUDE_AI_API_KEY! });
patch({ amplitudeAI: ai });
```
{% /tab %}
{% tab name="Python" %}
```python
import os
from amplitude_ai import AmplitudeAI, patch
ai = AmplitudeAI(api_key=os.environ["AMPLITUDE_AI_API_KEY"])
patch(amplitude=ai)
```
{% /tab %}
{% /tabs %}
The patch captures basic `[Agent] AI Response` events only: enough to verify the pipeline works, not the end state.
## Watch the events arrive
Run the doctor to validate your environment variables, dependencies, and the event-pipeline connection:
```bash
npx amplitude-ai doctor
```
Then open your project's Live Events stream. `[Agent] AI Response` events appear with model, provider, latency, token, and cost fields populated. For the full verification checklist, go to [Verify your data](https://amplitude.com/docs/amplitude-ai/agent-analytics/setup#verify-your-data).
## Add IDs when you're ready
It's a ladder you climb over time, not a form you fill out on day one.
| Add | What it unlocks |
| ---------- | -------------------------------------------------------- |
| Nothing (patch only) | Basic LLM traces and aggregate call counts |
| User ID | Per-user analytics, cohorts, retention |
| Session ID | Multi-turn analysis, session enrichment, quality scores |
| Agent ID | Per-agent cost, latency, and quality dashboards |
Placeholder IDs work: events still flow, sessions still enrich, and you can swap in real identity later without re-instrumenting. For the complete breakdown, go to [What you set and what you get](https://amplitude.com/docs/sdks/agent-analytics/sdk#what-you-set-and-what-you-get) in the SDK reference.
================================================================================
# Set up Agent Analytics
URL: https://amplitude.com/docs/amplitude-ai/agent-analytics/setup
================================================================================
# Set up Agent Analytics
This page describes how to customize your Agent Analytics set up. To complete the in-depth set up, you'll need to modify your environment with the Agent Analytics SDK. The [Agent Analytics SDK](https://amplitude.com/docs/sdks/agent-analytics/sdk) is the full developer reference, covering install, initialization, instrumenting sessions and tools, provider notes, edge runtimes, OTel ingestion, cost handling, and the full API.
If you want to quickly get started with basic Agent Analytics, go to the [Agent Analytics Quickstart Guide](https://amplitude.com/docs/amplitude-ai/agent-analytics/quickstart). The quickstart guide does not allow for any customizations. You can always complete the quickstart guide to get insights as fast as possible and then come back to this set up guide to customize your Agent Analytics insights.
The timeline below shows what your instrumentation produces. Click any event to inspect its shape.
{% agent-event-timeline /%}
## How setup works
You must have previously completed the following prerequisites before data shows up in Amplitude:
1. **Your project has Agent Analytics enabled.** If it isn't, contact your CSM.
2. **You've instrumented your code.** The [Amplitude AI SDK (Node and Python)](https://amplitude.com/docs/sdks/agent-analytics/sdk) covers most stacks. Runtimes the SDK doesn't bundle into can send events directly to the HTTP API. These runtimes include Cloudflare Workers, other edges, and unsupported languages such as Java, Go, and Ruby.
3. **You've decided what leaves your app.** Privacy mode controls whether prompt and response text reaches Amplitude.
## Connect with the SDK
Use this sequence when you connect Agent Analytics from the product UI or from your IDE. Both SDKs emit the same `[Agent]` event schema.
### Install the SDK
Pick your stack:
```bash
npm install @amplitude/ai @amplitude/analytics-node
```
```bash
pip install amplitude-ai
```
### Let a coding agent instrument your app (recommended)
Run the CLI in your project root. It prints a prompt for your coding agent, scans your repo for agents and LLM call sites, and proposes instrumentation you can review before merging.
```bash
npx amplitude-ai
```
### Or wire it up by hand
Wrap your LLM client, name an agent, and run each conversation inside a session. That pattern produces every event type the product expects.
```typescript
import { AmplitudeAI, OpenAI } from '@amplitude/ai';
const ai = new AmplitudeAI({ apiKey: process.env.AMPLITUDE_AI_API_KEY });
const openai = new OpenAI({ amplitude: ai, apiKey: process.env.OPENAI_API_KEY });
const agent = ai.agent('my-agent');
const session = agent.session({ userId, sessionId });
await session.run(async (s) => {
s.trackUserMessage(message);
return openai.chat.completions.create({ model, messages });
});
await ai.flush();
```
### Send a message and verify
Run one conversation through your agent, then open the **Sessions** tab in Agent Analytics. Your first session appears within a few minutes. For field-level checks, use [Verify your data](https://amplitude.com/docs/sdks/agent-analytics/sdk#verify-your-data) in the SDK reference.
## Choose an instrumentation path
| Path | Use when | Where to go |
| ------------------------------------- | --------------------------------------------------------------------- | --------------------------------------------------------------------------------------- |
| **Amplitude AI SDK (Node or Python)** | Most stacks | [SDK reference](https://amplitude.com/docs/sdks/agent-analytics/sdk) |
| **HTTP API** | Runtimes the SDK doesn't support (Java, Go, Ruby, Cloudflare Workers) | [Instrument without the SDK](https://amplitude.com/docs/sdks/agent-analytics/sdk#instrument-without-the-sdk) |
| **OpenTelemetry** | Stacks already emitting OTel spans, or you want span-first observability | [Ingest OpenTelemetry spans](https://amplitude.com/docs/sdks/agent-analytics/sdk#ingest-opentelemetry-spans) — call `enable_otel()` / `enableOtel()` for the recommended span-first approach |
## Choose a privacy mode
| Mode | What leaves your app | Use when |
| ------------------- | ---------------------------------------------------------------- | ------------------------------------ |
| `full` (default) | Prompt and response text, with PII redaction on by default | Most products |
| `metadata_only` | Tokens, latency, model, and cost (no text) | Sensitive or regulated data |
| `customer_enriched` | Pre-scored summaries you send through `trackSessionEnrichment()` | You already have an evaluation stack |
Refer to [Choose a privacy mode](https://amplitude.com/docs/sdks/agent-analytics/sdk#choose-a-privacy-mode) for the configuration details and PII-redaction tunables.
## Verify your data
After events start arriving, your project's Live Events stream shows `[Agent] AI Response` events with `Session ID`, `Agent ID`, `Model`, `Provider`, `Latency Ms`, `Input/Output Tokens`, and `Cost USD` populated. If any of those fields are missing, walk through [Verify your data](https://amplitude.com/docs/sdks/agent-analytics/sdk#verify-your-data) in the SDK reference.
- **Local verification**: Before deploying, run `MockAmplitudeAI.summary()` to get a fill-rate report of all captured events. It checks the eight verification gates (identity, session, model, provider, latency, input tokens, output tokens, cost) and flags gaps before data reaches Amplitude.
After you confirm the data is flowing, go to [Analyze agent results](https://amplitude.com/docs/amplitude-ai/agent-analytics/results) for what Amplitude infers on top: turn-level signals, session rollups, and the evaluator results that drive the dashboards.
================================================================================
# Analyze agent results
URL: https://amplitude.com/docs/amplitude-ai/agent-analytics/results
================================================================================
# Analyze agent results
This page explains how to read the Agent Analytics UI, interpret evaluator results, and turn agent data into Amplitude cohorts. If you're new to the product, start with the [Agent Analytics overview](https://amplitude.com/docs/amplitude-ai/agent-analytics/overview). [Set up the SDK](https://amplitude.com/docs/amplitude-ai/agent-analytics/setup) to send agent data before you analyze it.
## Open Agent Analytics
Open Agent Analytics within the Amplitude app by selecting the **Agent Analytics** entry in the left navigation. The entry expands into pages for _Sessions_, _Datasets_, _Evaluators_, _Runs_, and _Monitor_. Selecting the top-level entry opens the _Monitor_ page.
Agent Analytics scopes sessions, evaluators, and overview metrics to the selected project. Choose a project to see its data.
{% callout type="note" heading="URL path" %}
The URL path uses the legacy `llm-analytics` slug, so the address bar shows a path like `/llm-analytics/<org>/sessions` even though the product name in the UI is Agent Analytics.
{% /callout %}
## Monitor agent activity
Open _Monitor_ from the Agent Analytics left navigation. Monitor is the landing page, so selecting the top-level **Agent Analytics** entry also opens it.
Monitor summarizes agent health across the selected project and time range. The page charts agent activity and session volume, session quality from the always-on [signals](#read-evaluator-results), and cost and latency trends. Use these charts to spot a shift before you open individual sessions, and apply the agent filter to focus on one agent or compare agents.
Before a project sends any agent data, Monitor shows a get-started guide for SDK setup in place of the charts.
## Browse sessions
Open _Sessions_ from the Agent Analytics left navigation. The sessions list shows every agent session in the selected time range. Use it to:
- Filter by date, agent, evaluator result, error type, or topic.
- Filter sessions by an Amplitude cohort to focus on a specific group of users.
- Filter by agent name through the URL query parameter, for example `?agents=<agent-name>`.
- Search interaction content, with the most relevant sessions first.
Filters combine, so you can narrow to sessions from one agent that failed a specific evaluator on a given day.
## Inspect a session in detail
Open any session to view the Session Detail View. The view organizes session data into five tabs:
- **Thread**: interaction view of user and AI messages. Includes Session ID.
- **Info**: session metadata including session ID, agent, model, cost, tokens, and latency.
- **Turns**: turn-by-turn breakdown, including nested tool calls and spans.
- **Evaluators**: evaluator results for the session, with pass or fail status and signals.
- **Review**: Review aspects about the session and specify review settings and labels.
The session hierarchy is _Session > Turn > Span_. Spans roll up into turns, and turns roll up into the session. Amplitude identifies a session with the `[Agent] Session ID` property.
From a session, you can:
- Select **User Activity** to open that user's event timeline. Amplitude filters the timeline to `[Agent]` events and starts it at the session.
- Select **Filter to Similar Sessions** to find sessions with similar aspects.
- Select **Add to Dataset** to include this session in a specific [dataset](#curate-datasets).
## Find similar sessions
When a session shows a problem, you can select **Suggested filters** and surface other sessions with the same pattern. Suggested filters anchor on the session you're viewing, so they work best when started from a concrete example rather than a broad search.
## Read evaluator results
Agent Analytics measures quality with two layers: Signals and Evaluators.
Signals are always-on enrichments that Amplitude runs on every closed session. You don't configure them. The default signals cover task completion, response quality, user friction, negative feedback, user intent, and session safety, plus a code-based data quality check. Amplitude refines how signals work over time, so treat them as directional indicators.
Evaluators are scorers you define and calibrate yourself for precise, product-specific criteria.
Enrichment writes results to two events in your event stream:
- `[Agent] Session Record`: one event for each session. This event carries the signal results, session rollups (total turns, total cost, and tokens), and flags such as `[Agent] Has Data Quality Issues`.
- `[Agent] Evaluator Result`: one event for each evaluator run on a session. Key properties include `[Agent] Evaluator Name`, `[Agent] Evaluator Output Type`, `[Agent] Binary Label`, `[Agent] Rationale`, `[Agent] Evidence`, and `[Agent] Evaluator Model`.
For the full list of events and their properties, go to the [Agent Analytics event taxonomy](https://amplitude.com/docs/amplitude-ai/agent-analytics/taxonomy).
These results land as queryable Amplitude events, so you can build a cohort like "users whose sessions failed task completion" with a single filter. The data quality signal is code-based (rule and pattern matching) rather than LLM-based, so the signal returns a clear "no issues found" result instead of a generated rationale.
## Create and refine custom evaluators
Signals run automatically. To measure product-specific criteria, create your own evaluators on the _Evaluators_ page, which you open from the Agent Analytics left navigation. Define an evaluator with a name, a judge prompt, and pass criteria, then test it before you activate it:
1. Create the evaluator with its judge prompt and pass criteria.
2. Run it on the [Runs page](#run-evaluators) against a sample of sessions or a saved dataset to check how it scores.
3. Review the results, then revise the judge prompt or activate the evaluator.
Evaluators support binary (true/false), classification, and score output types. Activate an evaluator to start scoring new sessions. The results land as `[Agent] Evaluator Result` events that you can query alongside the signal data.
By default, evaluators run on Amplitude-managed models. To run them on your own LLM provider instead, add your provider key in _AI Controls_.
Human reviewers improve evaluator accuracy. Reviewers label sessions and correct evaluator outputs in the review tab, and those reviewed labels build a dataset of ground truth. Rerun an evaluator against that dataset to compare how a revised prompt scores against known-good answers.
## Run evaluators
The _Runs_ page runs evaluators against a set of sessions on demand. Use the _Runs_ page to test an evaluator before you activate it, or to score sessions that predate the evaluator. Open _Runs_ from the Agent Analytics left navigation.
To start a run, select **Create Run**, choose one or more evaluators, and choose which sessions to score: a sample of recent sessions, a filtered set, or a saved dataset (a reusable set of sessions you curate on the _Datasets_ page).
While a run is in progress, the run drawer shows a live `X / N sessions` progress bar and a count of any failures. Results stream in as each session finishes, so you can read early results without waiting for the whole batch. Agent Analytics isolates a failed or timed-out session, surfaces a per-evaluator error, and completes the rest of the run. To stop a run early, select **Cancel**.
For each session in the run, the results show every evaluator's result (pass or fail, class, or score), the judge prompt that ran, the rationale, and the latency of the evaluation. Use these results to refine a judge prompt, then rerun until the output aligns with your expectations.
Each action requires a specific permission:
| Action | Required permission |
| ------------------------------------------------------------- | ---------------------------------- |
| Run evaluators on demand | **Manage Inactive Evals and Runs** |
| Activate an evaluator so it scores new sessions automatically | **Activate Evals** |
## Curate datasets
A _dataset_ is a reusable, named collection of agent sessions that you run evaluators against repeatedly. Datasets turn one-off spot checks into a regression suite. You fix a set of sessions and establish the correct answers, then rerun an evaluator against those sessions whenever you change the evaluator's prompt. Open _Datasets_ from the Agent Analytics left navigation.
Build a dataset around whatever slice of agent activity you want to track, such as sessions from one model, one product surface, or a filtered set of users. Start with a handful of representative sessions that cover your common cases and known failure modes.
Add sessions to a dataset in two ways:
- **From a session**: open the session and use the **Add to Dataset** control. Amplitude lists the datasets that match the session's agent.
- **In bulk**: select sessions on the _Sessions_ page and add them at once. A dataset holds up to 1,000 sessions, so filter to the sessions you care about first.
Open a dataset to view its sessions, read any session's thread with its evaluator results inline, remove sessions, or download the dataset as JSON.
### Establish ground truth
A dataset's value comes from its ground truth: the verified correct answer for each session. When you add a session, Amplitude snapshots the session's current evaluator results as a baseline, so you only review and correct the results that are wrong.
To review a session, open it from the dataset and change any evaluator result that's wrong, or select **Mark as correct** to confirm a result you agree with. Each session moves from _pending_ to _partial_ to _verified_ as you review its evaluators. Reviews attach to the session, so a session keeps its labels everywhere it appears, and your corrections survive when you edit the evaluator's prompt.
With ground truth in place, run an evaluator against the dataset from the [Runs page](#run-evaluators) and compare the evaluator's output to the verified answers. Comparing output to verified answers confirms that a prompt change improved the evaluator before you activate it.
## Connect agent quality to product behavior
Agent Analytics connects to the rest of Amplitude through cohorts. Cohort integration is the core differentiator over standalone agent observability tools:
1. Filter a set of sessions in Agent Analytics.
2. Create a cohort from that selection.
3. Use the cohort in any standard Amplitude chart such as funnel, retention, or segmentation.
For example, build a cohort of users whose sessions failed task completion, then chart their 30-day retention against a cohort of users whose sessions succeeded. The comparison shows whether agent quality maps to outcomes like conversion, retention, or churn.
## Query Agent Analytics from your tools
The Amplitude MCP server exposes Agent Analytics to AI tools like Claude and Cursor. Use the MCP server to query metrics, sessions, spans, and conversations, inspect the schema, manage datasets, and create, update, and list evaluators.
Go to [Amplitude MCP](https://amplitude.com/docs/amplitude-ai/amplitude-mcp) for the current tool list, setup, and authentication details.
================================================================================
# Agent Analytics taxonomy
URL: https://amplitude.com/docs/amplitude-ai/agent-analytics/taxonomy
================================================================================
# Agent Analytics taxonomy
This page is the reference for the data Agent Analytics produces: every `[Agent]` event, the properties on the enrichment events, and the default signals. To read these results in the UI, go to [Analyze agent results](https://amplitude.com/docs/amplitude-ai/agent-analytics/results). To emit the events from your code, go to the [Agent Analytics SDK](https://amplitude.com/docs/sdks/agent-analytics/sdk).
The taxonomy is configurable and still evolving during Open Beta. Treat the lists below as the default shape, and confirm the live set against your own event stream.
## Data hierarchy
Agent Analytics models each agent interaction as a hierarchy:
- **Session**: One job a user hands the agent, from start to finish. Amplitude identifies a session with the `[Agent] Session ID` property. The agent session differs from Amplitude's standard-analytics session (`$session_id`), which is the user's app or web visit.
- **Turn**: A single back-and-forth exchange within a session: a user message, the agent's tool calls, and the AI response.
- **Span**: A sub-turn step, such as a tool call, vector search, rerank, or guardrail.
Every user message, AI response, and tool call lands as an independent Amplitude event, so you can use agent data in funnels, cohorts, and retention charts without decomposing a trace first.
## Event inventory
Agent Analytics produces these events. Your SDK instrumentation produces the first seven — either through direct SDK calls or through OTEL spans when `enable_otel()` / `enableOtel()` is active (the SDK maps spans to events automatically). The server enrichment pipeline produces the rest after a session closes.
| Event | Producer | SDK method |
| ---------------------------- | --------------------------- | ---------------------------- |
| `[Agent] User Message` | SDK | `track_user_message()` |
| `[Agent] AI Response` | SDK | `track_ai_message()` |
| `[Agent] Tool Call` | SDK | `track_tool_call()` |
| `[Agent] Embedding` | SDK | `track_embedding()` |
| `[Agent] Span` | SDK | `track_span()` |
| `[Agent] Session End` | SDK | `track_session_end()` |
| `[Agent] Session Enrichment` | SDK | `track_session_enrichment()` |
| `[Agent] Session Record` | Server enrichment pipeline | Internal |
| `[Agent] Evaluator Result` | Server enrichment pipeline | Internal |
| `[Agent] Score` | SDK, or server for feedback | `score()` |
## SDK events
Your instrumentation produces these events as the agent runs. The `[Agent] AI Response` event carries the per-response model, provider, token, latency, and cost properties.
- `[Agent] User Message`: a message the user sends to the agent.
- `[Agent] AI Response`: the agent's response, with model, provider, tokens, latency, and cost.
- `[Agent] Tool Call`: a function or tool the agent invokes.
- `[Agent] Embedding`: an embedding or vector-search step.
- `[Agent] Span`: any other pipeline step, such as a rerank or guardrail.
- `[Agent] Session End`: marks the end of a session.
- `[Agent] Session Enrichment`: your own session labels, sent in `customer_enriched` privacy mode.
All SDK event properties are prefixed with `[Agent]`, except `[Amplitude] Session Replay ID`. The tables below list the properties the SDK emits, grouped by event. Optional properties are populated when the relevant data is available and the privacy mode permits it.
### Common properties
These properties can appear on any SDK event.
| Property | Type | Required | Description |
| ------------------------------- | ------- | -------- | ------------------------------------------------------------------------------------------------------------------------ |
| `[Agent] Session ID` | string | Yes | Session identifier. Every event in one agent session shares it. |
| `[Agent] Component Type` | string | Yes | Component that produced the event: `user_input`, `llm`, `tool`, or `embedding`. |
| `[Agent] SDK Version` | string | Yes | Version of the SDK that produced the event. |
| `[Agent] Runtime` | string | Yes | SDK runtime: `node` or `python`. |
| `[Agent] Trace ID` | string | No | Groups events into one turn in the trace viewer. Events without it fall back to the session ID. |
| `[Agent] Turn ID` | number | No | Monotonically increasing counter that orders events within a session. |
| `[Agent] Agent ID` | string | No | Which agent handled the interaction (for example, `support-bot`). |
| `[Agent] Parent Agent ID` | string | No | In multi-agent delegation, the agent that delegated to this one. |
| `[Agent] Customer Org ID` | string | No | Tenant organization ID for multi-tenant platforms. Enables account-level group analytics. |
| `[Agent] Agent Version` | string | No | Agent code version. Enables version-over-version quality comparison. |
| `[Agent] Agent Description` | string | No | Human-readable description of the agent's purpose. |
| `[Agent] Context` | string | No | Serialized JSON of your segmentation dimensions. Refer to [Add segmentation with context](https://amplitude.com/docs/sdks/agent-analytics/sdk#add-segmentation-with-context). |
| `[Agent] Env` | string | No | Deployment environment: `production`, `staging`, or `dev`. |
| `[Agent] Message Source` | string | No | `user` for end-user input, or `agent` for inter-agent delegation. Provider wrappers set it automatically. |
| `[Agent] Locale` | string | No | User locale, such as `en-US`. |
| `[Amplitude] Session Replay ID` | string | No | Links to Session Replay, in `device_id/session_id` form. |
### Deployment and OTEL metadata
These optional properties can appear on any SDK event when configured.
| Property | Type | Description |
| ------------------- | -------- | -------------------------------------------------------------------------------------------------------------- |
| `[Agent] Git SHA` | string | Commit SHA of the deployed build. Use for correlating agent behavior with specific deploys. |
| `[Agent] Git Ref` | string | Branch or tag name (for example, `main` or `v2.1.0`). |
| `[Agent] Git Repo` | string | Repository identifier (for example, `org/repo`). |
| `[Agent] Tags` | string[] | Custom string tags for ad-hoc grouping (for example, `["beta", "internal"]`). |
| `[Agent] Span Kind` | string | OTEL span routing hint when OTEL is enabled. Maps the span to an event type (`tool`, `llm`, `agent`, `span`). |
### `[Agent] User Message` properties
In addition to the common properties.
| Property | Type | Required | Description |
| ------------------------------------- | -------- | -------- | ---------------------------------------------------------------------------------------------------- |
| `[Agent] Message ID` | string | Yes | Unique ID for this message. Links scores and tool calls back to the message. |
| `[Agent] Is Regeneration` | boolean | No | Whether the user asked the AI to regenerate a previous response. A negative quality signal. |
| `[Agent] Is Edit` | boolean | No | Whether the user edited a previous message and resubmitted. |
| `[Agent] Edited Message ID` | string | No | The `Message ID` of the original message that was edited. |
| `[Agent] Has Attachments` | boolean | No | Whether the message includes file attachments. |
| `[Agent] Attachment Types` | string[] | No | Distinct attachment types (for example, `pdf`, `image`). |
| `[Agent] Attachment Count` | number | No | Number of attachments on the message. |
| `[Agent] Total Attachment Size Bytes` | number | No | Total size of all attachments, in bytes. |
| `[Agent] Attachments` | string | No | Serialized JSON of attachment metadata (type, name, size). Metadata only, never file content. |
| `[Agent] Message Labels` | string | No | Serialized JSON of label objects. Used for routing tags, classifier output, or business context. |
| `[Agent] Message Source` | string | No | `user` for real end-user input, or `agent` for a parent agent's instructions to a child. |
### `[Agent] AI Response` properties
In addition to the common properties.
| Property | Type | Required | Description |
| ------------------------------ | ------- | -------- | -------------------------------------------------------------------------------------------------------- |
| `[Agent] Message ID` | string | Yes | Unique ID for this response. |
| `[Agent] Model Name` | string | Yes | Model identifier (for example, `gpt-4o`, `claude-sonnet-4-20250514`). |
| `[Agent] Provider` | string | Yes | Provider name (for example, `openai`, `anthropic`, `google`, `mistral`, `bedrock`). |
| `[Agent] Latency Ms` | number | Yes | Total wall-clock latency for the call, in milliseconds. |
| `[Agent] Is Error` | boolean | Yes | Whether the response represents an error. |
| `[Agent] Error Message` | string | No | Error text when `Is Error` is true. |
| `[Agent] Error Type` | string | No | Exception class name when `Is Error` is true. Lets tooling group failures by type. |
| `[Agent] TTFB Ms` | number | No | Time to first token, in milliseconds. Measures perceived responsiveness for streaming. |
| `[Agent] Input Tokens` | number | No | Prompt tokens consumed. Cache-inclusive (refer to [Manage cost and tokens](https://amplitude.com/docs/sdks/agent-analytics/sdk#manage-cost-and-tokens)). |
| `[Agent] Output Tokens` | number | No | Completion tokens generated. |
| `[Agent] Total Tokens` | number | No | Input plus output tokens. |
| `[Agent] Reasoning Tokens` | number | No | Tokens spent on reasoning or thinking (o1, o3, extended-thinking models). |
| `[Agent] Cache Read Tokens` | number | No | Input tokens served from the provider's prompt cache, at a cheaper rate. |
| `[Agent] Cache Creation Tokens`| number | No | Input tokens that created new prompt-cache entries. |
| `[Agent] Cost USD` | number | No | Estimated cost in USD. Cache-aware when cache token counts are provided. |
| `[Agent] Finish Reason` | string | No | Why the model stopped: `stop`, `end_turn`, `tool_use`, `length`, `content_filter`, and so on. |
| `[Agent] Is Streaming` | boolean | No | Whether the response streamed. |
| `[Agent] Model Tier` | string | No | Auto-inferred tier: `fast`, `standard`, or `reasoning`. |
| `[Agent] Was Cached` | boolean | No | Whether the response was served from a semantic or full-response cache. |
| `[Agent] Was Copied` | boolean | No | Whether the user copied the response. An implicit positive quality signal. |
| `[Agent] Has Reasoning` | boolean | No | Whether the response included reasoning content. |
| `[Agent] Reasoning Content` | string | No | The reasoning content, when available and the privacy mode permits. |
| `[Agent] System Prompt` | string | No | The system prompt used, when the privacy mode permits. |
| `[Agent] System Prompt Length` | number | No | Character length of the system prompt. |
| `[Agent] Tool Calls` | string | No | Serialized JSON of tool-call requests the AI made in this response. |
| `[Agent] Tool Definitions` | string | No | Normalized JSON of the tool definitions sent to the LLM, when the privacy mode permits. |
| `[Agent] Tool Definitions Count`| number | No | Number of tool definitions in the request. |
| `[Agent] Tool Definitions Hash`| string | No | Stable hash of the tool definitions. Always present; enables toolset-change detection without exposing schemas. |
| `[Agent] Temperature` | number | No | Temperature parameter used for the call. |
| `[Agent] Max Output Tokens` | number | No | Maximum output tokens configured for the call. |
| `[Agent] Top P` | number | No | Top-p (nucleus sampling) parameter used for the call. |
| `[Agent] Prompt ID` | string | No | Identifier for the prompt template or version used. |
| `[Agent] Message Labels` | string | No | Serialized JSON of label objects attached to the response. |
### `[Agent] Tool Call` properties
In addition to the common properties.
| Property | Type | Required | Description |
| ----------------------- | ------- | -------- | --------------------------------------------------------------------------------------------------------------------- |
| `[Agent] Invocation ID` | string | Yes | Unique ID for this tool invocation. Links tool calls to parent messages. |
| `[Agent] Tool Name` | string | Yes | Name of the tool that was invoked (for example, `search_docs`). |
| `[Agent] Tool Success` | boolean | Yes | Whether the tool call completed successfully. |
| `[Agent] Latency Ms` | number | Yes | Total wall-clock latency for the call, in milliseconds. |
| `[Agent] Is Error` | boolean | Yes | Whether the call represents an error. |
| `[Agent] Tool Type` | string | No | Origin of the tool: `python` (native in-process), `mcp` (served by a connected MCP server), `flow` (sub-agent delegation), or `unknown`. |
| `[Agent] Tool Owner` | string | No | Who owns the tool: `amplitude` (Amplitude-built or operated) or `customer` (a server the customer connected). |
| `[Agent] Tool Input` | string | No | Serialized JSON of the tool's input arguments. Sent only in `full` privacy mode. |
| `[Agent] Tool Output` | string | No | Serialized JSON of the tool's return value. Sent only in `full` privacy mode. |
| `[Agent] Parent Message ID` | string | No | The `Message ID` of the user message that triggered the tool call. |
### `[Agent] Embedding` properties
In addition to the common properties.
| Property | Type | Required | Description |
| ------------------------------ | ------ | -------- | ------------------------------------------------------------------------------------ |
| `[Agent] Span ID` | string | Yes | Unique ID for the embedding operation. |
| `[Agent] Model Name` | string | Yes | Embedding model identifier. |
| `[Agent] Provider` | string | Yes | Provider name. |
| `[Agent] Latency Ms` | number | Yes | Wall-clock latency for the operation, in milliseconds. |
| `[Agent] Input Tokens` | number | No | Input tokens processed by the embedding model. |
| `[Agent] Embedding Dimensions` | number | No | Dimensionality of the output vector. |
| `[Agent] Cost USD` | number | No | Estimated cost in USD. Auto-calculated from input tokens; pass a value to override. |
### `[Agent] Span` properties
In addition to the common properties.
| Property | Type | Required | Description |
| ----------------------- | ------- | -------- | ---------------------------------------------------------------------------- |
| `[Agent] Span ID` | string | Yes | Unique ID for the span. |
| `[Agent] Span Name` | string | Yes | Name of the operation (for example, `rag_pipeline`, `vector_search`). |
| `[Agent] Latency Ms` | number | Yes | Wall-clock latency for the span, in milliseconds. |
| `[Agent] Is Error` | boolean | Yes | Whether the span represents an error. |
| `[Agent] Parent Span ID`| string | No | Span ID of the parent span, for nested pipeline steps. |
| `[Agent] Input State` | string | No | Serialized JSON of the span's input state. Sent only in `full` privacy mode. |
| `[Agent] Output State` | string | No | Serialized JSON of the span's output state. Sent only in `full` privacy mode.|
### `[Agent] Session End` properties
In addition to the common properties.
| Property | Type | Description |
| ------------------------------------- | ------ | -------------------------------------------------------------------------------------------------------- |
| `[Agent] Abandonment Turn` | number | Turn ID of the last user message that got a response before the user left. Low values signal early drop-off. |
| `[Agent] Session Idle Timeout Minutes`| number | The session's idle timeout. Tells the server how long to wait before auto-closing the session. |
| `[Agent] Enrichments` | string | Serialized JSON of any enrichments provided at session close. |
### `[Agent] Session Enrichment` properties
Sent in `customer_enriched` privacy mode. In addition to the common properties.
| Property | Type | Required | Description |
| --------------------- | ------ | -------- | ------------------------------------------------------------------------------------------------------------ |
| `[Agent] Enrichments` | string | Yes | Serialized JSON of your session enrichments: outcome, quality and sentiment scores, flags, and message labels. |
### `[Agent] Score` properties
`[Agent] Score` carries explicit user feedback. In addition to the common properties.
| Property | Type | Required | Description |
| --------------------------- | ------ | -------- | ---------------------------------------------------------------------------- |
| `[Agent] Score Name` | string | Yes | Name of the score (for example, `user-feedback`). |
| `[Agent] Score Value` | number | Yes | Numeric value: binary (0/1), continuous (0.0–1.0), or a rating scale. |
| `[Agent] Target ID` | string | Yes | The `Message ID` or `Session ID` being scored. |
| `[Agent] Target Type` | string | Yes | What is being scored: `message` or `session`. |
| `[Agent] Evaluation Source` | string | Yes | Source of the score. For SDK feedback this is `user` or `reviewer`. |
| `[Agent] Comment` | string | No | Optional text explanation. Respects the privacy mode. |
## Event JSON examples
These examples show what the SDK sends to Amplitude. Property names and the `$llm_message` content shape are the same whether you use the SDK or [send events directly](https://amplitude.com/docs/sdks/agent-analytics/sdk#instrument-without-the-sdk).
```json
{
"event_type": "[Agent] AI Response",
"user_id": "user-42",
"event_properties": {
"[Agent] Session ID": "sess-abc123",
"[Agent] Trace ID": "trace-def456",
"[Agent] Turn ID": 2,
"[Agent] Message ID": "msg-789xyz",
"[Agent] Model Name": "gpt-4o",
"[Agent] Provider": "openai",
"[Agent] Model Tier": "standard",
"[Agent] Latency Ms": 1203,
"[Agent] Input Tokens": 150,
"[Agent] Output Tokens": 847,
"[Agent] Total Tokens": 997,
"[Agent] Cost USD": 0.0042,
"[Agent] Is Error": false,
"[Agent] Finish Reason": "stop",
"[Agent] Component Type": "llm",
"[Agent] Agent ID": "support-bot",
"[Agent] Env": "production",
"[Agent] SDK Version": "1.0.0",
"[Agent] Runtime": "node"
}
}
```
```json
{
"event_type": "[Agent] User Message",
"user_id": "user-42",
"event_properties": {
"[Agent] Session ID": "sess-abc123",
"[Agent] Turn ID": 1,
"[Agent] Message ID": "msg-123abc",
"[Agent] Component Type": "user_input",
"[Agent] Agent ID": "support-bot",
"[Agent] SDK Version": "1.0.0",
"[Agent] Runtime": "node",
"$llm_message": { "text": "How do I reset my password?" }
}
}
```
```json
{
"event_type": "[Agent] Tool Call",
"user_id": "user-42",
"event_properties": {
"[Agent] Session ID": "sess-abc123",
"[Agent] Turn ID": 3,
"[Agent] Invocation ID": "inv-456def",
"[Agent] Tool Name": "search_knowledge_base",
"[Agent] Tool Success": true,
"[Agent] Is Error": false,
"[Agent] Latency Ms": 340,
"[Agent] Component Type": "tool",
"[Agent] Agent ID": "support-bot",
"[Agent] SDK Version": "1.0.0",
"[Agent] Runtime": "node"
}
}
```
```json
{
"event_type": "[Agent] Score",
"user_id": "user-42",
"event_properties": {
"[Agent] Score Name": "thumbs-up",
"[Agent] Score Value": 1,
"[Agent] Target ID": "msg-789xyz",
"[Agent] Target Type": "message",
"[Agent] Evaluation Source": "user",
"[Agent] Session ID": "sess-abc123",
"[Agent] Agent ID": "support-bot",
"[Agent] SDK Version": "1.0.0",
"[Agent] Runtime": "node"
}
}
```
## Server enrichment events
After a session closes, the enrichment pipeline assesses it and writes two events back to your event stream.
### Session Record
`[Agent] Session Record` lands once per session. It carries the session rollups, the always-on signal results, and quality flags.
| Property | Type | Description |
| --------------------------------- | -------- | -------------------------------------------------------------------------------------- |
| `[Agent] Turn Count` | number | Number of turns in the session. |
| `[Agent] Session Total Tokens` | number | Total LLM tokens across all turns. |
| `[Agent] Session Avg Latency Ms` | number | Average AI response latency in milliseconds across the session. |
| `[Agent] Models Used` | string[] | The LLM models used in the session. |
| `[Agent] Has Negative Feedback` | boolean | Whether the user expressed dissatisfaction during the session. |
| `[Agent] Has Technical Failure` | boolean | Whether technical errors occurred, such as tool timeouts or API failures. |
| `[Agent] Technical Error Count` | number | Count of technical errors in the session. |
| `[Agent] Has Data Quality Issues` | boolean | Whether the AI output had data quality problems, such as wrong data or hallucinations. |
| `[Agent] Root Agent Name` | string | The entry-point agent in a multi-agent flow. |
| `[Agent] Agent Chain Depth` | number | Number of agents in the delegation chain. |
### Evaluator Result
`[Agent] Evaluator Result` lands once per evaluator per session. It is the unified event for every server-side evaluation: signal detectors, topic classifiers, and rubric scorers.
| Property | Type | Description |
| --------------------------- | ------- | ---------------------------------------------------------------------- |
| `[Agent] Evaluator Name` | string | The evaluator that produced this result. For topic classifications, this is the topic model name, such as `product_area`. |
| `[Agent] Evaluator Output Type` | string | The result shape: `binary`, `classification`, or `score`. |
| `[Agent] Binary Label` | boolean | For binary evaluators, whether the condition was detected. |
| `[Agent] Primary Label` | string | For classification evaluators, the primary label assigned. |
| `[Agent] Selection Mode` | string | Whether the topic model assigns a `single` label (MECE) or `multiple`. |
| `[Agent] Rationale` | string | The model's explanation for the result. |
| `[Agent] Evidence` | string | Supporting evidence the model cited. |
| `[Agent] Evaluator Model` | string | The LLM that ran the evaluation. |
| `[Agent] Evaluation Source` | string | Where the evaluation came from: `ai`, `user`, or `reviewer`. |
| `[Agent] Evaluator Version` | string | The evaluator config version that produced this result. |
| `[Agent] Evaluated At` | number | Epoch milliseconds when the result was computed. |
## User feedback scores
`[Agent] Score` records explicit user feedback, such as a thumbs up or down on a response. Scores come from your application through the SDK's `score()` method, not from the enrichment pipeline. To send scores, go to [Send user feedback (scores)](https://amplitude.com/docs/sdks/agent-analytics/sdk#send-user-feedback-scores).
## Signals
Signals are the default, always-on evaluators that Amplitude runs on every closed session. They land as `[Agent] Evaluator Result` events. You don't configure them, and Amplitude refines them over time, so treat them as directional.
| Signal | Output | What it measures |
| ---------------- | ------------------ | ----------------------------------------------------------------------------------------------------- |
| Task completion | binary | Whether the agent completed the user's task. |
| Response quality | score (0.0 to 1.0) | Whether responses were accurate and well-formed. |
| User friction | binary | Whether the user expressed dissatisfaction. |
| User intent | classification | The user's intent for the session. |
| Session safety | classification | Classifies the session as `Normal`, `Off Topic`, `Prompt Injection`, `Abuse`, `Probing`, `Unsafe Output`, or `Data Leak`. |
| Data quality | code-based check | Flags wrong data or hallucination patterns. Returns a clear result rather than a generated rationale. |
## Topics and custom evaluators
Beyond the default signals, you define your own topic models and evaluators. The enrichment taxonomy is fully configurable: topic model names such as `query_intent` and `product_area`, and evaluator names such as `task_completion`, come from configuration and differ per project. To create and refine your own evaluators, go to [Create and refine custom evaluators](https://amplitude.com/docs/amplitude-ai/agent-analytics/results#create-and-refine-custom-evaluators).
{% callout type="note" heading="Deprecated events" %}
`[Agent] Topic Classification` is deprecated. Topic classifications now land as `[Agent] Evaluator Result` events with an output type of `classification`. Rubric scores also moved off `[Agent] Score` onto `[Agent] Evaluator Result` with an output type of `score`. `[Agent] Score` now carries user feedback only.
{% /callout %}
================================================================================
# Amplitude MCP Server
URL: https://amplitude.com/docs/amplitude-ai/amplitude-mcp
================================================================================
# Amplitude MCP Server
Amplitude MCP exposes Amplitude analytics, taxonomy, and content as tools that an AI client (Cursor, Claude, ChatGPT, Codex, Gemini, and others) can call over OAuth. It reads and writes charts, dashboards, experiments, cohorts, events, and properties from natural-language prompts, so you query and edit product data without SQL or the Amplitude UI. Setup takes about two minutes per client.
Use Amplitude MCP when you want an AI client to read and modify Amplitude content with your account permissions. For read-only access to Amplitude's public documentation, use the Docs MCP server instead. For production event ingestion, use an Amplitude SDK or the HTTP V2 API. Amplitude MCP isn't an ingestion endpoint.
Any existing Amplitude customer can use Amplitude MCP from an MCP-capable client such as Cursor, Claude Code, ChatGPT, Lovable, or Kiro.
The [official MCP servers registry](https://github.com/modelcontextprotocol/servers) on GitHub lists the Amplitude MCP server. You can also find MCP integration guides and examples in [Anthropic's Claude documentation](https://docs.anthropic.com/en/docs/build-with-claude/mcp), the [MCP quickstart resources](https://github.com/modelcontextprotocol/quickstart-resources), and [Cursor's MCP documentation](https://docs.cursor.com/context/model-context-protocol).
## What the MCP is for
Use the Amplitude MCP for these jobs:
- Search and read Amplitude content: charts, dashboards, notebooks, experiments, cohorts, events, and properties.
- Query analytics, run ad-hoc segmentation, funnels, and retention, and analyze experiment results.
- Manage taxonomy: events, properties, transformations, group types, and tracking-plan branches.
- Create and edit objects: charts, dashboards, notebooks, experiments, cohorts, feature flags, and metrics.
Don't use the Amplitude MCP for these jobs:
- Sending production or high-volume event data. The MCP isn't an ingestion endpoint. Emit events with an [Amplitude SDK](https://amplitude.com/docs/sdks) or the [HTTP V2 API](https://amplitude.com/docs/apis/analytics/http-v2). The `create_events` tool registers event definitions in the tracking plan; it doesn't stream event data.
- Reading public documentation in an AI client. Use the read-only [Docs MCP server](https://amplitude.com/docs/amplitude-ai/docs-mcp-server) instead.
### Choose an interface for AI agents
When you build an AI agent that integrates with Amplitude, match each job to the right interface:
| Job | Use | Why |
| ----------------------------------------------------------------- | ---------------------------------------------------------------- | ------------------------------------------------------------------- |
| Emit event data (production or high volume) | [SDK](https://amplitude.com/docs/sdks) or [HTTP V2 API](https://amplitude.com/docs/apis/analytics/http-v2) | The ingestion path. The MCP doesn't ingest events. |
| Validate taxonomy, projects, and queries | Amplitude MCP | Read, search, query, and tracking-plan tools. |
| Create or edit objects (dashboards, experiments, cohorts, charts) | Amplitude MCP tools, or [REST APIs](https://amplitude.com/docs/apis) in automation | MCP for conversational workflows, REST APIs for scripted pipelines. |
| Read public docs in an AI client | [Docs MCP server](https://amplitude.com/docs/amplitude-ai/docs-mcp-server) | Read-only and unauthenticated. |
| Anything the interfaces above don't cover | Browser UI | Use the Amplitude UI for the remaining gaps. |
## AI Context and reference files
When an MCP client calls `get_amplitude_context` with a project ID, the response includes your organization and project markdown AI Context text from [AI Controls](https://amplitude.com/docs/amplitude-ai/ai-controls). Call this tool at the start of a session so the client applies your metric definitions, terminology, and business rules to later queries.
AI Context has two configuration surfaces:
- **Text instructions**: Markdown you enter in AI Controls. Amplitude MCP returns org and project text when you call `get_amplitude_context` with a project ID.
- **Uploaded reference files**: Documents and spreadsheets you upload in AI Controls. These supplement in-product Agents with detailed reference material. Amplitude MCP tools don't return uploaded file contents. Put rules and definitions the client needs in text instructions instead.
For repo-local instrumentation conventions, add an optional `.amplitude/instrumentation-agent-context.md` file at your repository root. [Amplitude MCP marketplace skills](https://amplitude.com/docs/amplitude-ai/amplitude-mcp#plugins) such as `instrument-events` read this file during instrumentation workflows. This file is separate from AI Controls context.
Configure AI Context in [AI Context](https://amplitude.com/docs/amplitude-ai/ai-context) and [AI Controls](https://amplitude.com/docs/amplitude-ai/ai-controls).
## Tracking plan changes
Amplitude MCP exposes tools to read and write your project's tracking plan taxonomy. Create and update calls require the **Use MCP (write)** RBAC action.
**Read tools**: `get_events`, `get_properties`, `get_branches`, and related taxonomy tools in the tool roster below.
**Write tools**:
- `create_events`: Create events or add ingested unexpected events to the plan.
- `create_properties`: Create event, user, or group properties.
- `create_custom_event`: Create custom events composed of source events.
- `update_event`, `update_properties`, `update_custom_or_labeled_events`: Update event and property metadata.
- Branch workflow: `create_branch`, `update_branch`, `merge_branch`, `delete_branch`, and `refresh_branch`.
These tools modify tracking plan definitions in Amplitude Data. They don't send production event data. For the UI-based workflow, refer to [Create a tracking plan](https://amplitude.com/docs/data/create-tracking-plan).
## Remote server
## Regions
| Region | MCP Server URL |
| ------------------------------ | ---------------------------------- |
| United States Server (Default) | `https://mcp.amplitude.com/mcp` |
| EU Residency Server | `https://mcp.eu.amplitude.com/mcp` |
Use the Standard Server URL unless your Amplitude data resides in the EU region.
## Available tools and capabilities
The Amplitude MCP provides comprehensive access to your analytics through these tools:
{% accordion title="Available tools" %}
**Discovery and context**
| Tool Name | Description |
| ----------------------- | ------------------------------------------------------------------------------------------------------------------------------------------------------------------------------------------------- |
| `search` | Search for charts, dashboards, notebooks, experiments, events, properties, cohorts, and other Amplitude content. |
| `get_from_url` | Retrieve the full object definition from any Amplitude URL, including charts, dashboards, and experiments. |
| `get_amplitude_context` | Get the current user, organization, and accessible projects. Call it with a project ID to get that project's settings instead, including time zone, currency, session definition, and AI context. |
| `get_workspace_context` | Get settings information about a Data project or portfolio. |
**Content retrieval**
| Tool Name | Description |
| ------------------- | --------------------------------------------------------------------------------------- |
| `get_charts` | Retrieve full chart definitions by ID, including events, properties, and configuration. |
| `get_dashboard` | Retrieve dashboards and all their charts, including chart IDs for individual queries. |
| `get_cohorts` | Retrieve cohort definitions by ID, including audience criteria and metadata. |
| `get_experiments` | Retrieve experiments by ID with state, variant configuration, and decision details. |
| `get_users` | Retrieve user data from a project. |
| `get_flags` | Retrieve feature flag definitions by ID, including variants and configuration. |
| `get_deployments` | Retrieve all deployments (API keys for flags and experiments) for a project. |
| `get_agent_results` | Retrieve results from AI agents that analyzed your dashboards or session replays. |
**Taxonomy: Events and properties**
These tools read and update the events, properties, custom and labeled events, transformations, and group types in your tracking plan.
| Tool Name | Description |
| --------------------------------- | ------------------------------------------------------------------------------------------------------------------------------------------- |
| `get_events` | Retrieve events from a project, with filtering by event type, a result limit, and cursor pagination. |
| `get_properties` | Retrieve properties from a project's taxonomy. Use `propertyType` to select event, user, group, derived, or other property kinds. |
| `update_properties` | Update a property's description, category, name, or official status. Use `propertyType` to select the kind of property to update. |
| `get_custom_or_labeled_events` | Retrieve custom events, labeled (autotrack) events, or both, with optional filtering by ID or name, a result limit, and pagination. |
| `update_custom_or_labeled_events` | Update the description, category, name, official status, or definition (source events and filters) of custom or labeled events. |
| `update_event` | Update an event's metadata, including its name, description, category, and official status. |
| `get_transformations` | Retrieve data transformations from a project. Transformations clean data by merging events, merging properties, or mapping property values. |
| `get_group_types` | List a project's group types, the categories of groups, such as Company, Team, or Account. |
**Session Replay**
| Tool Name | Description |
| --------------------------- | ---------------------------------------------------------------------------------------- |
| `get_session_replays` | Search for session replays from the last 30 days, filtered by user properties or events. |
| `list_session_replays` | List session replays with simple time-range pagination. |
| `get_session_replay_events` | Retrieve processed interaction timelines from a session replay recording. |
**Query and analysis**
| Tool Name | Description |
| ---------------------- | --------------------------------------------------------------------------------------------------------------------------------- |
| `query_chart` | Query a single chart by ID and return its data. |
| `query_charts` | Query up to three charts concurrently by ID and return their data. |
| `query_amplitude_data` | Execute ad-hoc analytics queries for event segmentation, funnels, retention, and more using a two-mode discover/execute workflow. |
| `query_experiment` | Query experiment analysis data, including variant performance and statistical significance. |
| `render_chart` | Render a visual, interactive Amplitude chart from a query definition and return a chart edit URL. |
**Creation**
| Tool Name | Description |
| --------------------- | ------------------------------------------------------------------------------------------- |
| `save_chart_edits` | Save edits to existing charts or convert temporary chart edits into permanent saved charts. |
| `create_dashboard` | Create dashboards with charts, rich text, and custom layouts. |
| `create_notebook` | Create interactive notebooks with charts, rich text, and multi-column layouts. |
| `create_experiment` | Create A/B test experiments across one or more projects with custom variants and metrics. |
| `create_cohort` | Create cohorts based on user properties and behaviors. |
| `create_flags` | Create multiple feature flags in batch. |
| `create_metric` | Create reusable metrics (KPIs) for use in experiments or dashboards. |
| `create_events` | Create new events or add ingested unexpected events to a project's tracking plan. |
| `create_custom_event` | Create a custom event composed of one or more source events with optional filters. |
| `create_properties` | Create event, user, or group properties in a project's tracking plan. |
**Cohort sync**
| Tool Name | Description |
| ------------------------------ | ----------------------------------------------------------------------------------------------------------------------------------------------------------------- |
| `get_cohort_sync_destinations` | List cohort sync destinations configured for a project. |
| `get_cohort_syncs` | List cohort syncs and their destination, cadence, and status. |
| `get_cohort_sync_history` | Retrieve sync history for a cohort sync, including added, removed, and skipped users. |
| `sync_cohort` | Trigger a one-time cohort sync to a destination such as Braze, Iterable, S3, or a webhook. The tool previews the export and asks for confirmation before sending. |
**Taxonomy: Branches**
| Tool Name | Description |
| ---------------- | ------------------------------------------------------------------------------ |
| `get_branches` | List all branches in a project's tracking plan, including the main branch. |
| `create_branch` | Create a new branch in a project's tracking plan, forked from the main branch. |
| `update_branch` | Update the description of a branch in a project's tracking plan. |
| `refresh_branch` | Pull the latest changes from main into a feature branch. |
| `merge_branch` | Merge a branch into the main branch. |
| `delete_branch` | Permanently delete a branch and all its uncommitted tracking plan changes. |
**Editing and updates**
| Tool Name | Description |
| ------------------- | ---------------------------------------------------------------------------------------------------------------------------------------------------------------------------------------- |
| `edit_dashboard` | Edit an existing dashboard's metadata (title, description) and layout (add charts, remove charts, reorder sections) with optimistic concurrency protection to prevent conflicting edits. |
| `edit_notebook` | Edit an existing notebook's metadata (title, description) and layout (add or remove charts, text blocks, and other content sections) with optimistic concurrency protection. |
| `update_experiment` | Set or replace metrics on an experiment. |
| `update_flag` | Update a feature flag or experiment's metadata, variants, testers, and deployments. |
**Guides and Surveys**
| Tool Name | Description |
| --------------------- | ----------------------------------------------------------------------------------------------------------------------------------------------------------------------------- |
| `list_guides_surveys` | List guides and surveys in a project, with filters by type, platform, creator, date range, and archived status. Returns status, priority, and creator metadata for each item. |
| `get_guide_or_survey` | Retrieve full details for a single guide or survey by ID, including status, priority, variants, step content, page targeting rules, and trigger configuration. |
**Feedback**
| Tool Name | Description |
| ---------------------------- | -------------------------------------------------------------------------------------------------------------------------------------------------------------------------------------------------------------------------------------------------------------- |
| `use_amplitude_ai_feedback` | Query and analyze customer feedback from connected sources. Retrieves processed themes grouped by type (feature requests, bugs, complaints, praise, and pain points), raw comments with search and pagination, individual comments associated with a specific insight, connected feedback integrations and their source IDs, and saved customer feedback trends tracked over time. |
**Agent analytics**
| Tool Name | Description |
| -------------------------------------- | -------------------------------------------------------------------------------------------------------------------------- |
| `query_agent_analytics_metrics` | Aggregate quality, cost, performance, error, and trend metrics across AI agent sessions. |
| `query_agent_analytics_sessions` | List and filter AI agent sessions by quality, cost, sentiment, user, topic, or agent with optional `groupBy` aggregation. |
| `query_agent_analytics_spans` | Inspect individual operations (LLM calls, tool invocations) within AI agent traces for latency and error analysis. |
| `get_agent_analytics_conversation` | Retrieve the full conversation transcript for an AI agent session. |
| `search_agent_analytics_conversations` | Full-text search across AI agent conversation content for specific keywords or topics. |
| `get_agent_analytics_schema` | Discover available fields, rubric definitions, and filter values (agent names, tools, topics) for agent analytics queries. |
{% /accordion %}
## Progressive tool discovery
If you connect to Amplitude MCP manually and want to reduce token spend, add `?discovery=progressive` to the MCP URL to enable progressive tool discovery.
**Progressive URLs (copy/paste):**
- US: `https://mcp.amplitude.com/mcp?discovery=progressive`.
- EU: `https://mcp.eu.amplitude.com/mcp?discovery=progressive`.
In this mode, the initial tool list is intentionally small. The server discovers tools on demand, and all supported tools remain callable after discovery.
Use this workflow:
1. Call `get_amplitude_context` to confirm organization and project access.
2. Call `list_tool_categories` to see available product surfaces.
3. Call `get_category_tools` with a category name to discover tools in that surface.
4. Call `describe_tool` for any tool you plan to call so you have the latest schema and required parameters.
5. Call the tool directly once you confirm the schema.
{% callout type="note" %}
In progressive mode, `tools/list` returns discovery tools plus `get_amplitude_context` first. Use category discovery and `describe_tool` to find schemas before calling specific tools.
{% /callout %}
### Example progressive discovery flow
Use this sequence in your MCP client conversation:
1. "Run `get_amplitude_context` and pick the right project."
2. "Run `list_tool_categories` and show which categories are available."
3. "For the `analytics` category, run `get_category_tools`."
4. "For `query_chart`, run `describe_tool` and then call it with valid parameters."
## Connect Amplitude MCP to your AI client
Select your client to open its setup guide.
{% card-grid columns="3" %}
{% card kind="quickstart-link" title="Claude Code" href="https://amplitude.com/docs/amplitude-ai/amplitude-mcp/claude-code" icon="anthropic" tone="blue" %}
Terminal-based AI workflow with Claude Code CLI.
{% /card %}
{% card kind="quickstart-link" title="Cursor" href="https://amplitude.com/docs/amplitude-ai/amplitude-mcp/cursor" icon="cursor" tone="blue" %}
AI panel inside the Cursor editor, with one-click install available.
{% /card %}
{% card kind="quickstart-link" title="ChatGPT" href="https://amplitude.com/docs/amplitude-ai/amplitude-mcp/chatgpt" icon="openai" tone="blue" %}
Browser or desktop ChatGPT with developer mode.
{% /card %}
{% card kind="quickstart-link" title="Claude" href="https://amplitude.com/docs/amplitude-ai/amplitude-mcp/claude" icon="claude" tone="blue" %}
Claude.ai web or desktop app using a custom connector.
{% /card %}
{% card kind="quickstart-link" title="Gemini CLI" href="https://amplitude.com/docs/amplitude-ai/amplitude-mcp/gemini-cli" icon="googlegemini" tone="blue" %}
Google Gemini CLI terminal workflow.
{% /card %}
{% card kind="quickstart-link" title="Replit" href="https://amplitude.com/docs/amplitude-ai/amplitude-mcp/replit" icon="replit" tone="blue" %}
Replit workspace AI, with one-click install available.
{% /card %}
{% card kind="quickstart-link" title="Lovable" href="https://amplitude.com/docs/amplitude-ai/amplitude-mcp/lovable" icon="lovable" tone="blue" %}
Lovable AI chat for product builders.
{% /card %}
{% card kind="quickstart-link" title="Figma Make" href="https://amplitude.com/docs/amplitude-ai/amplitude-mcp/figma-make" icon="figma" tone="blue" %}
Figma Make connector for design workflows.
{% /card %}
{% card kind="quickstart-link" title="Kiro" href="https://amplitude.com/docs/amplitude-ai/amplitude-mcp/kiro" icon="kiro" tone="blue" %}
Kiro IDE with user or workspace scope.
{% /card %}
{% card kind="quickstart-link" title="Codex CLI" href="https://amplitude.com/docs/amplitude-ai/amplitude-mcp/codex-cli" icon="codex" tone="blue" %}
OpenAI Codex CLI terminal workflow.
{% /card %}
{% card kind="quickstart-link" title="Other clients" href="https://amplitude.com/docs/amplitude-ai/amplitude-mcp/other-clients" icon="⌁" tone="neutral" %}
Any MCP-compatible client that supports HTTP and OAuth.
{% /card %}
{% /card-grid %}
## Query examples
### Analytics and charts
> What were the daily active users over the last 7 days?
> Show signup conversion rates by traffic source this month.
> Create a chart showing weekly active users broken down by platform.
> Why did this metric spike last week? [paste chart URL]
### Dashboards and notebooks
> Build an executive dashboard for our product launch.
> Summarize this dashboard for my exec meeting. [paste dashboard URL]
> Add a retention chart to the KPI dashboard.
> Remove the DAU chart from the overview dashboard.
> Update the title of the KPI notebook to "Q2 Growth Metrics".
> Move the funnel chart to the top of the onboarding dashboard and add a section header above it.
### Experiments and feature flags
> Create an experiment to test the new checkout flow with a 50/50 split.
> Should we ship the new onboarding experiment? Analyze the results.
> Check on all running experiments and flag anything stale or missing metrics.
> Create a feature flag for the redesigned settings page.
### Session Replay and debugging
> Show me session replays where users rage-clicked on the checkout page.
> A user reported a bug on the billing page. Find their session and walk me through what happened.
> Audit the onboarding flow for UX friction using session replays.
### Feedback and opportunities
> What are the top customer complaints this month?
> How has feedback about the mobile app trended over the last 90 days?
> Find me the biggest product opportunities. Where are we losing users?
### AI agent analytics
> How are our AI agents performing? Show quality, cost, and error rates.
> What topics are users asking the AI assistant about?
> Investigate the low-quality AI sessions from yesterday. What went wrong?
### Taxonomy and tracking plan
> What branches exist in my project?
> Create a branch called "q3-cleanup" for tracking plan changes.
> Create an event called "Checkout Started" on the q3-cleanup branch.
> Add unexpected events "app_opened" and "checkout_completed" to the tracking plan.
> Create a user property called "plan_type" for my project.
> Merge the q3-cleanup branch into main.
### Guides and Surveys
> What are the published guides with the highest priority in my project?
> Which guides are live on the pricing page right now?
> Show me the full targeting and trigger configuration for guide 15731.
### Users, cohorts, and metrics
> Create a cohort of power users who completed 10+ sessions in the last 30 days.
> Create a "revenue per user" metric for the checkout experiment.
> Compare user behavior between converters and drop-offs in the onboarding flow.
> Sync my "High-intent buyers" cohort to Iterable.
## Typical workflows
### Analysis workflow
Most analysis questions follow this pattern:
1. **Search**: Find relevant charts, dashboards, or experiments.
2. **Retrieve**: Get full definitions and metadata.
3. **Query**: Execute data queries and return results.
4. **Analyze**: Ask follow-up questions and dive deeper.
Example conversation:
> **You:** Why did weekly active users drop last Tuesday?
> **AI:** [Searches for WAU charts, queries the data, identifies the drop]
> **AI:** Looks like WAU dropped 12% on Tuesday. Let me check if any experiments or deployments landed that day.
> **AI:** [Cross-references deployments and experiment launches]
> **AI:** A deployment shipped Monday evening that changed the session timeout. That likely caused the drop.
> **You:** Show me session replays from affected users.
> **AI:** [Finds replays, extracts interaction timelines, summarizes friction patterns]
### Creation and editing workflow
You can create and edit Amplitude content directly through conversation:
1. **Create**: Build new charts, dashboards, notebooks, experiments, cohorts, flags, or metrics.
2. **Configure**: Specify parameters and settings conversationally.
3. **Refine**: Edit and adjust layouts, metrics, or variants. For dashboards and notebooks, use `edit_dashboard` or `edit_notebook` to add or remove charts, reorder content, and update metadata.
4. **Deploy**: Save and use the content in Amplitude.
Example conversation:
> **You:** Set up an A/B test for the new pricing page.
> **AI:** [Creates a "revenue per user" metric and a "checkout completion" guardrail metric]
> **AI:** [Creates the experiment with control and variant, attaches both metrics]
> **You:** Add the product team as testers so they can preview it.
> **AI:** [Updates the flag with testers for the variant]
> **You:** Build a dashboard so we can monitor results.
> **AI:** [Creates a dashboard with experiment results, conversion funnel, and revenue charts]
## Plugins
The [Amplitude MCP Marketplace](https://github.com/amplitude/mcp-marketplace/tree/main) is the official open-source plugin repository for Amplitude MCP. It provides a curated set of reusable skills, agents, and commands that extend what you can do with the Amplitude MCP server in Claude Code, Cursor, Claude, and Codex.
### Install the plugin
```bash
# Add the Amplitude marketplace (one-time)
/plugin marketplace add amplitude/mcp-marketplace
# Install the plugin
/plugin install amplitude@amplitude
```
### Available skills
The skills table uses seven areas: core analytics, product insights, session replay and debugging, AI agent analytics, analytics instrumentation, briefings, and bonus.
#### Core analytics
| Skill | Description |
| --------------------- | ---------------------------------------------------------------------------------------------------------------------------- |
| **create-chart** | Create Amplitude charts from natural language, with automatic event discovery, filters, groupings, and visualization. |
| **create-dashboard** | Build dashboards from requirements or goals, organizing charts into logical sections with appropriate layouts. |
| **analyze-chart** | Analyze a specific chart in depth to explain trends, anomalies, and likely drivers. |
| **analyze-dashboard** | Synthesize an entire dashboard into talking points, surface concerns, and connect quantitative data to qualitative insights. |
#### Product insights
| Skill | Description |
| -------------------------- | --------------------------------------------------------------------------------------------------------- |
| **analyze-experiment** | Design A/B tests, monitor running experiments, and interpret results with statistical rigor. |
| **monitor-experiments** | Triage all active and recently completed experiments by importance. |
| **analyze-feedback** | Synthesize customer feedback into grouped themes such as feature requests, bugs, pain points, and praise. |
| **analyze-account-health** | Summarize B2B account health with usage patterns, risk signals, and expansion opportunities. |
| **discover-opportunities** | Find product opportunities by cross-referencing analytics, experiments, replays, and feedback. |
| **compare-user-journeys** | Compare two user groups side-by-side to surface behavioral differences. |
#### Session Replay and debugging
| Skill | Description |
| ----------------------- | ----------------------------------------------------------------------------------------------------------------- |
| **debug-replay** | Turn bug reports into numbered reproduction steps by extracting the interaction timeline from Session Replay. |
| **replay-ux-audit** | Watch multiple session replays for a flow and synthesize a ranked friction map. |
| **diagnose-errors** | Triage product issues across network failures, JavaScript errors, and error clicks. |
| **monitor-reliability** | Generate a proactive reliability report from auto-captured error data so issues surface before users report them. |
#### AI agent analytics
| Skill | Description |
| -------------------------- | ------------------------------------------------------------------------------------------------------------- |
| **analyze-ai-topics** | Analyze what users ask AI agents about and how well each topic is answered. |
| **investigate-ai-session** | Deep-dive specific AI agent sessions or failure patterns for root-cause analysis. |
| **monitor-ai-quality** | Deliver a proactive health report on AI agents covering quality, cost, performance, and errors. |
| **review-agent-insights** | Retrieve, synthesize, and prioritize all recent AI agent results across agent types into a unified narrative. |
#### Analytics instrumentation
| Skill | Description |
| --------------------------------- | ---------------------------------------------------------------------------------------------------------- |
| **diff-intake** | Read a PR or branch diff and output a structured change brief for analytics planning. |
| **discover-event-surfaces** | List candidate analytics events from a change brief for PM prioritization. |
| **discover-analytics-patterns** | Map how analytics is already implemented in the codebase (SDK calls, naming, imports). |
| **instrument-events** | Build a concrete instrumentation plan and JSON tracking plan from prioritized event candidates. |
| **add-analytics-instrumentation** | End-to-end workflow: read code, decide what to track, and produce a full instrumentation plan in one pass. |
A typical flow runs `diff-intake` → `discover-event-surfaces` → `instrument-events`, with `discover-analytics-patterns` to align new tracking with existing conventions.
#### Briefings
| Skill | Description |
| ---------------- | ------------------------------------------------------------------------------ |
| **daily-brief** | Morning briefing of the most important changes across your Amplitude instance. |
| **weekly-brief** | Weekly recap of trends, wins, and risks to share with your team or leadership. |
#### Bonus
| Skill | Description |
| ----------------------- | ------------------------------------------------------------------------------------------------------------------ |
| **taxonomy** | Generate, validate, audit, and score event tracking plans, naming conventions, and data governance best practices. |
| **what-would-lenny-do** | Answer product strategy questions by searching Lenny Rachitsky's archive (requires `lennysdata` MCP server). |
Skills activate automatically based on your request. For example, asking "Why did this metric spike last week?" triggers the `analyze-chart` skill, and asking "Summarize this dashboard for my exec meeting" triggers `analyze-dashboard`.
## Security and compliance
### Data access
- The MCP server uses your existing Amplitude user permissions and access controls.
- You can only access Amplitude projects and data that you already have permission to view in your regular Amplitude account.
- You receive no additional data access beyond your current Amplitude account privileges.
- OAuth authentication ensures secure connection between the MCP server and your Amplitude account.
### Privacy considerations
The AI service you're using (for example, Claude or Gemini) processes your Amplitude data. Review your organization's policies regarding AI-powered data analysis tools and consider compliance requirements (General Data Protection Regulation, California Consumer Privacy Act).
Third parties (for example, Anthropic) develop and maintain the AI models used with this MCP server. Amplitude isn't responsible for model outputs, including hallucinations, inaccuracies, or errors resulting from model behavior, even if such outputs use your Amplitude data.
### Admin controls
Amplitude enables MCP server access **by default** for all users in your organization. Organization administrators can opt out or restrict access if needed:
1. Navigate to _Settings > Content Access > MCP_ in your Amplitude organization settings.
2. Use the content access controls to allow or block the Amplitude MCP server.
3. Access restrictions apply to all MCP clients across all users in your organization.
{% callout type="note" %}
MCP access controls are an admin-only setting. Individual users can't override organization-level MCP restrictions.
{% /callout %}
### Scope MCP access with roles
For finer-grained control than the org-level toggle, two RBAC actions govern what the MCP server can do on a per-project basis: **Use MCP (read)** (`USE_MCP_READ`) and **Use MCP (write)** (`USE_MCP_WRITE`). Assign these actions to a role, then attach the role to users, groups, or service accounts to scope exactly what an agent can read from or write to.
- **Project-level control**: restrict a role to read-only or no access on specific projects. An agent running as that user can't write to, or even read from, projects where the role doesn't grant the action.
- **Groups and service accounts**: the same actions apply to permission groups and to Amplitude MCP service accounts, so team-wide policies and automated agent workflows get the same controls as individual users.
- **Mixed access**: within a single session, a tool call such as `get_events` succeeds for a project where your role grants read access and fails for a project where it doesn't.
- **Applies to everyone**: these actions override admin status. If a role doesn't grant the action, MCP calls fail even for an org administrator.
- **Enabled by default**: existing roles already include these actions. Every role grants read access, and the Member, Manager, and Admin roles also grant write access, so nothing changes until an admin adjusts a role.
To scope MCP access with a role:
1. In _Org Settings > Role Management_, create or edit a role.
2. In the **AI Features** category, enable **Use MCP (read)** and **Use MCP (write)**.
3. Assign the role to a user, group, or service account, scoped to the relevant projects.
Amplitude enforces these actions on each MCP tool call, project by project. The tool list stays visible to all clients, so a call to a tool the role doesn't permit fails at call time rather than disappearing from the list.
## Troubleshooting
### Common issues
**Authentication and OAuth issues**
- Ensure your Amplitude account has proper project access.
- Check that you have logged into the correct Amplitude account.
- Make sure you're only logged into one Amplitude organization during the OAuth flow. Logging into multiple organizations can cause authentication issues.
- Try disconnecting the MCP connection and re-authenticating through the OAuth flow.
- Try logging out of Amplitude, then reconnecting.
- Desktop apps may require restart after configuration changes.
- Authorization page may appear to spin indefinitely (close tab after authentication).
**Missing data**
- Verify you have access to the specific Amplitude project.
- Check if the data exists in your Amplitude interface.
- Ensure proper permissions for the requested data.
**Chart query issues**
- AI platforms may truncate some large charts.
- Querying charts from dashboards may use default chart settings instead of saved dashboard filters.
**MCP client issues**
- **Cursor tool call failures**: If MCP tool calls fail in Cursor, this is often due to expired or corrupted authentication tokens. Open the Command Palette (`Cmd+Shift+P` on Mac, `Ctrl+Shift+P` on Windows/Linux), type and select "Clear All MCP Tokens," then re-authenticate with your accounts.
- **Token limit errors**: If you receive token limit exceeded errors, try starting a new conversation thread or increase the maximum token limit in your MCP client settings.
- **Connection timeouts**: If queries are timing out, try breaking down complex requests into smaller, more focused questions.
- **Tool loading failures**: If tools aren't loading, restart your MCP client application and re-authenticate.
### Getting help
If you encounter issues not covered here:
1. Verify your setup matches the configuration examples.
2. Test with a simple query like "What Amplitude projects are accessible?"
3. Check that your Amplitude account has the necessary permissions.
4. Contact your Amplitude administrator for organization-specific setup help.
## Send feedback
Amplitude is constantly improving the Amplitude MCP server and would appreciate hearing from you. Share your feedback, suggestions, or report issues using this [feedback form](https://docs.google.com/forms/d/e/1FAIpQLSeFgRd8607Y2Gzidva5ChEri2tk7wvl7vofUIwxcM_2aD2Nqw/viewform?usp=header).
## Technical specifications
**Transport Type:** Streaming HTTP (Remote).
**Authentication:** OAuth 2.0 with Amplitude.
================================================================================
# Common Amplitude MCP tasks
URL: https://amplitude.com/docs/amplitude-ai/amplitude-mcp/common-tasks
================================================================================
# Common Amplitude MCP tasks
After you [connect the Amplitude MCP server](https://amplitude.com/docs/amplitude-ai/amplitude-mcp) to your AI client, you drive it with natural language and rarely name tools yourself. This page maps common jobs to the prompt to ask and the tools the server runs to answer, so you can confirm the server supports a task and phrase your request well.
For the complete list, refer to [Available tools and capabilities](https://amplitude.com/docs/amplitude-ai/amplitude-mcp#available-tools-and-capabilities).
{% callout type="note" %}
You describe the goal in plain language and your client picks the tools. The tool names in the **Tools it uses** column tell you which specific tools are running. This lets you verify results or ask for a specific tool.
{% /callout %}
## Look up users and their activity
| Goal | Ask something like | Tools it uses |
| ---- | ------------------ | ------------- |
| Find a specific user's recent events | "What has user `12345` done in the last 7 days?" | `get_users`, `query_amplitude_data` |
| Look up a user's profile and properties | "Show the user properties for user `12345`." | `get_users` |
| Compare two groups of users | "Compare converters and drop-offs in the onboarding flow." | `query_amplitude_data`, `create_cohort` |
## Inspect events and properties
| Goal | Ask something like | Tools it uses |
| ---- | ------------------ | ------------- |
| Understand an event's properties and the values they take | "List the properties on `Checkout Started` and the values `plan_type` takes." | `get_events`, `get_properties`, `query_amplitude_data` |
| Find an event or property by name | "Which events mention 'checkout'?" | `search`, `get_events`, `get_properties` |
| Review custom events and transformations | "Show the custom events that merge signup events." | `get_custom_or_labeled_events`, `get_transformations`, `get_group_types` |
| Document or rename taxonomy | "Set the description of `plan_type` to 'Subscription tier'." | `update_properties`, `update_event`, `update_custom_or_labeled_events` |
## Analyze data
| Goal | Ask something like | Tools it uses |
| ---- | ------------------ | ------------- |
| Answer an ad-hoc question (segmentation, funnel, retention) | "Show signup conversion by traffic source this month." | `query_amplitude_data`, `render_chart` |
| Read an existing chart or dashboard | "Summarize this dashboard for my exec meeting. [dashboard URL]" | `get_from_url`, `get_dashboard`, `get_charts`, `query_charts` |
| Investigate a spike or drop | "Why did weekly active users drop last Tuesday?" | `query_amplitude_data`, `get_deployments`, `get_experiments` |
| Analyze an experiment | "Should we ship the checkout experiment? Analyze the results." | `get_experiments`, `query_experiment` |
## Watch session replays
| Goal | Ask something like | Tools it uses |
| ---- | ------------------ | ------------- |
| Find replays for a behavior or page | "Show replays where users rage-clicked on the checkout page." | `get_session_replays`, `list_session_replays` |
| Reproduce a reported bug | "Find this user's session and walk me through what happened." | `get_session_replays`, `get_session_replay_events` |
## Create and edit content
| Goal | Ask something like | Tools it uses |
| ---- | ------------------ | ------------- |
| Build a chart, dashboard, or notebook | "Build an executive dashboard for our product launch." | `create_dashboard`, `create_notebook`, `render_chart`, `save_chart_edits` |
| Edit an existing dashboard or notebook | "Add a retention chart to the KPI dashboard." | `edit_dashboard`, `edit_notebook` |
| Create an experiment or feature flag | "Create a 50/50 experiment for the new checkout flow." | `create_experiment`, `create_flags`, `create_metric`, `update_flag` |
| Build a cohort and sync it | "Create a power-users cohort and sync it to Iterable." | `create_cohort`, `get_cohort_sync_destinations`, `sync_cohort` |
## Manage tracking-plan branches
| Goal | Ask something like | Tools it uses |
| ---- | ------------------ | ------------- |
| Make taxonomy changes on a branch | "Create a branch `q3-cleanup` and add a `Checkout Started` event." | `get_branches`, `create_branch`, `create_events`, `create_properties` |
| Ship or discard branch changes | "Merge `q3-cleanup` into main." | `refresh_branch`, `merge_branch`, `delete_branch` |
For the full set of read and write taxonomy tools and the RBAC action write calls require, refer to [Tracking plan changes](https://amplitude.com/docs/amplitude-ai/amplitude-mcp#tracking-plan-changes).
## Review customer feedback
| Goal | Ask something like | Tools it uses |
| ---- | ------------------ | ------------- |
| Summarize what customers are asking for | "What are the top customer complaints this month?" | `get_feedback_insights`, `get_feedback_mentions` |
| Track a theme over time | "How has feedback about the mobile app trended over the last 90 days?" | `get_feedback_trends`, `get_feedback_sources` |
## Analyze AI agent performance
| Goal | Ask something like | Tools it uses |
| ---- | ------------------ | ------------- |
| Measure agent quality, cost, and errors | "How are our AI agents performing? Show quality, cost, and error rates." | `query_agent_analytics_metrics`, `query_agent_analytics_sessions` |
| Investigate a bad agent session | "Investigate the low-quality AI sessions from yesterday." | `query_agent_analytics_spans`, `get_agent_analytics_conversation`, `search_agent_analytics_conversations` |
## When to use something else
The Amplitude MCP server reads and edits Amplitude content with your account permissions. Some jobs belong to a different surface:
- **Connect your own external tools or a third-party MCP server to an Amplitude agent**: use [Custom Agents](https://amplitude.com/docs/amplitude-ai/custom-agents) and Agent Connectors, not the Amplitude MCP server.
- **Chat with AI about your data inside Amplitude, with no client setup**: use the [Global Agent](https://amplitude.com/docs/amplitude-ai/global-agent-overview) or the [Dashboard Agent](https://amplitude.com/docs/amplitude-ai/dashboard-agent).
- **Send event data**: use an [Amplitude SDK](https://amplitude.com/docs/sdks) or the [HTTP V2 API](https://amplitude.com/docs/apis/analytics/http-v2). The MCP server isn't an ingestion endpoint.
- **Read Amplitude's public documentation from an AI client**: use the read-only [Docs MCP server](https://amplitude.com/docs/amplitude-ai/docs-mcp-server).
{% callout type="note" %}
Not sure a tool exists or what it needs? In your client, ask "What Amplitude MCP tools are available for _[job]_?" or turn on [progressive tool discovery](https://amplitude.com/docs/amplitude-ai/amplitude-mcp#progressive-tool-discovery) to browse tool categories and inspect each tool's parameters before you call it.
{% /callout %}
================================================================================
# Guides and Surveys MCP tools
URL: https://amplitude.com/docs/amplitude-ai/guides-surveys-mcp
================================================================================
# Guides and Surveys MCP tools
The [Amplitude MCP server](https://amplitude.com/docs/amplitude-ai/amplitude-mcp) provides two tools for working with Guides and Surveys. Connect the server from ChatGPT, Claude, Cursor, or another MCP client to discover, review, and analyze your guides and surveys with natural language.
These tools return structured Guides and Surveys configuration, including published state, priority, targeting, triggers, and step content. The general-purpose `search` tool can still find guides and surveys, but `list_guides_surveys` and `get_guide_or_survey` expose the same concepts you manage in the Amplitude UI.
## Available tools
| Tool | Description |
| --------------------- | ---------------------------------------------------------------------------------------------------------------------------------------------------------------------------- |
| `list_guides_surveys` | List guides and surveys in a project, with filters by type, platform, creator, date range, and archived status. Each result includes status, priority, and creator metadata. |
| `get_guide_or_survey` | Retrieve full details for a single guide or survey by ID, including status, priority, variants, step content, targeting rules, and trigger configuration. |
## list_guides_surveys
Use `list_guides_surveys` to discover and compare guides and surveys across a project. This tool is best for overview and summary questions: what is live, what is scheduled, and what is in an experiment.
### Parameters
| Parameter | Type | Required | Description |
| ----------------- | ----------------- | -------- | ----------------------------------------------------------------------------------------------------------------------------------------------------- |
| `projectId` | string | Yes | The project ID (appId) to list guides and surveys for. |
| `types` | array | No | Filter by type. Accepts `"GUIDE"`, `"SURVEY"`, or both. Defaults to both. |
| `platform` | string | No | Filter by target platform: `web`, `ios`, `android`, `react-native`, `desktop`, or `flutter`. The `web` value also matches items with no platform set. |
| `createdAfter` | string (ISO 8601) | No | Lower bound on creation timestamp (inclusive). |
| `createdBefore` | string (ISO 8601) | No | Upper bound on creation timestamp (inclusive). |
| `createdBy` | string | No | Filter by the email or login ID of the user who created the item. |
| `includeArchived` | boolean | No | Include archived items. Defaults to `false`. |
| `limit` | integer | No | Number of items per page. Defaults to 50, maximum 200. |
| `cursor` | string | No | Pagination cursor from a previous response's `nextCursor`. Omit for the first page. |
### Response fields
Each item in the response includes metadata you can filter or rank in your prompt:
| Field | Description |
| ----------- | ----------------------------------------------------------------------------------------- |
| `status` | Lifecycle state: `draft`, `testing`, `published`, or `scheduled`. |
| `priority` | Relative importance when multiple experiences are eligible: Urgent, High, Medium, or Low. |
| `createdBy` | Email or login ID of the user who created the item. |
| `title` | Display name of the guide or survey. |
| `type` | `GUIDE` or `SURVEY`. |
Priority determines which experience displays when more than one guide or survey is eligible on the same page. Refer to [Setup and target](https://amplitude.com/docs/guides-and-surveys/setup-and-target#priority) for how Amplitude resolves priority ties.
### Example prompts
> What are the published guides with the highest priority in my project?
> What guides and surveys are currently live?
> Which surveys are running on iOS?
> Show me all guides created by alice@example.com in Q1 2025.
> List all archived surveys.
## get_guide_or_survey
Use `get_guide_or_survey` to deep-dive into a single guide or survey after finding it with `list_guides_surveys`. This tool returns the full configuration: status, priority, variant configurations, step content, page targeting rules, trigger settings, and rollout state.
### Parameters
| Parameter | Type | Required | Description |
| ----------- | ------ | -------- | ------------------------------------------------------ |
| `projectId` | string | Yes | The project ID (appId) the guide or survey belongs to. |
| `nudgeId` | string | Yes | The ID of the guide or survey to retrieve. |
### Example prompts
> Show me the full configuration for guide 15731.
> Is the onboarding survey live or scheduled?
> What pages does this guide target?
> What steps does this product tour include?
> Can users snooze or dismiss this guide?
## Common workflows
### Audit active nudges
List all published and experiment-running guides and surveys to review what users are seeing:
> List all non-archived guides and surveys in project 574019.
> Which guides are in an experiment right now?
### Review targeting and content before a launch
After finding an item with `list_guides_surveys`, use `get_guide_or_survey` to verify its targeting rules and step content before publishing:
> Show me the page targeting and trigger configuration for survey 101.
> What copy appears in each step of guide 15728?
### Platform-specific audits
Filter by platform to review mobile or web experiences separately:
> What iOS surveys are currently published?
> Which web guides were created in the last 30 days?
## Connect the MCP server
To use these tools, connect the Amplitude MCP server to your AI editor. Refer to [Amplitude MCP Server](https://amplitude.com/docs/amplitude-ai/amplitude-mcp) for setup instructions.
================================================================================
# How to connect Amplitude MCP to Claude Code
URL: https://amplitude.com/docs/amplitude-ai/amplitude-mcp/claude-code
================================================================================
# How to connect Amplitude MCP to Claude Code
Connect Amplitude MCP to Claude Code so you can ask questions about your product data, such as funnels, cohorts, and experiments, directly from your terminal. Setup uses OAuth and takes about two minutes; no API keys to manage. Use this when you want to analyze Amplitude data without leaving your development environment.
Use Claude Code if you prefer terminal-based AI workflows. If you want browser-based chat instead, use the [Claude connector](https://amplitude.com/docs/amplitude-ai/amplitude-mcp/claude) for claude.ai.
You need an active Amplitude account with project access and Claude Code installed.
## How do I install Amplitude MCP in Claude Code?
For general MCP setup reference, refer to the [Claude Code MCP documentation](https://docs.anthropic.com/en/docs/claude-code/mcp).
1. Add the MCP server globally:
```shell
claude mcp add -t http -s user Amplitude "https://mcp.amplitude.com/mcp"
```
EU customers should use `https://mcp.eu.amplitude.com/mcp` instead.
2. Start Claude Code:
```shell
claude
```
3. Open the MCP menu:
```shell
/mcp
```
4. Follow the Amplitude OAuth authentication flow.
## How do I verify the connection works?
Ask Claude Code: "What Amplitude projects can I access?" If you see a list of your projects, MCP is connected and authenticated.
## Frequently asked questions
### How do I switch Amplitude MCP from the US server to EU residency?
Run the install command again with the EU URL:
```shell
claude mcp add -t http -s user Amplitude "https://mcp.eu.amplitude.com/mcp"
```
This overwrites the existing server entry. Re-authenticate when prompted.
### What permissions does the Amplitude MCP server have?
The MCP server inherits the Amplitude permissions of the user who authenticates. You can only read or modify projects you already have access to in Amplitude. Amplitude grants no additional access.
### What does the `-s user` flag do?
The `-s user` scope registers the MCP server globally for your user account, so it's available in every Claude Code session without per-project configuration. Use `-s local` instead to scope it to a single project directory.
================================================================================
# How to connect Amplitude MCP to Cursor
URL: https://amplitude.com/docs/amplitude-ai/amplitude-mcp/cursor
================================================================================
# How to connect Amplitude MCP to Cursor
Connect Amplitude MCP to Cursor so you can ask questions about your product data, such as funnels, cohorts, and experiments, directly from the AI panel in your editor. Setup uses OAuth and takes about two minutes, with no API keys to manage. Use this when you want to analyze Amplitude data in the same surface where you're writing code.
Use the one-click deep link if you want the fastest setup. Use the manual JSON config if you need MCP configuration checked into a shared `mcp.json` for your team.
You need an active Amplitude account with project access and Cursor installed.
## How do I install Amplitude MCP in Cursor with one click?
For general MCP setup reference, refer to [Cursor's MCP documentation](https://docs.cursor.com/context/model-context-protocol).
Select the link for your region to install in one step:
- **US server (default):** [Install Amplitude MCP in Cursor](cursor://anysphere.cursor-deeplink/mcp/install?name=Amplitude&config=eyJ1cmwiOiJodHRwczovL21jcC5hbXBsaXR1ZGUuY29tL21jcCJ9)
- **EU server:** [Install Amplitude MCP in Cursor (EU)](cursor://anysphere.cursor-deeplink/mcp/install?name=Amplitude&config=eyJ1cmwiOiJodHRwczovL21jcC5ldS5hbXBsaXR1ZGUuY29tL21jcCJ9)
After clicking, return to the _Tools & Integrations_ tab in Cursor Settings and authenticate with Amplitude.
## How do I configure Amplitude MCP in Cursor manually?
1. Open Cursor Settings: _Cursor > Settings… > Cursor Settings_.
2. Navigate to _Tools & Integrations > New MCP Server_.
3. Add this configuration to your `mcp.json`:
```json
{
"mcpServers": {
"Amplitude": {
"url": "https://mcp.amplitude.com/mcp",
"transport": "streamable-http"
}
}
}
```
EU customers should use `https://mcp.eu.amplitude.com/mcp` instead.
4. Return to the _Tools & Integrations_ tab and authenticate with Amplitude.
## How do I verify the connection works?
Ask Cursor's AI: "What Amplitude projects can I access?" If you see a list of your projects, MCP is connected and authenticated.
## Frequently asked questions
### How do I switch Amplitude MCP from the US server to EU residency?
Replace `https://mcp.amplitude.com/mcp` with `https://mcp.eu.amplitude.com/mcp` in your `mcp.json` and re-authenticate in the _Tools & Integrations_ tab.
### Why are my Amplitude MCP tool calls failing in Cursor?
Expired or corrupted authentication tokens usually cause this. Open the Command Palette (`Cmd+Shift+P` on Mac, `Ctrl+Shift+P` on Windows/Linux), type and select "Clear All MCP Tokens," then re-authenticate with Amplitude.
### What permissions does the Amplitude MCP server have?
The MCP server inherits the Amplitude permissions of the user who authenticates. You can only read or modify projects you already have access to in Amplitude. Amplitude grants no additional access.
================================================================================
# How to connect Amplitude MCP to ChatGPT
URL: https://amplitude.com/docs/amplitude-ai/amplitude-mcp/chatgpt
================================================================================
# How to connect Amplitude MCP to ChatGPT
Connect Amplitude MCP to ChatGPT so you can ask questions about your product data, such as funnels, cohorts, and experiments, without leaving the ChatGPT interface. Setup uses OAuth and takes about two minutes. Use this when you want conversational access to Amplitude data from ChatGPT.
Use ChatGPT if you prefer an AI assistant interface in the browser or desktop app. If you want Amplitude MCP inside a code editor instead, use the [Cursor connector](https://amplitude.com/docs/amplitude-ai/amplitude-mcp/cursor).
You need an active Amplitude account with project access and a ChatGPT account on an eligible plan with developer mode access.
## How do I connect Amplitude MCP in ChatGPT?
For general MCP setup reference, refer to the [OpenAI remote MCP documentation](https://platform.openai.com/docs/guides/tools-remote-mcp).
ChatGPT [developer mode](https://platform.openai.com/docs/guides/developer-mode) supports full Model Context Protocol client access for read and write operations. OpenAI documents developer mode as a beta feature for eligible ChatGPT plans.
1. Navigate to [ChatGPT](https://chatgpt.com/) or open the ChatGPT desktop app.
2. Go to _Settings > Apps & Connectors > Browse Connectors_.
3. Select Amplitude, then select **Connect** to start the OAuth connection.
4. Complete Amplitude OAuth authorization when prompted.
5. For best results, create a ChatGPT project specifically for Amplitude and add this system prompt to its instructions:
```text
When using Amplitude MCP, follow these rules then act quickly and autonomously:
- Use tools to find answers: If you need info (events, properties, chart definitions, cohorts), use tools to discover it rather than asking the user. Trust the Amplitude MCP tools provide access to actual data behind charts, dashboards, and other entities. Always attempt using tools before saying they don't exist.
- Try NOT to ask clarifying questions: Make your best judgment with information available but sparingly elicit clarification from users
- Resolve ambiguity yourself: When multiple options exist (e.g., which project to use, which saved chart or event matches best, how to define a segment), choose the most reasonable option based on tool results and context. Search saved charts, metrics, and other data before creating something new.
- When responding to requests that involve Amplitude objects (charts, dashboards, or any entity), don't stop at referencing IDs and metadata. Retrieve underlying data, run analysis based on it, then share specific metrics as part of your analysis.
- Complete the request: Execute the workflow requested, proactively share relevant data when analyzing, don't stop partway to ask for confirmation, then provide data-backed, actionable, and concise answers.
- Report what you did: After completing the task, briefly explain key assumptions or data used
- Cite your sources: When referencing data from Amplitude, include the link as part of the markdown response (()[])
```
6. Start asking questions about your Amplitude data.
## How do I verify the connection works?
Ask ChatGPT: "What Amplitude projects can I access?" If you see a list of your projects, MCP is connected and authenticated.
## Frequently asked questions
### Do I need developer mode enabled to use Amplitude MCP in ChatGPT?
Yes. ChatGPT developer mode is required for full MCP client access, including both read and write operations. OpenAI documents this as a beta feature available on eligible ChatGPT plans. Without developer mode, MCP tool calls aren't available.
### How do I switch Amplitude MCP from the US server to EU residency?
The ChatGPT connector uses the standard Amplitude OAuth flow, which routes to the correct region based on your Amplitude account. If you need explicit EU routing, contact Amplitude support.
### What permissions does the Amplitude MCP server have?
The MCP server inherits the Amplitude permissions of the user who authenticates. You can only read or modify projects you already have access to in Amplitude. Amplitude grants no additional access.
### Why does the recommended system prompt use a dedicated ChatGPT project?
Scoping the system prompt to a project keeps the Amplitude instructions from affecting other ChatGPT conversations. It also lets you share the project configuration with your team so everyone uses the same query behavior.
================================================================================
# How to connect Amplitude MCP to Claude
URL: https://amplitude.com/docs/amplitude-ai/amplitude-mcp/claude
================================================================================
# How to connect Amplitude MCP to Claude
Connect Amplitude MCP to Claude so you can ask questions about your product data, such as funnels, cohorts, and experiments, directly from claude.ai or the Claude desktop app. Setup uses OAuth and takes about two minutes. Use this when you want conversational access to Amplitude data from the Claude browser or desktop interface.
Use this connector for the Claude web or desktop app. If you want Amplitude MCP in a terminal workflow instead, use the [Claude Code connector](https://amplitude.com/docs/amplitude-ai/amplitude-mcp/claude-code).
You need an active Amplitude account with project access and a Claude account on claude.ai or the Claude desktop app.
## How do I connect Amplitude MCP in Claude?
For general MCP connector setup reference, refer to the [Claude remote MCP server documentation](https://support.anthropic.com/en/articles/11503834-building-custom-connectors-via-remote-mcp-servers).
1. Navigate to [claude.ai](https://claude.ai/) or open the Claude desktop app.
2. Go to _Settings > Connectors > Add custom connector_.
3. Configure the integration:
- **Name:** Amplitude
- **URL:** `https://mcp.amplitude.com/mcp`
EU customers should use `https://mcp.eu.amplitude.com/mcp` instead.
4. Complete Amplitude OAuth authorization when prompted.
5. Start asking questions about your Amplitude data.
## How do I verify the connection works?
Ask Claude: "What Amplitude projects can I access?" If you see a list of your projects, MCP is connected and authenticated.
## Frequently asked questions
### How do I switch Amplitude MCP from the US server to EU residency?
In _Settings > Connectors_, remove the existing Amplitude connector and add a new one with the URL `https://mcp.eu.amplitude.com/mcp`. Re-authenticate when prompted.
### What permissions does the Amplitude MCP server have?
The MCP server inherits the Amplitude permissions of the user who authenticates. You can only read or modify projects you already have access to in Amplitude. Amplitude grants no additional access.
### Why does the authorization page appear to keep spinning?
This is a known behavior. After completing Amplitude OAuth in your browser, the authorization page may appear to spin indefinitely. Close the tab. Authentication is complete and the connector is active.
================================================================================
# How to connect Amplitude MCP to Gemini CLI
URL: https://amplitude.com/docs/amplitude-ai/amplitude-mcp/gemini-cli
================================================================================
# How to connect Amplitude MCP to Gemini CLI
Connect Amplitude MCP to Gemini CLI so you can ask questions about your product data, such as funnels, cohorts, and experiments, directly from your terminal. Setup takes about two minutes and uses OAuth for authentication. Use this when you want natural-language Amplitude access inside a Google AI terminal workflow.
You need an active Amplitude account with project access, Gemini CLI installed, and an authenticated Gemini session.
## How do I configure Amplitude MCP in Gemini CLI?
For general MCP setup reference, refer to the [Gemini CLI MCP documentation](https://google-gemini.github.io/gemini-cli/docs/tools/mcp-server.html).
1. Ensure you're authenticated with Gemini CLI.
2. Add the Amplitude MCP server to your `~/.gemini/settings.json`:
```json
{
"selectedAuthType": "oauth-personal",
"mcpServers": {
"amplitude": {
"httpUrl": "https://mcp.amplitude.com/mcp"
}
}
}
```
EU customers should use `https://mcp.eu.amplitude.com/mcp` instead.
3. Restart the Gemini CLI MCP server and authenticate with Amplitude:
```shell
gemini/mcp auth amplitude
```
## How do I verify the connection works?
Ask Gemini CLI: "What Amplitude projects can I access?" If you see a list of your projects, MCP is connected and authenticated.
## Frequently asked questions
### How do I switch Amplitude MCP from the US server to EU residency?
Replace `https://mcp.amplitude.com/mcp` with `https://mcp.eu.amplitude.com/mcp` in `~/.gemini/settings.json`, then re-authenticate:
```shell
gemini/mcp auth amplitude
```
### What permissions does the Amplitude MCP server have?
The MCP server inherits the Amplitude permissions of the user who authenticates. You can only read or modify projects you already have access to in Amplitude. Amplitude grants no additional access.
### Does Gemini CLI support both read and write Amplitude operations?
Yes. All Amplitude MCP tools, including creation and editing of charts, dashboards, cohorts, and experiments, work through the Gemini CLI integration, subject to your Amplitude account permissions.
================================================================================
# How to connect Amplitude MCP to Replit
URL: https://amplitude.com/docs/amplitude-ai/amplitude-mcp/replit
================================================================================
# How to connect Amplitude MCP to Replit
Connect Amplitude MCP to Replit so you can ask questions about your product data (funnels, cohorts, experiments) directly from your Replit workspace AI. Setup uses OAuth and takes about two minutes. Use this when you want natural-language Amplitude access inside the same environment where you're building and running code.
Use the one-click deep link if you want the fastest setup. Use the manual configuration if you need to document or share the MCP setup in your workspace settings.
You need an active Amplitude account with project access and a Replit account with workspace access.
## How do I install Amplitude MCP in Replit with one click?
For general MCP setup reference, refer to the [Replit MCP documentation](https://docs.replit.com/replitai/mcp).
Select the link for your region to install in one step:
- **US server (default):** [Add Amplitude MCP to Replit](https://replit.com/integrations?mcp=eyJkaXNwbGF5TmFtZSI6IkFtcGxpdHVkZSIsImJhc2VVcmwiOiJodHRwczovL21jcC5hbXBsaXR1ZGUuY29tL21jcCJ9)
- **EU server:** [Add Amplitude MCP to Replit (EU)](https://replit.com/integrations?mcp=eyJkaXNwbGF5TmFtZSI6IkFtcGxpdHVkZSIsImJhc2VVcmwiOiJodHRwczovL21jcC5ldS5hbXBsaXR1ZGUuY29tL21jcCJ9)
Complete Amplitude OAuth authorization when prompted.
## How do I configure Amplitude MCP in Replit manually?
1. Navigate to your Replit workspace settings.
2. Go to _Integrations > MCP Servers_.
3. Add a new MCP server with this configuration:
- **Name:** Amplitude
- **URL:** `https://mcp.amplitude.com/mcp`
EU customers should use `https://mcp.eu.amplitude.com/mcp` instead.
4. Complete Amplitude OAuth authorization when prompted.
5. Start asking questions about your Amplitude data.
## How do I verify the connection works?
Ask Replit's AI: "What Amplitude projects can I access?" If you see a list of your projects, MCP is connected and authenticated.
## Frequently asked questions
### How do I switch Amplitude MCP from the US server to EU residency?
Remove the existing Amplitude MCP server from _Integrations > MCP Servers_ and add a new one with the URL `https://mcp.eu.amplitude.com/mcp`. Re-authenticate when prompted.
### What permissions does the Amplitude MCP server have?
The MCP server inherits the Amplitude permissions of the user who authenticates. You can only read or modify projects you already have access to in Amplitude. Amplitude grants no additional access.
================================================================================
# How to connect Amplitude MCP to Lovable
URL: https://amplitude.com/docs/amplitude-ai/amplitude-mcp/lovable
================================================================================
# How to connect Amplitude MCP to Lovable
Connect Amplitude MCP to Lovable so you can ask questions about your product data (funnels, cohorts, experiments) directly from the Lovable chat interface while you build. Setup uses OAuth and takes about two minutes. Use this when you want Amplitude data access inside the same AI-powered environment where you're prototyping and shipping products.
You need an active Amplitude account with project access and a Lovable account.
## How do I connect Amplitude MCP in Lovable?
For general MCP setup reference, refer to the [Lovable MCP documentation](https://docs.lovable.dev/integrations/mcp-servers).
1. Log in to [Lovable](https://lovable.dev/).
2. Select your avatar, then go to _Settings_.
3. Select **Connectors**.
4. Search for `Amplitude` in the search box.
5. Complete Amplitude OAuth authorization when prompted.
6. Start asking questions about your Amplitude data in the Lovable chat.
## How do I verify the connection works?
Ask Lovable's AI chat: "What Amplitude projects can I access?" If you see a list of your projects, MCP is connected and authenticated.
## Frequently asked questions
### Does Lovable support the EU Amplitude server?
The Lovable connector uses the standard Amplitude OAuth flow. If your Amplitude account uses EU data residency, authentication routes to the correct region automatically. Contact Amplitude support if you experience region-related connection issues.
### What permissions does the Amplitude MCP server have?
The MCP server inherits the Amplitude permissions of the user who authenticates. You can only read or modify projects you already have access to in Amplitude. Amplitude grants no additional access.
================================================================================
# How to connect Amplitude MCP to Figma Make
URL: https://amplitude.com/docs/amplitude-ai/amplitude-mcp/figma-make
================================================================================
# How to connect Amplitude MCP to Figma Make
Connect Amplitude MCP to Figma Make so you can pull Amplitude product data, such as funnels, cohorts, and experiment results, directly into your design workflow. Setup uses OAuth and takes about two minutes. Use this when you want to ground design decisions in real product metrics without switching between Figma and Amplitude.
You need an active Amplitude account with project access and access to Figma Make.
## How do I connect Amplitude MCP in Figma Make?
For general MCP connector setup reference, refer to the [Figma Make connector documentation](https://help.figma.com/hc/en-us/articles/35440096186007-Connect-external-tools-to-Figma-Make-using-MCP).
1. Open a Figma Make file.
2. Select the **+** icon, then **Connectors**.
3. In the _Partners_ tab, find Amplitude and select **Connect**.
4. Complete Amplitude OAuth authorization when prompted.
5. In the chat input, select the **+** icon, then _Connectors_, then **Amplitude** to activate the MCP server in your session.
## How do I verify the connection works?
In the Figma Make chat, ask: "What Amplitude projects can I access?" If you see a list of your projects, MCP is connected and authenticated.
## Frequently asked questions
### Why do my first Amplitude tool calls fail in Figma Make?
Figma Make has a data response size limit. Initial tool calls that return large payloads may fail; subsequent calls with more targeted queries typically succeed. Try narrowing your request. For example, query a single chart instead of an entire dashboard.
### How do I switch Amplitude MCP from the US server to EU residency?
The Figma Make connector uses Amplitude's standard OAuth flow, which routes to the correct region based on your Amplitude account. Contact Amplitude support if you experience region-specific connection issues.
### What permissions does the Amplitude MCP server have?
The MCP server inherits the Amplitude permissions of the user who authenticates. You can only read or modify projects you already have access to in Amplitude. Amplitude grants no additional access.
================================================================================
# How to connect Amplitude MCP to Kiro
URL: https://amplitude.com/docs/amplitude-ai/amplitude-mcp/kiro
================================================================================
# How to connect Amplitude MCP to Kiro
Connect Amplitude MCP to Kiro so you can ask questions about your product data, such as funnels, cohorts, and experiments, directly from the Kiro IDE. Setup uses OAuth and takes about two minutes. Use this when you want natural-language Amplitude access inside the same editor where you're writing and shipping code.
You can configure Kiro MCP at the user level (all projects) or workspace level (current project only). Use workspace scope if different projects need different Amplitude configurations; use user scope if you want one global setup.
You need an active Amplitude account with project access and the Kiro IDE installed.
## How do I configure Amplitude MCP in Kiro?
For general MCP setup reference, refer to the [Kiro MCP documentation](https://kiro.dev/docs/mcp/configuration).
1. Open the Kiro IDE.
2. Open the Command Palette (`Cmd+Shift+P` on Mac, `Ctrl+Shift+P` on Windows/Linux) and search for "MCP", or go to _File > Settings_ and open the `mcp.json` configuration file.
3. Select the scope for your configuration:
- **User settings**: Applies to all projects.
- **Workspace Config**: Applies to the current project only.
4. Add this configuration to your `mcp.json`:
```json
{
"mcpServers": {
"amplitude-mcp": {
"type": "http",
"url": "https://mcp.amplitude.com/mcp"
}
}
}
```
EU customers should use `https://mcp.eu.amplitude.com/mcp` instead.
5. Save the configuration file.
6. In the _MCP Servers_ section, verify the status shows **Connected**. If prompted, sign in to Amplitude through your default browser.
## How do I verify the connection works?
Ask Kiro: "What Amplitude projects can I access?" If you see a list of your projects, MCP is connected and authenticated.
## Frequently asked questions
### How do I switch Amplitude MCP from the US server to EU residency?
Replace `https://mcp.amplitude.com/mcp` with `https://mcp.eu.amplitude.com/mcp` in your `mcp.json` and save. Kiro reconnects automatically; re-authenticate if prompted.
### What permissions does the Amplitude MCP server have?
The MCP server inherits the Amplitude permissions of the user who authenticates. You can only read or modify projects you already have access to in Amplitude. Amplitude grants no additional access.
### Should I use user settings or workspace config?
Use user settings if you want Amplitude MCP available across all your Kiro projects without repeat configuration. Use workspace config if you're working on a shared project and want the MCP setup documented in the repository for your team.
================================================================================
# How to connect Amplitude MCP to Codex CLI
URL: https://amplitude.com/docs/amplitude-ai/amplitude-mcp/codex-cli
================================================================================
# How to connect Amplitude MCP to Codex CLI
Connect Amplitude MCP to Codex CLI so you can ask questions about your product data, such as funnels, cohorts, and experiments, directly from your terminal using OpenAI's Codex CLI agent. Setup uses OAuth and takes about two minutes. Use this when you want natural-language Amplitude access inside an OpenAI terminal-based AI workflow.
You need an active Amplitude account with project access and Codex CLI installed and authenticated.
## How do I configure Amplitude MCP in Codex CLI?
For general MCP setup reference, refer to the [OpenAI Codex CLI MCP documentation](https://developers.openai.com/codex/mcp/).
1. Add the Amplitude MCP server:
```shell
codex mcp add amplitude --url https://mcp.amplitude.com/mcp
```
EU customers should use `https://mcp.eu.amplitude.com/mcp` instead.
2. Follow the Amplitude OAuth authentication flow when prompted.
## How do I verify the connection works?
Ask Codex CLI: "What Amplitude projects can I access?" If you see a list of your projects, MCP is connected and authenticated.
## Frequently asked questions
### How do I switch Amplitude MCP from the US server to EU residency?
Run the add command again with the EU URL to overwrite the existing entry:
```shell
codex mcp add amplitude --url https://mcp.eu.amplitude.com/mcp
```
Re-authenticate when prompted.
### What permissions does the Amplitude MCP server have?
The MCP server inherits the Amplitude permissions of the user who authenticates. You can only read or modify projects you already have access to in Amplitude. Amplitude grants no additional access.
================================================================================
# How to connect Amplitude to GitHub Agent
URL: https://amplitude.com/docs/amplitude-ai/amplitude-mcp/github-agent
================================================================================
# How to connect Amplitude to GitHub Agent
The Amplitude plugin for GitHub Agent HQ bundles Amplitude skills, the Amplitude agent, and the Amplitude MCP server into a single agentic app that runs inside the Copilot harness. You invoke it with `@amplitude[agent]` in a comment or assignee field, or by selecting **Amplitude** from the GitHub agents dropdown — no manual MCP configuration required.
Use this when you want Amplitude analytics, experiment analysis, session replay, and briefing skills available directly in your GitHub coding workflow without leaving the platform.
The GitHub Agent integration is available for Amplitude accounts on the US endpoint only.
## Prerequisites
- Admin access to your Amplitude organization.
- Admin access to your GitHub organization.
## How do I install the Amplitude GitHub Agent?
1. Go to your [Amplitude profile page](https://app.amplitude.com/user-profile).
2. In the **GitHub Integration** section, click **Connect**.
3. Choose the repositories you want to connect.
4. Confirm the installation. GitHub redirects you back to Amplitude when the installation is complete.
After installation, the Amplitude agent is available in GitHub Agent HQ for the repositories you selected.
## How do I use the Amplitude agent in GitHub?
After installation, invoke the Amplitude agent in either of these ways:
- **From the agent dropdown**: select **Amplitude** from the dropdown menu in GitHub agents.
- **By @-mention**: tag `@amplitude[agent]` in a comment or assignee field on a pull request or issue.
The agent applies skills automatically based on your request. For example, asking "Why did this metric spike last week?" triggers `analyze-chart`, and asking "What's in our onboarding funnel?" triggers `create-chart`.
## How do I update the connected repositories?
To add or remove repositories after the initial installation:
1. Open the [Amplitude GitHub app](https://github.com/apps/amplitude).
2. Click **Configure**.
3. Add or remove repositories as needed.
## What's included
The Amplitude GitHub Agent includes 27 skills across seven areas, plus the main `amplitude` agent that connects to the Amplitude MCP server.
| Area | Skills |
| ---- | ------ |
| Core analytics | `create-chart`, `create-dashboard`, `analyze-chart`, `analyze-dashboard` |
| Product insights | `analyze-experiment`, `monitor-experiments`, `analyze-feedback`, `analyze-account-health`, `discover-opportunities`, `compare-user-journeys` |
| Session replay and debugging | `debug-replay`, `replay-ux-audit`, `diagnose-errors`, `monitor-reliability` |
| AI agent analytics | `analyze-ai-topics`, `investigate-ai-session`, `monitor-ai-quality`, `review-agent-insights` |
| Analytics instrumentation | `diff-intake`, `discover-event-surfaces`, `discover-analytics-patterns`, `instrument-events`, `add-analytics-instrumentation`, `taxonomy` |
| Briefings | `daily-brief`, `weekly-brief` |
| Bonus | `what-would-lenny-do` |
For full descriptions of each skill, refer to [Amplitude MCP plugins](https://amplitude.com/docs/amplitude-ai/amplitude-mcp#plugins).
## Frequently asked questions
### Is the GitHub Agent integration available for EU customers?
No. The GitHub Agent integration is available for Amplitude accounts on the US endpoint only.
### Do I need to configure MCP manually?
No. The Amplitude GitHub Agent bundles the MCP server automatically. You don't need to add MCP server configuration to your coding tool.
### Which GitHub Agent HQ plan do I need?
Refer to GitHub's documentation for GitHub Agent HQ availability and plan requirements.
### How do I disconnect the Amplitude GitHub Agent?
To remove the integration, open the [Amplitude GitHub app](https://github.com/apps/amplitude), click **Configure**, and uninstall or remove access for the repositories you want to disconnect.
================================================================================
# How to connect Amplitude MCP to other MCP clients
URL: https://amplitude.com/docs/amplitude-ai/amplitude-mcp/other-clients
================================================================================
# How to connect Amplitude MCP to other MCP clients
The Amplitude MCP server works with any MCP-compatible client, not just the ones listed in this section. If your client supports remote MCP servers over HTTP with OAuth, you can connect it to Amplitude in a few steps. Use this guide when your client isn't listed in the sidebar.
You need an active Amplitude account with project access and an MCP client that supports remote HTTP servers and OAuth authentication.
## How do I connect Amplitude MCP to an unlisted client?
1. Configure your client to connect to the Amplitude MCP server URL:
- **US (default):** `https://mcp.amplitude.com/mcp`
- **EU residency:** `https://mcp.eu.amplitude.com/mcp`
2. Ensure your client supports OAuth authentication for remote MCP servers.
3. Set up the connection according to your client's MCP documentation.
4. Authenticate with your Amplitude account when prompted using OAuth.
5. Select which Amplitude tools to enable based on your needs.
## How do I verify the connection works?
Ask your MCP client: "What Amplitude projects can I access?" If you see a list of your projects, MCP is connected and authenticated.
## Frequently asked questions
### What transport protocol does the Amplitude MCP server use?
The Amplitude MCP server uses Streaming HTTP (remote) transport. Your client must support this transport type to connect. Clients that only support stdio-based local servers aren't compatible.
### Does my client need to support OAuth specifically?
Yes. The Amplitude MCP server uses OAuth 2.0 for authentication. Clients that support only API key authentication or no authentication can't connect.
### How do I report a connection issue with an unlisted client?
Use the [Amplitude MCP feedback form](https://docs.google.com/forms/d/e/1FAIpQLSeFgRd8607Y2Gzidva5ChEri2tk7wvl7vofUIwxcM_2aD2Nqw/viewform?usp=header) to report issues and suggest new client guides.
================================================================================
# AI Feedback
URL: https://amplitude.com/docs/amplitude-ai/ai-feedback
================================================================================
# AI Feedback
AI Feedback automatically groups customer feedback from support tickets, app reviews, call recordings, and social channels into categories such as feature requests, complaints, and bugs, then connects those insights to Amplitude cohorts, session replays, and experiments so you can investigate and act on them. You can also create guides and surveys directly from insights.
Feedback events collect information about use cases such as:
- Providing feedback about specific product areas.
- Calling out complaints or loved features.
- Feature requests.
- Key takeaways.
{% callout type="note" heading="Additional use cases" %}
The use cases listed above are examples only. For a full description of all categories that AI Feedback tracks, go to [Viewing insights](https://amplitude.com/docs/amplitude-ai/ai-feedback#viewing-insights).
{% /callout %}
For information about how AI uses your data and other compliance details, go to [Trust in Amplitude AI](https://amplitude.com/trust#:~:text=Trust%20in%20Amplitude%20AI).
## How Feedback Events work
AI Feedback uses Feedback Events to record user feedback and create insights.
Each ingested comment, ticket reply, review, call utterance, or pasted snippet becomes one Amplitude event named `[AI Feedback] Feedback`. This lets you analyze customer voice with the same charts, cohorts, and segmentation tools that you use for product behavior.
Recommended event properties:
| Property | Description |
| ------------------------ | ------------------------------------------------------------------------------------------------------------------------------------------------------------------------------------------------------------------------------------------------------------------------------------------------------------------------ |
| `feedback_id` | Unique identifier for the feedback comment. Use this to deduplicate or to join events back to a specific comment. |
| `feedback_text` | The verbatim feedback text, truncated to the first 1,000 characters. |
| `feedback_insights` | Array of insight strings AI Feedback assigned to this comment (truncated to 200 characters each). Use this to chart or cohort users by the themes they raised. |
| `feedback_source_id` | Numeric ID of the connected source. Use this to filter events to a specific source connection. |
| `feedback_source_type` | Canonical source type. One of: `AMPLITUDE_AI_ASSISTANT_CHAT`, `AMPLITUDE_SURVEY`, `ANDROID`, `CSV`, `DISCORD`, `FREE_FORM_TEXT`, `FRESHDESK`, `G2`, `GONG`, `GRANOLA`, `HUBSPOT`, `INTERCOM`, `IOS`, `REDDIT`, `SALESFORCE_SERVICE`, `SLACK`, `STEAM`, `TRUSTPILOT`, `TWITTER`, `WEBHOOK`, `ZENDESK`. |
| `feedback_source_name` | Display name you gave the source when connecting it. Present when the source has a custom name. |
| `feedback_channel` | Communication channel of the source. One of `chat` (Gong) or `email` (Zendesk, Intercom, Salesforce Service, Freshdesk, HubSpot). Omitted for sources that don't map cleanly to a channel. |
| `feedback_timestamp` | ISO 8601 timestamp of when the source created the feedback. |
| `feedback_rating` | Numeric rating from the comment or its thread, when the source provides one (for example, an app store review's star rating). |
| `feedback_source_rating` | The source's overall rating at the time of the feedback event, rather than the rating of the individual comment (for example, an iOS or Android app's overall app store rating when AI Feedback ingested the review). |
User properties:
- `author`: Author name or handle reported by the source. May be `null` for anonymous feedback.
- `<AUTHOR_EMAIL>`: The author's email, set under the user property name you configure in [user mapping](https://amplitude.com/docs/amplitude-ai/ai-feedback#merging-existing-users-from-an-ai-feedback-source).
### Example use cases
- **Chart feedback volume by source**: Chart `[AI Feedback] Feedback` grouped by `feedback_source_type` to see which sources are driving feedback volume over time.
- **Track an insight over time**: Chart `[AI Feedback] Feedback` filtered by `feedback_insights` and pick the specific insight names you want to follow to see how mentions of those themes change over time.
- **Watch your app store rating trend**: Chart the average of `feedback_source_rating` grouped by week with `feedback_source_type` set to `IOS` to track how your app store score is moving.
- **Surface your best app reviews**: Filter `[AI Feedback] Feedback` by `feedback_rating` (for example, 5-star reviews) with `feedback_source_type` set to `IOS` to find your top app store reviews.
## Setting up a data source
Before you can gain any insights from your customers, you must add at least one data source to Amplitude. A data source is your repository of customer feedback. Popular data sources include Zendesk, Salesforce, Reddit, and others. You can also upload individual CSV or DOCX files as data sources.
For example, if your company has discussions on Reddit, you can set up an integration by pointing AI Feedback directly to the subreddit URL. AI Feedback then monitors the subreddit and provides insights from the posted content. You can also upload customer call transcripts directly to AI Feedback to gain insights from the conversation.
AI Feedback can ingest and generate insights from multiple sources at the same time. After the initial ingestion, AI Feedback pulls feedback once each day.
### Add a data source
1. Open Amplitude and click **AI Feedback** and then **Add Source**.
2. Select one of:
- **Connect an integration**: Lets you connect to an application such as Zendesk, Hubspot, or G2.
- **Upload a file**: Lets you upload a static CSV or DOCX file.
- **Paste text**: Lets you paste text directly into AI Feedback.
3. If you’re connecting an integration:
- Search for your application or select it from the list.
- Depending on the integration, you may need to sign in to that application, specify relevant metadata tags, or point AI Feedback to a specific URL. The connector modal guides you through the necessary steps.
4. If you’re pasting text, paste the content you want analyzed into the field. AI Feedback begins to parse the content automatically.
5. If you’re uploading a CSV or DOCX file, click **Upload** and then drag and drop the files you want to upload. For CSV files, choose which columns to designate as the Feedback information and which to use as additional metadata.
For example:
You could have a CSV file with the following columns:
| Feedback | Timestamp | Email | Geolocation |
| ---------------- | --------------------- | ------------------ | ----------- |
| Feedback entry 1 | 2023-11-03T15:28:05Z | name@example.co.uk | UK |
| Feedback entry 2 | 11/03/2023 3:28:05 PM | name2@example.com | US |
In the AI Feedback CSV upload tool, designate which columns to use and click **Analyze**. You must select the column that includes your feedback.
{% callout type="note" heading="Requesting a new source" %}
If the integration you need isn’t listed, click **Request a new source** to ask for a new source.
{% /callout %}
## Connect a Slack channel
Connecting a Slack channel lets AI Feedback automatically aggregate and surface insights from messages posted in that channel, with no manual tagging, copying, or context switching required. Pillar channels, support escalation channels, and customer-facing Slack Connect channels all become structured, searchable feedback sources.
### Add a Slack channel as a source
1. Navigate to _AI Feedback > Sources_.
2. Click **Add Source**.
3. Search for "Slack" and select it.
4. Authorize Amplitude to access your Slack workspace.
5. Select the channels you want to monitor.
6. Configure the following options:
- **Lookback range**: How far back to import messages during the initial connection.
- **Include thread replies**: Enable to include thread replies, not just top-level messages.
7. Click **Connect**.
AI Feedback ingests existing messages from the lookback period, then pulls new messages daily.
{% callout type="note" heading="" %}
After the initial ingestion, AI Feedback pulls new messages from connected Slack channels once each day.
{% /callout %}
## Managing a source
After you've added a data source, you can change its settings or delete the source from AI Feedback.
{% callout type="note" heading="" %}
Not all sources have additional settings. If your source doesn’t have any settings for you to modify, the Settings option only displays a status page.
{% /callout %}
### Change a source's settings
1. Go to _AI Feedback > Sources_.
2. Click the **three-dot menu** icon next to the source you want to change.
3. Click **Settings**.
4. If there are settings for your source, you can change them here.
5. Click **Back to sources** to return to the source menu.
### Delete a source
1. Go to _AI Feedback > Sources_.
2. Click the **three-dot menu** icon next to the source you want to delete.
3. Click **Confirm**.
{% callout type="note" heading="Deleting sources" %}
Deleting a source deletes the previously analyzed feedback and prevents new feedback from that source.
{% /callout %}
## Supported sources
AI Feedback connects to a variety of feedback sources across four categories.
### Support and service
- **Zendesk**: Import support tickets and customer conversations.
- **Intercom**: Import customer messaging and support interactions.
- **Salesforce Service**: Import service cases and customer communications.
- **Freshdesk**: Import helpdesk tickets and customer responses.
### Sales and success
- **HubSpot**: Import CRM feedback, deal notes, and customer communications.
- **Gong**: Import sales call transcripts and conversation insights.
### Social and reviews
- **Slack**: Import feedback from specific Slack channels.
- **App Store**: Import iOS app reviews and ratings.
- **Google Play Store**: Import Android app reviews and ratings.
- **G2**: Import software review feedback.
- **Discord**: Import feedback from Discord server channels.
- **Trustpilot**: Import customer review feedback.
- **X**: Import mentions and conversations.
- **Reddit**: Import subreddit discussions and comments.
### Amplitude
- **AI Assistant Chat**: End user chats with the Amplitude AI Assistant, ingested automatically. No source configuration needed.
### File upload and other
- **CSV**: Upload structured feedback data from CSV files.
- **DOCX**: Upload feedback documents such as call transcripts or research reports.
{% callout type="note" heading="Requesting a new source" %}
If the integration you need isn't listed, select **Request a new source** in the source selection modal.
{% /callout %}
## AI Assistant Chat
AI Feedback automatically ingests end user chats with the Amplitude AI Assistant. You don't need to configure a source. Amplitude funnels the chats into the AI Feedback pipeline and generates insights about common questions, feedback, and feature requests from users, the same way feedback from manually configured sources does.
To filter Feedback Events or insights to AI Assistant chats, set `feedback_source_type` to `AMPLITUDE_AI_ASSISTANT_CHAT`.
## Analysis pipeline
AI Feedback uses a hybrid pipeline that combines classical machine learning (ML) with large language model (LLM) techniques. Classical ML clusters unstructured feedback into related groups first, then the LLM analyzes those clusters to generate insights. This approach produces more accurate, faster, and more actionable insights than LLM-only analysis, and lets AI Feedback refresh insights and metrics more frequently.
## Viewing insights
The _New Insights_ tab displays AI-generated insights from your connected feedback sources. AI Feedback regenerates these insights each time it runs its analysis, so insights on this tab are ephemeral: they refresh and may change as new feedback arrives and more relevant clusters emerge. To persist an important insight and track it over time, [save it as a trend](#saved-trends).
Each insight and trend includes an AI-generated summary that describes what customers are saying. Summaries appear directly in the insight and trend panels so you can understand the theme without opening every thread or deep dive.
{% callout type="note" heading="" %}
AI Feedback generates summaries in English regardless of your Amplitude profile language setting.
{% /callout %}
AI Feedback counts how many customers share the same feedback for the same feature or functionality. For example, if multiple customers report the same bug, AI Feedback highlights the bug and displays how many mentions it received. Each insight displays its category, mention count, and sources.
Filter insights by category, source, and time range. For example, filter to only social media sources to understand how customers discuss your products publicly, or filter to customer service tickets to understand product performance.
Insights align to these categories:
- **Feature Request**: Additional features your customers want.
- **Complaint**: Issues and problems your customers experience.
- **Loved Feature**: Features and functions that your customers enjoy.
- **Brand**: Specific brands mentioned by your customers.
- **Bug**: Issues customers experience with specific functionality.
- **Feature Mentioned**: Any features or functionality customers specifically mention by name.
- **Pain Point**: Places within your product that are problematic or causing issues for customers.
- **Takeaway**: High-level understandings and insight about your products, features, or functionality.
AI Feedback uses these categories to organize insights automatically.
You can specify any time range to view insights across the history of your data sources.
### AI Feedback with AI Chat analysis
You can use Amplitude's Global Agent to analyze your Feedback data, perform semantic searches on feedback or insights, and answer requests such as:
- Summarize all recent feedback.
- Provide direct user quotes from customers about your website's search experience.
- Highlight the most talked about bug or complaint from the previous week.
You can also have Global Agent perform actions such as:
- Create a product requirements doc (PRD) to improve your company's product functionality based on feedback. For example, Global Agent can create a PRD to improve your notification system based on feedback about notifications.
## Product areas
Categories describe the _type_ of feedback. Product areas describe the _part of your product_ the feedback is about, such as Dashboards, Onboarding, or Billing. AI Feedback defines categories, but you create and manage product areas yourself.
When AI Feedback analyzes feedback, it assigns each insight to the product areas it matches. A single insight can touch more than one part of your product, so AI Feedback can assign multiple product areas to the same insight. AI Feedback matches insights using each product area's name and description, so clear, specific descriptions produce more accurate assignments.
### Set up product areas
1. Go to _AI Feedback > Settings_.
2. Open the **Product Areas** section.
3. Add a product area and give it a name and a description.
4. Repeat for each part of your product you want to track.
After you define your product areas, AI Feedback assigns them to insights the next time it analyzes feedback.
### Where product areas appear
- **Filter**: Filter insights and mentions by product area to focus on one part of your product. If you haven't set up any product areas, the filter links you to the Product Areas settings.
- **Mention details**: Each mention shows its assigned product areas in the mention details.
## Severity and specificity
In addition to categories and product areas, AI Feedback scores every insight with two signals that help you triage feedback: severity and specificity. AI Feedback assigns both automatically during analysis and sends them to Amplitude with the insight, so you can filter, sort, and build charts and alerts on them.
**Severity** measures how much pain or impact the feedback represents for the customer:
- **Low**: A minor annoyance or nice-to-have.
- **Medium**: Real friction.
- **High**: Significantly hurts the customer's workflow or value.
- **Critical**: Blocking, costs the customer money, or makes them consider leaving.
**Specificity** measures how concrete and actionable the feedback is:
- **Vague**: No specifics, such as "the UI is bad."
- **General**: Names an area but gives no concrete detail, such as "dashboards are slow."
- **Specific**: Identifies the thing and the issue, such as "the export button on the dashboard share modal is missing."
- **Detailed**: Includes reproduction steps, exact behavior, or a measurable outcome.
Use severity to prioritize the feedback that hurts customers most, and specificity to find the feedback that's concrete enough to act on right away. Both signals appear in the mention details, and you can filter and sort insights by either one.
## Working with insights
Insights help you understand your customers' experience with your product. For every insight, AI Feedback offers actions you can take:
- **Save as Trend**: Saves the insight as a persistent trend you can track over time. Go to [Saved Trends](#saved-trends).
- **Share**: Lets you share the insight with an internal colleague.
- **Create Survey**: Lets you create a [survey](https://amplitude.com/docs/guides-and-surveys/survey-overview) that you can send to customers. This action opens the Guide creation tool and adds the mentioned customers as a cohort for the survey.
- **Watch Session Replays**: Lets you watch [session replays](https://amplitude.com/docs/session-replay) from customers directly related to the insight.
- **Create Cohort**: Creates a [cohort](https://amplitude.com/docs/analytics/define-cohort) based on the insight. Automatically adds the customers mentioned in the insight to the cohort.
- **Delete mentions**: Lets you delete individual mentions from a specific insight.
- **Delete Insight**: Lets you delete the insight from AI Feedback. You can't undo deleting the insight.
- **Copy prompt**: Copies a pre-built prompt based on the insight to your clipboard for use with an AI tool or coding agent.
- **Export to Jira**: Creates a Jira ticket from the insight. {% early-access-pill /%}
- **Export to Linear**: Creates a Linear issue from the insight. {% early-access-pill /%}
- **Open in coding agent**: Opens the insight in a coding agent. {% early-access-pill /%}
### Perform an action on an insight
1. Open the insight you want and click **Actions**.
2. Select the action you want.
AI Feedback performs actions as soon as you select them. Depending on the action, the system may take a few minutes to update.
### Delete a mention
1. Open an insight with multiple mentions.
2. Next to the mention you want to delete, click the **three-dot menu** item and select **Delete Mention**.
You can't undo this deletion.
### Share an insight
- Click **Share**.
Amplitude copies a link to the insight to your clipboard automatically. Only colleagues with access to your Amplitude project can view it.
## Saved Trends
Insights on the _New Insights_ tab are ephemeral and refresh each time AI Feedback runs its analysis. Saved Trends let you persist insights and track them over time, so important themes don't get lost when new feedback arrives.
When you save an insight as a trend, or create one manually, AI Feedback links new, semantically relevant mentions to that trend daily. This lets you move from "what's new today?" to "how are my top priorities trending over time?" and track results as you fix bugs, implement feature requests, and reduce complaints.
The _Saved Trends_ tab displays each trend's name, category, total mentions, week-over-week change, and a sparkline that visualizes recent activity.
### Save an insight as a trend
1. Go to _AI Feedback > New Insights_.
2. Find the insight you want to persist.
3. Click **Save as Trend** on the insight row.
AI Feedback saves the insight as a trend and begins linking new, semantically relevant mentions to it daily.
### Create a trend manually
You can create a trend from scratch to track a topic that doesn't match an existing insight.
1. Go to _AI Feedback > Saved Trends_.
2. Click **Track a New Trend**.
3. Enter a name for the trend in the **Trend Name** field.
4. Select a category from the **Category** dropdown.
5. Optionally, add a description to narrow the feedback the trend tracks.
6. Click **Create Trend**.
### View trend details
1. Go to _AI Feedback > Saved Trends_.
2. Click the trend you want to examine.
The trend detail view displays:
- A chart of weekly mentions over time that shows how the trend's volume changes.
- The full list of linked mentions with source information, dates, and links to the original feedback.
Use the trend detail view to drill into specific mentions and understand the context behind each data point.
## Alerting
Alerts notify you when feedback crosses a threshold you care about, such as a spike in critical bugs for a specific product area.
To start an alert, click the **alert** (bell) icon at the top of the AI Feedback page and choose:
1. A **category**, such as Bug or Complaint.
2. The **sources** to include.
3. The **labels** to filter by, such as severity, sentiment, or product area.
AI Feedback builds an Amplitude chart from your selections and opens it, where you set the alert conditions and recipients with Amplitude's standard [alerts](https://amplitude.com/docs/analytics/insights).
Because AI Feedback sends categories, severity, specificity, and product areas as properties on each Feedback Event, you can also build charts and alerts on these signals directly in Amplitude Analytics.
## Refresh cadence
AI Feedback ingests feedback and regenerates insights on a regular schedule:
- **Initial ingestion**: When you connect a source, AI Feedback imports existing feedback from the source's lookback window.
- **Ongoing ingestion**: After the initial import, AI Feedback pulls new feedback from each source once each day. Some sources support more frequent ingestion, as often as every 15 minutes.
- **Insight regeneration**: Each time AI Feedback runs its analysis, it regenerates the insights on the _New Insights_ tab, so they refresh as new feedback arrives. Saved Trends link new, semantically relevant mentions daily.
## Merging existing users from an AI Feedback source
This lets you merge your existing users with users from supported AI Feedback sources such as Zendesk, Hubspot, or Intercom. Amplitude merges users with the same email address.
### Merge existing users
1. Go to _Organization Settings > Projects > your project > AI Feedback > User Mapping_ and specify the field that contains the user's email address.
2. From your system, send at least one event for each user that has that field populated.
After Amplitude receives that event for a user, AI Feedback can merge that user with the user from an AI Feedback-supported source using that email address.
## Deleting information based on user ID or Amplitude ID
When you submit a deletion request to Amplitude's [User Privacy API](https://amplitude.com/docs/apis/analytics/user-privacy) for a specific user ID or Amplitude ID, AI Feedback also deletes data associated with that user ID or Amplitude ID if you've merged your existing users with users from supported AI Feedback sources. If you haven't [merged your existing users](https://amplitude.com/docs/amplitude-ai/ai-feedback#merging-existing-users-from-an-ai-feedback-source), the User Privacy API can't match Feedback data with the submitted user ID or Amplitude ID.
To ensure that the deletion is permanent and complete:
- Delete upstream first: You must first delete the data from the original source, such as Zendesk or Gong, before submitting your request to Amplitude. If you don't delete the source data first, the data syncs back into Amplitude.
- Manual deletion of other data: The User Privacy API only handles deletions tied to specific user IDs or Amplitude IDs. You must manually delete other related data, such as general or aggregated feedback, from the [source management page](https://amplitude.com/docs/data/sources/connect-to-source).
## Data access
AI Feedback follows your existing Amplitude project and role-based permissions. It doesn't grant new data access.
You authorize the source connectors you want (for example: Zendesk, Hubspot, Intercom, App Store/Google Play, Gong, G2/Trustpilot, Reddit/Discord/X) and they use your credentials with secure OAuth (or equivalent).
## AI Feedback and LLM use
AI Feedback uses a hybrid analysis pipeline that combines classical machine learning with a third-party large language model (OpenAI) to turn connected feedback (for example tickets, reviews, call transcripts, social/forums) into product insights.
You control which sources to connect. AI Feedback processes only the feedback you choose to ingest and the Amplitude data you already can access. AI Feedback processes customer data for inference only. OpenAI doesn't use it to train foundation models. AI Feedback handles requests transiently, encrypting data in transit and at rest in your regional data plane. Outputs use raw feedback data with source links and proprietary safeguards, such as hallucination checks, to help ensure summaries reflect actual feedback.
================================================================================
# AI Visibility
URL: https://amplitude.com/docs/amplitude-ai/ai-visibility
================================================================================
# AI Visibility
AI Visibility measures how often and how favorably your brand appears in answers from AI assistants like ChatGPT, Claude, Gemini, and Perplexity. It surfaces visibility scores, competitor rankings, and recommendations that marketers and growth teams use to improve their brand presence in AI-generated answers. Use these insights to understand how your brand appears in AI searches and improve AI-driven traffic.
AI Visibility automatically updates its information weekly.
Everyone can use most AI Visibility functionality, with or without an Amplitude subscription. A paid Amplitude subscription includes some additional functionality. If your version of AI Visibility doesn't include a feature described in this article, that feature requires a paid subscription tier.
For information about how AI uses your data and other compliance details, go to [Trust in Amplitude AI](https://amplitude.com/trust#:~:text=Trust%20in%20Amplitude%20AI).
AI Visibility reports run one time each week. Changes to AI Visibility become active when the report reruns.
{% callout type="note" heading="Inactive brand behavior" %}
If no one views a brand's report for 30 days on a Starter or Plus plan, the whole report pauses. On other plans, the report keeps refreshing, but Google AI Overview results stop updating after 90 days without views. The pause lifts automatically the next time someone opens the brand. Amplitude retains all data and nothing needs configuration. This doesn't apply to brands on a paid AI Visibility plan with daily refresh.
{% /callout %}
## Free visibility reports
Everyone can access free visibility reports on the Amplitude [Try AI Visibility](https://www.amplitude.com/try-ai-visibility) website page.
{% callout type="note" heading="" %}
If a current Amplitude customer builds a free report, it's not tied to their Amplitude account. To connect a report to their Amplitude account, they must first log into Amplitude and then go to the AI Visibility page.
{% /callout %}
For in-depth AI Visibility functionality for your specific brand, open your Amplitude home page and then go to _Marketing Analytics > AI Visibility_.
The rest of this article describes the AI Visibility functionality available through the Amplitude tool.
## AI Visibility summary metrics
The _Overview_ tab summarizes how your website performs in AI-generated search. The tab includes:
- **Mentions this Week**: Percentage of AI responses that mention your brand.
- **Average Rank this Week**: Average position of your brand in AI-generated responses.
- **Citations this Week**: Number of responses that mention your brand in the current week.
- **Visibility/Rank over Time**: A graph that compares your visibility or rankings with your competitors over time. Filter this graph by topic for a narrower view.
- **Competitor Mentions**: A graph that compares competitor mentions with mentions of your brand.
- **Top Topics by Visibility**: Top topics related to your brand, plus the mentions and responses used to calculate visibility.
- **Top Cited Sources**: Top sources AI agents used to generate results.
##### Updating languages and regions
You can update the language and region settings for each brand that you're researching. Updating the language for a brand affects the generated prompts and responses. Changes to the language settings take effect when the report reruns on its normal schedule.
{% callout type="note" heading="Language considerations" %}
If the prompts are in English and you change the language settings, the prompts remain in English. Responses use the updated language. If you configured the language during the original brand setup, most responses use that language.
{% /callout %}
1. Next to the brand drop-down menu, click the **Configuration** slider icon button.
2. Select the brand you want to modify.
3. In the **Region** field, set the region. By default, this field uses **global**.
4. In the **Language** field, specify the two-character language code. For example, enter **FR** to set the brand to French. By default, this field uses **EN** for English. For all possible language codes, go to [Language Codes](https://developers.google.com/custom-search/docs/json_api_reference#interfaceLanguages).
5. Click **Save**.
6. Close the Brand Settings window.
## Prompts tab
The _Prompts_ tab contains all prompts from the available AI agents that mentioned your brand or generated results from your content. Use this page to review metrics and investigate individual prompts.
If you change a prompt, that prompt reruns immediately. The rest of the report remains as-is until its regularly scheduled update.
You can export these prompts to a CSV file for further analysis. Click **Export CSV** to download the file.
### Filtering
Filter individual AI models to include all available AIs or only the models you want.
You can also filter prompt results to include or exclude competitor brands or your own brand. Click either the **All Models** or **All Brands** drop-downs to filter AI models or competitor brands. To exclude your own brand, select the **Exclude `<brand>`** checkbox.
### Metrics
The Prompts tab contains the following metrics:
- **Topics**: The total number of topics relating to your brand.
- **Prompts**: The total number of prompts across all topics that relate to your brand or to your competitors.
- **Responses**: The total number of responses generated from the prompts that relate to your brand or to your competitors.
### Topics and prompts
The Prompts tab displays a searchable list of all topics and their associated prompts. Each topic represents a category or theme of queries that AI agents received. By default, insights appear first by topic and then by the prompts that relate to that topic. For example, in the topic "Product Analytics," you might find the following prompts:
- "Compare leading product analytics services"
- "Ranking product analytics platforms 2025"
- "Best platforms for user behavior tracking"
- "How to analyze user retention in SaaS products"
Click a topic to display all prompts related to that topic.
Both topic and prompt views contain metrics for:
- **Visibility**: The percentage of AI responses that mention your brand.
- **Relevancy**: The percentage of prompts that mention either your brand or a competitor's brand.
- **Average rank**: The average position that your brand appears in AI responses.
- **Citations**: The number of AI responses that cite your website.
- **Search Volume**: The estimated monthly volume of AI-driven queries for this topic or prompt, based on Google AI Overviews data. Google AI Overviews captures hundreds of millions of real user queries to an AI system each month, making it a reliable signal for where genuine AI-driven demand exists. Use Search Volume to prioritize topics where people are already turning to AI for answers.
{% callout type="note" heading="Search Volume is in Beta" %}
Search Volume is currently in closed beta. If you don't see this metric, it hasn't been enabled for your account yet.
{% /callout %}
#### Topics
Topics appear in expandable rows that show:
- **Topic name**: The subject or theme of related prompts (for example, "product analytics tools" or "customer data platforms").
- **Prompt count**: The number of individual prompts within that topic.
- **Response count**: The total number of AI-generated responses across all prompts in the topic.
Click a topic row to expand it and view all associated prompts.
#### Individual prompts
Clicking into an individual prompt displays:
- The specific prompt that either the user entered or the AI generated.
- Brands mentioned in the response.
- The AI Model used to answer the prompt.
- The LLM's response to the prompt.
- Citations used to generate the response.
- The date and time when the prompt was last run.
Click any prompt to view the complete AI response and analyze how the answer represents your brand and competitors.
Use the search bar at the top of the list to find specific topics or prompts by keyword.
#### Working with topics and prompts
You can edit or delete any topic or prompt from the list. Deleting a prompt removes it from metrics about your brand.
Editing a topic or prompt updates only the topic or prompt in the list. Existing model responses don't update. The next time the LLM runs, it uses the updated prompt.
## Sources tab
The Sources tab displays two categories of source information: All Cited Sources and My Website Pages.
### All Cited Sources
The All Cited Sources page displays the total number of sources referenced by AI chats that reference your brand or your competitors.
The page lists each source or domain, the number of referenced pages, and the number of responses for each source. Click a source to view the specific pages that AI chat referenced. Each page lists the number of responses that cited that page and how many times the page explicitly mentioned your brand.
You can filter the All Cited Sources page by topic, AI model, brands, and group subdomains.
### My Website Pages
The _My Website Pages_ tab shows how AI chat and search engines reference and cite your website. The page displays metrics for:
- **Total cited pages**: The total number of website pages cited.
- **Overall search engine traffic**: The total amount of search engine traffic for all website pages.
- **Overall AI chat traffic**: The total number of AI chat traffic for all website pages.
- **Total errors**: The total number of website pages with errors.
- **Total warnings**: The total number of website pages with warnings.
The page also includes a list of every page on your website and the following metrics for each page:
- Search engine traffic
- AI chat traffic
- Citations
Click each website section to understand how AI chat cites and references each page.
For further analysis, create a cohort from any page or page group.
##### To create a cohort from your page citations
1. Click the **Create Cohort** button next to the page or page group you want.
2. Select the traffic type you want in your cohort:
- All Traffic
- Search Engine Traffic
- AI Chat Traffic
3. Select the date range for your cohort.
4. Name the cohort.
5. If you want to place this cohort in a specific space, click the **Location** drop-down and select where you want the cohort.
6. Add a short description and click **Save Cohort**.
## Sentiment tab
The Sentiment tab shows what percentage of AI responses describe your brand positively or negatively. AI Visibility assigns sentiment by having an LLM evaluate the language used to describe your brand in each response. This is not by keyword matching.
For complete details about AI Visibility Sentiment, go to the [Sentiment](https://amplitude.com/docs/amplitude-ai/ai-visibility/sentiment) page.
## Competitors
The _Competitors_ tab shows how competitor AI Visibility results compare with your own. Use this information to understand how AI chat compares your brand with competitors and where you can improve.
AI Visibility automatically selects competitors by the number of mentions it finds for brands similar to yours. You can filter competitors out of your analysis. To add or delete a competitor, go to [Competitor Settings](https://amplitude.com/docs/amplitude-ai/ai-visibility#competitor-settings).
### Comparisons
The _Comparisons_ section displays direct comparisons between your brand and competitors. For each competitor, AI Visibility analyzes the subject areas where each brand leads and gives an overall score for which brand appears higher in shared prompts.
The subject areas are automatically identified and analyzed by AI Visibility. However, these subject areas tend to be the major functional areas of your business.
AI Visibility repeats these subject areas across each competitor analysis where possible.
### Competitor Topics Matrix
The _Competitor Topics Matrix_ section displays the primary topics AI chat searches and references. It also shows how your citations and references perform against competitors.
View these comparisons by **Visibility Percentage** or **Average Rank**.
AI Visibility highlights the best-performing brand for each topic.
### Competitor Settings
The Competitor Settings section lets you view your primary competitors and either delete an existing competitor from the analysis or manually add a competitor to your analysis.
The section also displays the number of prompts that each competitor appears in and a visibility score. The visibility score reflects how often your brand appears across hundreds of prompts. AI Visibility compares performance with competitors and supplies automated actions to improve results.
##### To add a competitor
1. Click **Add Competitor**.
2. Enter the competitor's name and their website URL.
3. Click **Create**.
AI Visibility then searches for that competitor and includes their information into your visibility analysis.
## Actions
AI Visibility automatically creates actions that you can take to improve your visibility within AI responses. You can implement any recommended action, or choose not to implement any. AI Visibility divides these actions into the following categories:
- **Recommendations**: Implement specific actions to improve your overall LLM visibility. Recommendations also provide page or URL-specific suggestions. Recommendations are up-sorted by Search Volume, so high-demand topics appear first.
- **Analyze Page**: Analyze a specific URL, topic, or piece of content and generate recommendations specific to that page.
- **Simulate Changes**: Simulate recommended changes. This lets you view the suggested changes in real time before committing them to your website.
- **Generate Content**: Generate website content targeted toward increasing your visibility and engagement with LLMs.
{% callout type="note" heading="Suggestions for Improvement" %}
AI Visibility can't directly access or change your website. You must implement these suggestions and recommendations yourself. For any content suggestion, AI Visibility lets you copy or download the content and add it to your website.
{% /callout %}
The following procedures describe how to implement or create AI Visibility's actions:
{% callout type="warning" %}
Review all recommendations before implementing them because functionality may not operate exactly as expected.
{% /callout %}
##### To implement a recommendation
1. Go to _AI Visibility > Actions > Recommendations_.
2. Review the recommendations to improve your overall LLM visibility.
3. Click **Optimize** for the recommendation you want to implement.
This opens the _Simulate Changes_ section, where you can view the recommended changes and make edits. Typically, this involves updating blog posts or other content and then refining LLM prompts.
4. After you finish reviewing or editing the content, select the prompts you want to run to update the LLMs.
5. Select the AI model you want to run the prompts on.
6. Click **Run Test**.
After the test runs, review the simulation results. If the results improve your visibility, implement the changes directly on your website. If the results don't improve your visibility, continue to edit and update the prompts until you have the results you want.
##### To analyze a page or topic
1. Go to _AI Visibility > Actions > Analyze Page_.
2. Select either **Analyze URL** or **Analyze content**.
3. Enter the website URL you want analyzed or copy/paste the content.
4. If you want AI Visibility to focus on a specific topic, select one from the drop-down list.
If you don't select a topic, AI Visibility analyzes the URL against all topics.
5. Click **Analyze**.
AI Visibility may take some time to complete the analysis, depending on the complexity or amount of content. After the analysis completes, scroll through the recommended optimizations. Click **Simulate Changes** to try the recommendations.
##### To simulate changes
This page opens with the most recent suggested change.
1. Go to _AI Visibility > Actions > Simulate Changes_.
2. Review and, if necessary, change the source for the change.
3. Review the changes in the Content Editor field. Make any changes you want.
4. Select the prompts you want to run on the suggested changes.
5. Select the AI Model to run the prompts.
6. Click **Run Test**.
After the test runs, review the simulation results. If the results improve your visibility, implement the changes directly on your website. If the results don't improve your visibility, continue to edit and update the prompts until you have the results you want.
##### To generate content
1. Go to _AI Visibility > Actions > Generate Content_.
2. Select the topic about which you want AI Visibility to generate content.
3. Select the content type. You can select one of:
- Blog post
- Product description
- FAQ
- Landing Page
4. Optionally, enter one or more reference URLs as examples and context.
5. Select whether AI Visibility should match your brand's voice or generate example content.
6. Click **Generate Content**.
After AI Visibility generates your content, edit the content as needed. When you're satisfied with the content, click either **Copy** or **Download as Markdown** to implement it on your website.
If you aren't satisfied with the original generated content, click **Generate Again** to have AI Visibility make a new attempt. If you regenerate content after you manually edit it, AI Visibility doesn't retain those edits.
##### To export content
You can export all prompt metrics as a CSV file. Export API timestamps are in UTC. The CSV exports mirror the on-screen breakdown table. This table supports 10,000 rows. Additional chart and group-by-dependent limitations may apply. You can bypass these UI limits by sending the full dataset to a connected data warehouse.
1. Go to _Marketing Analytics > AI Visibility > Prompts_.
2. Select the Models and Brands you want.
3. Click **Export CSV**.
The file automatically downloads to your local machine.
## Use AI Visibility data in Amplitude
AI Visibility sends report results to your Amplitude projects as structured analytics events. Use these events to analyze AI visibility metrics alongside your product, user, and behavioral data in charts, cohorts, dashboards, and other Amplitude analyses.
After you enable event ingestion, events stream into the selected projects automatically every time a report completes.
### Event volume and your plan
AI Visibility events count toward your organization's Amplitude event volume. Your total event volume depends on two factors: which event types you enable in _Settings > Event Ingestion_, and your AI Visibility refresh cadence.
**Refresh cadence** varies by AI Visibility plan:
- **Weekly refresh**: AI Visibility runs one time each week, generating one batch of events for each cycle.
- **Daily refresh**: AI Visibility runs every day, generating events with each daily report with up to 7× more events each week than weekly refresh.
For each refresh cycle, the number of events depends on which event types you enable:
- **Brand events**: One event for each brand during each cycle. If you enable only brand events, the impact is minimal. AI Visibility sends one event during each refresh.
- **Competitor events**: One event for each competitor during each cycle. To understand how many competitors you're tracking, go to the _Competitor Settings_ tab. That number equals your event count for each cycle from this type.
- **Topic events**: One event for each topic during each cycle. To understand your current topic count, go to the _Prompts_ tab and check the **Topics** metric. That number equals your event count for each cycle from this type.
To estimate your event volume, multiply your cycle count by your refresh frequency. For example, on a weekly plan with 1 brand, 10 competitors, and 24 topics, enabling all three event types generates up to 35 events each week. On a daily plan with the same setup, that's up to 245 events each week.
{% callout type="note" heading="" %}
If you're not sure which refresh cadence your plan includes, check your AI Visibility plan details or contact your Amplitude account team.
{% /callout %}
### Enable event ingestion
1. In AI Visibility, click **Settings**.
2. Go to the **Event Ingestion** tab.
3. Select the Amplitude projects that should receive events.
4. Choose which event types to send.
5. Click **Save**.
After saving, events stream into the selected projects starting with the next completed report.
{% callout type="note" heading="" %}
Events aren't retroactive. Only reports that complete after you enable event ingestion generate events. There's no historical backfill.
{% /callout %}
### Event ingestion options
You control which types of events AI Visibility sends. Each option is independent, and you can enable options in any combination. If you disable all options, AI Visibility sends no data.
| Event type | Description | On by default |
| --------------------- | ------------------------------------------------------------------------------- | ------------- |
| **Brand events** | One event per brand per report. Includes your brand and optionally competitors. | Yes |
| **Competitor events** | One event per competitor brand. Useful for comparison charts. | No |
| **Topic events** | One event per topic in the report. Useful for topic breakdown charts. | No |
#### Project selection
Events go to the Amplitude projects you select in **Settings > Event Ingestion**. If you select no projects, AI Visibility sends events to all projects in your organization.
Configuration is set at the organization level and applies to all brands in AI Visibility. You can't configure event ingestion per brand.
### Event types
AI Visibility sends two event types to Amplitude.
#### AI Visibility: Brand Report Completed
Tracks how visible each brand is across AI responses in a completed report. Use this event to analyze share of voice across competitors, ranking trends over time, and competitive positioning.
**Cardinality**: One event per brand per report.
**Event properties**:
| Property | Type | Description |
| ----------------------- | ------- | --------------------------------------------------------------------- |
| `brand_name` | string | Name of the brand. |
| `company_name` | string | Name of the company. |
| `is_competitor` | boolean | `true` if this is a competitor brand; `false` for your primary brand. |
| `visibility_percentage` | number | Percentage of AI responses that mention this brand. |
| `average_rank` | number | Average position of the brand in AI responses. |
| `total_responses` | number | Total AI responses analyzed in the report. |
| `mentioned_responses` | number | Number of responses that mentioned this brand. |
**Example**:
```json
{
"event_type": "AI Visibility: Brand Report Completed",
"user_id": "org_123",
"event_properties": {
"report_id": 9876,
"org_id": 123,
"org_brand_id": 456,
"brand_id": 1,
"brand_name": "Amplitude",
"company_name": "Amplitude",
"is_competitor": false,
"visibility_percentage": 57.6,
"average_rank": 5.5,
"total_responses": 1750,
"mentioned_responses": 1008
}
}
```
#### AI Visibility: Topic Report Completed
Tracks how your brand performs within each topic in a completed report. Use this event to analyze visibility by topic, topic-level ranking trends, and content opportunities.
**Cardinality**: One event per topic per report, for your primary brand only.
**Event properties**:
| Property | Type | Description |
| ----------------------- | ------ | ---------------------------------------------------------------------------- |
| `topic_name` | string | Name of the topic. |
| `brand_name` | string | Name of your primary brand. |
| `visibility_percentage` | number | Percentage of AI responses that mention your brand for this topic. |
| `average_rank` | number | Average position of your brand in responses for this topic. |
| `relevancy` | number | Percentage of prompts in this topic that mention your brand or a competitor. |
| `citations` | number | Number of AI responses that cite your website for this topic. |
**Example**:
```json
{
"event_type": "AI Visibility: Topic Report Completed",
"user_id": "org_123",
"event_properties": {
"report_id": 9876,
"org_id": 123,
"org_brand_id": 456,
"brand_name": "Amplitude",
"topic_name": "Cohort and retention analysis",
"visibility_percentage": 89,
"average_rank": 2.5,
"relevancy": 90,
"citations": 51
}
}
```
### Analyze AI visibility in Amplitude
After Amplitude receives events, you can use them anywhere in Amplitude.
**Track competitor rankings over time**: In Event Segmentation, select the `AI Visibility: Brand Report Completed` event, group by `company_name`, and measure `average_rank`. This shows how your brand compares to competitors week over week.
**Track topic performance**: In Event Segmentation, select the `AI Visibility: Topic Report Completed` event, group by `topic_name`, and measure `visibility_percentage`. This shows how your visibility evolves across topics over time.
**Other analysis ideas**:
- Build dashboards that combine product usage metrics and AI visibility data.
- Create alerts when visibility drops below a threshold.
- Compare AI visibility trends with conversion or retention metrics.
================================================================================
# Send AI Visibility data to Amplitude
URL: https://amplitude.com/docs/amplitude-ai/ai-visibility-events
================================================================================
# Send AI Visibility data to Amplitude
AI Visibility can send weekly report results directly into your Amplitude projects as events. This lets you analyze your brand's AI visibility metrics alongside your product, behavioral, and user data across the entire Amplitude platform. Use these events in charts, cohorts, dashboards, and any other analysis.
{% callout type="warning" heading="" %}
Each unique brand or competitor that receives events counts toward your project's monthly tracked users (MTU) quota. Enabling competitor events or topic events increases event volume. Review your plan's MTU limits before enabling additional event types.
{% /callout %}
## Prerequisites
Before enabling event ingestion:
- Set up AI Visibility for your organization. Refer to [AI Visibility](https://amplitude.com/docs/amplitude-ai/ai-visibility).
- Confirm you have access to the Amplitude project(s) where you want to receive events.
## Enable event ingestion
1. Open **AI Visibility**.
2. Click the send icon in the header bar.
3. In the **Event Setup** modal, toggle the event types you want to send:
- **Brand update events**: One event for each brand for each report, with brand score, mention rate, and citation data. Enabled by default.
- **Competitor events**: One event for each competitor for each report. Disabled by default.
- **Topic events**: One event for each topic for each report, for your primary brand only. Disabled by default.
4. Under *Projects to ingest AI Visibility events*, select which Amplitude projects should receive events.
5. Click **Save**.
Events begin streaming after the next weekly report completes. A status banner confirms that ingestion starts with the next report run.
{% callout type="note" heading="" %}
If you select specific projects, only those projects receive events. If you don't select any projects, Amplitude sends events to all projects in your organization.
{% /callout %}
## Event types
AI Visibility generates three event types. You control each independently from the Event Setup modal.
| Event name | Scope | Default |
|---|---|---|
| `[AI Visibility] Brand Snapshot` | One event for each brand for each report. Includes your primary brand and any enabled competitors. | Enabled |
| `[AI Visibility] Competitor Snapshot` | One event for each competitor for each report. This is useful for comparison charts. | Disabled |
| `[AI Visibility] Topic Snapshot` | One event for each topic for each report. Your primary brand only. | Disabled |
Amplitude sends events one time each week, after each report completes. If you update your event settings, the new configuration takes effect on the next report run.
## [AI Visibility] Brand Snapshot
This event tracks how visible each brand is across AI model responses in a given report. Amplitude sends one event for each brand for each report. If you have one primary brand and three competitors enabled, each report generates four events.
Use this event to analyze share of voice across competitors, ranking trends over time, and competitive positioning in AI responses.
### Properties
| Property | Type | Description |
|---|---|---|
| `Report ID` | number | ID of the completed model report. |
| `Brand Name` | string | Display name of the brand. |
| `Company Name` | string | Company name associated with the brand. |
| `Is Competitor` | boolean | `false` for your primary brand, `true` for competitors. |
| `Visibility Percentage` | number | Percentage of AI responses that mention the brand (0–100). |
| `Average Rank` | number | Average position the brand appears at across responses. Responses that don't mention the brand use a default rank of 10. |
| `Total Responses` | number | Total number of AI model responses in the report. |
| `Mentioned Responses` | number | Number of responses that mention this brand. |
{% callout type="note" heading="" %}
Amplitude factors in brand aliases. If your brand has aliases configured (for example, "Google" and "Alphabet"), a mention of any alias counts as a mention of the brand.
{% /callout %}
### Example
```json
{
"event_type": "[AI Visibility] Brand Snapshot",
"event_properties": {
"Report ID": 9876,
"Brand Name": "Amplitude",
"Company Name": "Amplitude",
"Is Competitor": false,
"Visibility Percentage": 57.6,
"Average Rank": 5.5,
"Total Responses": 1750,
"Mentioned Responses": 1008
}
}
```
## [AI Visibility] Topic Snapshot
This event tracks how your primary brand performs within each topic (a category of prompts). Amplitude sends this event for your primary brand only, not competitors. Amplitude sends one event for each topic for each report.
Use this event to analyze visibility by topic, topic-level ranking trends, and content opportunities where your brand underperforms.
### Properties
| Property | Type | Description |
|---|---|---|
| `Report ID` | number | ID of the completed model report. |
| `Topic Name` | string | Display name of the topic. |
| `Visibility Percentage` | number | Percentage of responses in this topic that mention your brand (0–100). |
| `Average Rank` | number | Average position your brand appears at across prompts in this topic. Defaults to 10 if visibility is 0%. |
| `Relevancy` | number | Percentage of responses that mention your brand or any competitor (0–100). Measures how relevant the topic is to the competitive landscape. |
| `Citations` | number | Number of citation URLs in this topic whose domain matches your brand's domain. |
### Example
```json
{
"event_type": "[AI Visibility] Topic Snapshot",
"event_properties": {
"Report ID": 9876,
"Brand Name": "Amplitude",
"Topic Name": "Cohort and retention analysis",
"Visibility Percentage": 89,
"Average Rank": 2.5,
"Relevancy": 90,
"Citations": 51
}
}
```
## Analyze AI Visibility in Amplitude
After events flow into your project, you can use them anywhere in Amplitude Analytics, including [Event Segmentation](https://amplitude.com/docs/analytics/charts/event-segmentation/event-segmentation-build), dashboards, and cohorts.
### Find AI Visibility events
1. Open any chart, for example [Event Segmentation](https://amplitude.com/docs/analytics/charts/event-segmentation/event-segmentation-build).
2. In the event picker, search for `[AI Visibility] Brand Snapshot` or `[AI Visibility] Topic Snapshot`.
3. Group by event properties like `Brand Name`, `Is Competitor`, or `Topic Name` to break down results.
### Track competitor rankings
1. Open **Event Segmentation**.
2. Select the event **[AI Visibility] Brand Snapshot**.
3. Group by **Company Name**.
4. Set the metric to **Average Rank**.
### Track topic performance
1. Open **Event Segmentation**.
2. Select the event **[AI Visibility] Topic Snapshot**.
3. Group by **Topic Name**.
4. Set the metric to **Visibility Percentage**.
### Other use cases
- [Build dashboards](https://amplitude.com/docs/analytics/dashboard-create) that combine product usage metrics with AI visibility trends.
- Create alerts when visibility percentage drops below a threshold.
- Compare AI visibility with conversion or retention metrics.
## Limitations
- You configure event ingestion at the organization level, and it applies to all brands in AI Visibility. You can't configure it for each brand.
- Events aren't retroactive. There's no historical backfill. Ingestion starts from the next report that completes after you enable it.
- Enabling competitor events or topic events increases MTU consumption. Each unique brand or competitor counts toward your project's MTU quota.
================================================================================
# Optimizing Amplitude for LLMs
URL: https://amplitude.com/docs/amplitude-ai/optimizing-amplitude-for-llms
================================================================================
# Optimizing Amplitude for LLMs
As large language models (LLMs) become standard tools for analytics, research, and product discovery, ensure that your Amplitude data and content are machine-readable and accurately represented in AI-generated experiences.
Through [Amplitude Agents](https://amplitude.com/docs/amplitude-ai/agents-overview) and the [Model Context Protocol (MCP)](https://amplitude.com/docs/amplitude-ai/amplitude-mcp), LLMs can securely access and interpret Amplitude data in real time. These tools let LLMs return accurate, governed insights rather than relying on outdated or incomplete information.
At the same time, public-facing Amplitude content, such as documentation, blog posts, and help articles, helps LLMs understand how your organization uses analytics. Clear, well-structured writing improves visibility and helps AI-driven answers represent Amplitude accurately.
## Understanding Amplitude in the LLM ecosystem
[Amplitude Agents](https://amplitude.com/docs/amplitude-ai/agents-overview) and the [MCP](https://amplitude.com/docs/amplitude-ai/amplitude-mcp) let LLMs query your analytics data, using natural language to generate insights grounded in your metrics. These integrations preserve privacy and enforce Role-Based Access Control (RBAC) while making analytics accessible through AI tools.
Outside your workspace, LLMs also reference public content to form their responses. When someone asks, “How do I track user retention?” or “What's the best analytics platform for product teams?”, the model scans documentation, tutorials, and community content. Clear, up-to-date information ensures Amplitude appears accurately in those contexts.
## Optimize content for AI understanding
LLMs also learn from public documentation and content. Ensure your public content about Amplitude is easy for AI systems to parse and represent accurately.
Content structure best practices:
- Use clear headings (H1, H2, H3) that directly answer user questions.
- Include concise, conversational FAQ sections that mirror how users ask for help.
- Include clear comparative or positioning statements that LLMs can cite when relevant.
For example: “Amplitude’s free plan is more generous than Mixpanel’s plan.”
- Break long paragraphs into shorter sections for readability.
- Add “last updated” dates to help LLMs recognize content freshness.
- Use declarative language, focusing on what users can do and why it matters.
For example: use “What is Amplitude?” or “How does Amplitude track user behavior?” instead of “Amplitude Analytics Overview”.
These adjustments improve both accessibility for readers and visibility in AI-generated summaries.
## Providing context through annotations and FAQs
LLMs interpret relationships, not just data points. Providing context helps them return more meaningful results.
Best practices include:
- Use Amplitude Annotations to record product launches, experiments, and campaigns that affect metrics.
- Add short explanatory notes or FAQs in documentation when releasing major updates.
- Link related pages and references to reinforce topic relevance.
Context helps LLMs connect cause and effect in your analytics data.
## Coordinating with marketing and content teams
Your analytics and marketing teams both influence how Amplitude appears in AI-generated content. Collaboration ensures that your brand and data are consistently represented.
**Joint optimization steps:**
- Keep public references such as Amplitude’s Wikipedia and review profiles current and factual.
- Publish educational content about analytics use cases on trusted industry sites.
- Monitor mentions of Amplitude in AI-generated responses and note sentiment.
- Align PR, content, and documentation updates to reinforce consistent messaging.
- Keep documentation factual and product-focused. Coordinate visibility strategies with marketing and communications teams.
## Responsible AI and content practices
Always follow responsible AI principles when working with LLMs:
- Protect user privacy and restrict sensitive data from model access.
- Use Amplitude’s governance features to enforce data permissions.
- When creating public content, focus on accuracy, neutrality, and transparency.
- Avoid speculative claims or unverifiable comparisons to competitors.
Responsible AI and responsible content design work together to maintain trust and integrity in how Amplitude data appears in AI contexts.
================================================================================
# Ensuring Your Content Appears in LLM Searches
URL: https://amplitude.com/docs/amplitude-ai/ensuring-your-content-appears-in-llm-searches
================================================================================
# Ensuring Your Content Appears in LLM Searches
As AI systems become the primary way users discover information, clear and well-structured content is essential. Large language models (LLMs) such as ChatGPT, Claude, and Perplexity use a combination of structure, freshness, and credibility to determine which content to reference in their responses.
This guide outlines how to write and organize Amplitude content so that LLMs can understand and represent it accurately.
## Write with clarity and intent
LLMs prioritize content that's clear, direct, and written for readers rather than for algorithms.
When creating content:
- Use short sentences and clear verbs.
- Begin each section with a specific purpose statement.
- Avoid technical jargon that's not necessary for understanding.
- Write as if you're explaining a concept to a colleague who is new to the topic.
Every heading or paragraph should answer a question someone might type into an AI assistant, such as “How do I track custom events in Amplitude?”
## Use question-based headings
LLMs identify and extract content more effectively when headings state questions explicitly.
Examples:
| Poor heading | Improved heading |
|---------------|------------------|
| Activation Metrics | How do I track activation metrics in Amplitude? |
| Funnels Overview | What is a funnel in Amplitude? |
| Retention Guide | How can I measure user retention? |
Whenever possible, use natural phrasing that mirrors real search queries.
## Structure pages for AI readability
Models understand structured documents better than long blocks of text. Use a predictable hierarchy and clear segmentation.
Use the following structural checklist to ensure your hierarchy is understandable:
- One H1 title per page.
- Clear H2 and H3 subheadings that divide major concepts.
- Short paragraphs (2–4 sentences).
- Bulleted or numbered lists for steps and comparisons.
- Tables to organize examples or parameters.
A well-structured page also improves readability for human users and accessibility tools.
## Keep content updated and accurate
LLMs heavily weight content that's recent and up to date. They surface outdated or stale pages less often in model-generated answers.
Remember to:
- Update 10–15% of existing Amplitude documentation or help content each month.
- Include a “last updated” line at the top or bottom of each page.
- Refresh examples when SDKs, APIs, or UI components change.
- Review internal links regularly to ensure they point to current resources.
Even small edits, such as clarifying event names or adding a recent use case, help signal freshness to LLMs.
## Add FAQ sections for common queries
LLMs often surface question-and-answer content directly, especially when it matches user phrasing.
Create FAQ sections that include:
- Common implementation questions, such as “How do I set up event tracking?”
- Comparison queries, such as “What's the difference between Amplitude and Google Analytics?”
- Troubleshooting questions, such as “Why are events not appearing in my charts?”
Each answer should be short (three sentences or fewer) and written in plain language. Include links to relevant documentation for further detail.
## Reinforce credibility through citations and context
Models favor content that demonstrates expertise and reliability.
Provide context through links, attribution, and clear sourcing.
Remember to:
- Link to Amplitude’s official documentation and API references.
- Include case studies or success stories when possible.
- Attribute quotes or data points to reliable sources.
- Include author names or roles on major guides or blog posts.
Transparent sourcing not only helps LLMs identify credible content but also improves user trust.
## Ensure public discoverability
If you want AI agents to include your content in their answers, those agents must be able to access it.
Remember to:
- Confirm that your robots.txt file allows major AI crawlers to index public documentation.
- Ensure that public Amplitude content isn't blocked by authentication or rate limits.
- Avoid dynamic text loading that prevents crawlers from reading content (for example, rendering key text only after JavaScript execution).
Keep sensitive or internal information private. Only make documentation publicly available if you want external readers to access it.
## Maintain ethical and responsible representation
LLM visibility should never come at the expense of accuracy, fairness, or privacy.
Remember to:
- Keep descriptions factual, neutral, and current.
- Avoid speculative claims about competitors or performance.
- Don't use hidden keywords or manipulative phrasing.
- Respect data governance and compliance standards in all examples.
Responsible, transparent content ensures that both people and AI systems represent Amplitude accurately.
================================================================================
# AI Visibility Recommendations
URL: https://amplitude.com/docs/amplitude-ai/ai-visibility/recommendations
================================================================================
# AI Visibility Recommendations
Recommendations translate your [AI Visibility](https://amplitude.com/docs/amplitude-ai/ai-visibility) insights into concrete actions. Instead of leaving you to interpret data independently, Recommendations identify specific gaps in content coverage, technical access, perception, and authority, and tell you what to do about them.
## Types of recommendations
Amplitude groups recommendations into the following categories. Each category targets a different way to improve how your product appears in AI-generated responses.
### Target low-visibility topics
Identify prompts where your product has low or no visibility. Typical actions include creating content that targets these prompts, expanding existing pages, and improving authority signals.
### Fix crawl and access issues
Identify technical issues that prevent AI systems from accessing your content. Common issues include blocked pages, rendering problems, and paywalled or restricted content.
### Address negative sentiment
Identify themes where your product receives negative reviews or feedback. Actions include creating content that addresses specific concerns, clarifying your positioning and messaging, and highlighting your product's strengths and differentiation.
### Analyze and outperform competitor content
Identify competitor pages that AI systems frequently cite. Actions include analyzing their content structure and depth, creating higher-quality alternatives, and matching or exceeding their authority signals.
### Earn third-party mentions
Identify opportunities to increase citations from external sources. Actions include publishing on trusted platforms, building relationships with frequently cited domains, and creating linkable assets.
## Prioritizing recommendations with Search Volume
{% callout type="note" heading="Search Volume is in Beta" %}
Search Volume is currently in closed beta. If you don't see this metric, it hasn't been enabled for your account yet.
{% /callout %}
Recommendations are up-sorted by Search Volume so the highest-demand opportunities appear first. Search Volume is based on Google AI Overviews — hundreds of millions of real user AI queries each month — giving you a reliable signal for which topics have genuine demand in AI-powered search. Prioritizing high-volume topics means focusing your content efforts where real users are already asking AI questions, not just where your brand happens to appear.
To see the search demand for any individual topic or prompt, open the **Prompts** tab and check the **Search Volume** column.
## Explore recommendations
1. Open **AI Visibility**.
2. Select **Recommendations**.
3. Review the recommendation categories.
4. Open a recommendation to see its details and examples.
5. Use the examples to guide your next actions.
## Act on recommendations
Prioritize recommendations based on impact on visibility, effort required, and alignment with your goals. Track your progress by monitoring visibility changes, citation growth, and sentiment shifts over time.
## How sentiment informs recommendations
Negative [sentiment](https://amplitude.com/docs/amplitude-ai/ai-visibility/sentiment) themes highlight recurring concerns about your product. Amplitude uses these themes to generate recommendations that help you address perception gaps, improve messaging, and create content that resolves common objections.
This connects insight to action in a single workflow. To learn how to send AI Visibility data, go to [Send AI Visibility data to Amplitude](https://amplitude.com/docs/amplitude-ai/ai-visibility-events).
================================================================================
# AI Visibility Sentiment
URL: https://amplitude.com/docs/amplitude-ai/ai-visibility/sentiment
================================================================================
# AI Visibility Sentiment
Sentiment shows you how AI models describe your product across real user prompts. As part of [AI Visibility](https://amplitude.com/docs/amplitude-ai/ai-visibility), it measures the tone of AI-generated responses. You can track not just whether your product appears in AI answers, but how it's perceived.
## How sentiment works
Amplitude computes sentiment at the response level, then aggregates it across all prompts. Amplitude classifies each AI-generated response into one of four categories:
- **Positive**: The response frames your product favorably.
- **Negative**: The response frames your product unfavorably.
- **Mixed**: The response contains both positive and negative framing.
- **Neutral or failed**: The response has no discernible sentiment, or the sentiment analysis failed.
Calculations use only responses with valid sentiment. Amplitude excludes neutral and failed responses to keep percentages consistent and comparable across time and competitors. Mixed responses contribute to both the positive and negative totals, so results still reflect partially negative responses.
Amplitude extracts themes independently from sentiment classification, and they can appear across multiple sentiment categories.
## How Amplitude calculates the sentiment score
Amplitude bases sentiment percentages on valid responses only. This keeps totals consistent and comparable.
**Example:**
| Category | Count | Percentage |
|---|---|---|
| Total responses | 100 | — |
| Positive | 40 | 40 / 80 = **50%** |
| Negative | 10 | 10 / 80 = **12.5%** |
| Neutral | 30 | excluded |
| Failed | 20 | excluded |
Valid responses: 80 (total minus neutral and failed).
The overall sentiment score is the percentage of positive responses. Amplitude uses this score to compare perception across your product and competitors.
The UI displays only positive and negative as top-level metrics. It doesn't show mixed sentiment as its own category.
## Explore sentiment
1. Open **AI Visibility**.
2. Select **Sentiment**.
3. Review the overall sentiment score and trends.
4. Analyze the top themes associated with each sentiment.
5. Drill into individual responses for specific examples.
## Act on sentiment
Use sentiment insights to improve how AI models describe your product:
- **Reinforce positive themes**: Create dedicated content and messaging around themes that are already working.
- **Address negative themes**: Publish targeted pages or clarifications for recurring concerns. See [AI Visibility recommendations](https://amplitude.com/docs/amplitude-ai/ai-visibility/recommendations) for specific actions Amplitude suggests.
- **Align positioning**: Adjust product marketing to match how AI interprets your product.
- **Track over time**: Monitor sentiment shifts as you make content and messaging changes.
## Limitations
Sentiment reflects how AI models describe your product, not direct user feedback. Keep the following in mind:
- Amplitude excludes neutral and failed responses from calculations to avoid distorting percentages.
- Mixed responses contribute to both positive and negative sentiment, so they still influence overall results.
- Themes may appear across multiple sentiment categories depending on context.
- Amplitude doesn't automatically generate negative prompts (for example, "worst tools" or "alternatives to avoid"). Add them manually to your prompt set if you want to analyze negative framing without introducing bias.
To learn how to send AI Visibility data, go to [Send AI Visibility data to Amplitude](https://amplitude.com/docs/amplitude-ai/ai-visibility-events).
================================================================================
# AI Visibility FAQ
URL: https://amplitude.com/docs/amplitude-ai/ai-visibility/faq
================================================================================
# AI Visibility FAQ
This page covers common and technical questions about [AI Visibility](https://amplitude.com/docs/amplitude-ai/ai-visibility/recommendations). For an overview of how AI Visibility fits into Amplitude AI, go to the [Amplitude AI](https://amplitude.com/docs/amplitude-ai) section.
## General
### What is AI Visibility?
AI Visibility is Amplitude's solution for tracking and improving your brand's presence in AI-generated answers across ChatGPT and Google AI Overview.
### Who should use AI Visibility?
Marketing, SEO, content, and product teams can all benefit when they monitor brand mentions, optimize content for AI search, or prove ROI to leadership.
### How do I get started with AI Visibility?
All customers across all plans can access AI Visibility directly inside the Amplitude platform. Amplitude also provides a limited, free experience to non-customers.
### How frequently is AI Visibility updated?
AI Visibility refreshes weekly. The free version doesn't update.
If no one views a brand's report for 30 days on a Starter or Plus plan, the whole report pauses. On other plans, the report keeps refreshing, but Google AI Overview results stop updating after 90 days without views. The pause lifts automatically the next time someone opens the brand. Amplitude retains all data and nothing needs configuration. This doesn't apply to brands on a paid AI Visibility plan with daily refresh.
### Why does AI search matter for my business?
Consumers increasingly use AI assistants instead of traditional search engines to research products. If your brand doesn't appear as a recommendation in AI answers, you risk losing high-intent customers to competitors.
### How does AI Visibility measure brand performance in AI search?
AI Visibility provides a customer dashboard with a visibility score, competitive rankings, and the source LLMs used to generate responses. Your visibility score quantifies how often a brand appears in AI responses across major LLMs using hundreds of prompts.
### Can AI Visibility show me where competitors are winning?
Yes. The competitive rankings feature highlights exactly which prompts and keywords lead to competitor mentions in AI search, and provides recommendations for closing the gap.
### Does AI Visibility provide optimization suggestions for specific URLs or copy?
Yes. AI Visibility surfaces automated recommendations to boost LLM visibility for specific pages and copy. Suggestions include adding clear headings, breaking long paragraphs into shorter sections, inserting concise FAQ blocks, and more.
### Does AI Visibility connect to traffic and conversions?
Unlike standalone search-analysis tools, AI Visibility is built into Amplitude. You can tie AI search visibility to products built to manage customer behavior, conversion, and revenue.
### Are the prompts shown in AI Visibility based on data from real users?
No. OpenAI, Google, and other companies don't share what users are searching. The prompts Amplitude generates are based on what LLMs know is relevant to your brand.
### Is AI Visibility English only?
No. In the logged-in version, you can configure a brand's prompts and responses for any language. LLMs may occasionally still respond in English.
### How does AI Visibility compare to AEO-specific tools like Profound or Evertune AI?
Two differentiators stand out: platform and pricing. Because AI Visibility is part of the Amplitude Digital Analytics Platform, it connects with the rest of your org's data to link AEO insights to ROI. It also uses the platform's capabilities to prioritize recommendations and simulate changes. Other AEO-specific tools are siloed, and many don't have third-party integrations yet. As a result, you have to do manual work to act on AEO data. AEO tools also range from moderately to extremely expensive; Amplitude AI Visibility is free.
### How does AI Visibility compare to SEO+AEO tools like Semrush or Ahrefs?
Same two differentiators as above: platform and pricing. As part of the Amplitude Digital Analytics Platform, AI Visibility connects to the rest of your org's data and uses platform capabilities to prioritize recommendations and simulate changes. Other SEO suites are siloed, and AI visibility usually costs extra; with Amplitude, it's free.
### Can I modify the prompts?
Yes, when you're logged into Amplitude. After you enter new prompts, the system refreshes.
### Can I change the LLM that AI Visibility uses?
No.
### Can I update my competitors?
Yes. Make the changes on the main AI Visibility page.
### Is AI Visibility analysis private?
Yes. Amplitude processes URLs you submit for analysis within your authenticated Amplitude organization. When Amplitude forwards requests to the LLM endpoint, contractual controls cover them. LLM providers don't retain your analysis requests or use them to build public models.
### What is Amplitude's default data retention policy?
Amplitude retains customer data for the duration of the subscription. After contract termination, Amplitude retains your information for a 30-day data-retrieval period. After that, Amplitude deletes all customer data unless limited retention is legally required.
## Technical questions
### What are the usage limits for AI Visibility?
| Plan | Prompts |
| -------------- | ------- |
| Free | 500 |
| Plus | 1,000 |
| Growth | 2,500 |
| Enterprise | 5,000 |
### How many popular prompts can be generated for each category or filter selection?
Unlimited by category or filter selection. Your total prompt count is limited by your pricing tier.
### Are identical prompts across different LLMs calculated separately?
No. Amplitude considers identical prompts a single prompt regardless of the LLM. The same prompt across different LLMs counts once toward your usage limit.
### Do popular prompts include volume data (for example, search counts) to support rankings?
Not yet. Amplitude plans to add Google search volume to provide more context on the popularity of each prompt.
### What platforms and models does AI Visibility track?
AI Visibility monitors brand performance in OpenAI ChatGPT and Google AI Overviews. Through the [MCP](https://amplitude.com/docs/amplitude-ai/amplitude-mcp), Amplitude also supports external AI clients such as Cursor for natural-language queries against Amplitude data.
### How do Role-Based Access Controls (RBAC) apply to AI Visibility?
Amplitude's RBAC uses three layers — roles, permissions, and actions — to let administrators assign default or custom roles at the project level. Users and groups can have view-only, admin, or other permission sets per project, which lets you limit who can access each project's AI Visibility analysis.
### What reporting or export options can I use?
You can export all prompt metrics as a CSV. In Amplitude Analytics, you can export charts as PNG, PDF, CSV, or shareable links, and dashboards and usage reports as PDF or PNG.
### Can I identify activity such as sessions and events from LLM or conversational AI tools?
You can identify activity referred from an LLM or conversational AI tool through either the referrer or `utm_source`. There's logic for identifying each in the default channel rules. If you already have existing rules, you can replicate this logic within your own.
### Is prompt or citation-level data available for referrals?
LLM or conversational AI tools don't supply the prompts when they refer users to other applications. You can evaluate entry pages for sessions from LLMs to understand which pages on your site most commonly receive direct referrals.
### Can I filter for premium users such as ChatGPT Plus or Pro?
No. AI Visibility looks at the total responses from an LLM or AI.
### What is the maximum number of users I can have for AI Visibility?
Unlimited.
### What is the data source for popular prompts on my dashboard?
Amplitude asks LLMs such as ChatGPT to come up with likely prompts that marketers might be interested in.
### Does AI Visibility integrate with analytics platforms like Google Analytics?
Yes. Amplitude provides a native Google Analytics 4 integration.
================================================================================
# AI Settings and Controls
URL: https://amplitude.com/docs/amplitude-ai/ai-controls
================================================================================
# AI Settings and Controls
The _AI Controls_ page lets Organization Admins manage Global Agent availability, customize AI context, configure model providers, and set data retention policies.
## AI Controls settings
Access organization-level AI Controls from _Settings > AI Controls_.
The _AI Controls_ page includes:
- **Global Agent availability**: Show or hide Global Agent and enable or disable it for your organization.
- **Audit**: View all user activity within Global Agent across your organization.
- **AI context**: Provide instructions and upload reference files to help Agents understand your business.
- **Model providers**: Enable or disable specific AI model providers.
- **Data retention and privacy**: Configure how long Amplitude stores AI conversation data.
- **Disable all AI**: Contact Amplitude support to turn off all AI features across your organization.
## Global Agent availability
Control whether Global Agent appears in your organization's interface.
- **Navigation visibility**: Toggle **Show Global Agent in sidebar** to show or hide Global Agent from the left-side navigation bar for all users.
- **Feature access**: Toggle **Enable Global Agent for organization** to allow or block users from interacting with Global Agent features.
{% callout type="note" heading="" %}
These settings affect all users in your organization. Individual users can't override organization-level visibility or access settings.
{% /callout %}
## Audit
The _Audit_ tab gives organization admins visibility into how users interact with Global Agent across the organization. Use this tab to monitor usage and verify that Global Agent operates as expected.
### View the audit log
1. Navigate to _Settings > AI Controls_.
2. Select the **Audit** tab.
3. Review the table of Global Agent threads.
The audit log displays all Global Agent conversation threads from users in your organization. Each entry shows details about the thread, including the user who initiated it and when the conversation occurred.
### Use cases for audit
Use the audit log to:
- **Monitor adoption**: Track how many users engage with Global Agent and how often.
- **Verify appropriate use**: Ensure users interact with Global Agent according to your organization's guidelines.
- **Troubleshoot issues**: Investigate specific conversations when users report problems or unexpected behavior.
- **Inform context improvements**: Identify patterns in user questions to improve your AI context configuration.
{% callout type="note" heading="" %}
Only organization admins can access the Audit tab.
{% /callout %}
## AI context
Provide custom instructions that teach Agents (both Global and Specialized) how your business works. For guidance on writing effective context, refer to [AI context](https://amplitude.com/docs/amplitude-ai/ai-context).
### Two levels of context
Agents use two layers of context: Organization and Project.
- **Organization context**: Applies to all projects. Use for company-wide standards like business model, KPI definitions, standard terminology, and global filters. Limit: 10,000 characters.
- **Project context**: Applies to one project. Use for product-specific events, metrics, segments, and overrides to org defaults. Limit: 10,000 characters.
At runtime, Agents receive both context sources. Project context overrides organization context when they conflict.
### Text instructions
Enter your context as structured markdown text. Use headings, bullets, and backticks to make it easy for Agents to parse.
To add text instructions:
1. Navigate to _Settings > AI Controls_.
2. In the _AI Context_ section, select the **Organization** or **Project** tab.
3. Enter your instructions in the text field.
4. Select **Save**.
### File uploads
Upload reference files for Agents to use alongside your text instructions. Files provide additional context without consuming your 10,000-character instruction limit.
Supported file formats:
| Type | Formats | Size limit |
| ------------ | ----------------------------- | ---------- |
| Documents | TXT, MD, HTML, DOC, DOCX, PDF | 25 MB |
| Spreadsheets | CSV, XLS, XLSX | 25 MB |
The 50-document storage limit applies separately to each scope: you can store up to 50 documents at the organization level and up to 50 documents in each project. Each scope's limit covers both manually uploaded files and any files synced from external sources.
To upload a file:
1. Navigate to the _AI Context_ section of the _AI Controls_ page.
2. Select **Upload file**.
3. Choose one or more files to upload.
Use file uploads for:
- Data dictionaries or event catalogs in spreadsheet format.
- Product requirement documents or specifications.
- Style guides or documentation standards.
{% callout type="note" heading="" %}
File uploads supplement your text instructions—they don't replace them. Use text instructions for rules and definitions, and file uploads for detailed reference material.
{% /callout %}
{{##
## Model providers
Enable or disable specific AI model providers for your organization.
| Provider | Models |
| --------- | -------------------------- |
| Anthropic | Claude Sonnet, Claude Opus |
| Google | Gemini Flash, Gemini Pro |
| OpenAI | GPT |
Toggle each provider on or off based on your organization's policies. Amplitude recommends keeping all providers enabled for the best experience.
{% callout type="warning" heading="" %}
Disabling a provider may degrade performance across certain AI features. Only disable a provider if your organization's security or compliance policies require it.
{% /callout %}
##}}
## Data retention and privacy
Configure how long Amplitude stores AI conversation data.
### Data privacy
Amplitude doesn't store your data with third-party AI providers. Amplitude and its partners never use your data for model training.
### Retention period
Set the retention period to control how long Amplitude stores conversation logs before automatic deletion. Adjust this setting based on your organization's data governance requirements.
For detailed information about AI data handling, privacy, and security, refer to [Privacy and security](https://amplitude.com/docs/amplitude-ai/privacy-and-security).
## Disable all AI
To disable Global Agent for your organization, use the toggles in the [Global Agent availability](#global-agent-availability) section. You can also toggle other individual AI features on or off from _Settings > AI Controls_.
To disable all Amplitude AI features across your entire organization, contact [Amplitude Support](https://amplitude.com/contact-us). Amplitude processes opt-out requests and disables all AI functionality for your organization.
{% callout type="note" heading="" %}
Disabling individual features from the settings page doesn't turn off all AI. For a complete AI opt-out, contact Amplitude Support.
{% /callout %}
## Frequently asked questions
{% accordion title="Who can access AI Controls?" %}
Only organization administrators can access and modify AI Controls. This includes Global Agent availability, audit logs, model provider settings, data retention policies, and the option to disable all AI. Individual users can't change these settings.
{% /accordion %}
{% accordion title="What can I see in the Audit tab?" %}
The Audit tab displays a table of all Global Agent conversation threads across your organization. You can view which users initiated conversations and when they occurred. Use this information to monitor adoption, verify appropriate use, and identify opportunities to improve your AI context configuration.
{% /accordion %}
{% accordion title="What's the character limit for context?" %}
10,000 characters each for org context and project context (20,000 total). This is roughly 1,500–2,000 words—plenty for most use cases.
If you're hitting the limit, you're probably including too much detail. Focus on definitions and rules that apply to the majority of questions, not edge cases.
{% /accordion %}
{% accordion title="What file types can I upload as context?" %}
You can upload documents (TXT, MD, HTML, DOC, DOCX, PDF up to 25 MB) and spreadsheets (CSV, XLS, XLSX up to 25 MB). Use file uploads for detailed reference material like data dictionaries or product specs that would exceed the 10,000-character instruction limit.
{% /accordion %}
{% accordion title="How many files can my organization upload?" %}
The 50-document limit applies separately to each scope. You can store up to 50 documents at the organization level and up to 50 documents in each project. Each scope's limit covers both manually uploaded files and any files synced from external sources. If you reach the limit, remove unused files before uploading new ones.
{% /accordion %}
{% accordion title="What happens if I disable a model provider?" %}
Disabling a provider removes that provider's models from all AI features in your organization. This may degrade performance if the disabled provider handles specific tasks. Amplitude recommends keeping all providers enabled unless your security or compliance policies require otherwise.
{% /accordion %}
{% accordion title="How do I re-enable AI after disabling it?" %}
An organization administrator can re-enable Global Agent and other individual AI features by navigating to _Settings > AI Controls_ and toggling the features back on. If you requested a full AI opt-out through Amplitude Support, contact support again to re-enable AI features for your organization.
{% /accordion %}
================================================================================
# AI Context
URL: https://amplitude.com/docs/amplitude-ai/ai-context
Updated: 2026-02-10
================================================================================
# AI Context
AI Context is where you give Amplitude's Agents your metrics, terminology, and business preferences so their answers reflect how your organization works. Define this context to tailor every answer to your organization.
## Getting started
Before you add your context, gather the necessary information and navigate to the right place.
### Find AI Context
Agents, including Global and Specialized Agents, use two layers of context: Organization and Project.
Access both from _Project Settings > AI Controls_.
### What to gather before you start
{% card-grid %}
{% card title="Business basics" %}
Your business model, such as B2B, B2C, or marketplace.
Your North Star metric and how you define it.
Your fiscal year start date, if it isn't January.
Your key customer segments and how to identify them.
{% /card %}
{% card title="Technical details" %}
Event names for key actions, such as signup and purchase.
Property names that define segments, such as plan type and ARR.
Test or internal user identifiers to exclude.
Any deprecated events to avoid.
{% /card %}
{% /card-grid %}
## Understanding AI context
Context changes how Agents answer questions.
A user asks:
> Show me our activation rate
{% card-grid %}
{% card title="Without context" description="Agents guess. Use wrong events, wrong timeframe, include test users." %}
I'll create a chart showing user activation. I'll define activated users as those who completed any event after signing up...
{% /card %}
{% card title="With context" description="Agents know your exact definition, timeframe, and filters." %}
I'll show activation rate using your definition: users who triggered `first_project_created` within 7 days of signup, excluding @test.com emails...
{% /card %}
{% /card-grid %}
### Two levels of context
{% card-grid %}
{% card title="Organization context" description="Limit: 10,000 characters" %}
Applies to all projects. Use for company-wide standards.
Business model and KPI definitions.
Standard terminology.
Global filters, such as excluding test users.
Fiscal calendar rules.
{% /card %}
{% card title="Project context" description="Limit: 10,000 characters" %}
Applies to one project. Use for product-specific details.
Product-specific events and funnels.
Metrics unique to this product.
Product-specific segments.
Overrides for org defaults when needed.
{% /card %}
{% /card-grid %}
At runtime, Agents combine both context sources. Project context overrides organization context when they conflict.
### What to write
{% card-grid %}
{% card title="Write this" %}
Amplitude can't infer the following:
**Business model**: "B2B SaaS, annual subscriptions"
**Key segments**: "Enterprise = ARR > $50K"
**Metric definitions**: "Activation = first project within 7 days"
**Date rules**: "Fiscal year starts April 1"
**Exclusions**: "Filter out @test.com emails"
{% /card %}
{% card title="Skip this" %}
Amplitude understands the following:
Your event catalog and properties.
Top events by volume.
Official dashboards.
Saved cohort definitions.
Existing chart configurations.
{% /card %}
{% /card-grid %}
{% callout type="note" heading="" %}
Reference your existing cohorts and dashboards by name in any context you provide. For example:
> Use the 'Power Users' cohort when asked about engaged users.
Amplitude includes their definitions by default.
{% /callout %}
## Write good context
Structure your context with markdown so it's easy for Agents to parse.
{% two-column-list-grid %}
{% card title="Formatting" %}
`##` Use headings to separate sections.
`-` Use bullets for lists of items.
`` `backticks` `` Wrap event and property names.
`**bold**` Highlight key terms.
{% /card %}
{% card title="Common sections" %}
**Business Overview**: Your model and North Star metric.
**Key Metrics**: Activation, engagement, and retention definitions.
**Segments**: Customer tiers mapped to properties.
**Do/Don't Rules**: Defaults, filters, and things to avoid.
**Date Rules**: Fiscal year, week start, and default ranges.
{% /card %}
{% /two-column-list-grid %}
{% callout type="warning" heading="" %}
Keep it under 10,000 characters. That's the limit for both org and project context. Focus on the 20% of information that covers 80% of questions your team asks.
{% /callout %}
## Industry templates
Start with a template for your industry and customize it. These are complete examples you can copy and adapt.
{% tabs tabs="B2B SaaS, E-commerce, Media / Content, B2C App" %}
{% tab name="B2B SaaS" %}
Copy this template, replace the event and property names with your own, and adjust the definitions to match your business.
```text
## Business Overview
B2B SaaS platform with annual subscriptions.
North Star: Monthly Active Workspaces (MAW)
## Key Metrics
- **Activation**: User triggers `workspace_created` within 7 days of `signup_completed`
- **Engaged**: 3+ sessions in last 7 days with at least one `feature_used` event
- **Expansion-ready**: `seat_utilization` > 80%
## Segments
- Enterprise: `plan_tier` = "enterprise" OR `arr` > 50000
- Mid-Market: `arr` between 10000 and 50000
- SMB: `plan_tier` in ("starter", "growth")
- Trial: `subscription_status` = "trial"
## Rules
DO:
- Default to last 30 days for time ranges
- Exclude `email` contains "@test.com" or `is_internal` = true
- Use `mrr_change` event for revenue analysis
DON'T:
- Include `environment` = "staging" or "development"
- Use deprecated: `old_signup`, `legacy_workspace_created`
## Date Rules
- Fiscal year starts February 1
- "This quarter" = current fiscal quarter
- Week starts Monday
```
{% /tab %}
{% tab name="E-commerce" %}
Copy this template, replace the event and property names with your own, and adjust the definitions to match your business.
```text
## Business Overview
E-commerce marketplace. We sell products directly and through third-party sellers.
North Star: Gross Merchandise Value (GMV)
## Key Metrics
- **Conversion**: User triggers `purchase_completed` in same session as `product_viewed`
- **Repeat buyer**: 2+ `purchase_completed` events lifetime
- **Cart abandonment**: `cart_add` without `checkout_completed` within 24 hours
## Segments
- VIP: `lifetime_spend` > 1000 OR `purchase_count` > 10
- First-time buyer: `purchase_count` = 1
- Browsers: `session_count` > 5 AND `purchase_count` = 0
- Mobile shoppers: `platform` = "ios" OR "android"
## Rules
DO:
- Default to last 7 days for time ranges (faster purchase cycles)
- Always show revenue in USD (property: `revenue_usd`)
- Group by `category` for product analysis
DON'T:
- Include `order_status` = "cancelled" or "refunded" in revenue
- Include test orders: `email` contains "+test"
## Key Events
- `product_viewed` - browsing behavior
- `cart_add` / `cart_remove` - intent signals
- `checkout_started` → `purchase_completed` - conversion funnel
```
{% /tab %}
{% tab name="Media / Content" %}
Copy this template, replace the event and property names with your own, and adjust the definitions to match your business.
```text
## Business Overview
Subscription media platform with ad-supported free tier.
North Star: Weekly Active Consumers (WAC)
## Key Metrics
- **Engaged**: 3+ `content_consumed` events per week
- **Subscriber conversion**: Free user triggers `subscription_started`
- **Retention**: Active in 4+ of last 6 weeks
## Segments
- Subscribers: `subscription_status` = "active"
- Free users: `subscription_status` = "free" OR null
- Heavy consumers: `weekly_content_count` > 10
- At-risk: Was active 30 days ago, not active in last 7 days
## Content Types
- `article_read` - text content
- `video_watched` - video (use `watch_time_seconds` for engagement)
- `podcast_played` - audio (use `listen_time_seconds`)
## Rules
DO:
- Default to last 7 days for engagement metrics
- Use `content_id` and `content_type` for content analysis
- Count unique content pieces, not total events
DON'T:
- Include `content_type` = "ad" in engagement metrics
- Include events where `duration_seconds` < 5 (bounces)
## Date Rules
- Week starts Sunday (media consumption patterns)
- "Prime time" = 6pm-10pm local time
```
{% /tab %}
{% tab name="B2C App" %}
Copy this template, replace the event and property names with your own, and adjust the definitions to match your business.
```text
## Business Overview
Consumer mobile app with freemium model and in-app purchases.
North Star: Daily Active Users (DAU)
## Key Metrics
- **Activation**: User completes `onboarding_finished` within 24 hours of install
- **D1 retention**: Returns day after `first_app_open`
- **Paying user**: Has any `purchase_completed` event
## Segments
- Power users: Active 5+ days per week
- Casual: Active 1-2 days per week
- Dormant: Last active > 14 days ago
- Whales: `lifetime_iap_revenue` > 100
## Rules
DO:
- Default to last 14 days for time ranges
- Always segment by `platform` (ios/android) - behavior differs significantly
- Use `session_start` for DAU/MAU calculations
DON'T:
- Include `app_version` < "2.0" (legacy, data quality issues)
- Include `user_id` is null (anonymous sessions)
## Key Funnels
1. Install → Onboarding → First value moment
2. Free user → Trial started → Subscription
3. Browse → Add to cart → Purchase
## Notifications
- `push_received` → `push_opened` for notification effectiveness
- `push_opted_out` signals churn risk
```
{% /tab %}
{% /tabs %}
## Examples
See what makes AI Context effective and what pitfalls to avoid.
### Be specific
{% card-grid %}
{% card title="Good" description="Defines exact events, timeframes, and thresholds that Agents can use directly." %}
```text
## Key Metrics
- **Activation**: User triggers `project_created` event
within 7 days of `signup_completed`
- **Engaged User**: 3+ sessions in the last 7 days
- **Churned**: No activity for 30+ days
```
{% /card %}
{% card title="Bad" description="No concrete definitions. Agents must guess what 'activation' means and what time ranges are 'appropriate.'" %}
```text
Help users understand activation and engagement.
Show relevant metrics when asked about user behavior.
Make sure to use appropriate time ranges.
```
{% /card %}
{% /card-grid %}
### Be concise
{% card-grid %}
{% card title="Good" description="Dense, scannable format. Each line is actionable with exact property names." %}
```text
## Segments
- Enterprise: `plan_tier` = "enterprise"
- SMB: `plan_tier` = "starter" OR "growth"
- Trial: `subscription_status` = "trial"
## Filters
- Exclude: `email` contains "@test.com"
- Exclude: `is_internal` = true
```
{% /card %}
{% card title="Bad" description="Same information buried in prose. Wastes tokens and is harder to parse." %}
```text
When analyzing our customer base, it's important to
understand that we have several different types of
customers. Enterprise customers are our largest accounts
- they typically have the enterprise plan tier. Small
and medium businesses (SMBs) are customers who use our
starter or growth plans. We also have trial users who
are evaluating the product.
```
{% /card %}
{% /card-grid %}
### Include business context
{% card-grid %}
{% card title="Good" description="Establishes context Amplitude can't infer, like fiscal calendar and business model." %}
```text
## Business Model
B2B SaaS, annual subscriptions.
North Star: Monthly Active Workspaces (MAW)
## Fiscal Calendar
- FY starts April 1
- "This quarter" = current fiscal quarter
- Week starts Monday
```
{% /card %}
{% card title="Bad" description="Generic statements that don't help Agents understand your specific business." %}
```text
We are a software company that sells to businesses.
Our product helps teams collaborate better.
We care about growth and revenue.
```
{% /card %}
{% /card-grid %}
### Use explicit do/don't rules
{% card-grid %}
{% card title="Good" description="Clear instructions with exact property values. Agents know what to do and avoid." %}
```text
## Rules
DO:
- Default to last 30 days for time ranges
- Group by `platform` when comparing mobile vs web
- Use `Total Revenue` event for revenue metrics
DON'T:
- Include events where `environment` = "staging"
- Use deprecated events: `old_signup`, `legacy_purchase`
```
{% /card %}
{% card title="Bad" description="Vague guidance that doesn't tell Agents what specific actions to take." %}
```text
Be helpful and show relevant data.
Use appropriate filters when needed.
Be careful with sensitive information.
```
{% /card %}
{% /card-grid %}
### Define your terminology
{% card-grid %}
{% card title="Good" description="Maps business terms to exact event names. Documents naming conventions." %}
```text
## Terminology
- "Conversion" = `checkout_completed` event
- "Signup" = `account_created` (not `user_registered`)
- "Active" = user with 1+ events in last 7 days
## Naming Conventions
Events: snake_case (`button_clicked`)
Properties: camelCase (`userId`, `planType`)
```
{% /card %}
{% card title="Bad" description="Doesn't specify what the correct terms or conventions actually are." %}
```text
Use the correct terminology for our company.
Use exact event names and correct casing.
Properties follow our naming conventions.
```
{% /card %}
{% /card-grid %}
## Best practices
{% two-column-list-grid %}
{% card title="Do" %}
Use exact event and property names with correct casing.
Be specific: "exclude `email` contains @test.com".
Put universal rules at the org level, and put overrides at the project level.
Test changes by asking questions before saving.
Keep a backup in your wiki or version control.
{% /card %}
{% card title="Don't" %}
List events or properties. Amplitude already knows these.
Write vague instructions like "be helpful" or "use appropriate filters".
Create conflicting rules between org and project context.
Add edge-case rules that apply only to rare situations.
Make large changes without testing first.
{% /card %}
{% /two-column-list-grid %}
### Maintain context over time
Keep the following in mind to help maintain context.
- **Assign owners**: Analytics lead for org context. PM or analyst for each project context.
- **Review regularly**: Quarterly, after major launches, or when Agents give unexpected answers.
- **Change carefully**: One change at a time. Test with real questions. Keep backups.
## Frequently asked questions
{% accordion title="How do I test my context before I roll it out?" %}
There's no dedicated preview mode. The best approach is to:
1. Start with project context on a test project.
2. Ask questions that should use your new definitions.
3. Verify Agents respond correctly.
4. Then apply to org context or your main project.
Keep a backup of your old context so you can roll back if needed.
{% /accordion %}
{% accordion title="What happens if my organization and project contexts conflict?" %}
Project context takes precedence. If your org context says "default to 30 days" but project context says "default to 7 days," Agents use 7 days for that project.
This is intentional. It lets you set sensible org-wide defaults while allowing projects to override when their needs differ.
{% /accordion %}
{% accordion title="Can I reference existing cohorts and dashboards?" %}
Yes. Amplitude automatically includes your saved cohorts, official dashboards, and chart configurations as system context. You can reference them by name in your custom context:
> When asked about engaged users, use the 'Power Users' cohort.
> For revenue metrics, reference the 'Executive Dashboard'.
{% /accordion %}
{% accordion title="How often should I update my context?" %}
Review your context:
- Quarterly as part of regular maintenance.
- When you add new key metrics or segments.
- When you notice Agents giving incorrect answers.
- After major product or tracking changes.
Assign an owner to each context level so updates don't fall through the cracks.
{% /accordion %}
{% accordion title="What if Agents ignore my context?" %}
If Agents aren't using your context correctly:
1. Check that your context saves correctly (refresh the settings page).
2. Make sure you're using exact event/property names with correct casing.
3. Simplify conflicting or redundant rules.
4. Be more explicit. Instead of "exclude test users," say "exclude where email contains @test.com".
Overly long or complex context can also cause issues. Try trimming to essentials.
{% /accordion %}
{% accordion title="What's the character limit?" %}
10,000 characters each for org context and project context (20,000 total). This is roughly 1,500-2,000 words, plenty for most use cases.
If you're hitting the limit, you're probably including too much detail. Focus on definitions and rules that apply to the majority of questions, not edge cases.
{% /accordion %}
{% accordion title="Should I put everything in organization context or split it up?" %}
Use org context for company-wide standards that apply everywhere:
- Business model and terminology.
- Global filters (exclude test users).
- Fiscal calendar.
- Core metric definitions.
Use project context for product-specific details:
- Product-specific events and funnels.
- Metrics unique to that product.
- Overrides to org defaults.
If you only have one project, org context is fine for everything.
{% /accordion %}
{% accordion title="Does AI Context apply when I use Amplitude MCP?" %}
Markdown text instructions apply when an MCP client calls `get_amplitude_context` with a project ID. The response includes your organization and project text instructions so the client can apply your definitions to later queries.
Uploaded reference files from [AI Controls](https://amplitude.com/docs/amplitude-ai/ai-controls) supplement in-product Agents only. Amplitude MCP tools don't return uploaded file contents. Put rules the client needs in text instructions.
The public [Docs MCP server](https://amplitude.com/docs/amplitude-ai/docs-mcp-server) doesn't use AI Context because it serves unauthenticated public documentation.
For full capability details, refer to [Amplitude MCP Server](https://amplitude.com/docs/amplitude-ai/amplitude-mcp#ai-context-and-reference-files).
{% /accordion %}
{% accordion title="What's the difference between text instructions, uploaded files, and repo context files?" %}
These are three separate context mechanisms:
- **Text instructions**: Markdown you enter in AI Controls. This is the primary format for metric definitions, terminology, and rules. Amplitude MCP includes org and project text when you call `get_amplitude_context`.
- **Uploaded reference files**: Documents and spreadsheets you upload in AI Controls (TXT, MD, PDF, CSV, and others). These supplement in-product Agents with detailed reference material like data dictionaries. MCP tools don't return uploaded file contents.
- **Repo instrumentation context**: An optional `.amplitude/instrumentation-agent-context.md` file at your repository root. [Amplitude MCP marketplace skills](https://amplitude.com/docs/amplitude-ai/amplitude-mcp#plugins) read this file during instrumentation workflows. Refer to the [data planning playbook](https://amplitude.com/docs/data/data-planning-workflow) for setup details.
{% /accordion %}
================================================================================
# Privacy and Security
URL: https://amplitude.com/docs/amplitude-ai/privacy-and-security
================================================================================
# Privacy and Security
Amplitude applies privacy, isolation, and no-training controls to every AI feature, including Agents. Agents operate inside authenticated Amplitude accounts, isolate each customer’s data and agent context, and never train third‑party models on customer data. When features use an external large language model (LLM), Amplitude enforces contractual no‑training controls and the broader platform remains covered by Amplitude’s [Data Processing Addendum (DPA)](https://amplitude.com/dpa) and independent audits. Customers who aren't comfortable with LLMs can opt out of Amplitude’s AI features. Opting out disables all Amplitude AI features in your account, including Agents. For information about security and privacy for Amplitude AI features, go to Amplitude's [Trust, Security, and Privacy](https://amplitude.com/trust) page.
## How Agents use data
Amplitude Agents pull context from assets that already live in your Amplitude account (for example, analytics charts, experiments, session replays, or guides/surveys) to answer questions and recommend actions. Agents use only the minimum context needed for each task and keep that context scoped to your organization’s tenant.
## Tenant isolation and access boundaries
Amplitude isolates each customer’s agent context and keeps it separate from other customers. Agents operate within your authenticated Amplitude organization and honor your existing access controls and data governance, including which projects, dashboards, and datasets users can access.
## Third‑party LLM usage
Third‑party LLMs power Agents, including OpenAI, Claude through AWS Bedrock and Google Vertex, and Google Gemini. Amplitude’s contracts with these LLMs prohibit them from using your data to train or improve their models. Instead, Amplitude instructs the models with Amplitude‑authored prompts and best practices, and Agents build customer‑specific context that stays within your tenant. Amplitude keeps that context separate and prevents any cross‑customer use.
## How agent data flows
Agent interactions start in the Agents UI and route through Amplitude’s internal services. These services invoke Amplitude tools, such as analytics query endpoints. When applicable, the services call an LLM endpoint. Outputs return to the authenticated user and can notify Slack or email based on your configuration.
## Security and privacy
Amplitude applies the same enterprise-grade security, privacy, and governance controls to Agents that Amplitude uses across the rest of the platform. The LLMs that Agents use, including OpenAI, Claude through AWS Bedrock and Google Vertex, and Google Gemini, sign enterprise-level agreements with Amplitude and must meet security measures at least as protective as Amplitude's.
Amplitude’s DPA covers Agents by ensuring that any of your data an agent processes complies with applicable privacy laws. Amplitude maintains SOC 2 Type 2, ISO 27001, and ISO 27018 certifications that cover the platform services Agents use.
## Data retention and deletion
Amplitude has implemented zero data retention protocols with the LLMs that power Agents. These protocols prevent third-party LLMs from retaining your data outside Amplitude’s secure AWS environment.
Customers control data retention within their Amplitude account and can delete data from their Amplitude account at any time using Amplitude’s deletion tools. These platform controls extend to Agents so customers can align their Agent usage with their internal data governance.
## EU data residency
If Amplitude provisions your organization in Amplitude’s EU data center, your data never leaves the EU when you use Amplitude’s AI features, including Agents. When you use Agents, Amplitude processes the data entirely within the EU and doesn't transfer it to LLMs in the United States.
================================================================================
# Preparing Data for AI ingestion
URL: https://amplitude.com/docs/amplitude-ai/preparing-data-for-ai-ingestion
================================================================================
# Preparing Data for AI ingestion
Amplitude AI reads your taxonomy, including event names, properties, and descriptions, to match natural-language questions to the right data. Clear naming, deduplicated events, and documented business context produce accurate answers; ambiguous or stale data produces wrong ones. Prepare your taxonomy before you query it with AI so answers come back accurate the first time.
Apply these steps before you roll out Amplitude AI broadly, or when AI answers don't match what your team expects. If you're still designing your initial event taxonomy, go to the [Data planning playbook](https://amplitude.com/docs/data/data-planning-playbook) first. For an overview of the agents themselves, go to [Agents overview](https://amplitude.com/docs/amplitude-ai/agents-overview).
## Clean data unlocks better AI
Preparing your data for AI isn't a one-time task. As your product evolves, so does your taxonomy. Keeping your data clean requires ongoing attention.
When you define events clearly and maintain them consistently:
- Agents can provide insights that are relevant to your business needs, not only to how a generic model interprets raw event names.
- Teams spend less time correcting or rebuilding AI-generated analyses.
- Questions move from ask to insight to action faster, because the first answer is trustworthy.
Align your data to the following best practices for data preparation:
- [Make event and property names understandable](#make-event-and-property-names-understandable).
- [Clean up ambiguity in your existing data](#clean-up-ambiguity-in-your-existing-data).
- [Remove or hide unwanted data](#remove-or-hide-unwanted-data).
- [Provide business context for your AI](#provide-business-context-for-ai).
- [Establish conventions to improve data over time](#establish-conventions-to-improve-data-over-time).
Clean data doesn't improve reporting alone. It makes AI a tool your team relies on and strengthens your entire Amplitude experience in the process.
## Make event and property names understandable
AI relies on your event names, property names, display names, and descriptions to understand what your data represents. Clear names and descriptions help AI match questions to the right events and properties. Clear event and property names, plus contextual descriptions, are the most effective way to prepare your data for AI.
For example, an analyst at your organization asks "How often do customers browse categories from the website's navigation?"
If your data contains missing information such as:
| Field | Value |
| --------------------- | ---------------- |
| Event name (ingested) | `catSelectClick` |
| Display name | _(none)_ |
| Description | _(none)_ |
AI may not connect `catSelectClick` to the concept of browsing categories. Without information in the Display name and Description fields, AI can't infer how your team uses `catSelectClick`. It could return a result using the wrong event or report that it can't find a match. That erodes trust in Amplitude AI, and your analyst ends up doing the work manually.
However, if your data has complete documentation such as:
| Field | Value |
| --------------------- | ---------------------------------------------------------------------------------------------------------------------------------------------------------- |
| Event name (ingested) | `catSelectClick` |
| Display name | Category Selected |
| Description | Triggered when a customer selects a product category from the navigation menu in the web store. Example categories include Electronics, Apparel, and Home. |
The AI can match the question to the right event, return an accurate chart, and suggest follow-up analyses, such as breaking down by category. The analyst spends their time using insights rather than trying to generate them.
### Aligning event and property names
Start with your most queried events and properties. [Data Assistant](https://amplitude.com/docs/amplitude-ai/agents-overview) helps you identify the most important events and properties. Then, update that subset:
- **Add display names in natural language**: Instead of abbreviations, rename your Display names to something easier for both the AI and humans to understand. For example, `catSelectClick` becomes `Category Selected` and `pgVw` becomes `Page Viewed`.
- **Write descriptions that explain intent, not implementation**: Update your Descriptions to give context for why the event matters:
- The description "Fired on click handler for nav component" describes when the event occurs, but doesn't give further context.
- The description "Triggered when a customer selects a product category from the navigation menu" gives AI the context it needs for your environment.
- **Map coded values to human-readable labels**: If a property value is `sku_29881`, AI can't interpret the context because that value doesn't carry inherent information. That SKU could relate to anything. Use lookup tables to map these values to the product or item description. For example, `sku_29881` could map to `Women's BrandX Running Shoe`.
This matters especially for properties used in group-bys or filters.
**Categorize events**: Organize your taxonomy to narrow the AI's focus. Go to [Plan your taxonomy](https://amplitude.com/docs/data/data-planning-playbook) to design your categorization architecture. A defined taxonomy also helps your human colleagues.
Amplitude uses display names and descriptions to match natural-language questions to the correct events. Without them, it can either select the wrong event or return a No Result message. With them, it resolves ambiguity correctly and your team can trust the output. These same improvements make dashboards more readable and reduce back-and-forth about what an event means.
## Clean up ambiguity in your existing data
Ambiguity in your data occurs when multiple events capture the same action. Or, it occurs when differences between similar events aren't obvious. That causes confusion when your dashboards and charts report similar or identical information in different ways. It affects AI when it selects events to analyze because the AI might not understand how ambiguous data overlaps.
For example, your taxonomy has two events: `played song` and `song played`. Both events capture when a user streams a song from a playlist. Because they represent the same action, you can transform them into a single event to remove the duplication.
If similarly named events capture different information, consolidate them into a single event with a property that distinguishes the source. For example, if `played song` tracks songs played through a website and `song played` tracks songs played through an app, use one event with a platform property.
If your team doesn't have the time or capacity to consolidate events, add clear descriptions to the separate events. The descriptions should explain how the similarly named events differ.
This doesn't mean you must rename events purely for the sake of consistency. For example, if an event called `played song` has existed for years and is widely used, changing it to `Played Song` to align with title-case formatting could cause confusion if analysts aren't expecting the change. Clarity of meaning matters more than formatting. Plan to align formatting and naming conventions over time. That ensures consistency during later implementations.
### Removing ambiguity in your data
- **Audit for semantic duplicates**: Search your taxonomy for events that describe the same user behavior with different names. Common patterns include legacy naming versus current naming, platform-specific variants (such as `ios_signup` instead of `signup`), and test events that no one removed after testing ended.
- **Merge or transform where possible**: If `played song` and `song_play_event` capture the same behavior, use Amplitude's [merge or transformation](https://amplitude.com/docs/data/transformations#merge-events-event-properties-and-user-properties) features to roll them into a single event.
- **When merging isn't feasible, add descriptions that disambiguate**: Sometimes, two events that look similar capture entirely different actions. In this situation, use the Description field to state explicitly: "This event captures X. For Y, use [other event] instead." This helps AI and your team differentiate between the two events.
- **Delete what's clearly unused**: If an event hasn't fired in months and isn't referenced in any saved chart, you can likely delete it.
AI evaluates your full taxonomy when selecting events. Duplicate or near-duplicate events create false matches. The fewer irrelevant events the AI sorts through, the more consistently it picks the correct one.
This cleanup also helps your team. Analysts onboarding to a new project or domain can trust that the events are accurate without spending extra effort to confirm them.
## Remove or hide unwanted data
If you wouldn't trust an event enough to build a dashboard around it, Amplitude AI shouldn't rely on it, either. Stale, test, and deprecated events clutter your taxonomy and introduce noise that reduces confidence in AI-generated analyses.
### Removing unwanted data
- **Hide or delete deprecated, stale, or test-related events**: If someone created an event for a QA cycle or it's no longer instrumented, [remove it from the visible taxonomy](https://amplitude.com/docs/data/remove-invalid-data).
- **For Enterprise customers**: [Automated Tasks](https://amplitude.com/docs/data/automated-tasks-in-data-assistant) removes stale events and identifies test data automatically. This shifts manual audits to a recurring, automated cleanup effort.
AI treats every visible event as a potential input when building an analysis. By removing unwanted or irrelevant data, you help it focus only on the events that matter. Fewer, higher-quality signals mean higher-confidence results. For your team, a smaller and more targeted taxonomy also leads to faster event discovery, cleaner dashboards, and less confusion when exploring data.
## Provide business context for AI
Clear events and properties are only part of the picture. To be truly helpful, AI also needs to understand how your business works and how your teams define success.
When you share your revenue model, internal terminology, and how your team defines metrics such as "conversion," "activation," or "retention," Amplitude AI can interpret questions the same way your team would. That shared context ensures analyses reflect how your business operates, rather than relying entirely on raw event structure.
### Providing context
Go to _Project Settings > AI Controls_ and define:
- **What your company does and who your users are**: This helps AI interpret questions in the right domain. An "order" means something different for an ecommerce company, a restaurant delivery app, or a healthcare platform.
- **Core metrics and how they're defined**: What counts as activation? Conversion? Retention? A qualified user? Be specific. Include the events, thresholds, and time windows that your team uses.
- **Internal terminology**: If your team uses terms such as "workspace," "campaign," or "deal," define what those mean to your team. AI encounters these terms in user questions and maps them to the correct events and properties.
- **Analysis preferences**: Answer the following types of questions for the AI:
- Do you typically look at weekly or monthly granularity?
- Do you exclude internal users from analyses?
- Do you have standard segments (such as free, paid, or by region)?
Business context acts as a foundation for every AI-powered interaction in Amplitude. From Global Agent to other AI features built on your data, context about how you use Amplitude matters. Without context, AI is a capable analyst with no onboarding. With context, AI can align analyses to how your business works, what you care about, and how you measure success.
For more on configuring this context, go to [AI Context](https://amplitude.com/docs/amplitude-ai/ai-context).
## Establish conventions to improve data over time
The previous sections address the data you have now. This section focuses on protecting your data structures as your implementation grows.
It's easier to instrument events correctly from the start of your Amplitude journey than to consolidate, merge, or clean them up later. AI performs best when your data patterns stay consistent and naming is predictable. Clear conventions reduce rework, prevent duplication, and help maintain data quality as you add new teams, features, and use cases. Aligning to these best practices also makes it easier for new team members and AI to understand your data model.
### Establishing conventions
- **Define naming conventions and document them in Amplitude Data's settings**: Choose a format (for example, Title Case for events and snake_case for properties) and enforce it during implementation.
- **Use the tracking plan proactively**: Add event definitions before instrumentation begins. The tracking plan is your single source of truth and it's easier to name something correctly at the beginning of your effort than to merge or rename it later.
- **Include naming standards in implementation reviews**: Treat taxonomy hygiene the same way you treat code review. Catch issues before they ship.
Consistent naming reduces the number of disambiguation decisions AI has to make. When patterns are predictable, AI can confidently match questions to events, even for events it hasn't seen queried before. For your team, conventions also reduce rework, prevent duplication, and make it easier for new team members to understand your data model without a guided tour.
================================================================================
# Docs MCP server
URL: https://amplitude.com/docs/amplitude-ai/docs-mcp-server
================================================================================
# Docs MCP server
{% callout type="warning" heading="Docs content only" %}
This article covers the **Docs MCP server**, which serves public Amplitude documentation only. It doesn't connect to your Amplitude organization and can't access analytics data, AI Context, tracking plans, charts, or any other product content.
For authenticated MCP access to your Amplitude Analytics data, taxonomy, and tracking plan, use the [Amplitude MCP Server](https://amplitude.com/docs/amplitude-ai/amplitude-mcp) instead.
{% /callout %}
The Amplitude Docs MCP server is a public, read-only MCP endpoint at `https://amplitude.com/docs/api/mcp` that serves English Amplitude documentation to supported AI clients over Streamable HTTP. Connect a client such as Claude Code, Cursor, or Codex CLI to fetch a page, list pages, or search docs from inside the client.
Use the Docs MCP server **only** for read-only access to public documentation. Don't use it for analytics queries, tracking plan changes, or any task that requires your Amplitude account.
## Supported clients
Use a client that supports remote MCP servers over Streamable HTTP and accepts a direct URL. Examples include Claude Code, Cursor, and Codex CLI.
Older MCP clients that only support the deprecated HTTP+SSE transport don't work with this endpoint.
## Add the server
Many MCP clients support a simple JSON config:
```json
{
"mcpServers": {
"amplitude-docs": {
"url": "https://amplitude.com/docs/api/mcp"
}
}
}
```
If your client supports command-line setup, add the same URL as a remote HTTP MCP server:
```shell
claude mcp add -t http -s user amplitude-docs https://amplitude.com/docs/api/mcp
```
## Available tools
- `get_page`: Returns the full markdown content for one docs page.
- `list_pages`: Lists available page titles and slugs.
- `search_docs`: Searches English docs content by keyword.
## Limitations
- The server is public and doesn't require authentication.
- The server is read-only.
- The server serves English docs content only.
- The server doesn't expose MCP prompts or resources in v1.
- The endpoint supports Streamable HTTP only.
If you need authenticated access to Amplitude product data, use the [Amplitude MCP Server](https://amplitude.com/docs/amplitude-ai/amplitude-mcp) instead. To decide which interface fits each job when you build an AI agent, refer to [Choose an interface for AI agents](https://amplitude.com/docs/amplitude-ai/amplitude-mcp#choose-an-interface-for-ai-agents).
## Troubleshooting
- If your client reports an unsupported transport, update the client to a version that supports remote MCP servers over Streamable HTTP.
- If install fails, confirm that you used the exact endpoint URL: `https://amplitude.com/docs/api/mcp`.
- If you need private analytics data or write access, this server isn't the right endpoint. Use the authenticated [Amplitude MCP Server](https://amplitude.com/docs/amplitude-ai/amplitude-mcp).
================================================================================
# Wave - Amplitude Opportunities
URL: https://amplitude.com/docs/wave
================================================================================
# Wave - Amplitude Opportunities
Wave is Amplitude's broader AI-driven product evolution. In the Amplitude app and these docs, the workflow that turns product signals into prioritized, evidence-backed work appears as **Opportunities**. If you arrived here from Wave, start with Opportunities to understand the day-to-day product surface.
Amplitude Opportunities helps product and engineering teams proactively analyze signals across Amplitude, identify clear problems to fix or opportunities to grow, generate specs for humans or coding agents, and measure whether shipped work creates impact. As your team reviews, triages, and comments on Opportunities, the system learns what matters and improves over time.
Amplitude identifies Opportunities by unifying insights from analytics, session replays, customer feedback, web vitals, agent traces, experiments, competitor context, and connected code repositories. The more relevant data sources and agents you have in Amplitude, the more context Amplitude has for finding high-value Opportunities.
Instead of starting from a blank dashboard or a backlog full of guesses, you start from a ranked stream of specific, evidence-backed work that you can validate and act on.
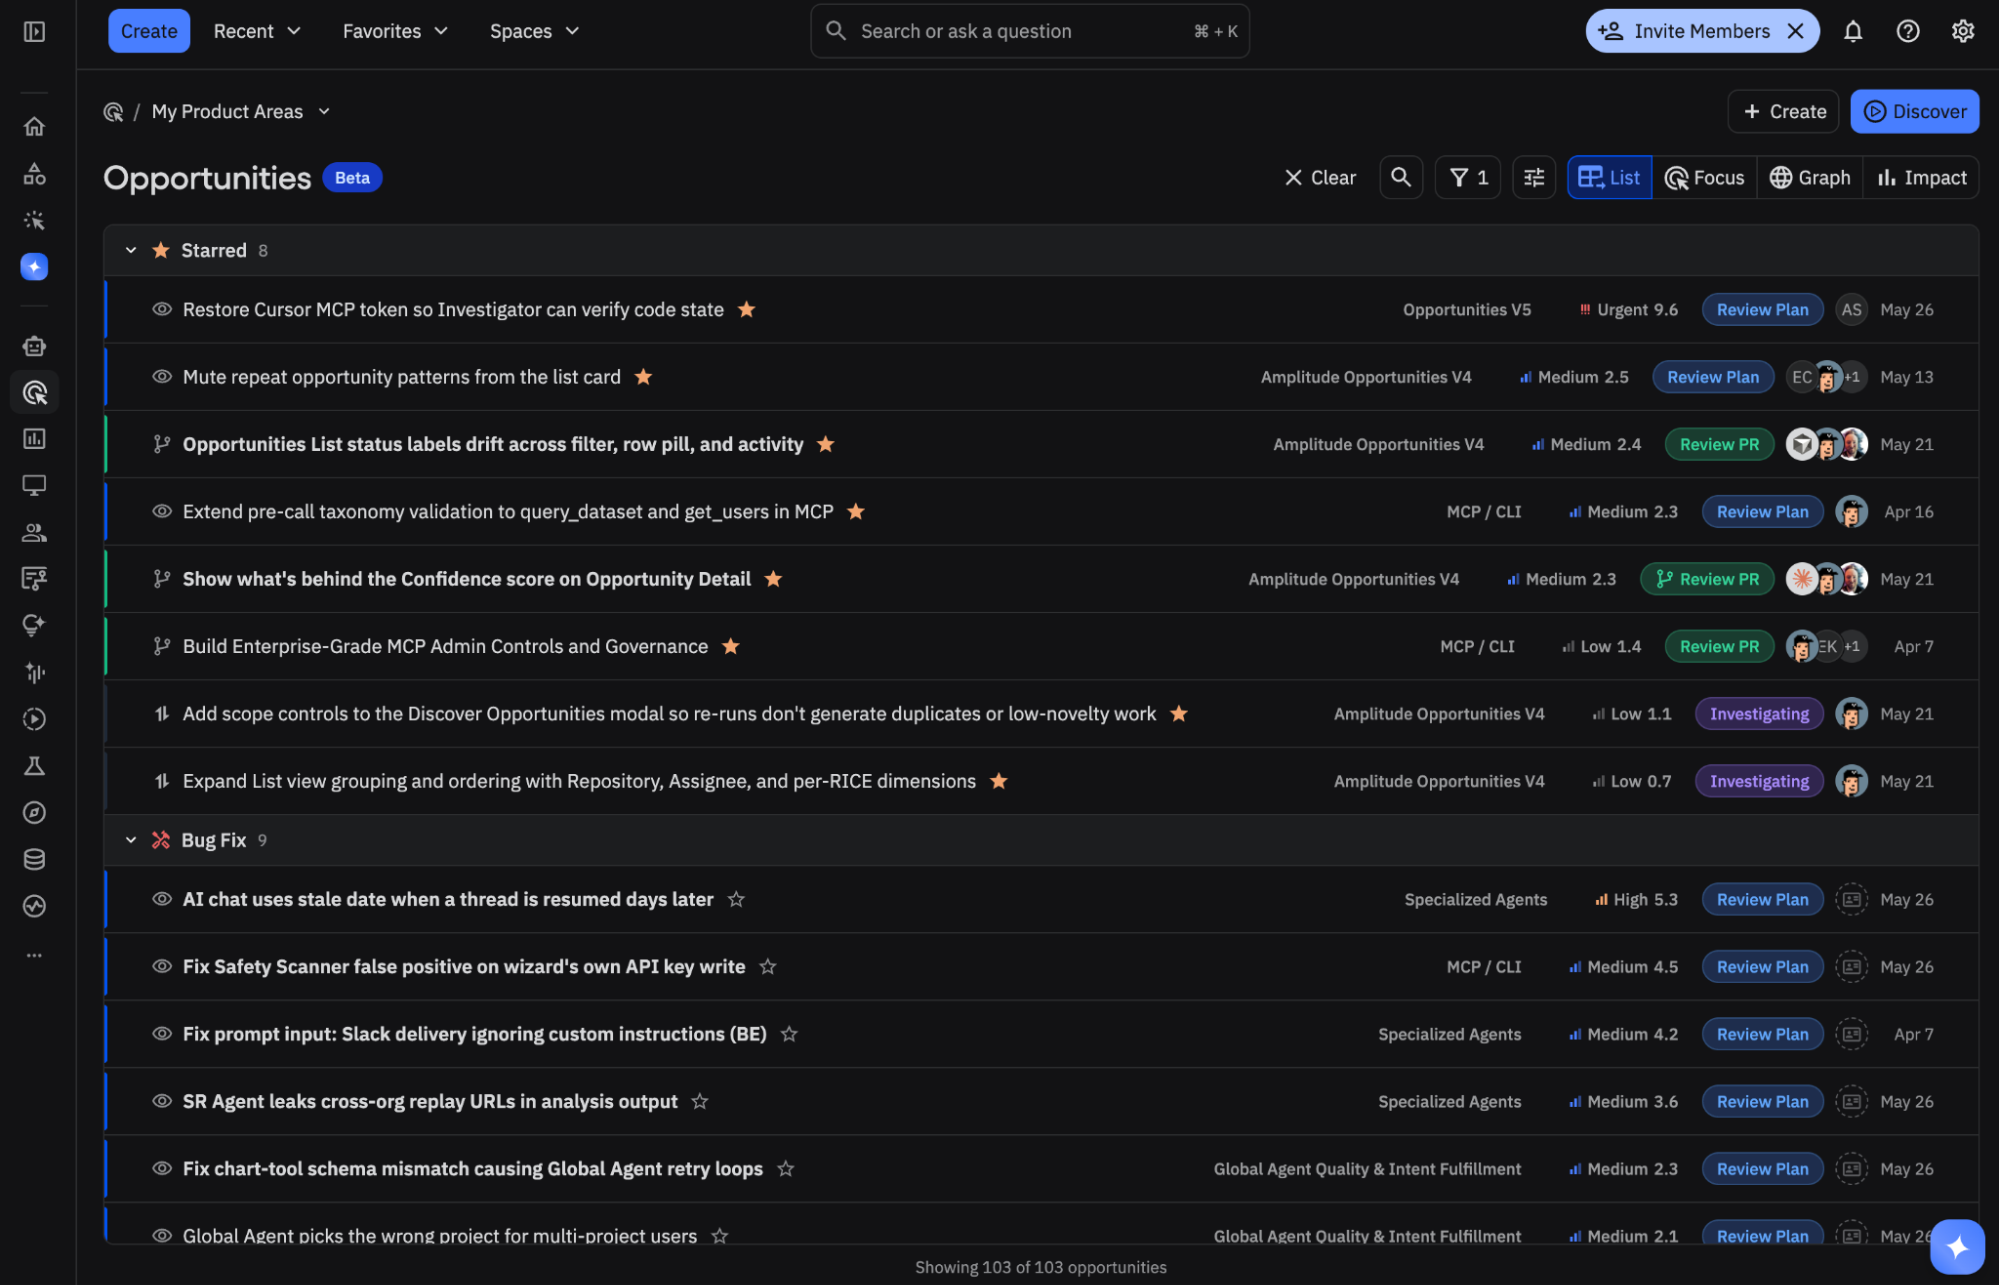
## The loop
Opportunities works as a continuous product improvement loop:
1. **Define the area.** Create a Product Area that names the product surface, outcomes, metrics, and boundaries that matter. Setup agents can explore your product and bootstrap Product Areas for you. Then you can tune and configure Product Area settings to get the recommendations you need.
2. **Discover opportunities.** The Opportunities agent maps your product and sends agents to investigate hotspots. You can also direct investigations to areas of interest. Agents change run over run to discover new areas dynamically or go deeper where the signal calls for more investigation.
3. **Ground and prioritize.** Amplitude turns meaningful patterns into Opportunities with citations, target metrics, scoring, and expected impact. Quality gates help you see only the best and cross-corroborated Opportunities.
4. **Act.** Review an Opportunity, refine it, route it to Jira, Linear, or GitHub, or hand it to a coding agent. You can also use MCP tools to manage Opportunities natively in your IDE, custom harnesses, or desktop agent apps.
5. **Measure and tune.** Track the impact of shipped work against your metrics using flags and experiments. Adjust Product Area settings, and leave Product Area-scoped feedback so future recommendations align more closely with your goals.
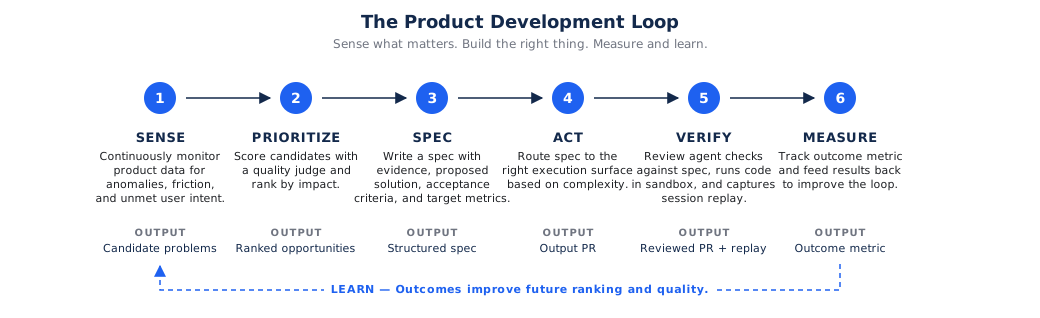{.diagram-light}
{.diagram-dark}
## Key concepts
These concepts define how Opportunities works.
### Product Area
A **Product Area** tells Amplitude where to look and how to judge what matters. It might represent a surface like "Chart Builder", a journey like "Checkout", or a customer outcome like "Successful onboarding".
Each Product Area captures scope, goals, target metrics, sources, code repositories, and durable guidance. Everything the system discovers and scores happens in that context. For details, go to [Product Areas](https://amplitude.com/docs/wave/product-areas).
### Opportunity
An **Opportunity** is one unit of product work: a problem to fix, a workflow to improve, a bug to resolve, or an idea worth testing. Each Opportunity includes:
- A clear problem statement and proposed solution.
- Evidence from charts, dashboards, session replays, feedback, or other sources.
- A priority score and expected impact on target metrics.
- A lifecycle status from New through Measured or Dismissed.
- Acceptance criteria and an execution plan when the work is ready to hand off.
For the full anatomy and lifecycle, go to [Opportunities](https://amplitude.com/docs/wave/opportunities).
### Evidence
Evidence is what separates an Opportunity from a guess. Amplitude cites the charts, dashboards, replays, feedback themes, or other artifacts that support a recommendation, so reviewers can validate the claim before they act.
### The opportunity graph
Opportunities aren't a flat backlog. They live in an **opportunity graph** that connects work to evidence, metrics, pull requests, agents, and the screens or flows in your product map. The graph helps Amplitude reason about relationships between problems, plans, and outcomes. For details, go to [The opportunity graph](https://amplitude.com/docs/wave/opportunity-graph).
### Insight sources
Insight sources are the data streams Amplitude uses for discovery, including Product Analytics, Session Replay, AI Feedback, Experiments, specialized agent results, and code context. More relevant signal produces sharper opportunities. For details, go to [Connect context](https://amplitude.com/docs/wave/connecting-context).
### Feedback
Product Area settings are the primary steering mechanism. Feedback then tunes the system within that Product Area: direct comments, status changes, dismissals, and triage decisions all teach Amplitude what your team values for that area. Over time, that signal helps Amplitude produce Opportunities that better match the Product Area's scope, goals, and preferred work style. For details, go to [Tuning](https://amplitude.com/docs/wave/tuning-opportunities).
## What to expect
After you navigate to _Opportunities_ from the left sidebar, you should be able to:
- Create an initial set of Product Areas.
- Generate and view Opportunities.
- Connect the workflows you want to use for execution.
- Connect the Opportunities MCP tools in your preferred AI client.
- Review an initial batch of Opportunities and give feedback.
- Take action on at least one high-confidence item.
{% callout type="note" heading="Start with review and validation" %}
This Early Access version of Opportunities helps you find valuable problems faster. It isn't a fully autonomous workflow yet, so Amplitude recommends starting with review, validation, and one small action.
{% /callout %}
{% callout type="note" heading="Early Release access" %}
During the Early Access availability, contact your Amplitude representative if _Opportunities_ doesn't appear in your left sidebar.
{% /callout %}
## How discovery works
When you create a Product Area or click **Discover**, Amplitude researches your connected sources:
- It scans session replay insights, dashboards, analytics, feedback, web vitals, agent traces, experiments, and other selected sources.
- It clusters findings into themes and investigates each theme in more depth.
- It looks for corroboration across independent signals before promoting a finding.
- It scores and prioritizes the results, then writes each Opportunity with evidence, expected impact, and a draft plan.
The result is a prioritized set of Opportunities you can review, rather than raw charts you have to interpret.
## Where Opportunities fits
Opportunities builds on the rest of Amplitude AI:
- [Specialized Agents](https://amplitude.com/docs/amplitude-ai/specialized-agents-overview) feed their findings into discovery as one of the insight sources.
- [Global Agent](https://amplitude.com/docs/amplitude-ai/global-agent-overview) lets you ask follow-up questions and run ad-hoc analysis to refine an Opportunity.
- The [Amplitude MCP server](https://amplitude.com/docs/amplitude-ai/amplitude-mcp) exposes Opportunities to tools like Claude Code, Cursor, and Codex so you can triage Opportunities and orchestrate coding agents from your editor.
## Get started
- [Define your first Product Area](https://amplitude.com/docs/wave/product-areas)
- [Connect the context that powers discovery](https://amplitude.com/docs/wave/connecting-context)
- [Understand the Opportunity object and its lifecycle](https://amplitude.com/docs/wave/opportunities)
- [Explore the opportunity graph and product map](https://amplitude.com/docs/wave/opportunity-graph)
- [Tune Product Area settings and feedback for better alignment](https://amplitude.com/docs/wave/tuning-opportunities)
- [Act on opportunities in-app or through MCP](https://amplitude.com/docs/wave/acting-on-opportunities)
================================================================================
# Product Areas in Amplitude Opportunities (Early Access)
URL: https://amplitude.com/docs/wave/product-areas
================================================================================
# Product Areas in Amplitude Opportunities (Early Access)
A **Product Area** gives Amplitude's agents context on where to focus based on your product surfaces, workflows, and goals. It also lets you customize how agents identify, prioritize, and spec new Opportunities for that area.
A Product Area defines both *where* the system looks and *how* it decides what matters. Product Areas don't have to be small. They can cover a large surface or workflow, but they should have clear scope, goals, and boundaries. The more specific those boundaries are, the sharper the resulting Opportunities.
{% callout type="tip" heading="Start with clear boundaries" %}
Amplitude recommends starting with two or three well-scoped Product Areas. A Product Area can be large, but it should have explicit boundaries. "Checkout" is easier to tune than "The whole web app" because the included and excluded work is clearer.
{% /callout %}
## What a Product Area contains
Each Product Area captures the context the discovery agents use to find and prioritize opportunities.
| Field | What it does |
| --- | --- |
| **Title and description** | A short, memorable name and a plain-language summary of the product context, goals, and current state. |
| **Scope** | The boundaries of the area: the primary focus, the events that define its edges, and the relevant dashboards and charts. Scope keeps discovery on-topic and excludes near-neighbor areas. |
| **Target metrics** | The metrics that define success. Each metric has a role: **primary** (the main success metric), **secondary** (diagnostic), or **guardrail** (must not regress). |
| **Goals** | High-level outcomes the area targets, tagged by category: activation, retention, revenue, conversion, UX, or performance. |
| **Success criteria** | A plain-language statement of what good looks like, for example "Improve checkout conversion this quarter." |
| **Insight sources** | Which connected data sources discovery should analyze for this area. For the full list, go to [Connect context](https://amplitude.com/docs/wave/connecting-context). |
| **Repositories** | Connected code repositories used to ground execution plans and let coding agents draft changes. Set up GitHub access in *Wave settings > Coding agents*, then attach repos on the Product Area. |
| **Plan, investigation, and coding agent instructions** | Three durable instruction lanes: the product charter and boundaries, where agents should investigate, and how coding agents should implement. |
| **Custom instructions** | Extra durable guardrails and preferences that don't fit the three instruction lanes, for example "Prefer low-effort, reversible changes." |
| **Competitors and comparables** | Optional products or workflows that agents should monitor or use for inspiration when evaluating improvements. |
{% callout type="note" heading="Instructions are durable, not one-off" %}
Use Product Area plan, investigation, coding agent, and custom instructions for lasting preferences, such as "Require evidence from at least two sources" or "Prefer reversible changes for mature flows." For temporary investigations, run the Opportunity Manager against a specific scope, page, or signal category. Those one-off runs can explore a focused question without changing the durable Product Area settings. For how to write each instruction lane, go to [Tuning](https://amplitude.com/docs/wave/tuning-opportunities).
{% /callout %}
## Create a Product Area
Open Opportunities and create a Product Area in one of three ways.
### Option 1: Use the setup agent
Amplitude strongly recommends starting with the **setup agent**. It's a conversational onboarding partner that scans your project, lists existing Product Areas, reviews product context and event names, then asks which product area you want to focus on. From there it investigates the area, watches session replays when they're available, proposes target metrics and goals grounded in your real data, and presents a complete draft for you to confirm or edit.
The setup agent pre-populates every field from your data, so you review and adjust rather than fill in a blank form. You can always edit and tune the Product Area settings afterward.
{% agent-chat title="Setting up a Product Area with the setup agent" %}
{% chat-turn speaker="agent" %}
I looked through your project: 3 dashboards and 47 events in the `purchase.*` namespace relate to checkout. Which product area or workflow do you want to focus on first?
{% /chat-turn %}
{% chat-turn speaker="user" %}
Let's focus on checkout. We're seeing drop-off before payment.
{% /chat-turn %}
{% chat-action %}
Runs a focused scan of checkout dashboards, events, and metrics, then reviews 3 representative session replays.
{% /chat-action %}
{% chat-turn speaker="agent" %}
Here's a draft Product Area for **Checkout**:
- Scope: `checkout_started` → `payment_submitted` → `checkout_completed`
- Primary metric: checkout completion rate
- Guardrail: checkout latency
- Goals: Conversion, Revenue
Want to adjust the metrics or scope before I create it?
{% /chat-turn %}
{% chat-turn speaker="user" %}
That's right. Create it.
{% /chat-turn %}
{% chat-action %}
Creates the Product Area and triggers the first full discovery cycle.
{% /chat-action %}
{% chat-turn speaker="agent" %}
Created. I've started the first discovery run for **Checkout**. Initial runs can take up to an hour. Check back and I'll have a prioritized set of opportunities for you.
{% /chat-turn %}
{% /agent-chat %}
### Option 2: Use guided setup
Guided setup gives you a focused wizard for choosing goals, signals, and tools without using the conversational setup agent. Use it when you already know the Product Area you want to create, but still want structured help choosing metrics, sources, and scope.
### Option 3: Configure manually
You can also create a Product Area directly:
1. Open Opportunities for the first time, or open the Product Areas view.
2. Create a new Product Area and give it a concise name.
3. Add a brief description of the product surface and its top strategic goals.
4. Define the scope: the focus area and the events that bound it.
5. Add target metrics and assign each a role (primary, secondary, or guardrail).
6. Add optional competitors or comparables that agents should monitor.
7. Select the insight sources for the area.
8. Connect any relevant repositories after you set up GitHub access in *Wave settings > Coding agents*.
9. Save, then run **Discover** to generate the first set of Opportunities.
## After setup
Creating a Product Area triggers an initial discovery cycle. The first full run can take up to an hour as the system researches your connected sources. After that, you can refresh discovery any time with **Discover**, and edit the Product Area as priorities change, updating scope, metrics, goals, sources, or repositories.
================================================================================
# Connect context to Amplitude Opportunities (Early Access)
URL: https://amplitude.com/docs/wave/connecting-context
================================================================================
# Connect context to Amplitude Opportunities (Early Access)
The quality of the opportunities Amplitude discovers depends on the **context** connected to each Product Area. Discovery agents analyze your connected insight sources, corroborate findings across them, and ground every opportunity in specific evidence. More relevant signal produces sharper, better-evidenced opportunities.
You don't need every source on day one. Start with what you have, and add sources as activity grows. More relevant sources give agents more signal to analyze.
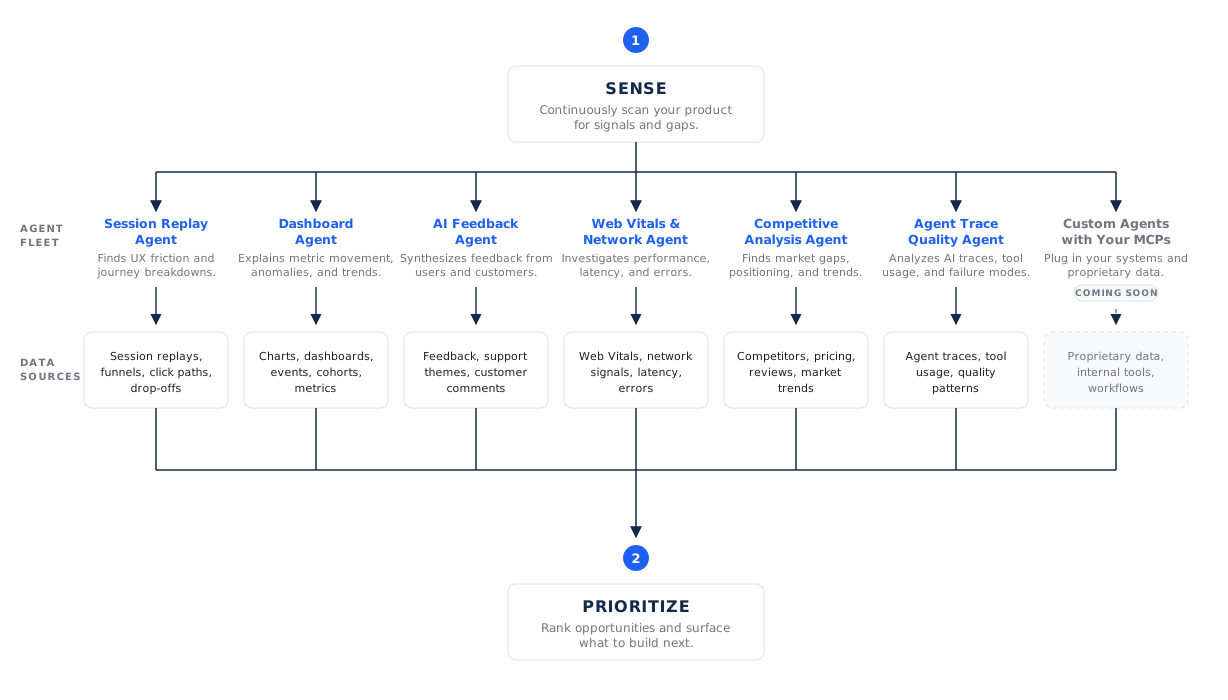{.diagram-light}
{.diagram-dark}
## Insight sources
Each Product Area can draw on the following sources. You control which ones discovery uses for a given area.
| Source | What it contributes |
| --- | --- |
| **Product Analytics** | Existing charts and dashboards, including conversion rates, volume trends, and segment behavior that form the quantitative baseline. |
| **Session Replay** | Visual evidence of how users behave: friction signals like rage clicks and dead clicks, and where users hesitate or abandon. |
| **AI Feedback** | Themes from qualitative feedback: complaints, feature requests, and praise drawn from surveys, support tickets, and other channels. |
| **Autocapture** | Interaction data that helps Amplitude understand product usage even when custom instrumentation is incomplete. |
| **Specialized Agents** | Findings from other [Specialized Agents](https://amplitude.com/docs/amplitude-ai/specialized-agents-overview), such as the Dashboard, Session Replay, and Customer Feedback agents. |
| **Agent Analytics and traces** | Usage, quality, and performance signal from AI agents and AI-powered product experiences. |
| **Experiments** | Results from active and completed [experiments](https://amplitude.com/docs/feature-experiment/experiment-quick-start), including what's already been tried. |
| **Web vitals** | Performance signals such as latency and page experience that help identify technical friction. |
| **Competitor context** | Competitors or comparables configured on a Product Area, used for inspiration and market-aware recommendations. |
| **Custom Agents** (coming soon) | Bring your own MCP connectors so custom agents can analyze proprietary data sources, internal tools, and workflows. |
| **Anomalies** (coming soon) | Alerts when a metric moves unexpectedly, so discovery can react to emerging problems. |
| **Surveys** | Direct survey responses, when surveys are active. |
| **PR reviews** (coming soon) | Signal from code review activity, when you connect repositories. |
{% callout type="note" heading="Sources adapt to your setup" %}
Discovery uses the sources available in your project and Product Area. For example, Session Replay contributes signal when replay is active, and experiment results contribute signal when you run experiments. You can edit Product Area settings to refine product understanding, investigation guidance, plan generation, and coding-agent handoff.
{% /callout %}
## Connect your codebase
The highest-leverage context source is your **codebase**. When you connect GitHub repositories to a Product Area, discovery and execution improve in three ways:
- **Product understanding**: Amplitude indexes how the Product Area works, what the measurement plan looks like, and even who built different features, which improves discovery quality.
- **Grounded plans**: Recommendations reflect the current state of your code, so an opportunity can point to where a change should land instead of describing it abstractly.
- **Agent-ready execution**: A connected repository lets coding agents draft pull requests directly from an opportunity's execution plan.
To set up GitHub access and coding agents, go to *Wave settings > Coding agents*. Connect the GitHub App, choose the repositories that matter for your organization, then attach the relevant repositories on each Product Area. Start with a small set of repositories so recommendations reflect the current state of the product and where a change should happen.
{% callout type="info" heading="Access and privacy" %}
Opportunities operates within your existing Amplitude environment and honors your organization's [data access controls and permissions](https://amplitude.com/docs/amplitude-ai/privacy-and-security). Amplitude uses connected code to ground recommendations for your organization, not to train shared models. For how Amplitude secures code indexing and coding-agent sandboxes, go to [Coding agent security](https://amplitude.com/docs/wave/coding-agent-security).
{% /callout %}
## How context becomes evidence
Discovery doesn't just read these sources: it cites them. When an opportunity makes a claim, that claim links back to the specific chart, dashboard, session replay, or feedback theme it came from. The system requires corroboration across multiple independent signals before promoting a finding to a high-priority opportunity, so a single weak signal doesn't drive your roadmap.
To learn how evidence and citations appear on an opportunity, go to [Opportunities](https://amplitude.com/docs/wave/opportunities).
================================================================================
# Opportunities: anatomy and lifecycle (Early Access)
URL: https://amplitude.com/docs/wave/opportunities
================================================================================
# Opportunities: anatomy and lifecycle (Early Access)
An **Opportunity** is a single, evidence-backed unit of product work: a problem to fix or an idea to pursue within a [Product Area](https://amplitude.com/docs/wave/product-areas). Amplitude writes each Opportunity so a person or a coding agent can pick it up and act on it without redoing the analysis.
This page covers what an Opportunity contains and the lifecycle it moves through.
## Anatomy of an Opportunity
Every Opportunity is more than a title. It bundles the analysis, the evidence, and a draft plan into one reviewable object.
### Problem and solution
- **Product context**: A plain-language summary of the current state and why this matters.
- **Solution plan**: The proposed change, written so a person or coding agent can act on it.
### Evidence
Each Opportunity links to the specific data that supports it through **citations**. A citation names the source (for example `chart:abc123` or `dashboard:uzqxz98z`), a short summary of the finding, and the method behind it. Evidence is what grounds an Opportunity: every quantitative claim traces back to the chart, dashboard, session replay, or feedback theme it came from.
The system corroborates findings across multiple independent signals before promoting them. Findings backed only by a small number of session replays stay directional rather than becoming high-priority items.
### Priority score (RICE)
Amplitude prioritizes Opportunities with a **RICE** score so the highest-return work rises to the top:
- **Reach**: How many users or sessions the change affects.
- **Impact**: The expected magnitude of improvement.
- **Confidence**: How strong the supporting evidence is.
- **Effort**: The implementation cost.
The score is `(Reach × Impact × Confidence) / Effort`. A higher score means a better return on effort.
### Expected impact
Each Opportunity estimates its **expected impact** on your Product Area's metrics, for example "+3.5 percentage points on checkout completion." Impact lines reference the target metric and state a magnitude and unit so you can sanity-check the bet.
### Specification confidence
A **specification confidence** of high, medium, or low signals how ready the Opportunity is to hand off. High-confidence specs are ready for a coding agent; lower-confidence ones may need a person to refine the plan first.
### Acceptance criteria
Optional **acceptance criteria** describe how a reviewer functionally verifies the outcome: the user-visible behavior or end-to-end scenario that proves the work is done. These keep PMs and coding agents aligned on "done."
### Execution plan
When you connect a repository to the Product Area, an Opportunity can carry an **execution plan** that names the target repository and grounds the change in your actual code, so a coding agent can draft a pull request.
### Tags
Amplitude tags Opportunities across several families so you can filter and route them:
- **Sizing**: strategic, feature, bug, quick win, or wildcard.
- **Execution method**: code, guide, or hybrid.
- **Location**: frontend, backend, or mixed.
- **Human dev required**, **agent autonomous**, and **feedback needed**: how much human involvement a change needs.
## The Opportunity lifecycle
Each Opportunity moves through a status lifecycle, from discovery to measured outcome. You and your team move opportunities forward; agents can also update status as they work.
| Status | Meaning |
| --- | --- |
| **New** | Freshly discovered and waiting for review. |
| **Investigating** | Being researched or refined to sharpen the evidence and plan. |
| **Reviewed** | Confirmed as a real, worthwhile problem and accepted for planning. |
| **Planned** | Queued to be worked on. |
| **In progress** | Actively being implemented. |
| **For review** | Implementation is up for review, for example as an open pull request. |
| **Shipped** | Merged and deployed. |
| **Measured** | Amplitude has measured the impact on the target metric. |
| **Dismissed** | Set aside as not worth pursuing. |
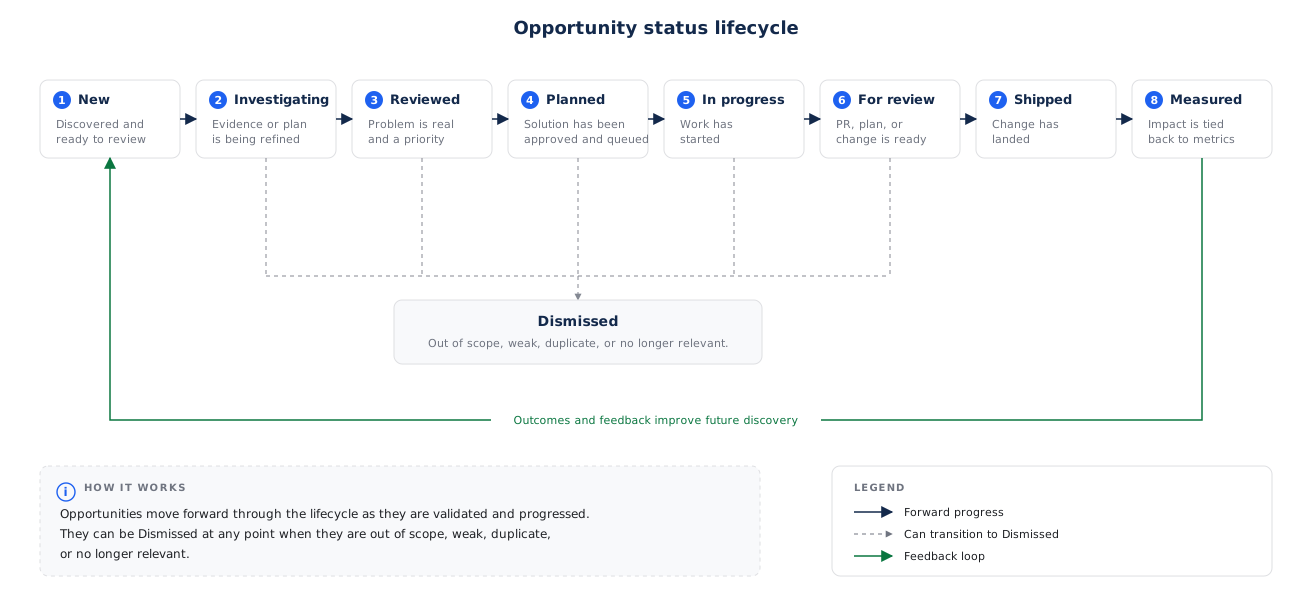{.diagram-light}
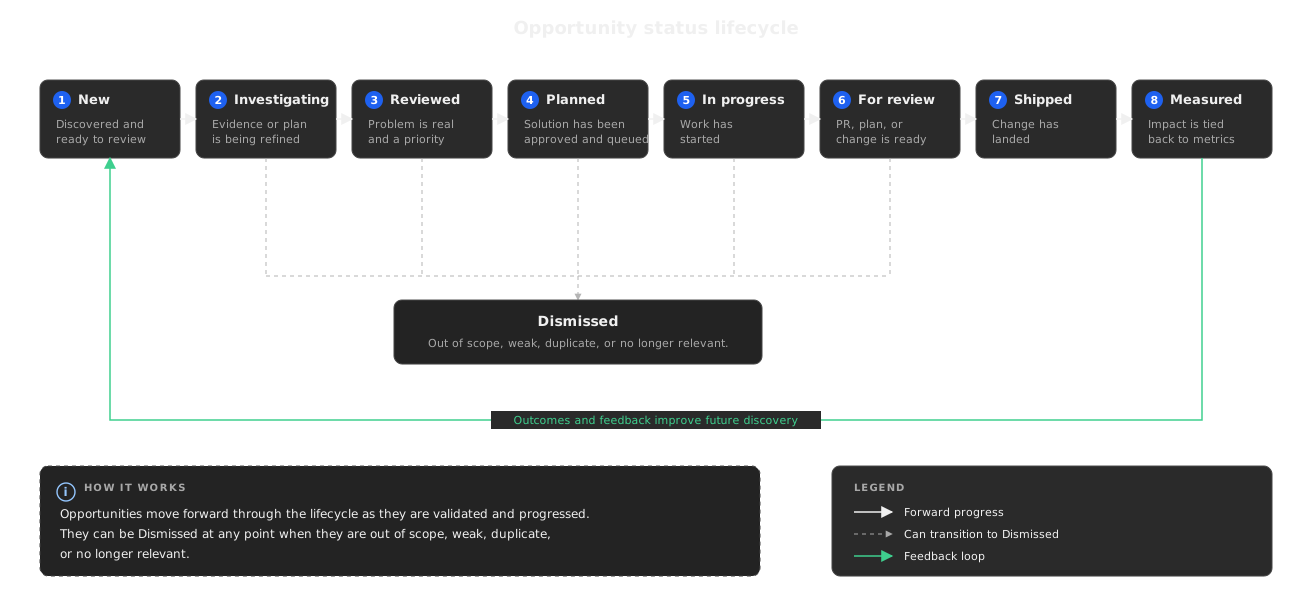{.diagram-dark}
## Review and give feedback
After you generate your first batch, review each Opportunity against three simple questions:
1. Is the analysis or signal correct?
2. Is the Opportunity a reasonable problem?
3. Is the suggested plan useful?
Use the thumbs up and thumbs down controls when reviewing. Every labeled input gives Amplitude context on your team's preferences, so the next batch can improve automatically. Direct comments, dismissals, edits, and status changes also feed back into the system.
If an Opportunity's analysis or recommendation isn't exactly right, change the plan directly or use [Global Agent](https://amplitude.com/docs/amplitude-ai/global-agent-overview) to run follow-up analysis before acting.
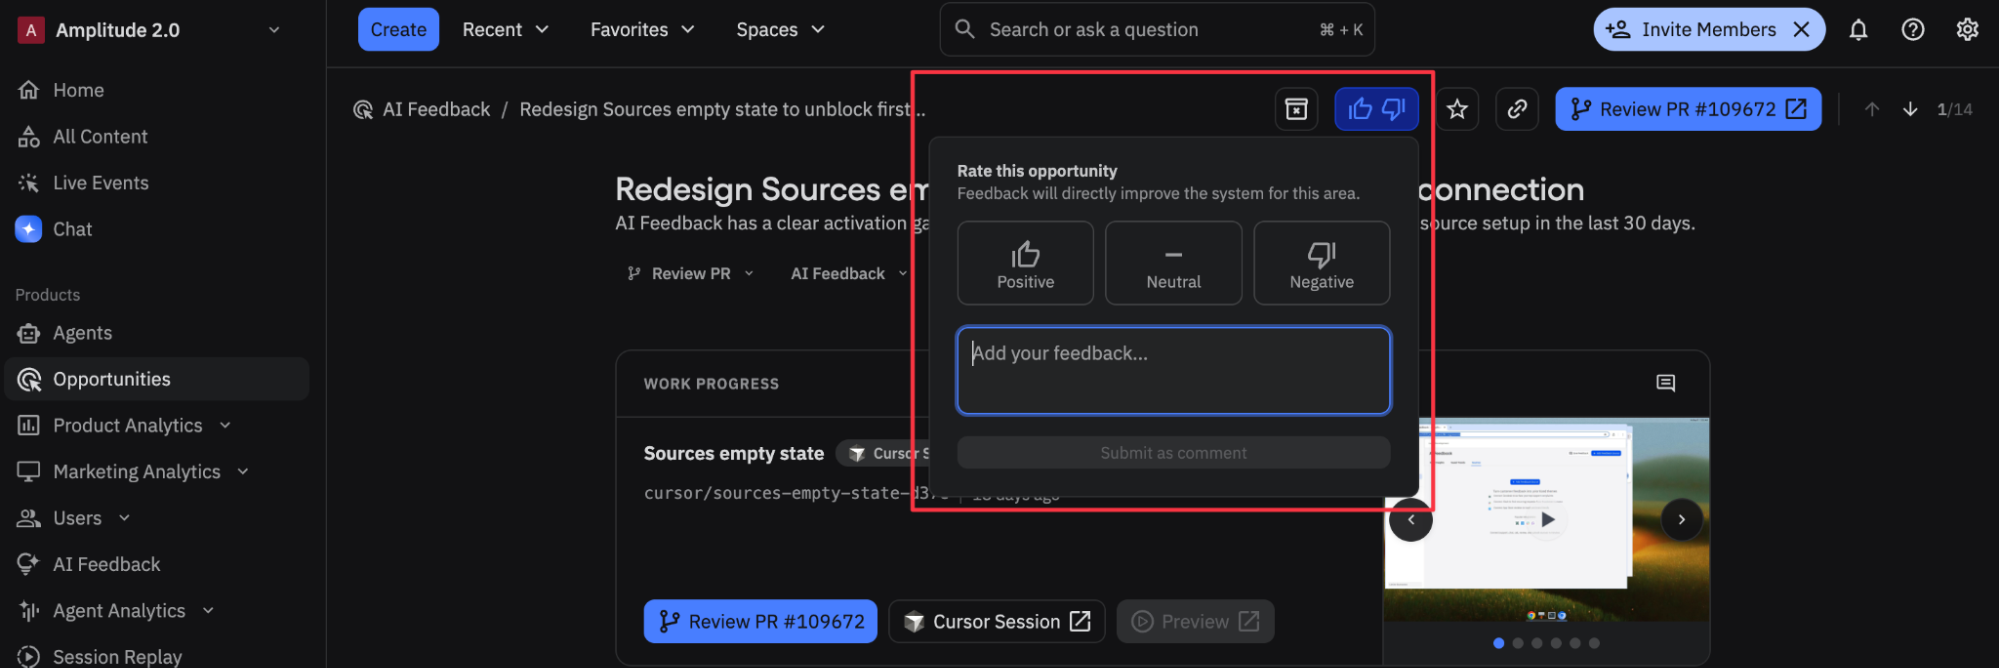
## Next steps
- Learn how opportunities connect to metrics, PRs, and your product map in [The opportunity graph](https://amplitude.com/docs/wave/opportunity-graph).
- Move an opportunity forward in [Acting on opportunities](https://amplitude.com/docs/wave/acting-on-opportunities).
================================================================================
# The opportunity graph and product map (Early Access)
URL: https://amplitude.com/docs/wave/opportunity-graph
================================================================================
# The opportunity graph and product map (Early Access)
Opportunities in Amplitude aren't a flat list. They live in an **opportunity graph**: a connected model of your product work that links each Opportunity to the evidence behind it, the metrics it targets, the code that delivers it, and the screens and flows where it happens.
The graph is what lets the system reason about how everything relates: which opportunities target the same metric, which screen a drop-off happens on, and which pull request shipped a given change.
## Why a graph instead of a list
A flat backlog loses context. A graph keeps it:
- **Traceability**: Follow an Opportunity to its evidence, its target metric, the agent that implemented it, and the pull request that shipped it.
- **De-duplication and structure**: Related opportunities link together, and larger themes can parent smaller pieces of work.
- **Measurement**: Because opportunities connect to metrics and to the product map, teams can tie shipped work back to the outcome it moved.
## Relations
Opportunities connect to other entities through typed **relations**. Common ones include:
| Relation | Connects an Opportunity to | Meaning |
| ----------------------------------- | ----------------------------- | ----------------------------------------------------------------- |
| **Targets metric** | A metric | The metric this Opportunity aims to move. |
| **Supported by** | Evidence (charts, dashboards) | The data backing the Opportunity. |
| **Delivered through** | A GitHub pull request | The PR that implements the work. |
| **Implemented by** | An agent or a person | Who did the work. |
| **Intervenes on** | A product node or edge | The screen or flow the change affects. |
| **Related to / Blocks / Parent of** | Another Opportunity | How opportunities relate, depend on, or roll up into one another. |
You can traverse these relations in the UI to understand an Opportunity's full context, or query them through the [Amplitude MCP server](https://amplitude.com/docs/wave/acting-on-opportunities).
## The product map
Part of the graph is a **product map**: a model of your product as users actually move through it. It's made of two building blocks:
- **Product nodes**: meaningful places in your product, such as a screen, a milestone, an external trigger, or an exit point.
- **Product edges**: the transitions between nodes, such as one screen leading to another, a flow being abandoned, or a user re-entering.
Nodes and edges carry health signals, so the map highlights where users drop off or hit friction. Because opportunities link to nodes and edges through the **intervenes on** relation, the map shows not just where problems are but which opportunities address them.
## How the map is built
Your analytics and session data ground the product map, so it reflects how the product actually behaves rather than an idealized flow. As discovery runs, it ties findings to the relevant nodes and edges, connecting a drop-off on a specific transition to the opportunities that target it and to the metrics that measure it.
To act on an opportunity surfaced through the graph or map, go to [Acting on opportunities](https://amplitude.com/docs/wave/acting-on-opportunities).
================================================================================
# Tuning (Early Access)
URL: https://amplitude.com/docs/wave/tuning-opportunities
================================================================================
# Tuning (Early Access)
Tuning starts with **Product Area settings**. Product Areas define the goals, scope, sources, contrasts, metrics, and instructions that steer what Amplitude looks for and how it judges quality. If generated Opportunities feel misaligned, the first place to tune is the Product Area.
Feedback compounds inside that Product Area. Direct comments, thumbs up/down reviews, status changes, dismissals, edits, and triage decisions all help Amplitude improve future recommendations for the same Product Area.
{% callout type="tip" heading="Tune before you judge quality" %}
If the first batch feels too broad, too technical, or too speculative, don't abandon the Product Area. Tighten Product Area settings first: scope, exclusions, goals, sources, metrics, opportunity mix, and the plan, investigation, and coding agent instructions. Then give feedback on the Opportunities you review. The next discovery cycle uses both the settings and the Product Area-scoped feedback.
{% /callout %}
## What you can tune
Tune these settings when a Product Area produces Opportunities that feel misaligned, repetitive, too small, or too broad. In practice, teams vary Product Areas along a small set of dimensions: scope and exclusions, goal tags, target metrics, success criteria, insight sources, opportunity mix, and three instruction lanes (plan, investigation, and coding agent).
| Setting | What to tune | When to adjust it |
| --- | --- | --- |
| **Focus area** | The product surface, journey, workflow, or customer problem the Product Area covers. | Opportunities span too many teams, pages, or user jobs. |
| **Goals** | Durable outcome tags such as activation, conversion, retention, UX, revenue, or performance. | Opportunities are relevant to the product but not to the current business goal. |
| **Contrasts and exclusions** | Nearby areas, surfaces, or metrics that should stay out of scope. | Discovery keeps returning plausible but distracting ideas. |
| **Target metrics** | Primary, secondary, and guardrail metrics that define success. | Opportunities don't connect clearly to measurable impact. |
| **Success criteria** | A plain-language statement of what good looks like for this area. | Opportunities optimize a metric without matching the outcome you care about. |
| **Insight sources** | Analytics, Session Replay, AI Feedback, Autocapture, Experiments, specialized agent results, web vitals, anomalies, surveys, agent traces, PR reviews, competitor context, and code repositories. | Recommendations lack evidence, over-index on one source, or miss known context. |
| **Opportunity mix** | The type and size of work the system should prefer, such as quick wins, bug fixes, features, strategic bets, or wildcards. | The backlog contains too many bugs, too many strategic bets, or not enough quick wins. |
| **Plan instructions** | The durable charter: what the area is, the outcomes that matter, baselines, and hard boundaries. | Specs feel generic, out of scope, or disconnected from current strategy. |
| **Investigation instructions** | Where agents should look: journeys, signals, comparisons, and questions that matter. | Evidence is thin, one-sided, or explores the wrong flows. |
| **Coding agent instructions** | How agents should implement: repo map, preferred change style, validation, and rollback. | Plans are good, but handoffs are vague or land in the wrong code. |
| **Custom instructions** | Extra durable preferences that don't fit the three instruction lanes. | Your team has stable rules about evidence quality, rollout, or ownership. |
| **Product Area feedback** | Thumbs up/down reviews, comments, status changes, dismissals, edits, and triage decisions. | Always. This is the strongest ongoing tuning signal after Product Area settings. |
## Define a strong focus area
A strong focus area gives the system a clear search space. It should name the user journey or product surface and describe what outcome matters.
Good focus areas:
- **AI Feedback**: Covers the full source-to-insight loop, including source connection, ingestion quality, theme generation, insight review, feedback triage, and repeated team usage. Excludes unrelated core analytics funnels unless they directly affect the feedback workflow.
- **Dashboards**: Covers first dashboard creation, chart edits over time, dashboard retention, sharing, exports, and recurring reporting workflows. Excludes deep chart-query authoring unless it directly blocks dashboard creation or ongoing dashboard usage.
- **Checkout**: Covers cart-to-payment completion, payment errors, recovery flows, purchase confirmation, and guardrail metrics such as latency. Excludes marketing landing pages and post-purchase retention unless they directly affect checkout completion.
- **Session Replay for support**: Covers replay discovery, support-led debugging, replay sharing, issue reproduction, and follow-up analysis. Excludes general replay exploration unless it directly supports support workflows.
Weak focus areas:
- Growth.
- The dashboard.
- Improve UX.
- Everything related to AI.
If a focus area feels broad, split it. For example, instead of one Product Area for "Onboarding", create separate areas for "First data connection", "First chart creation", and "Invite teammates".
## Add contrast areas
Contrasts are nearby areas that are intentionally out of scope. They help the system distinguish useful opportunities from distracting ones.
Use contrasts when the Product Area borders another team, workflow, or metric.
Examples:
- For **Checkout**, include payment submission, error recovery, and purchase confirmation. Exclude marketing landing pages and post-purchase retention.
- For **Chart Builder**, include chart creation, save flows, query latency, and first useful visualization. Exclude dashboard layout and sharing unless they directly block chart creation.
- For **AI Feedback**, include source connection, ingestion reliability, insight quality, and repeated team usage. Exclude unrelated core analytics funnels.
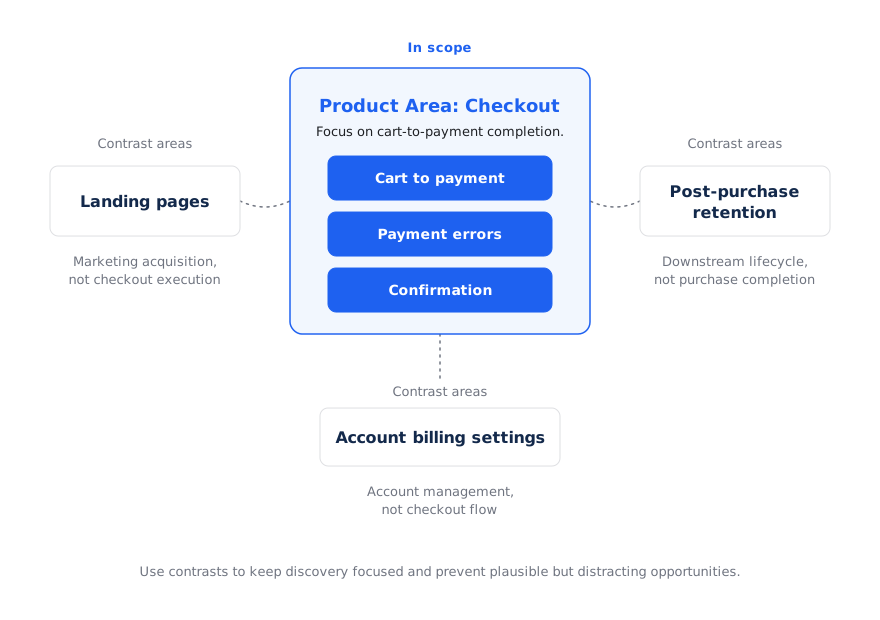{.diagram-light}
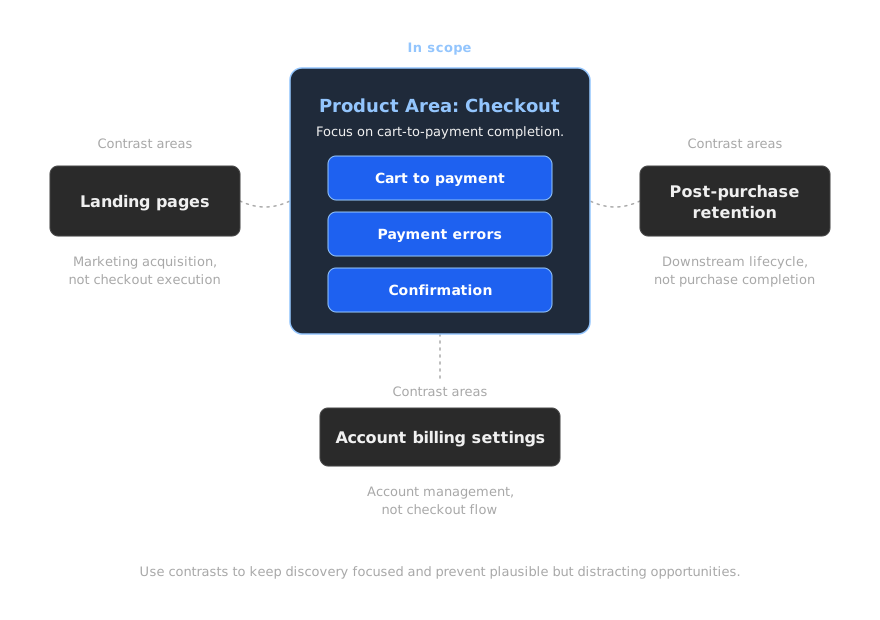{.diagram-dark}
## Tune the opportunity mix
Opportunities can represent different types of work. Use Product Area guidance and triage feedback to shape the mix you want.
| Opportunity type | Use it for | Best when |
| --- | --- | --- |
| **Bug fix** | Broken behavior, errors, regressions, retry loops, or UI states that block users. | Evidence shows a clear failure and the fix is specific. |
| **Quick win** | Low-effort changes with measurable upside. | The scope is small, reversible, and easy to validate. |
| **Feature** | New capabilities or workflow improvements. | Feedback and usage patterns point to a missing product capability. |
| **Strategic bet** | Larger cross-surface improvements or broad workflow changes. | The Product Area is mature enough to justify larger investment, and multiple signals support the bet. |
| **Wildcard** | Emerging or surprising ideas that don't fit the normal pattern. | You want the system to explore adjacent possibilities, not just optimize known funnels. |
### Match the mix to product maturity
For early products, allow more feature and wildcard opportunities. Early teams benefit from broader exploration and bigger swings.
For mature, high-volume surfaces, bias toward quick wins, bug fixes, experiments, and careful rollout plans. Mature teams usually need smaller, safer, more measurable changes.
For mid-maturity products, keep a balanced mix: some workflow improvements, some bug fixes, and a few larger bets.
## Select the right sources
Sources determine what the system can learn. A Product Area with only analytics may find metric movement but miss the user experience behind it. A Product Area with only feedback may find sentiment but miss scale.
Use this guidance:
- **Analytics** for volume, conversion, retention, and segment-level impact.
- **Session Replay** for how the problem appears in real user behavior.
- **AI Feedback** for complaints, feature requests, and qualitative themes.
- **Autocapture** for product interaction signal when custom instrumentation is incomplete.
- **Experiments** for what teams have already tried and what moved metrics.
- **Specialized Agents** for ongoing domain-specific summaries.
- **Web vitals** for technical performance and page experience signals.
- **Agent traces** for AI-powered product usage, quality, and performance.
- **Competitor context** for market-aware ideas and comparable workflows.
- **Custom Agents** (coming soon) for MCP-connected internal data sources, proprietary systems, and workflows.
- **Code repositories** for execution plans that point to real implementation locations.
- **Anomalies** (coming soon) for emerging metric changes that need investigation.
- **Surveys** for direct user intent and satisfaction signals.
- **PR reviews** (coming soon) when code review activity can reveal delivery friction or implementation risk.
For high-confidence opportunities, look for at least two independent sources. For example, pair a funnel drop-off with session replay evidence, or pair a feedback theme with a supporting usage trend.
## Use metrics and success criteria as alignment anchors
Target metrics tell Amplitude how to score and frame opportunities. Each Product Area should include:
- **Primary metrics** that define success.
- **Secondary metrics** that help diagnose why the primary metric moves.
- **Guardrail metrics** that shouldn't regress.
Pair metrics with a short **success criteria** statement so agents optimize for the outcome you care about, not only a chart number. For example: "Increase paid subscription conversion and subscriber return without increasing checkout abandonment."
Avoid using only one metric. A single conversion metric may produce narrow recommendations that ignore quality, latency, support burden, or downstream retention.
## Write durable instructions
Product Areas give you three instruction lanes plus optional custom instructions. Fill each lane with stable guidance, not temporary tasks. Temporary requests belong in a focused Discover run, Global Chat, or a comment on a specific Opportunity.
### Plan instructions
Use plan instructions as the Product Area charter. Strong plan text usually covers:
- What the product surface is and what durable outcomes matter.
- Current baselines or maturity context when that changes the quality bar.
- Hard boundaries and nearby areas that belong elsewhere.
- Preferences for how to frame, size, or roll out opportunities.
Good plan instructions:
- Cover the paid subscription lifecycle from paywall exposure through purchase completion and subscriber return. Treat repeat content consumption as a separate Product Area unless it directly explains retention.
- Prefer low-effort, reversible changes before high-complexity interventions. Include an experiment or rollout plan for mature, high-volume flows.
- Don't recommend instrumentation-only work. Prefer ambitious product changes when evidence supports them.
### Investigation instructions
Use investigation instructions to steer where agents look and what they compare. Strong investigation text usually covers:
- Key journeys or funnels to analyze.
- Signals, segments, or platforms worth comparing.
- Questions the next discovery run should answer.
- Measurement gaps or known confounders to separate from product friction.
Good investigation instructions:
- Explore where eligible readers fail to become subscribers and where new subscribers fail to return after purchase. Compare platform, paywall state, content type, acquisition source, and lifecycle stage.
- Focus on the full daily task loop: session open, task creation, edit and delete flows, and the All Tasks Completed moment. Treat Reset All Data spikes as a frustration guardrail.
- Structure investigation across UI lifecycle, agent tool-call quality, and multi-surface entry points such as chat or MCP. Keep adjacent products out of scope unless they block this area.
### Coding agent instructions
Use coding agent instructions when you connect repositories and want implementation handoffs to land cleanly. Strong coding-agent text usually covers:
- Which repos, packages, or services own the surface.
- How to trace a behavioral issue back to specific code paths.
- Preferred change style: minimal fixes, rollback steps, and metric checks after deploy.
- Validation criteria before marking work complete.
Good coding agent instructions:
- Frontend lives in `apps/voc` and `packages/voc-ui`. Backend lives in `server/packages/klassy`. Prefer targeted fixes over broad refactors.
- When fixing agent-run failures, trace to the failing tool call and its input or output before writing a fix. Validate against agent success rate and dismissal rate.
- Always include rollback steps and post-deploy metric monitoring. Validate changes against the expected metric impact before marking work complete.
### Custom instructions
Use custom instructions for durable preferences that don't fit the three lanes cleanly, such as evidence rules or ownership constraints:
- Prioritize opportunities with evidence from at least two independent sources.
- Avoid opportunities that require changes outside the Checkout team unless they directly block checkout completion.
Avoid instructions such as:
- Investigate the drop from last Tuesday.
- Focus on the latest release.
- Find five bugs this week.
## Run focused discovery
Product Area settings are durable, but not every investigation needs a settings change. Use a focused **Discover** run when you want the Opportunity Manager to investigate a specific overarching problem, user flow, page, or category of signal for one run.
Focused discovery is useful when you want to:
- Look for Opportunities around a specific page or flow, such as onboarding setup, checkout, or dashboard export.
- Direct agents toward a broad problem area, such as activation friction or performance issues.
- Investigate a category of signal, such as feedback themes, replay friction, web vitals, or experiment learnings.
- Go deeper into an area without changing the Product Area's durable scope, metrics, or instructions.
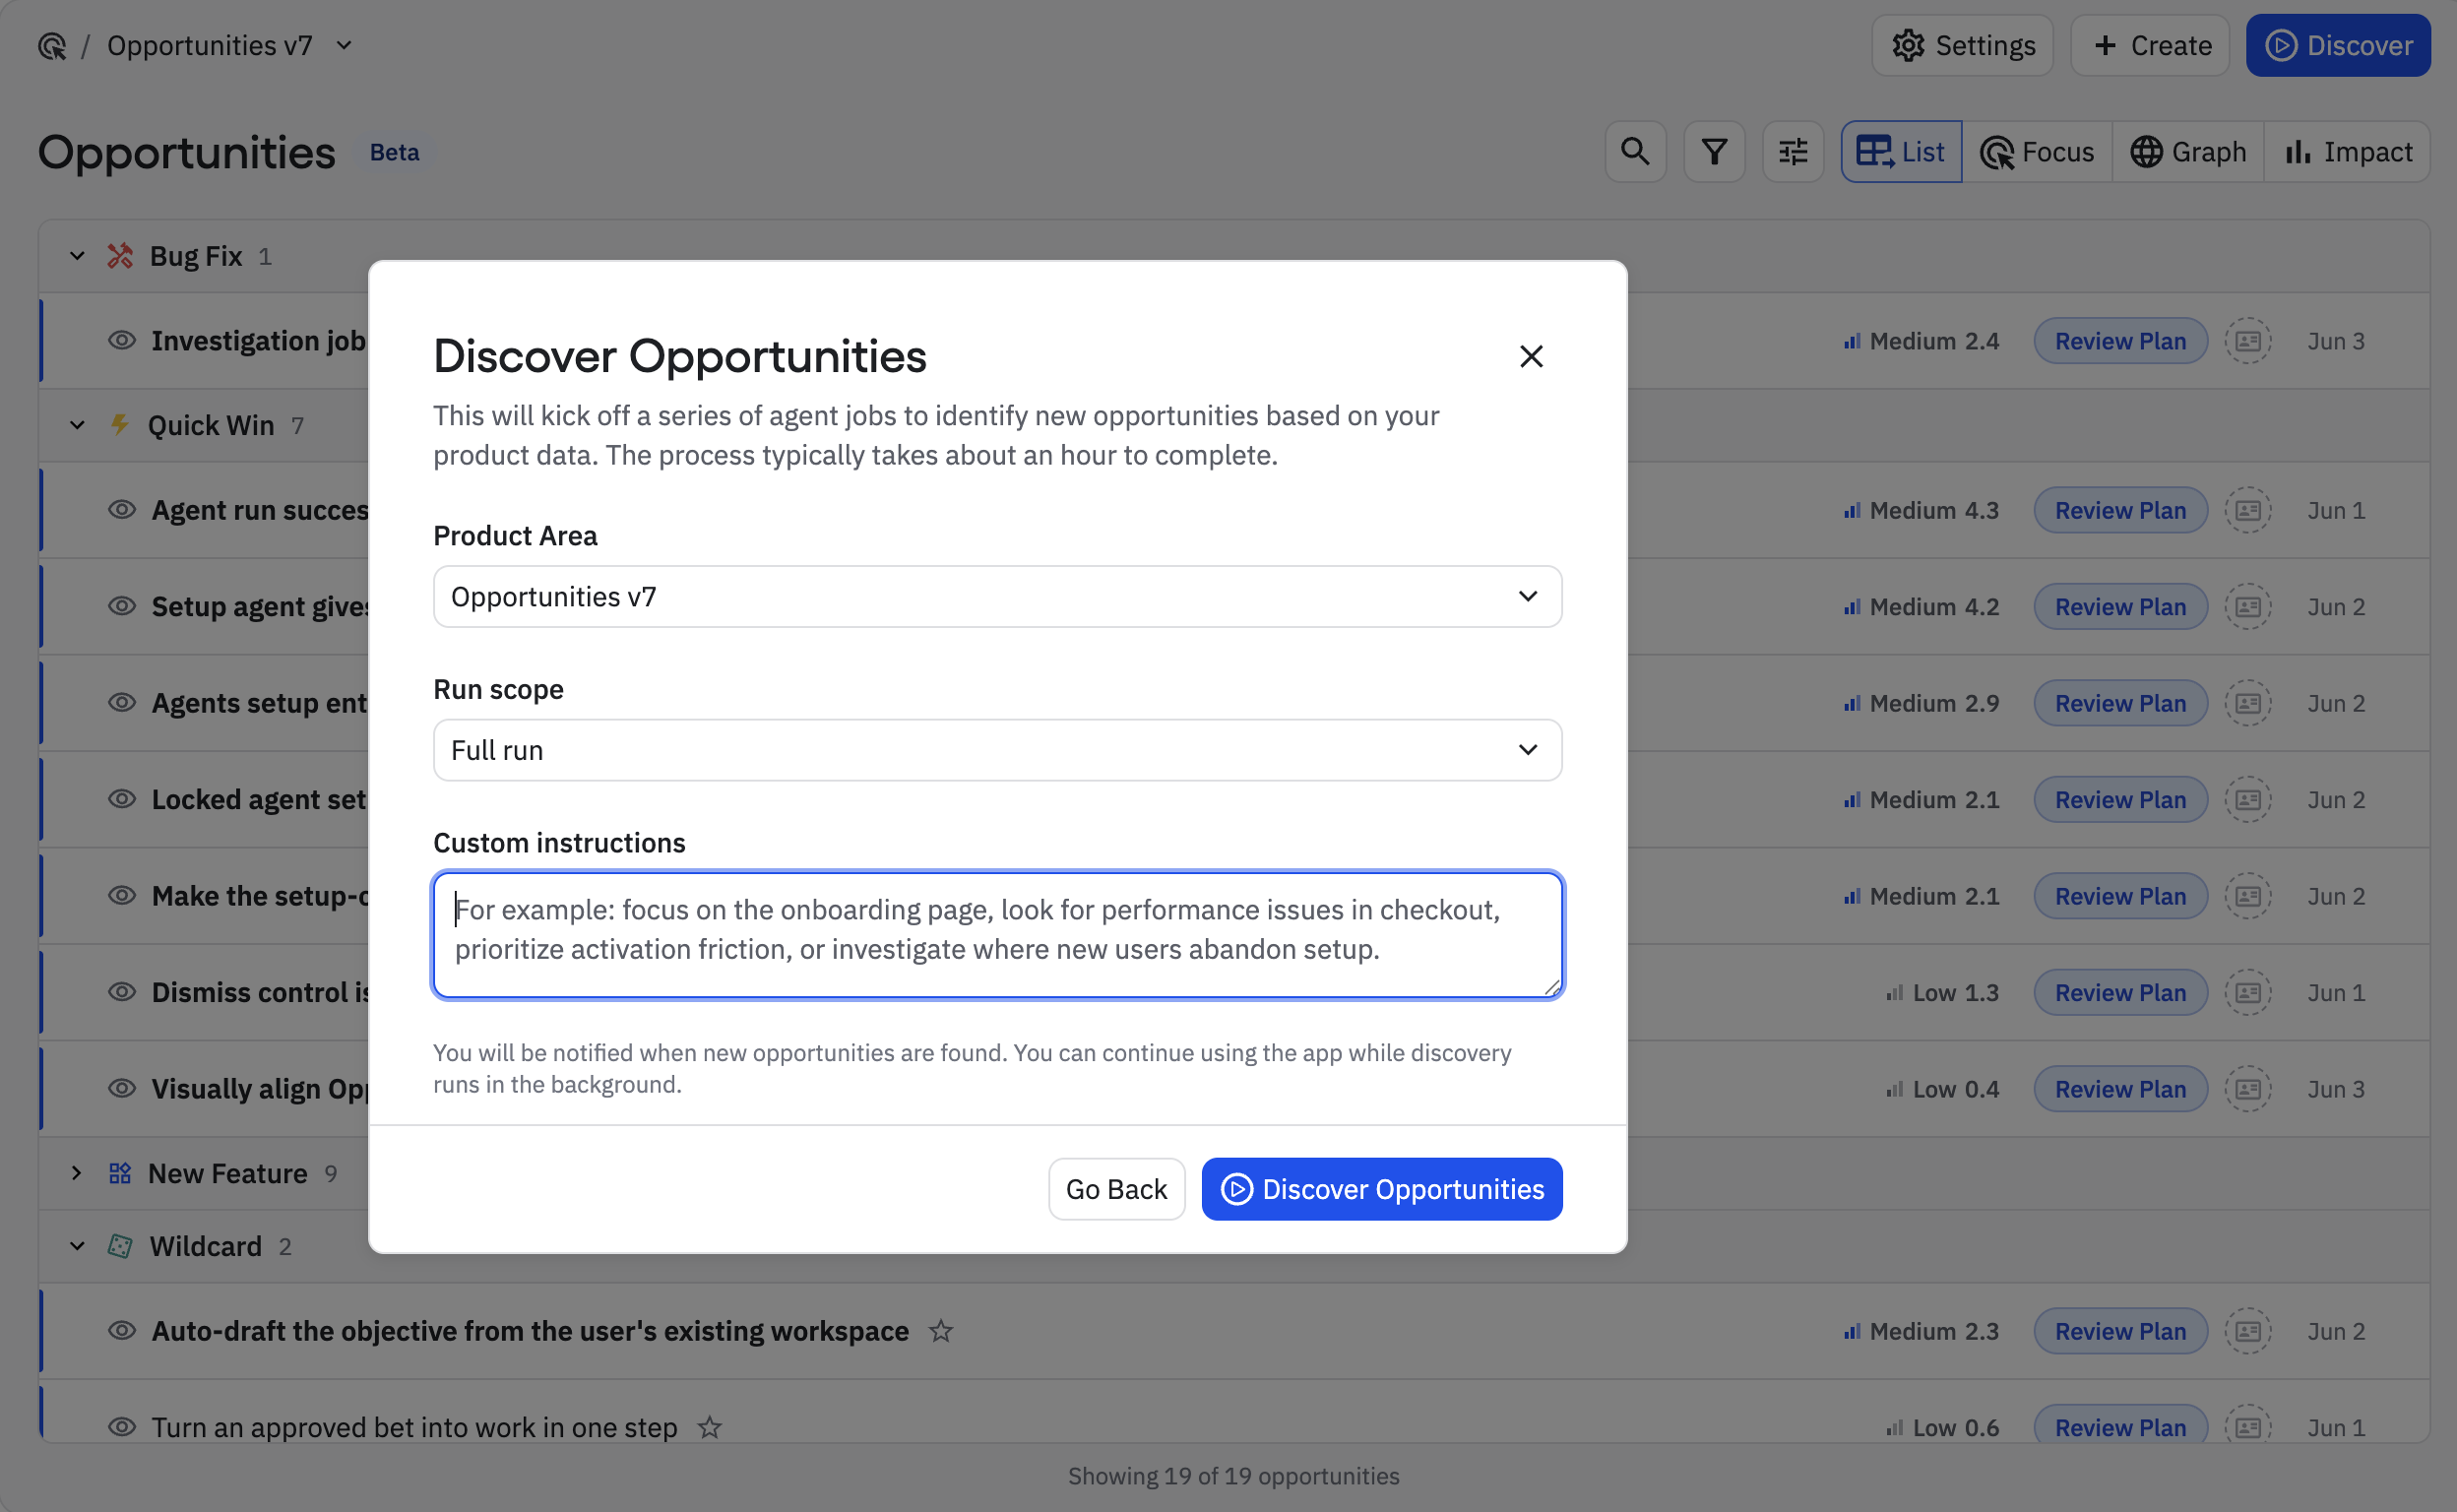
Focused discovery is different from submitting a manual Opportunity idea. Use focused discovery when you want agents to explore a scope and generate a batch of possible Opportunities. Use a manual Opportunity idea when you already have a specific idea and want Amplitude to flesh it out with evidence, scoring, and a plan.
## Feedback is the tuning loop
Feedback is the ongoing tuning mechanism within a Product Area. Amplitude uses both explicit feedback and workflow behavior to improve future Opportunity alignment for that Product Area.
### Thumbs up and thumbs down
Use thumbs up when an Opportunity is useful, well-scoped, and worth seeing more of. Use thumbs down when the signal is wrong, the plan is weak, or the Opportunity doesn't match the Product Area.
Every labeled input gives Amplitude context about your team's preferences for that Product Area. That signal helps the next discovery cycle rank and write Opportunities that better match the Product Area's goals.
### Direct feedback
Leave comments when an Opportunity is wrong, weak, duplicated, too broad, or missing important context. Good feedback explains the reason, not just the decision.
Examples:
- "This is out of scope for Checkout. It belongs to account billing settings."
- "The evidence is too replay-heavy. Need chart-backed volume before prioritizing."
- "This is a good quick win, but the proposed fix should avoid changing the payment provider."
- "Duplicate of the payment retry work already in progress."
### Triage feedback
Your triage choices also teach the system:
- **Planned** signals that the Opportunity matched the Product Area and quality bar.
- **In progress** signals that the spec was actionable enough to start work.
- **Dismissed** signals that the Opportunity didn't match the scope, had weak evidence, duplicated existing work, or wasn't worth pursuing.
- **For review**, **Shipped**, and **Measured** close the loop from recommendation to outcome.
Use statuses honestly. Don't leave low-quality or irrelevant opportunities in New forever. Dismissing and commenting on them gives the system stronger signal than ignoring them.
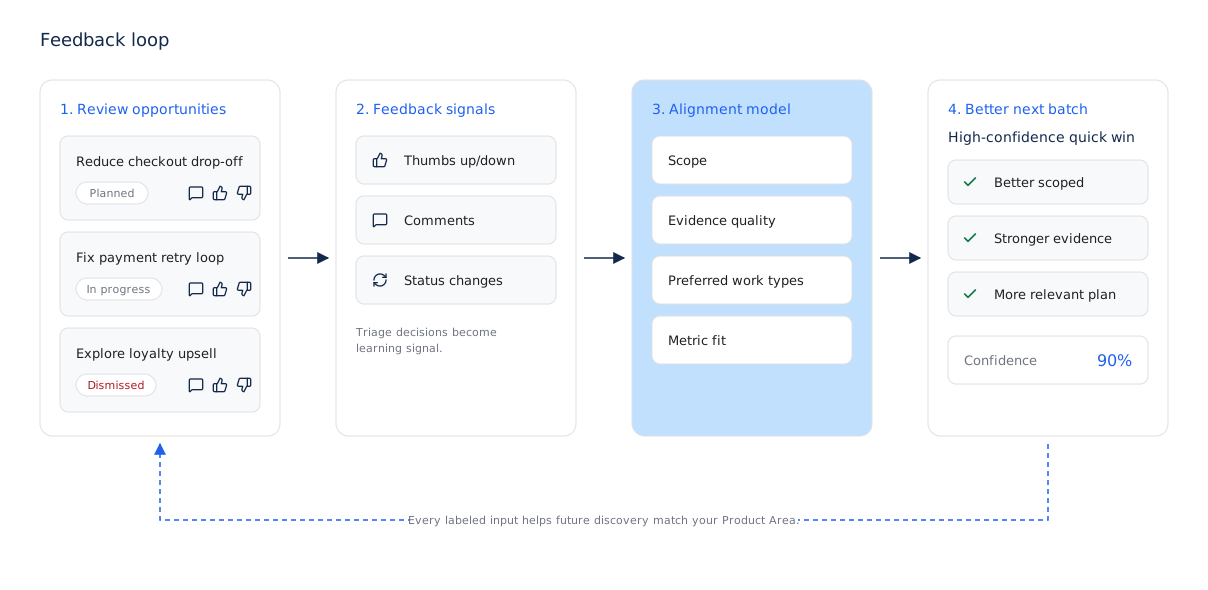{.diagram-light}
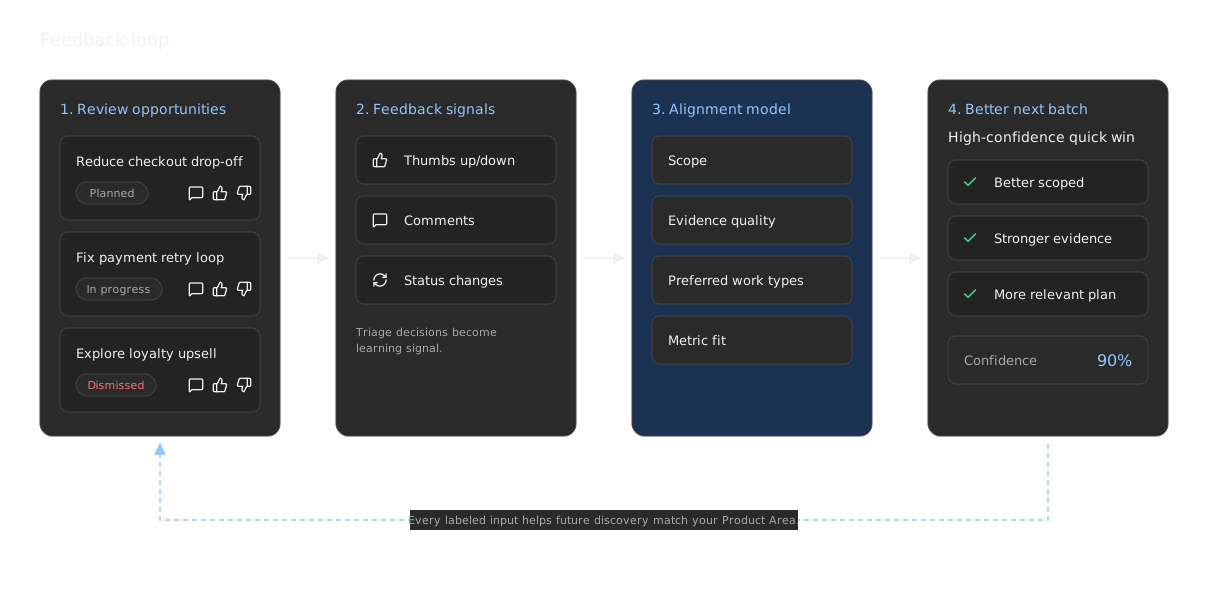{.diagram-dark}
## Review cadence
For best results:
1. Review new opportunities after each discovery run.
2. Dismiss irrelevant or weak opportunities instead of leaving them untouched.
3. Add comments when the reason matters for future discovery.
4. Move actionable opportunities through the lifecycle as work progresses.
5. Revisit Product Area settings when multiple opportunities show the same kind of mismatch.
Tuning isn't a one-time setup step. Treat Product Area settings like product strategy: the clearer the goals and boundaries, and the more honest the feedback, the more useful the recommendations become.
================================================================================
# Acting on opportunities (Early Access)
URL: https://amplitude.com/docs/wave/acting-on-opportunities
================================================================================
# Acting on opportunities (Early Access)
Discovery is only half the loop. The value comes from acting on Opportunities. There are two common ways to work: review and route Opportunities in the **Amplitude UI**, or read, triage, and implement them agent-natively through the **Amplitude MCP server**.
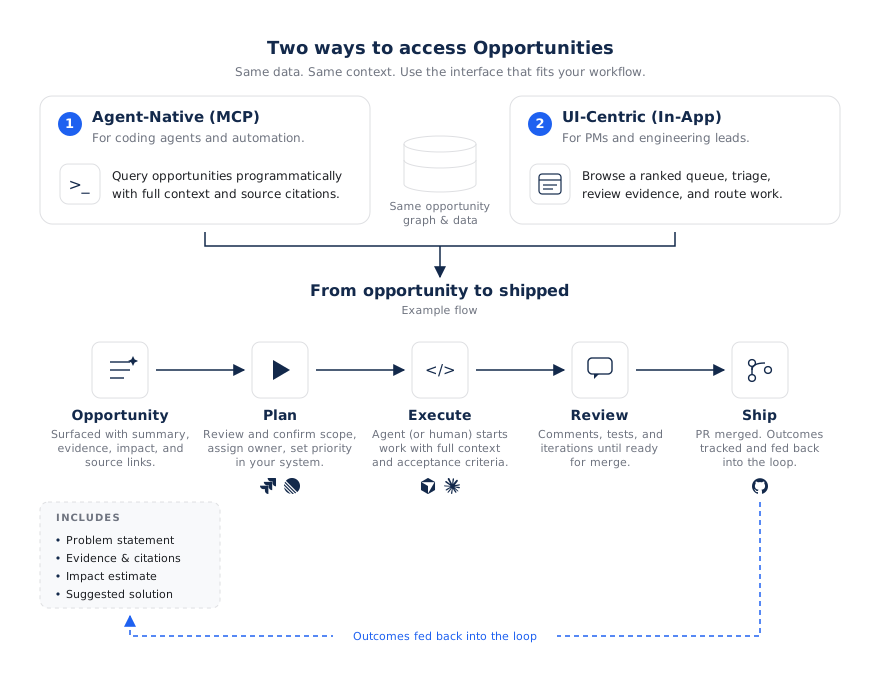{.diagram-light}
{.diagram-dark}
## In the Amplitude UI
Review opportunities for a Product Area, then move one forward:
- **Triage**: Update an opportunity's status (for example from New to Planned), or dismiss it. Add a comment to capture context or a decision.
- **Refine**: Edit the plan directly, or use [Global Agent](https://amplitude.com/docs/amplitude-ai/global-agent-overview) to run follow-up analysis and sharpen the evidence or solution before acting.
- **Route to execution**: Use in-product CTAs to send the Opportunity to Jira, Linear, GitHub, or a coding agent.
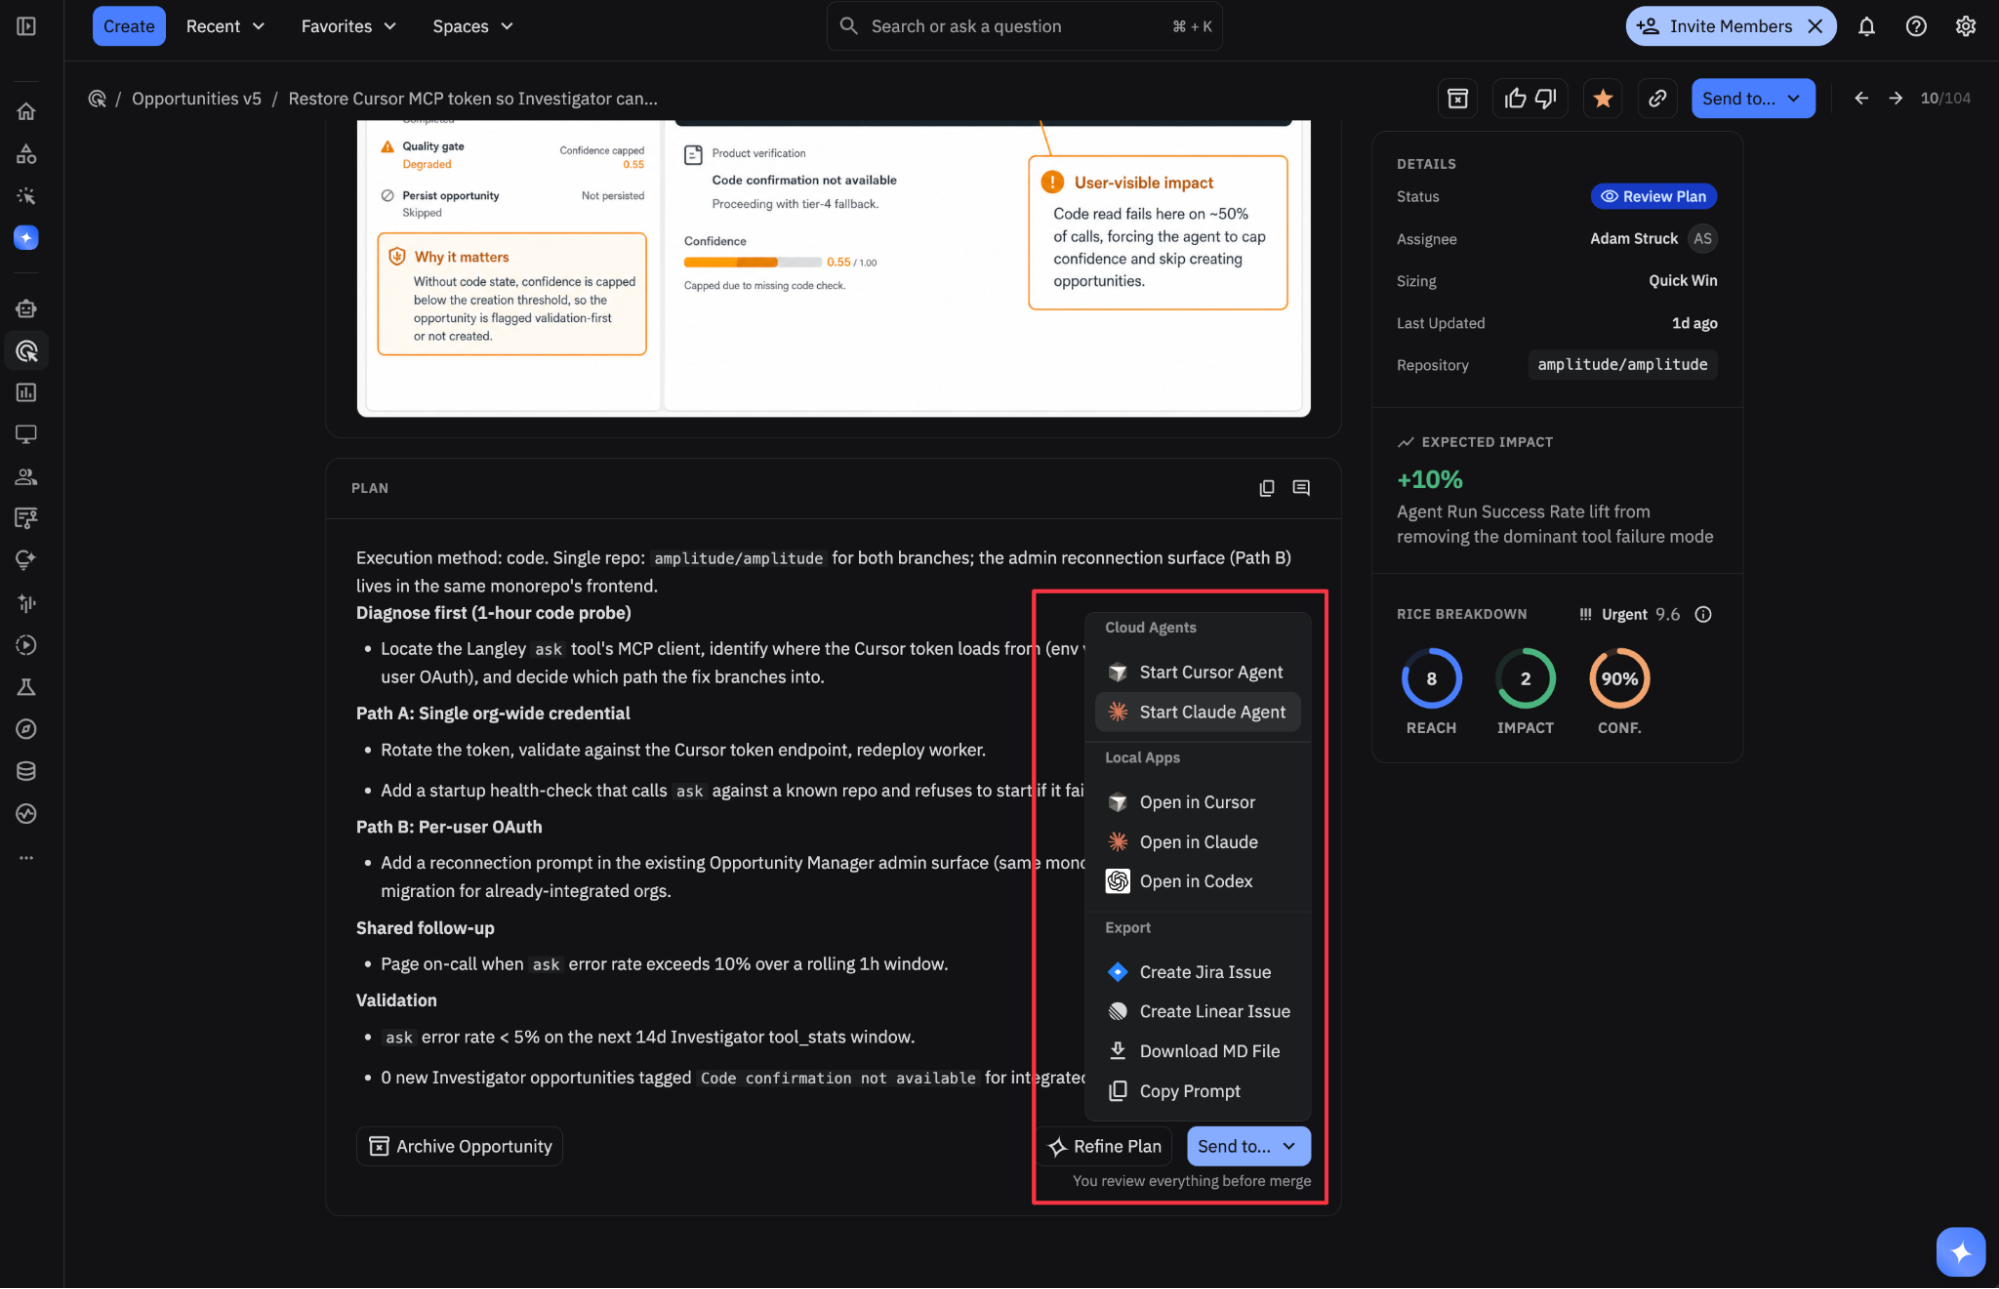
{% callout type="tip" heading="Take one real action first" %}
The fastest way to feel the value is to pick one small, high-confidence opportunity and move it all the way through: to a ticket, a PR, or a shipped change.
{% /callout %}
## Agent-native with MCP
If you'd rather stay in your editor, connect the [Amplitude MCP server](https://amplitude.com/docs/amplitude-ai/amplitude-mcp) in **Claude Code, Cursor, Codex**, or another MCP client. This lets you read and edit Opportunity context, triage work through natural language, and orchestrate coding agents to draft pull requests grounded in an Opportunity's execution plan.
For install and authentication steps, go to the [Amplitude MCP server](https://amplitude.com/docs/amplitude-ai/amplitude-mcp) documentation.
### Opportunities MCP tools
Once connected, these tools let an AI client work with opportunities. This is the Opportunities-specific toolset, not the full Amplitude MCP catalog.
| Tool | What it does |
| --- | --- |
| `list_objectives` | List Product Areas (objectives) so you can scope your work. |
| `list_opportunities` | List opportunities, filtered by Product Area, status, or tags. |
| `search_opportunities` | Find opportunities with natural-language semantic search. |
| `get_opportunity` | Get the full detail of one opportunity, including evidence, scoring, and execution plan. |
| `get_relations` | Traverse the opportunity graph: linked PRs, metrics, agents, and product map nodes. |
| `update_opportunity_status` | Move an opportunity through its lifecycle (for example to In progress or For review). |
| `update_opportunity` | Refine an opportunity's title, description, tags, or metadata. |
| `add_opportunity_comment` | Leave feedback, blockers, or decisions on an opportunity. |
| `submit_opportunity_idea` | Submit a new idea for AI-powered investigation within a Product Area. |
| `create_relation` | Link an opportunity to a pull request, agent run, or metric. |
{% callout type="note" heading="Tool availability" %}
The exact tools available depend on your access and the features enabled for your organization. Tool names and behavior can change during the Research Preview.
{% /callout %}
### Typical workflows
**Triage and discover the highest-value work:**
{% agent-chat title="Finding and claiming work through MCP" %}
{% chat-turn speaker="user" %}
Find the highest-confidence opportunities in the Checkout product area.
{% /chat-turn %}
{% chat-action %}
Calls `list_objectives` to find the Checkout Product Area, then `list_opportunities` filtered to it and sorted by priority.
{% /chat-action %}
{% chat-turn speaker="agent" %}
The top item is "Reduce checkout drop-off before payment": RICE-ranked highest, status New, backed by a funnel chart and 3 replays. Want me to open the full plan?
{% /chat-turn %}
{% /agent-chat %}
**Implement an opportunity end-to-end:**
{% agent-chat title="Drafting a PR from an opportunity" %}
{% chat-turn speaker="user" %}
Pick up that opportunity and draft a PR.
{% /chat-turn %}
{% chat-action %}
Calls `get_opportunity` for the full execution plan and acceptance criteria, then `update_opportunity_status` to mark it In progress.
{% /chat-action %}
{% chat-action %}
Reads the connected repository, implements the change, and opens a pull request.
{% /chat-action %}
{% chat-action %}
Calls `create_relation` to link the PR to the opportunity, then `update_opportunity_status` to For review.
{% /chat-action %}
{% chat-turn speaker="agent" %}
Done. I opened a draft PR implementing the plan, linked it to the opportunity, and moved it to For review. The acceptance criteria are in the PR description.
{% /chat-turn %}
{% /agent-chat %}
### Example prompts
Try these in your MCP client:
> List the open opportunities in the Onboarding product area.
> Show the evidence and target metric for opportunity `opp_8421`.
> Submit an idea: users abandon the mobile checkout at the payment step. Investigate why.
> Mark opportunity `opp_3318` as planned and leave a comment that the team plans to tackle it next sprint.
## Close the loop
When work ships, the Opportunity moves to Shipped and then Measured, tying the change back to its target metric. That outcome, plus any feedback you leave along the way, feeds back into discovery so the next set of Opportunities is sharper.
Once setup is complete, start with a small first batch, choose one high-confidence Opportunity, and work it through your normal execution flow. That is usually the fastest path to value and the fastest way to improve quality from there. For how status and measurement work, go to [Opportunities](https://amplitude.com/docs/wave/opportunities).
================================================================================
# Coding agent security (Early Access)
URL: https://amplitude.com/docs/wave/coding-agent-security
================================================================================
# Coding agent security (Early Access)
Wave uses GitHub and coding agents to give Opportunities rich product context: how features behave, where bugs live, and what an implementation should change. That access follows a strict isolation model so agents can investigate and open pull requests without exposing credentials or retaining your source code.
Use this page when you need the security and data-handling details behind connecting repositories and running coding agents. For how to connect repositories, go to [Connect context](https://amplitude.com/docs/wave/connecting-context). For broader Amplitude AI privacy controls, go to [Privacy and Security](https://amplitude.com/docs/amplitude-ai/privacy-and-security).
## Why GitHub and coding agents matter
Opportunities need accurate product and implementation context to plan work and investigate bugs. Amplitude provides that context through three components:
1. **Code indexing**: Builds markdown context that describes your feature behavior and events for agents across your organization.
2. **Coding agent for targeted questions**: Runs read-only investigation inside a secure sandbox when Wave needs code-based answers.
3. **Coding agent for implementation**: Uses the same sandbox model to implement a plan on your codebase and open a pull request for review.
## Code indexing
Code indexing produces a markdown file that describes how your features and events work. Amplitude stores that index in an AWS knowledge base inside your organization's own partition. The partition is single-tenant: Amplitude never shares it across customers.
Indexing is:
- **Read-only** against your repositories.
- **User-controlled**: your users run indexing on demand and refresh it by running it again.
- **Scoped to your organization**: Amplitude doesn't use or inspect the index outside your organization's context.
- **Fully visible** to your organization, and Amplitude doesn't keep it after you delete it.
A typical index takes roughly five to thirty minutes per repository.
## Coding agent for targeted questions
As Wave generates opportunities, the Wave agent can start coding subagents that run in secure, network-isolated sandboxes. That code-based investigation improves plan quality and evidence.
When the task is a question rather than a change, Amplitude removes write tools from the run entirely. The agent stays read-only against your code. If you provide a key for an AI provider, inference stays within your scopes. Amplitude doesn't bill that usage to Amplitude's own accounts or route it through them.
## Coding agent for implementation
Implementation runs use the same sandbox setup as targeted questions. When coding agents implement a plan, they work directly on your codebase and open a pull request for your engineering team to review.
Nothing merges automatically. Amplitude opens one pull request per repository that actually changed, on its own branch, and checkpoints progress as the run continues. From that point, your build system and review process take over. Amplitude waits for experiment or flag measurement data before returning a verdict on whether the change worked.
{% callout type="note" heading="Repository scope" %}
The implementation agent's scope is your whole repository. It can modify configuration or CI files when a task genuinely requires it. Branch protection and required reviews on your side are the intended control, not an assumption that the agent stays in a narrow file lane.
{% /callout %}
## How Amplitude secures the sandboxes
Every subagent run, whether a question or an implementation, follows the same isolation model: the piece that can touch your code holds no credentials, and the piece that holds credentials can't touch your code.
### Fresh, disposable environment per run
Amplitude creates a separate virtual machine for each run, not a shared container. The environment starts when the run starts, and Amplitude destroys it when the run finishes. Nothing carries over between runs, and Amplitude doesn't retain source code afterward.
### Unprivileged execution
The agent runs as a non-root user. It can't escalate permissions and has no cluster identity.
### No standing credentials
A separate credential broker holds your GitHub token and AI provider key. The broker adds those credentials to outbound requests server-side. The agent and coordinator never receive the raw credentials.
The GitHub token scopes to your installation and expires within the hour, so a run can't act outside your own environment regardless of what a prompt asks it to do.
### Narrow network access
The sandbox can only reach GitHub and your AI provider, both through the broker. It can't reach Amplitude's internal systems, cloud infrastructure metadata, or any other customer's environment.
### Tenant separation
Amplitude tags every environment to your organization. Every action, including watching a session, sending a follow-up, or cancelling a run, checks that the run belongs to the caller's organization first. A request for another organization's run returns as "not found," not "forbidden," so it can't confirm that another organization's run exists.
### Pre-run checks
Amplitude refuses a run before creating any environment if the target repositories are invalid, span more than one GitHub owner, or the GitHub App installation is unreachable. That prevents a failure from leaving an orphaned or misdirected pull request.
### No silent retries
Failed runs don't automatically retry. Amplitude records the failure with output redacted so a credential can't leak into a log line, then waits for a person to decide whether to try again.
## What Amplitude stores
Amplitude doesn't store anything from these components except the Wave code indexing output: the markdown context that describes how your features and events work. That index is:
- Fully visible to your organization at all times.
- Stored single-tenant, within your organization's own partition.
- Controlled entirely by your users (created, refreshed, and deleted on your terms).
- Not persisted after you delete it.
Everything else, including prompts, model responses, and source code read during a sandbox run, isn't retained or logged. The only other record Amplitude keeps is the working history on the opportunity itself: branch name, pull request link and status, diff size, CI status, and a replayable session transcript. None of that is a copy of your codebase.
## Cursor as an alternative provider
Amplitude also supports launching coding work through Cursor instead of Amplitude's own agent. Cursor runs execute entirely on Cursor's infrastructure under your organization's own agreement with Cursor. The sandbox and credential-broker model on this page describes Amplitude's own agent specifically.
================================================================================
# Session Replay
URL: https://amplitude.com/docs/session-replay
================================================================================
# Session Replay
Session Replay records the rendered DOM of a user's web or mobile session and plays it back as video, synced with that user's event stream in Amplitude. Open a replay from a chart, the homepage, or User Lookup to watch what a user clicked, typed, and saw at each event, including console errors, network failures, rage clicks, and dead clicks captured during the session.
Use Session Replay when a chart shows a drop-off or anomaly and you need the qualitative behavior behind it. For pure quantitative breakdowns of where users drop off, use [Funnel Analysis](https://amplitude.com/docs/analytics/charts/funnel-analysis/funnel-analysis-overview) or [Journeys](https://amplitude.com/docs/analytics/charts/journeys-and-paths) instead.
{% outcomes heading="Explore Session Replay" %}
{% outcome icon="Plug" title="Instrument Session Replay" href="https://amplitude.com/docs/session-replay/instrument-session-replay" %}
Pair your metrics with a video of what users actually did.
{% /outcome %}
{% outcome icon="Eye" title="Find the session behind the metric" href="https://amplitude.com/docs/session-replay/session-replay-viewer" %}
Go from a chart, funnel, or support ticket to the exact session.
{% /outcome %}
{% outcome icon="Target" title="See where users click and scroll" href="https://amplitude.com/docs/heatmaps" %}
Understand which parts of a page get attention and which get ignored.
{% /outcome %}
{% outcome icon="Zap" title="Spot friction users don't report" href="https://amplitude.com/docs/session-replay/overview#frustration-analytics" %}
Catch rage clicks, dead clicks, and errors across sessions.
{% /outcome %}
{% outcome icon="ShieldCheck" title="Protect customer privacy" href="https://amplitude.com/docs/session-replay/manage-privacy-settings-for-session-replay" %}
Mask sensitive content, honor consent, and control what gets captured.
{% /outcome %}
{% outcome icon="Workflow" title="Capture the sessions that matter" href="https://amplitude.com/docs/session-replay/targeted-replay-capture" %}
Focus replays on specific users, pages, and flows.
{% /outcome %}
{% /outcomes %}
## Instrument Session Replay
Session Replay requires instrumentation beyond standard Amplitude instrumentation. Start with the [SDK catalog](https://amplitude.com/docs/session-replay/instrument-session-replay), or jump to the implementation guide for your platform.
- [Browser SDK plugin](https://amplitude.com/docs/sdks/session-replay/session-replay-plugin) for teams that already use the Amplitude Browser SDK.
- [Browser standalone SDK](https://amplitude.com/docs/sdks/session-replay/session-replay-standalone-sdk) for teams that need replay capture without the Browser SDK.
- [iOS plugin](https://amplitude.com/docs/sdks/session-replay/session-replay-ios-plugin) or [iOS standalone SDK](https://amplitude.com/docs/sdks/session-replay/session-replay-ios-standalone-sdk).
- [Android plugin](https://amplitude.com/docs/sdks/session-replay/session-replay-android-plugin) or [Android standalone SDK](https://amplitude.com/docs/sdks/session-replay/session-replay-android-standalone).
- [React Native plugin](https://amplitude.com/docs/sdks/session-replay/session-replay-react-native-sdk-plugin) or [React Native standalone SDK](https://amplitude.com/docs/sdks/session-replay/session-replay-react-native-standalone-sdk).
- [Google Tag Manager](https://amplitude.com/docs/sdks/session-replay/session-replay-google-tag-manager), [Segment](https://amplitude.com/docs/sdks/session-replay/session-replay-integration-with-segment), and [RudderStack](https://amplitude.com/docs/sdks/session-replay/session-replay-rudderstack-integration) integrations.
## View and analyze replays
Use replays to understand the exact user sessions behind charts, support tickets, and homepage activity. Pair playback with analysis tools that surface patterns across many sessions.
- [View and search replays](https://amplitude.com/docs/session-replay/session-replay-viewer) from charts, User Look-Up, your homepage, or the replay search page.
- [Create heatmaps](https://amplitude.com/docs/heatmaps) to analyze click, selector, and scroll behavior.
- [Use zoning](https://amplitude.com/docs/zoning-insights) to group related page elements for heatmap analysis.
- [Filter replays by sentiment](https://amplitude.com/docs/session-replay/filter-replays-by-sentiment) to focus on feedback signals.
- [Bookmark session replays](https://amplitude.com/docs/session-replay/bookmarkable-session-replays) to keep important sessions beyond the standard retention period.
## Privacy and operations
Session Replay includes privacy controls for masking, user consent, and user-generated content. Configure these controls before you capture production traffic.
- [Manage privacy settings](https://amplitude.com/docs/session-replay/manage-privacy-settings-for-session-replay) for masking levels and overrides.
- [Apply consent management best practices](https://amplitude.com/docs/session-replay/best-practices-for-managing-user-consent) before you capture replay data.
- [Create user-generated content filter rules](https://amplitude.com/docs/session-replay/ugc-filter-rules) to prevent sensitive content capture.
- [Monitor replay ingestion](https://amplitude.com/docs/session-replay/ingestion-monitor) to track capture volume and ingestion health.
- [Configure targeted replay capture](https://amplitude.com/docs/session-replay/targeted-replay-capture) to capture sessions that match specific events, properties, or page URLs.
{% academy-link title="Contextualize User Experience with Session Replay" url="https://academy.amplitude.com/contextualize-user-experience-with-session-replay" description="Learn new tools and strategies for governing and maintaining your Amplitude data for continued business value." /%}
================================================================================
# Introducing Session Replay
URL: https://amplitude.com/docs/session-replay/overview
================================================================================
# Introducing Session Replay
Session Replay records real user sessions in your product and replays them, so you can watch exactly what a user did alongside the same events and analytics you track in Amplitude. Use it to understand the "why" behind your product metrics and conversion drops: watch where users hesitate, where they drop off in a funnel, and how they move through the flows you measure quantitatively.
Use Session Replay when you want to watch what one user actually did in a single session. If you want an aggregate view of where users click, tap, and scroll across many sessions, use [Heatmaps](https://amplitude.com/docs/heatmaps) instead.
Find Session Replay in the left-hand sidebar in Amplitude Analytics.
[View and modify Session Replay settings in your organization settings](https://amplitude.com/docs/admin/account-management/account-settings#session-replay-settings).
{% callout type="note" heading="Enabling Session Replay" %}
Session Replay isn't enabled by default and requires instrumentation beyond the standard Amplitude instrumentation.
{% /callout %}
## Data retention
Session replay uses existing Amplitude tools and APIs to handle privacy and deletion requests.
{% callout type="note" heading="Consent management and Session Replay" %}
While privacy laws and regulations vary across states and countries, certain constants exist, including the requirements to disclose in a privacy notice the categories of personal information you are collecting, the purposes for its use, and the categories of third parties with which personal information is shared. When implementing a session replay tool, you should review your privacy notice to make sure your disclosures remain accurate and complete. And as a best practice, review your notice with legal counsel to make sure it complies with the constantly evolving privacy laws and requirements applicable to your business and personal information data practices.
{% /callout %}
### Retention period
If your Amplitude plan includes Session Replay, Amplitude retains raw replay data for 30 days from the date of ingestion.
Purchase extra retention time, up to a maximum of 12 months. For more information, contact [Amplitude Support](https://support.amplitude.com).
If you purchase extra session volume, Amplitude retains raw replay data for up to 12 months from the date of ingestion. If you need a more strict policy, contact Amplitude support to set the value to 30 days.
Changes to the retention period impact replays ingested after the change. Sessions captured and ingested before a retention period change retain the previous retention period.
Replays that are outside of the retention period aren't viewable in Amplitude.
{% callout type="note" heading="" %}
The [Session Replay Agent](https://amplitude.com/docs/amplitude-ai/session-replay-agent) analyzes session replays at scale to surface friction points, navigation patterns, and engagement insights automatically.
{% /callout %}
## Use Session Replay to review user activity
You can launch a session replay from a user's event stream, inside a chart, or from your homepage. Replays are generally available for viewing five minutes after a session begins.
When viewing a session replay from your homepage or from a search, the user's event stream syncs with the replay. You can select an event from the stream, and the replay jumps to that point in the session. Event-stream sync isn't available when viewing a replay from a chart.
Session Replay supports user sessions of any length.
{% callout type="note" heading="AI generated names" %}
Event names with a _sparkle_ icon indicate that Amplitude has generated a name to provide more context around the action a user is taking. These are Autocapture events ingested as `Page Viewed`, `Element Clicked`, and `Element Changed`. Amplitude uses property information to make these events more valuable in the event stream. Click any event to see its ingested name and properties.
{% /callout %}
## Error analytics and console logs
Session Replay can capture and display technical errors and console logs that occur during user sessions. Error capture helps you understand whether technical issues are impacting user experience and correlate errors with drops in conversion or engagement.
Error Analytics covers the following types of error capture:
- **Console Errors**: JavaScript console logs, warnings, and errors. Console errors display in the console panel within the session replay modal.
- **Network Errors**: Failed network requests and API calls. Network errors display at the bottom of the session replay modal.
### Requirements
Error Analytics features have different SDK requirements:
| Feature | SDK | Minimum Version |
| -------------- | --------------------------------------------------------------------------------------------------------------------------------- | --------------- |
| Console Errors | [Session Replay Browser SDK](https://amplitude.com/docs/sdks/session-replay/session-replay-standalone-sdk) (`@amplitude/session-replay-browser`) | 1.22.4 |
| Console Errors | [Session Replay Browser SDK Plugin](https://amplitude.com/docs/sdks/session-replay/session-replay-plugin) (`@amplitude/plugin-session-replay-browser`) | 1.16.6 |
| Network Errors | [Analytics Browser SDK](https://amplitude.com/docs/sdks/analytics/browser/browser-sdk-2) (`@amplitude/analytics-browser`) | 2.24.0 |
When enabled, Session Replay captures:
- **JavaScript console logs**: Console messages, warnings, and errors logged by your application
- **Network errors**: Failed network requests and API calls
- **Runtime errors**: JavaScript errors that occur during the session
### View console logs in a replay
To view console logs and errors in a session replay:
1. Open a session replay from a chart, User Look-Up, or the Session Replay list.
2. Look for the console icon in the replay interface.
3. Click the console icon to expand the console log view.
The console view displays logs, warnings, and errors in chronological order alongside the session timeline. Click any log entry to jump to that moment in the replay.
### Enable or disable console logs
Admins and managers can enable or disable console log capture through organization settings:
1. Navigate to _Settings > Organization Settings_.
2. Go to the _Session Replay & Heatmaps_ section.
3. Toggle the **Console Logs** setting on or off for your projects.
Changes to this setting apply to future session captures only.
### Analyze error events
Error events captured during sessions appear in your event stream and can be analyzed like any other event. You can:
- Use [Event Segmentation](https://amplitude.com/docs/analytics/charts/event-segmentation/event-segmentation-build) to measure error frequency and trends
- Include error events in [Funnel Analysis](https://amplitude.com/docs/analytics/charts/funnel-analysis/funnel-analysis-build) to review how errors impact conversion
- Filter session replays by error events to focus on problematic sessions
Error analysis helps quantify the business impact of technical issues and prioritize fixes based on data.
## Replay Captured event
Amplitude automatically sends a `[Amplitude] Replay Captured` event when it successfully captures a session replay. This event includes the `[Amplitude] Session Replay ID` property, which links the event to the captured replay.
The event uses the device ID passed to the Session Replay SDK or browser SDK plugin. The session ID is added to the event based on your project's Amplitude session definition. The event doesn't use user ID.
### Use the Replay Captured event
The `[Amplitude] Replay Captured` event appears in your event stream and you can analyze it like any other event. For example, you can:
- Use [Event Segmentation](https://amplitude.com/docs/analytics/charts/event-segmentation/event-segmentation-build) to measure replay capture rates and trends.
- Filter charts and analyses by the event to focus on sessions with captured replays.
The `[Amplitude] Replay Captured` event indicates that the replay is available for viewing in Amplitude. When you see this event in a user's event stream, you can view the associated session replay.
{% callout type="note" heading="" %}
Amplitude sends the `[Amplitude] Replay Captured` event automatically. You don't need to instrument this event yourself. This event doesn't count toward your event volume or MTU (Monthly Tracked Users).
{% /callout %}
{% callout type="note" heading="" %}
The `[Amplitude] Replay Captured` event may create anonymous users if the device ID can't be associated with an existing user.
{% /callout %}
{% callout type="note" heading="" %}
You may see multiple `[Amplitude] Replay Captured` events in a session replay timeline. Multiple events can appear when multiple browser tabs are open with different active sessions. Amplitude only captures replays when device IDs and session IDs match. Because timelines are based on events captured during the replay period, events from different sessions may overlap in the timeline.
{% /callout %}
## Frustration analytics
Session Replay automatically detects and highlights user frustration signals during playback. Frustration signals help you identify UX problems that may not be obvious in traditional analytics.
{% callout type="note" heading="Requirements" %}
Frustration Analytics requires [Analytics Browser SDK](https://amplitude.com/docs/sdks/analytics/browser/browser-sdk-2) (`@amplitude/analytics-browser`) version 2.24.0 or later.
{% /callout %}
### Frustration event types
- **Rage clicks**: When users rapidly click the same element multiple times, usually indicating something isn't working as expected. A rage click often means a button or link appears interactive but doesn't respond.
- **Dead clicks**: When users click on elements that appear clickable but have no functionality, such as non-interactive images styled like buttons or links that lead nowhere.
### View frustration events in replays
Frustration events appear directly in the session timeline and event stream, making them easy to spot:
1. Open a session replay.
2. Look for rage click and dead click indicators in the timeline.
3. Click on a frustration event to jump to that moment in the replay.
Like error events, frustration events can be analyzed using Event Segmentation and Funnel Analysis to understand their impact on user behavior and conversion rates.
### View Session Replay from User Look-Up
To access Session Replay from a user's event stream, use the [User Look-Up](https://amplitude.com/docs/analytics/user-data-lookup) feature. User Look-Up can be helpful if a user has reported a potential bug during their session, or if you want to understand whether a user's experience is representative of a bigger trend.
Find the user with User Look-Up (you need their user ID to do this), then click _Play Session_ next to the session you're looking for in the event stream. The replay appears to the right, where you can review session activity. You can generate a link to share the replay with your team from the view in a User Look-Up event stream. Click _Copy URL_ from the view to copy the link.
### View Session Replay from a chart
To use Session Replay in a chart, follow these steps:
1. Open the Amplitude chart that contains the events you want to look at.
2. Open the [Microscope](https://amplitude.com/docs/analytics/microscope) and click **Watch Session Replays**.
3. Check the **Streams with session replays** box.
The replay modal appears, where you can:
- Browse the available replays that correspond to the specific data point on the chart
- Pause replay
- Skip forward and backwards by 10-second increments
- Speed up and down
- Skip periods of inactivity
- Navigate to the standalone replay page and watch with event sync
- Copy and share the replay's URL
The user's cursor movement displays as a red line, and masked HTML elements appear as a series of asterisks. Session Replay shows the timestamp of the session as it occurred.
#### Availability in Amplitude charts
Session Replay is available in the following Amplitude chart types, with these restrictions around each chart type's available metrics:
{% callout type="note" %}
In the Funnel Analysis row, "Conversion" refers to the funnel's **Measured as** setting — not individual users converting. Once a funnel uses the Conversion measure, replays are available for everyone in the funnel, including users who dropped off.
{% /callout %}
- **Event Segmentation**: Session replay is available for all six measures.
- **Funnel Analysis**: Session Replay is available when the funnel is measured as Conversion (set in the **Measured as** button group). It isn't available for other measures such as Time to Convert. When a funnel is measured as Conversion, you can watch replays for all outcomes at every step — users who converted to the next step and users who dropped off. Click a converted or drop-off data point at any funnel step to open [Microscope](https://amplitude.com/docs/analytics/microscope), then select **Watch Session Replays**. Events appear in chronological order (oldest to newest).
- **Journeys**: Session replay is available on the Pathfinder and Journey Map visualizations.
- **User Sessions**: Session replay is available for all six measures. The User Sessions chart doesn't allow session replays for [custom defined sessions](https://amplitude.com/docs/data/sources/instrument-track-sessions).
- **Experiment charts**: Session replay is available on all Experiment charts.
### View Session Replay from your homepage
With Session Replay, your homepage shows 100 sessions captured over the past seven days. Each session displays its start time, user ID, session length, and country.
{% callout type="note" heading="" %}
If you can't see the Session Replay widget and have a customized [home page](https://amplitude.com/docs/get-started/amplitude-home-page), reset the home page and then re-add your customizations to make the widget visible.
{% /callout %}
Click **Play** to see the session view in the modal that appears.
## View the number of captured replays
To see the number of captured replays, create an [Event Segmentation](https://amplitude.com/docs/analytics/charts/event-segmentation/event-segmentation-build) chart:
1. Select the `[Amplitude] Replay Captured` event.
2. Group by the `[Amplitude] Session Replay ID` event property.
3. In the formula, use `PROPCOUNT(A)` to count distinct session replay IDs.
`PROPCOUNT(A)` returns the number of distinct property values for the property by which the event is grouped. In this example, the formula retrieves the number of different session replay IDs.
To review your Session Replay quota and retention time frame, navigate to the Plans & Billing page for your organization.
## Search for a replay
Session replay gives you two options for searching replays: either by date, or with a filter.
1. Navigate to the Session Replay page to view the complete list of session replays available for viewing.
2. To narrow the list by date, click the calendar icon just above the list and select the starting and ending dates you want to use. You can also use a preset time range: one day, seven days, or 30 days.
Filtered results by date or time frame match the project's timezone.
3. To narrow the list with a filter, click **Add Filter**. You can filter by cohorts, events, event properties, user properties, and session duration. You can also use multiple filters to further narrow your list.
After you make your selection, view replays that took place within the selected time frame, or replays that meet your filter specifications. Your search results generate a unique URL that you can share with your team.
{% callout type="note" %}
Note that if you apply a filter to exclude replays with a specific property value, Session Replay search returns results for all replays with a different value for that property, **and** replays with **missing** values for that property.
{% /callout %}
The list of results shows a maximum of 100 replays.
## Link directly to a replay
You can construct a direct URL to link to a specific session replay. A direct URL is useful for sharing replays programmatically or embedding links in external tools.
Using the following URL structure:
```text
https://app.[eu.]amplitude.com/analytics/<orgUrl>/session-replay/project/<projectId>/search/replay?sessionReplayId=<replayId>
```
Replace the following placeholders:
| Placeholder | Description | How to find it |
| ------------- | ------------------------------------------------------------------------------- | ------------------------------------------------------------------------------------------------------------ |
| `eu.` | Include this subdomain only for EU-based Amplitude accounts. Omit it otherwise. | Check the URL when logged in to Amplitude. EU accounts use `app.eu.amplitude.com`. |
| `<orgUrl>` | Your organization's URL identifier. | Visible in the browser URL when logged in. For example, `https://app.amplitude.com/analytics/myorg/...`. |
| `<projectId>` | The numeric ID of the project that captured the replay. | Navigate to _Settings > Projects_, select the project, and copy the ID from the URL or project details page. |
| `<replayId>` | The session replay ID. | Available as the `[Amplitude] Session Replay ID` event property on `[Amplitude] Replay Captured` events. |
For example:
```text
https://app.amplitude.com/analytics/myorg/session-replay/project/123456/search/replay?sessionReplayId=abc123def456
```
## How session replay querying works
When you search for replays by event in Amplitude, Amplitude finds replays that span those events. Amplitude looks for replays that include the time period when your events occurred.
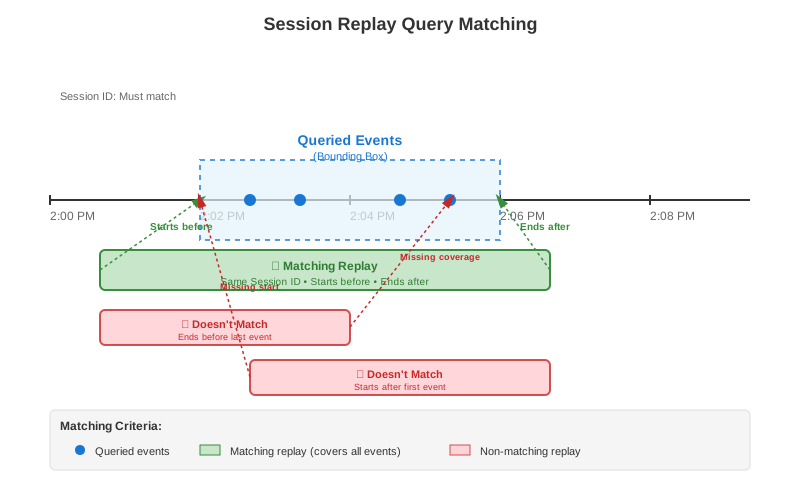
### Matching replays to events
Amplitude matches replays to your events by finding replays that:
1. **Match the session ID**: The replay belongs to the same session as your events. Matching the session ID ensures you're viewing the correct replay for that user session.
2. **Start before your events**: The replay begins before the first event you're looking at
3. **End after your events**: The replay continues past the last event you're looking at
These matching criteria ensure the replay captures the full context around the events you're analyzing. For example, if you're looking at events that occurred between 2:00 PM and 2:05 PM in a specific session, Amplitude returns replays that belong to the same session. The replays started before 2:00 PM and ended after 2:05 PM.
## Add a replay to a dashboard or notebook
There are three ways you can add a Session Replay to a dashboard or notebook:
- From the Session Replay page itself (accessible from the homepage and Session Replay search)
- From within [User Look-Up](https://amplitude.com/docs/analytics/user-data-lookup)
- From within an individual chart
## Use cases
With Session Replay, you can:
- **Improve product conversions**: Blend quantitative and qualitative insights and use new information to hypothesize and test new workflows that boost conversions and revenue.
- **Diagnose product issues faster**: Isolate specific user sessions for troubleshooting bugs, getting critical qualitative context that helps teams speed up resolution process.
- **Identify significant UX behaviors**: Go from micro to macro by checking if single user sessions are representative of larger trends and drive changes that benefit more customers.
- **Unlock qualitative insights at scale**: Explore how users are engaging with a newly launched feature and gauge customer behavior at scale without running surveys or interviews.
- **Tie replays to behaviors that matter**: Sync your user stream to meaningful events in your session replay to quickly inspect behaviors and inform decisions faster.
- **Tell stories and innovate faster**: Share links and add replays to notebooks and dashboards to get buy-in across colleagues and act on initiatives faster.
## Limitations
There are some limitations when using Session Replay:
- Session Replay can only be used to segment by users, and isn't available for [account-level reporting](https://amplitude.com/docs/analytics/account-level-reporting).
- If you are in a portfolio view, you can see replays for different users under different projects. However, note that Session Replay doesn't stitch together replays from a single user across multiple projects. If a user begins a session in one project and then continues to a second project, Amplitude Analytics generates separate replays for that user for each project.
- Session Replay doesn't capture these unsupported HTML elements:
- Canvas
- WebGL
- `object` elements: Plugins such as Flash, Java, Silverlight, and so forth, except `object type="image"`
- Lottie Animations (web and mobile)
- Cross-origin iframes that don't load the Session Replay SDK with `crossOriginIframes.enabled: true` (for example, third-party embeds). To capture first-party cross-origin iframes, go to [Cross-origin iframe recording](https://amplitude.com/docs/sdks/session-replay/cross-origin-iframes).
- Assets that require authentication, like fonts, CSS files, and images
## Troubleshoot replay playback
Sometimes, replays may appear missing or otherwise unavailable for playback. The causes of these issues, and steps you can take to mitigate them, depend on the issue.
### Parts of this session weren't captured
If you experience this error, parts of a replay may show as inactive periods because Amplitude doesn't capture any user interaction during that period. Sometimes, the issue impacts the entire replay.
When you see this error in a replay, one of the following may have happened:
- **The user closed the browser**. Amplitude captures and uploads session replays as users use your product. If users leave the app or close their browser before the session replay upload completes, some parts of the replay appear to be missing in Amplitude and unavailable for playback.
- **Network issues**. If the user on your site or app experiences network degradation, their replay may fail to upload. If you notice a pattern, or commonly experience this issue, contact [Amplitude Support](https://gethelp.amplitude.com/hc/en-us).
- **Requests throttled**. During holiday periods, special events, or other peak times, traffic to your site or app may spike resulting in a large volume of session replays. In these instances, Amplitude may throttle uploads to keep system performance.
If you see this error:
- **Check for throttle errors**. Open the [Ingestion Monitor](https://amplitude.com/docs/session-replay/ingestion-monitor) and check for a spike in `429` throttling errors. If you know a period of high traffic is coming up due to a campaign or other event, contact [Amplitude Support](https://gethelp.amplitude.com/hc/en-us) for a temporary change to the throttle threshold.
- **Leave in-product feedback**. Leave a thumbs-down if the replay you're viewing doesn't meet expectation.
- **Contact Amplitude**. If you see issues in replay collection that you think might relate to missing data, contact [Amplitude Support](https://gethelp.amplitude.com/hc/en-us).
### Replay temporarily unavailable due to ingestion delay
This message appears when you view a replay that Amplitude ingested within the last five minutes. Amplitude takes one or two minutes to make a replay available for playback.
Live replays that are longer than five minutes become available for playback as soon as Amplitude receives enough data to generate the replay. Refresh the page for the most recent replay data.
================================================================================
# Friction Monitor
URL: https://amplitude.com/docs/session-replay/friction-monitor
================================================================================
# Friction Monitor
Friction Monitor finds the user experience problems that hurt your product most, ranks them by impact, and routes each one to the team that owns it. It detects friction signals that Amplitude captures during real user sessions, groups matching signals into distinct issues, and links the session replays where each issue happened. Product managers, UX teams, and engineers use Friction Monitor to move from a flood of individual friction signals to a short, prioritized list of problems worth fixing.
Use Friction Monitor when you want a ranked, cross-session view of which UX problems to prioritize. If you want to inspect friction signals within a single user's session, watch the [session replay](https://amplitude.com/docs/session-replay/overview) directly instead.
{% callout type="note" heading="Closed beta" %}
Friction Monitor ships as an internal release and closed beta under *Experience Analytics > Friction Monitor*. Only eligible early-access accounts have access. Contact your Amplitude account team to request access.
{% /callout %}
## How Friction Monitor works
Friction Monitor turns raw friction signals into a ranked list of issues you can act on. It works in a few stages:
- **Detect and fingerprint signals**: Friction Monitor reads Autocapture data to detect friction signals, then fingerprints each one so it can recognize the same problem across many sessions.
- **Group signals into issues**: It groups matching signals into distinct issues, so a single recurring problem shows up as one issue rather than thousands of separate events.
- **Rank by impact**: Amplitude scores each issue's impact and orders the list so the highest-impact issues surface first. Each assessment includes a short description, an impact score, and recommended actions.
- **Link related replays**: Each issue links to the session replays where it occurred, so you can watch the problem happen in context.
- **Label and route**: Amplitude generates a label for each issue and routes it automatically to the relevant team or owner.
## What Friction Monitor detects
In this release, Friction Monitor detects two types of friction signal:
- **Dead clicks**: Clicks on elements that appear interactive but do nothing, such as a non-interactive image styled like a button or a link that leads nowhere.
- **Error clicks**: Clicks that coincide with an error in the session, which often point to a broken or failing interaction.
Amplitude captures these signals through Autocapture, so you don't need to instrument them manually.
## How Amplitude ranks and routes issues
Friction Monitor prioritizes issues by impact and helps you get each one in front of the right people:
- **Impact ranking**: Amplitude ranks issues by their estimated impact so your team can focus on the problems that matter most.
- **AI labels and automatic routing**: Amplitude generates a label for each issue and routes it to the team or owner responsible for that part of the product.
- **Slack notifications**: Friction Monitor sends notifications to Slack so teams learn about new or high-impact issues without checking the dashboard.
- **Linear integration**: You can connect issues to Linear to track fixes in your existing workflow.
- **MCP tools**: Friction Monitor exposes MCP tools so you can query issues by team, owner, and impact from an AI assistant.
## Prerequisites
To use Friction Monitor, your account needs:
- Access to the Friction Monitor closed beta. Eligibility applies.
- Amplitude AI features enabled.
- [Autocapture](https://amplitude.com/docs/session-replay/overview) enabled, with enough event volume for Amplitude to detect and group friction signals.
## Where to find Friction Monitor
Find Friction Monitor in Amplitude under *Experience Analytics > Friction Monitor*. The list view shows your ranked issues, and selecting an issue opens its detail view with the impact assessment and linked replays.
## Coming soon
{% callout type="note" heading="" %}
Amplitude is expanding Friction Monitor beyond click-based signals. Planned capabilities include a pipeline that analyzes captured replays more broadly, additional friction types, anomaly detection, and revenue and business-impact analysis. These aren't available yet.
{% /callout %}
## Limitations
{% callout type="note" heading="" %}
Friction Monitor detects dead clicks and error clicks in this release. It relies on Autocapture data, so it can't detect friction on interactions that Autocapture doesn't capture. Issue detection and grouping depend on having enough event volume.
{% /callout %}
================================================================================
# Ingestion Monitor
URL: https://amplitude.com/docs/session-replay/ingestion-monitor
================================================================================
# Ingestion Monitor
Amplitude provides the Ingestion Monitor to help debug Session Replay implementation issues by tracking Session Replay status over time.
Access the Ingestion Monitor from:
- The top-right of the Session Replay section of your project's **Users & Sessions** tab.
- Any individual replay that displays an error.
### Tracked statuses
The Ingestion Monitor displays charts with the count of each status over a time range that you select:
- Successful request (status 200)
- Throttling errors (status 429)
- Quota exceeded errors (status 402)
- Invalid session IDs
Use these charts to debug unavailable session replays and monitor the health of your Session Replay implementation.
## Troubleshooting
### Short or incomplete replays
If you see short replays (less than 10 seconds) or replays that appear incomplete, check the Ingestion Monitor for 429 throttling errors.
A 429 error means your application sends too many Session Replay requests. Amplitude throttles these requests. Because replays consist of multiple chunks of data, some chunks may not send successfully, which produces incomplete or unusually short replays.
To resolve 429 throttling errors:
1. Reduce your Session Replay sample rate to lower the request volume per second.
2. Monitor the 429 error count in the Ingestion Monitor to confirm that throttling errors decrease after you adjust the sample rate.
================================================================================
# Session matching
URL: https://amplitude.com/docs/session-replay/session-matching
================================================================================
# Session matching
Session Replay matches replays to Amplitude data to provide a complete view of the user journey. Session matching links device and session information from Session Replay to Amplitude sessions.
Session Replay offers multiple session matching options. Choose the option that works best for your technical constraints and session definitions.
## Session matching options
Amplitude provides options to match sessions directly, match events based on time, or match by Amplitude session ID.
### Match Amplitude sessions (recommended)
Match Amplitude sessions based on your project's session definition. Amplitude session matching respects how you configure sessions in your Amplitude project settings, including sessions you define with event properties, timeout windows, or start/end events.
If you use the default `session_id`, Session Replay works automatically with no additional configuration.
If you use a custom session property, configure the Session Replay SDK to extract and send that same property value. Session Replay then matches sessions using your project's custom session definition, which provides the most accurate alignment between replay data and analytics sessions.
#### Requirements for custom session definitions
**Minimum SDK versions:**
- Browser SDK Plugin: `@amplitude/plugin-session-replay-browser` version 1.10.0 or later.
- Browser Standalone SDK: `@amplitude/session-replay-browser` version 1.17.0 or later.
- iOS (plugin and standalone): Session Replay for iOS version 0.11.2 or later.
- Android (plugin and standalone): Session Replay for Android version 0.26.4 or later.
**Project configuration:**
- Configure your custom session definition in _Settings > Projects > Session Definitions_.
- Use the "Counted based on <> Property" option to define sessions by a specific property.
- For more details, refer to [Track sessions](https://amplitude.com/docs/data/sources/instrument-track-sessions).
**Constraints:**
- The session replay ID has the format `<deviceId>/<sessionId>`. Session Replay uses `/` as a delimiter, so neither `deviceId` nor custom session ID values can contain `/`.
- Accepted characters for both `deviceId` and custom session IDs: `a-z A-Z 0-9 _ - . | @ : =`.
- If you need an additional character, contact support.
#### Configure the SDK for custom session definitions
The following code examples apply only if you configured a custom session definition in your Amplitude project settings.
**Browser SDK Plugin:**
Pass a method that extracts the custom session ID from Amplitude events:
```javascript
import * as amplitude from "@amplitude/analytics-browser";
import { sessionReplayPlugin } from "@amplitude/plugin-session-replay-browser";
const sessionReplayTracking = sessionReplayPlugin({
customSessionId: (event) => {
const props = event.event_properties;
if (!props) {
return;
}
const sessionId = props["your_custom_session_id_property"];
return sessionId;
},
});
amplitude.add(sessionReplayTracking);
amplitude.init(AMPLITUDE_API_KEY);
```
**Standalone SDK:**
The standalone SDK treats custom session IDs and timestamp-based session IDs the same way. Pass the session ID to the standalone SDK, and send that same session ID to Amplitude as an event property that matches your project's custom session definition:
```javascript
import * as sessionReplay from "@amplitude/session-replay-browser";
// Initialize Session Replay with session ID
sessionReplay.init(AMPLITUDE_API_KEY, {
customSessionId: (event) => {
const props = event.event_properties;
if (!props) {
return;
}
const sessionId = props["your_custom_session_id_property"];
return sessionId;
},
});
```
Ensure the session ID property name matches the property you configured in your project's custom session definition (_Settings > Projects > Session Definitions_).
**Mobile SDKs:**
The iOS and Android SDKs accept a string session ID directly instead of a callback. Set the value whenever your custom session changes, and send the same value as the session-defining event property to Amplitude:
- iOS: set the `customSessionId` property on the standalone SDK or the plugin. Refer to [Custom session IDs on iOS](https://amplitude.com/docs/sdks/session-replay/session-replay-ios-standalone-sdk#custom-session-ids).
- Android: call `setCustomSessionId` on the standalone SDK or the plugin. Refer to [Custom session IDs on Android](https://amplitude.com/docs/sdks/session-replay/session-replay-android-standalone#custom-session-ids).
### Time-based event matching
Build sessions using 30- or 60-minute time windows based on event activity. Use time-based event matching if your analytics pipeline doesn't include a session ID on events, such as a homegrown pipeline that sends only event timestamps to S3.
Time-based matching links replays to analytics events by device ID and overlapping time windows. It's slightly less precise than true session matching, but still delivers a reliable and useful journey view.
#### Session Replay SDK still needs a session ID
The standalone Session Replay SDK requires a `sessionId` at initialization so replay data uploads to a single bucket per session. This ID is separate from how Amplitude matches replays to analytics events.
With time-based event matching, you can generate the Session Replay `sessionId` entirely on the frontend. It doesn't need to match your analytics session ID or any field in your analytics pipeline.
To align with 60-minute time-based matching, round the current time down to the start of the hour and pass that Unix timestamp in milliseconds to the SDK:
```javascript
const HOUR_MS = 60 * 60 * 1000;
const sessionId = Date.now() - (Date.now() % HOUR_MS);
await sessionReplay.init(AMPLITUDE_API_KEY, {
deviceId: "<string>",
sessionId,
}).promise;
// Call setSessionId when the hour bucket changes
await sessionReplay.setSessionId(Date.now() - (Date.now() % HOUR_MS)).promise;
```
With time-based event matching, the Session Replay `sessionId` is an upload bucket for replay data. It doesn't need to match analytics, but it should still be a valid Unix timestamp in milliseconds so the server accepts the upload.
For 30-minute matching windows, use `30 * 60 * 1000` instead of `HOUR_MS`. Keep the bucket size aligned with the time window you configure in _Organization Settings > Session Replay_.
For more information about initializing the standalone SDK, go to [Session Replay Standalone SDK](https://amplitude.com/docs/sdks/session-replay/session-replay-standalone-sdk).
### Session ID matching (legacy)
Match based on the Amplitude `session_id`, even if the `session_id` doesn't align with custom session definitions. Session ID matching exists for backward compatibility and requires no changes.
## Choose a matching option
Match Amplitude sessions whenever possible, including custom session definitions, as long as you send the same session ID to both Amplitude and Session Replay.
If your analytics pipeline doesn't include a session ID on events, use time-based event matching and generate a frontend session ID for the Session Replay SDK as described in [Session Replay SDK still needs a session ID](#session-replay-sdk-still-needs-a-session-id).
## Configure session matching
Configure session matching at the organization level, not at the project level. Configure your session matching option in _Organization Settings > Session Replay_. For more information, refer to [Session Replay and Heatmap Settings](https://amplitude.com/docs/session-replay/session-replay-settings).
{% callout type="note" heading="Organization-level configuration" %}
Session matching applies to all projects in your organization. Configure this setting in _Organization Settings_, not per project.
{% /callout %}
To configure session matching in your Session Replay SDK implementation, the exact steps depend on which SDK you use:
- **Browser SDK Plugin**: Refer to [Session Replay Browser SDK Plugin](https://amplitude.com/docs/sdks/session-replay/session-replay-plugin) for configuration details.
- **Standalone SDK**: Refer to [Session Replay Standalone SDK](https://amplitude.com/docs/sdks/session-replay/session-replay-standalone-sdk) for configuration details.
- **iOS**: Refer to [Session Replay iOS Standalone SDK](https://amplitude.com/docs/sdks/session-replay/session-replay-ios-standalone-sdk#custom-session-ids) or [Session Replay iOS Plugin](https://amplitude.com/docs/sdks/session-replay/session-replay-ios-plugin#custom-session-ids).
- **Android**: Refer to [Session Replay Android Standalone SDK](https://amplitude.com/docs/sdks/session-replay/session-replay-android-standalone#custom-session-ids) or [Session Replay Android Plugin](https://amplitude.com/docs/sdks/session-replay/session-replay-android-plugin#custom-session-ids).
When using custom session IDs, ensure the Session Replay SDK sends the same session ID value that you use in Amplitude, so that sessions match correctly.
Session matching changes are quick and reversible. You can change your matching option at any time without losing data.
{% callout type="note" heading="Historical data" %}
Changing your session matching option doesn't affect historical data. The change impacts how Amplitude matches and views replays going forward.
{% /callout %}
## Frequently asked questions
### Does session matching require re-instrumentation?
Usually no. If you use custom sessions, ensure the Session Replay SDK sends the same session ID value you already use in Amplitude.
### What are the tradeoffs with time-based matching?
Time-based matching has slightly less precision at session boundaries, but still provides a clear and actionable view of the user journey.
### Can I change the matching option later?
Yes. You can change session matching quickly, and you can fully reverse the change.
### Does changing the matching option affect historical data?
You don't lose any data. The change impacts how Amplitude matches and views replays going forward.
### Is Amplitude deprecating session ID matching?
No. Amplitude continues to support session ID matching, though Amplitude recommends newer options for most use cases.
================================================================================
# Targeted Replay Capture
URL: https://amplitude.com/docs/session-replay/targeted-replay-capture
================================================================================
# Targeted Replay Capture
Targeted Replay Capture (TRC) focuses your Session Replay quota on sessions that match criteria you define, such as events, event properties, user properties, or page URLs, rather than capturing all sessions or relying on random sampling. Use TRC when you need to observe specific behaviors or high-value segments; if you only need broad session coverage, adjust the global sample rate instead.
Configure TRC by adding conditions to the *Sampling* control in your project's Session Replay settings. Each condition can match events, event properties, user properties, or page URLs, and you can combine conditions with OR logic. The Session Replay SDK fetches targeting configurations from a remote config service and evaluates them at runtime to decide whether to capture a session.
## Key capabilities
TRC defines the criteria that Amplitude uses to decide whether to capture a session, and helps you manage your Session Replay quota more efficiently.
### Custom capture criteria
Define rules that capture replays based on:
- **Specific events**: For example, `Checkout Started`.
- **Event properties**: For example, `plan = Pro`.
- **User properties**: For example, `country = US`.
- **Page URLs**: For example, capture only sessions on `/checkout` or any URL matching a pattern.
- **Combinations**: Combine these criteria with `OR` logic.
### Configuration and quota management
Manage TRC through the [Session Replay settings page](https://amplitude.com/docs/session-replay/session-replay-settings) by adding conditions to the *Sampling* control. Add, edit, and remove targeting conditions for each project. The UI estimates how much quota each condition uses based on historical traffic. Set different sample rates for different conditions to control which sessions Amplitude captures and how much quota each condition uses.
## Use cases
- Capture replays only for users who encounter errors or drop off at key points.
- Focus on high-value user segments or critical product flows.
- Capture sessions on specific pages or flows, such as checkout or onboarding.
- Reduce noise and cost by avoiding unnecessary replay capture.
## Configure Targeted Replay Capture
TRC requires [Session Replay Browser SDK Plugin](https://amplitude.com/docs/sdks/session-replay/session-replay-plugin) version `@amplitude/plugin-session-replay-browser@1.22.0` or higher and [permissions to manage Session Replay settings](https://amplitude.com/docs/admin/account-management/user-roles-permissions#manage-session-replay-and-heatmap-settings). URL matching requires plugin version `1.26.2`+ or standalone SDK `@amplitude/session-replay-browser@1.32.2`+. If you haven't installed the plugin, do that first.
Configure TRC per project:
1. Navigate to *Settings > Organizational Settings > Session Replay Settings*. For more information, refer to the [Session Replay settings page](https://amplitude.com/docs/session-replay/session-replay-settings).
2. Select the project you want to configure.
3. In the *Sampling* section, select **Add Condition** to create a new targeting condition.
4. Define your targeting criteria for the condition.
Add multiple conditions and combine them with OR logic. Each condition can include:
- Event types.
- Event properties.
- User properties.
- Page URLs.
{% callout type="note" heading="" %}
You must capture and send events, event properties, and user properties to Amplitude during the session for event- and property-based targeting conditions to work. Page URL conditions evaluate the user's current URL directly and don't require a matching event.
{% /callout %}
## Page URL targeting
Page URL targeting captures replays only when users visit specific pages or URL patterns. This capability is in beta for web Session Replay.
Page URL targeting requires one of the following SDK versions:
- Plugin: `@amplitude/plugin-session-replay-browser@1.26.2` or higher.
- Standalone SDK: `@amplitude/session-replay-browser@1.32.2` or higher.
To add a Page URL condition:
1. In the *Sampling* section, select **Add Condition** and open the condition editor.
2. Add a **Page URL** condition.
3. Select an operator and enter a URL or pattern.
4. Set the sample rate for the condition and save.
Supported operators:
| Operator | Matches when |
| --- | --- |
| **is** | The current page URL exactly matches the value you enter. |
| **is not** | The current page URL doesn't exactly match the value you enter. |
| **contains** | The current page URL includes the text you enter. |
| **does not contain** | The current page URL doesn't include the text you enter. |
| **glob match** | The current page URL matches a glob pattern. For example, `https://example.com/checkout/*` matches any checkout subpath. |
{% callout type="tip" heading="" %}
Use Page URL targeting to focus replay capture on high-value flows such as checkout, onboarding, or account settings without capturing every session.
{% /callout %}
### How Page URL targeting evaluates
The Session Replay SDK evaluates Page URL conditions against the user's current browser URL. On single-page applications, the SDK re-evaluates targeting when the URL changes. If the user navigates to a URL that no longer matches, capture stops for that session.
{% callout type="note" heading="Capture timing for Page URLs" %}
For Page URL conditions, replay capture begins when the user's URL matches the condition. Replays don't include activity from before the URL match.
{% /callout %}
## SDK support
TRC requires the Amplitude Browser Analytics SDK with the Session Replay Browser SDK Plugin version `@amplitude/plugin-session-replay-browser@1.22.0` or higher. Integrate both the Amplitude Browser Analytics SDK and the Session Replay Plugin into your setup to use TRC.
URL matching support requires one of the following:
- Plugin: `@amplitude/plugin-session-replay-browser@1.26.2` or higher.
- Standalone SDK: `@amplitude/session-replay-browser@1.32.2` or higher.
{% callout type="warning" heading="Standalone SDK limitations" %}
The standalone SDK supports Page URL targeting only. Event-, property-, and user-based TRC conditions require the [Session Replay Browser SDK Plugin](https://amplitude.com/docs/sdks/session-replay/session-replay-plugin) with the Amplitude Browser Analytics SDK.
{% /callout %}
## Evaluation timing
The SDK fetches the targeting configuration at session start. For event-, property-, and user-based conditions, the SDK uses that configuration for the entire session. If a matching event occurs later in the session, the SDK evaluates it against the configuration that was active at session start. Updates to targeting rules apply only to new sessions.
For Page URL conditions, the SDK also re-evaluates when the URL changes during the session, such as during single-page app navigation.
{% callout type="note" heading="Capture timing" %}
Session replay capture begins only after the targeting condition triggers. TRC has no "lookback" period. Replays don't capture activity before the condition triggers. For event-based conditions, capture starts when the matching event fires. For Page URL conditions, capture starts when the user's URL matches.
{% /callout %}
================================================================================
# Session Replay and Heatmap Settings
URL: https://amplitude.com/docs/session-replay/session-replay-settings
================================================================================
# Session Replay and Heatmap Settings
Use Session Replay settings to manage replay capture across your organization's projects. From these settings, you can control sample rates, enable or disable capture, and monitor quota usage.
The organizational settings also let admins and managers view or modify [Session Replay](https://amplitude.com/docs/session-replay) settings for the projects they have access to.
The main settings page displays your organization's total session replay capture plan allowance and current use. The page also lists projects where you can toggle session capture and heatmap capture, and view the sample rate, instrumentation status, masking setting, and masking overrides.
On each project's settings page, find project-level controls for:
- Sampling
- Dynamic Sampling
- Masking Level
- Masking Overrides
- Console Tracking
## Sampling
View and set the sampling rate for any condition you define. The Sampling section shows a monthly estimate of sessions that match the conditions you define, and estimates how many sessions Amplitude captures. By default, Session Replay uses the **Any Session** condition. For more information about conditions, refer to [Targeted Replay Capture](https://amplitude.com/docs/session-replay/targeted-replay-capture).
## Dynamic sampling
If you're unsure how to balance your sample rate against your monthly quota, dynamic sampling may help. Dynamic sampling adjusts the sample rate each day so you use your full quota by month end. Dynamic sampling helps you stay within your quotas, but Amplitude can't guarantee an exact 100% match or prevent overage. Choose which projects use dynamic sampling. Session Replay quota is org-wide, but the sampling rate is per project. If you enable dynamic sampling on multiple projects, those projects share the same sample rate.
Session Replay doesn't support dynamic sampling if you use [targeted session replay capture](https://amplitude.com/docs/session-replay/targeted-replay-capture) in any project or set the sample rate in the SDK for any project.
## Masking level
Set the [masking level](https://amplitude.com/docs/session-replay/manage-privacy-settings-for-session-replay#masking-levels) for all captured sessions.
## Masking overrides
Define overrides for the masking level you set. For more information, refer to [Manage privacy settings for Session Replay](https://amplitude.com/docs/session-replay/manage-privacy-settings-for-session-replay#override-preset-policy-levels).
## Console tracking
Enable or disable console tracking, and set the types of console information you want to capture. Select one or more from `Info`, `Log`, `Warn`, and `Error`.
{% callout type="tip" heading="" %}
The Session Replay viewer also includes a **Network** tab in the _DevTools_ section. Use the Network tab alongside console logs to inspect network requests captured during a replay. For details, go to [Session Replay viewer](https://amplitude.com/docs/session-replay/session-replay-viewer).
{% /callout %}
## Multi-tab behavior
Session Replay captures activity on the currently focused tab. When the user switches between tabs, the replay follows their focus and automatically switches to show the tab they're actively viewing.
When the user switches tabs, the replay cuts directly to the new tab with a fresh snapshot of the new tab's current state. Session Replay doesn't actively capture background tabs while out of focus. The event timeline captures and displays events from all tabs, regardless of which tab had focus at the time.
While viewing a Session Replay, you can't manually switch to view background tabs. The replay strictly follows the user's actual focus. If the user switches away from the browser entirely, the replay shows an inactive period while displaying the last focused tab.
================================================================================
# Self-Host Session Replay SDKs
URL: https://amplitude.com/docs/session-replay/session-replay-self-hosting
================================================================================
# Self-Host Session Replay SDKs
Self-hosting lets you serve Amplitude SDK files and route API calls through your own domain instead of `amplitude.com`. The two main reasons to self-host are:
- **Ad blocker bypass**: Many browser extensions and tracking prevention tools block requests to `amplitude.com` domains. Routing through your own domain avoids the block.
- **Data residency / compliance**: Your organization may require that data never leaves your own infrastructure before it reaches Amplitude.
There are two independent parts to self-hosting:
1. **Host the SDK script:** serve the SDK `.js` file from your own CDN or static file server (browser only; npm/bundled installs skip this step).
2. **Proxy API calls:** forward SDK network requests through your own server before they reach Amplitude's ingestion endpoints.
You can implement either or both parts independently.
---
## Part 1: Self-host the SDK script
Self-hosting the SDK script applies to browser-based SDKs loaded through a `<script>` tag. If you install through npm and bundle the SDK yourself, skip to [Part 2: Proxy API calls](#part-2-proxy-api-calls).
### Get the SDK file
**Option A: Download from Amplitude's CDN:**
```bash
# Session Replay Plugin (latest: 1.28.1)
curl -O https://cdn.amplitude.com/libs/plugin-session-replay-browser-1.28.1-min.js.gz
# Session Replay Standalone SDK (latest: 1.39.0)
curl -O https://cdn.amplitude.com/libs/session-replay-browser-1.39.0-min.js.gz
# Browser SDK (latest: 2.42.0 — only needed if also self-hosting analytics)
curl -O https://cdn.amplitude.com/libs/analytics-browser-2.42.0-min.js.gz
```
**Option B: Pull from npm:**
```bash
pnpm pack @amplitude/plugin-session-replay-browser@1.28.1
# or
pnpm pack @amplitude/session-replay-browser@1.39.0
```
The `pnpm pack` command produces a `.tgz` tarball. Extract the tarball and locate the UMD bundle inside the `package/lib/scripts/` directory, for example, `plugin-session-replay-browser-1.28.1.umd.js`. Serve that file from your own origin.
For the latest version numbers, check:
- [npm: @amplitude/plugin-session-replay-browser](https://www.npmjs.com/package/@amplitude/plugin-session-replay-browser)
- [npm: @amplitude/session-replay-browser](https://www.npmjs.com/package/@amplitude/session-replay-browser)
### Serve the file
Host the file on your own CDN or static file server, then update your `<script>` tags:
```html
<!-- Before -->
<script src="https://cdn.amplitude.com/libs/analytics-browser-2.42.0-min.js.gz"></script>
<script src="https://cdn.amplitude.com/libs/plugin-session-replay-browser-1.28.1-min.js.gz"></script>
<!-- After -->
<script src="https://assets.yourdomain.com/libs/analytics-browser-2.42.0-min.js.gz"></script>
<script src="https://assets.yourdomain.com/libs/plugin-session-replay-browser-1.28.1-min.js.gz"></script>
```
{% callout type="tip" heading="Cache TTL" %}
If you plan to update the SDK version frequently, set a short cache TTL (1 to 5 minutes) on your file server. If you pin to a specific version and update manually, a longer TTL is fine.
{% /callout %}
---
## Part 2: Proxy API calls
Route SDK network requests through your own server so they don't go directly to `amplitude.com` endpoints. Your proxy server receives the request, forwards it to Amplitude's default endpoint, and returns Amplitude's response unchanged.
### How the proxy works
A minimal proxy implementation should:
1. Accept requests from the SDK at your custom URL.
2. Forward the full request body and all headers (except `Host`) to the corresponding Amplitude endpoint.
3. Return Amplitude's response to the SDK unchanged, including the status code, headers, and body.
Your proxy should be transparent. Don't strip, modify, or buffer the request or response payload. The SDK handles retries, so your proxy doesn't need to.
{% callout type="tip" heading="Keep your API key server-side" %}
If you need to inject an `Authorization` header for a downstream service, inject the header in your proxy rather than hardcoding the API key in client-side code. Injecting the header server-side keeps credentials out of the browser.
{% /callout %}
### Analytics SDKs
Applies to: Browser SDK, Android (Kotlin) SDK, iOS (Swift) SDK, React Native SDK, Node.js SDK, Python SDK, Go SDK.
Use the `serverUrl` configuration option to point the SDK at your proxy:
```js
amplitude.init('API_KEY', {
serverUrl: 'https://analytics.yourdomain.com/2/httpapi'
});
```
Your proxy should forward requests to the appropriate Amplitude endpoint:
| Region | Default endpoint |
|---|---|
| US | `https://api2.amplitude.com/2/httpapi` |
| EU | `https://api.eu.amplitude.com/2/httpapi` |
| US (batch) | `https://api2.amplitude.com/batch` |
| EU (batch) | `https://api.eu.amplitude.com/batch` |
Use the batch endpoints for high-volume environments. To enable batch mode, set `useBatch: true` on the SDK and point `serverUrl` at your proxy path that forwards to the batch endpoint:
```js
amplitude.init('API_KEY', {
useBatch: true,
serverUrl: 'https://analytics.yourdomain.com/batch'
});
```
**Remote config proxy (Browser SDK 2 only):**
Browser SDK 2 fetches remote configuration separately. To proxy those requests as well, use the `remoteConfig.serverUrl` option:
```js
amplitude.init('API_KEY', {
serverUrl: 'https://analytics.yourdomain.com/2/httpapi',
remoteConfig: {
serverUrl: 'https://analytics.yourdomain.com/config'
}
});
```
---
### Session Replay: Browser (Plugin and Standalone SDK)
Session Replay uses two separate endpoints. You can override each independently.
| Config option | US endpoint | EU endpoint | Purpose |
|---|---|---|---|
| `trackServerUrl` | `https://api-sr.amplitude.com/sessions/v2/track` | `https://api-sr.eu.amplitude.com/sessions/v2/track` | Send captured replay data |
| `configServerUrl` | `https://sr-client-cfg.amplitude.com/config` | `https://sr-client-cfg.eu.amplitude.com/config` | Fetch remote configuration |
**Session Replay Plugin:**
```js
sessionReplayPlugin({
trackServerUrl: 'https://replay.yourdomain.com/sessions/v2/track',
configServerUrl: 'https://replay.yourdomain.com/config'
});
```
**Session Replay Standalone SDK:**
```js
sessionReplay.init('API_KEY', {
trackServerUrl: 'https://replay.yourdomain.com/sessions/v2/track',
configServerUrl: 'https://replay.yourdomain.com/config'
});
```
---
### Session Replay: Mobile (Android, iOS, React Native)
The mobile Session Replay plugins don't support custom proxy URLs. The only routing option is `serverZone`, which switches between Amplitude's US and EU data centers. Data still flows directly to Amplitude's servers and doesn't pass through your own infrastructure.
```kotlin
// Android — set on the Amplitude SDK configuration
serverZone = ServerZone.EU
```
```swift
// iOS — set on the Amplitude SDK configuration
serverZone: .EU
```
---
## Content Security Policy (CSP)
If your app sets a Content Security Policy, update it when switching to self-hosted files and proxied endpoints.
| Directive | Default (Amplitude CDN) | With self-hosting |
|---|---|---|
| `script-src` | `https://cdn.amplitude.com` | Your own file-serving domain |
| `connect-src` | `https://api-sr.amplitude.com` (US) or `https://api-sr.eu.amplitude.com` (EU) | Your proxy domain(s) |
| `worker-src` | `blob:` | Keep `blob:`, required by the Session Replay web worker |
**Example CSP (fully self-hosted):**
```text
Content-Security-Policy: script-src 'self' https://assets.yourdomain.com; connect-src 'self' https://analytics.yourdomain.com https://replay.yourdomain.com; worker-src 'self' blob:;
```
Because your proxy handles routing to Amplitude's US or EU endpoints, the CSP only needs to reference your own domain. The same policy works for both regions.
================================================================================
# Manage privacy settings for Session Replay
URL: https://amplitude.com/docs/session-replay/manage-privacy-settings-for-session-replay
================================================================================
# Manage privacy settings for Session Replay
Session Replay privacy settings control which user data appears in a replay and which data Amplitude masks. Configure masking, blocking, and PII handling to meet your organization's legal and security requirements. After you configure these settings, Session Replay applies them consistently across every session.
When these privacy settings are active, Amplitude masks the user data you specify in all session replays you create and view. Masking data prevents Amplitude from receiving it from your product. Masking doesn't remove the data from your own product data repository.
## Masking levels
Session Replay provides three presets for masking sensitive data in your screen recordings. You can also implement custom overrides when necessary.
- **Medium**: This is the default option for Session Replay privacy settings. When selected, Medium masks all form fields and text inputs. Amplitude captures all other text as-is.
- **Light**: This option is for companies that retain very little sensitive customer data, and for those who want to start quickly and selectively choose which fields to mask. Selecting this option masks only a subset of sensitive inputs, such as passwords, credit card numbers, telephone numbers, and email addresses. Examples of companies that might choose this option are business productivity app developers, restaurant- or appointment-booking software companies, and ecommerce sites.
- **Conservative**: This option is for companies that retain a large amount of sensitive customer data. Selecting this option masks all text and all form fields, including HTML text, user input, and links. Conservative masking doesn't apply to text in pictures, videos, thumbnails, or other static assets. [Use CSS Selectors](https://www.w3schools.com/cssref/css_selectors.php) to exclude any pictures, videos, or thumbnails that contain sensitive information. Examples of companies that might choose this option are financial services firms, CRM systems, online betting companies, geospatial technology companies, and companies in the healthcare and medical technology industries. In these sectors, the inadvertent release of sensitive user data could have serious repercussions.
Changes you make to these privacy levels take precedence over privacy definitions set in the SDK.
{% callout type="warning" heading="HTML attribute masking limitation" %}
Session Replay masking applies to text content and form inputs, but doesn't mask HTML attribute values. Attributes such as `alt`, `title`, `placeholder`, `aria-label`, `value`, and custom `data-*` attributes remain visible in replays even when you enable masking. If your application stores sensitive information in HTML attributes, remove or obfuscate that data before it reaches Session Replay.
{% /callout %}
{% callout type="note" heading="React Native masking options" %}
React Native Session Replay supports remote masking configuration through the Session Replay settings page. You can also use the `AmpMaskView` component for fine-grained control over specific views in your application. For more information, go to [Mask onscreen data](https://amplitude.com/docs/sdks/session-replay/session-replay-react-native-sdk-plugin#mask-onscreen-data) in the React Native Session Replay documentation.
{% /callout %}
## Set your privacy level
To set the Session Replay privacy level, navigate to _Settings > Organizational Settings > Session Replay Settings_ and select the appropriate project. Each project has its own settings. You can always view a summary of your masking level and overrides for each project on the main Session Replay Settings page.
### Override preset policy levels
You can override the default masking settings for individual elements by editing the matching [CSS selectors](https://www.w3schools.com/cssref/css_selectors.php) of those elements.
To override masking settings, right-click on your application and select Inspect mode. Under _Masking Overrides_, enter the CSS selector you want to change and select **+ Add Selector**. You can use this process to mask, unmask, or exclude individual elements.
Unmasking an element also unmasks its child elements. If needed, you can re-mask these child elements using the process above. However, when you mask an element using CSS selectors, Amplitude also masks its child elements. You can't then unmask these child elements.
When you exclude an element using CSS selectors, Amplitude replaces the element with an empty placeholder element of the same dimensions. Amplitude also excludes any child elements.
{% tabs tabs="mask, unmask, exclude" %}
{% tab name="mask" %}
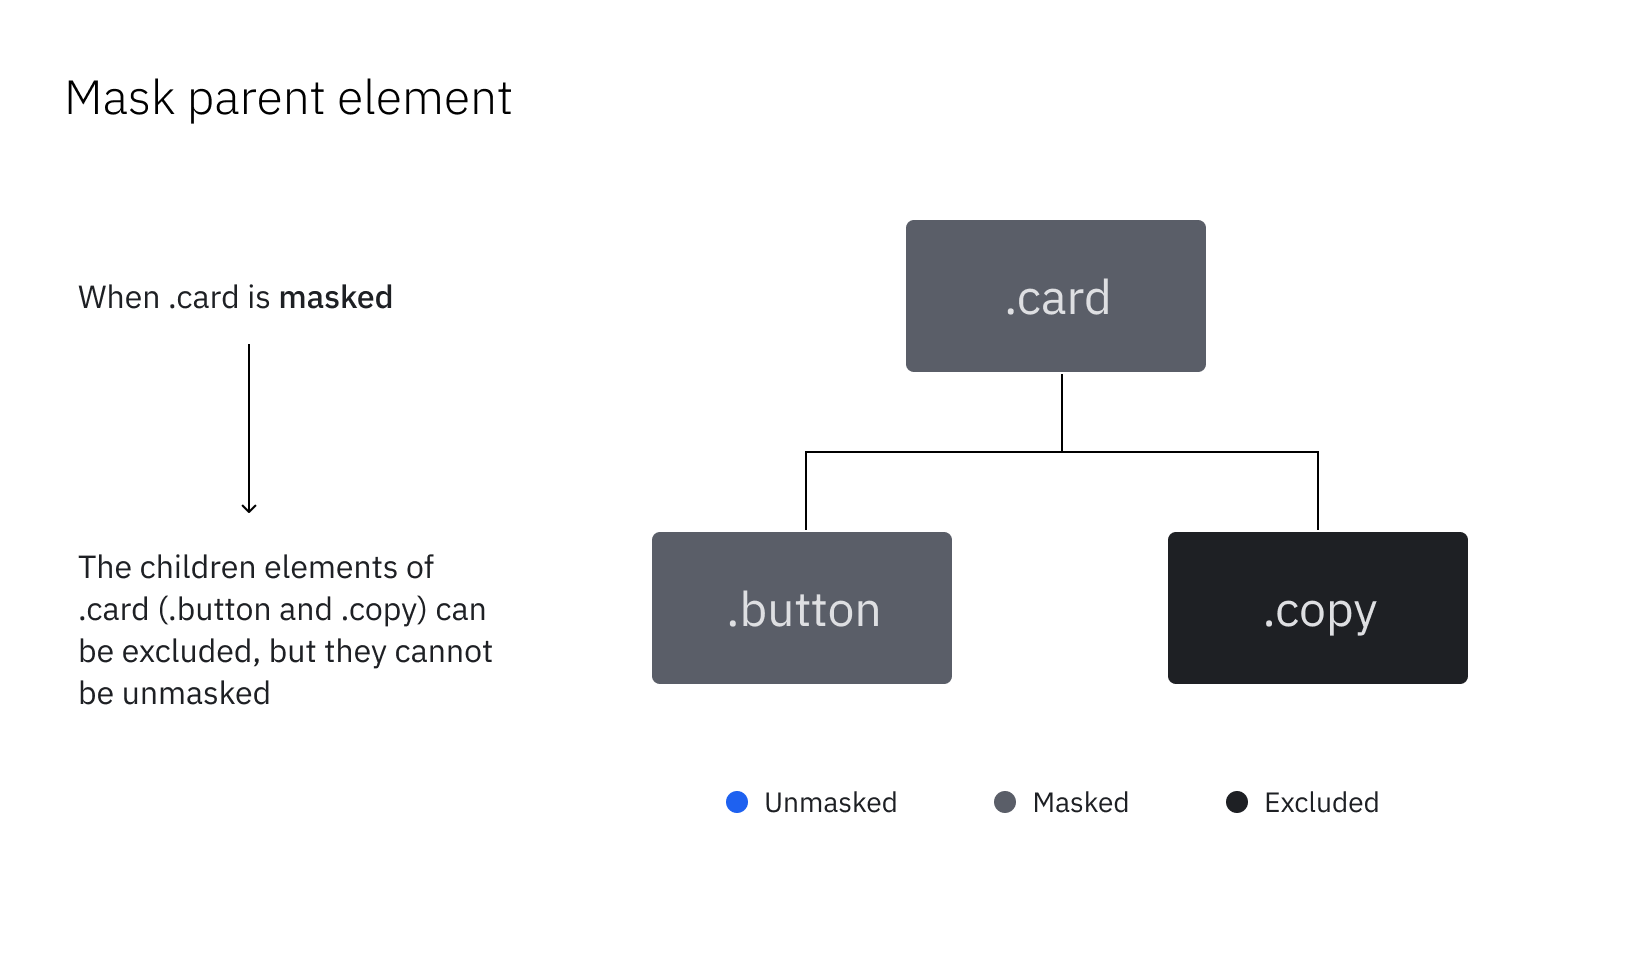
{% /tab %}
{% tab name="unmask" %}
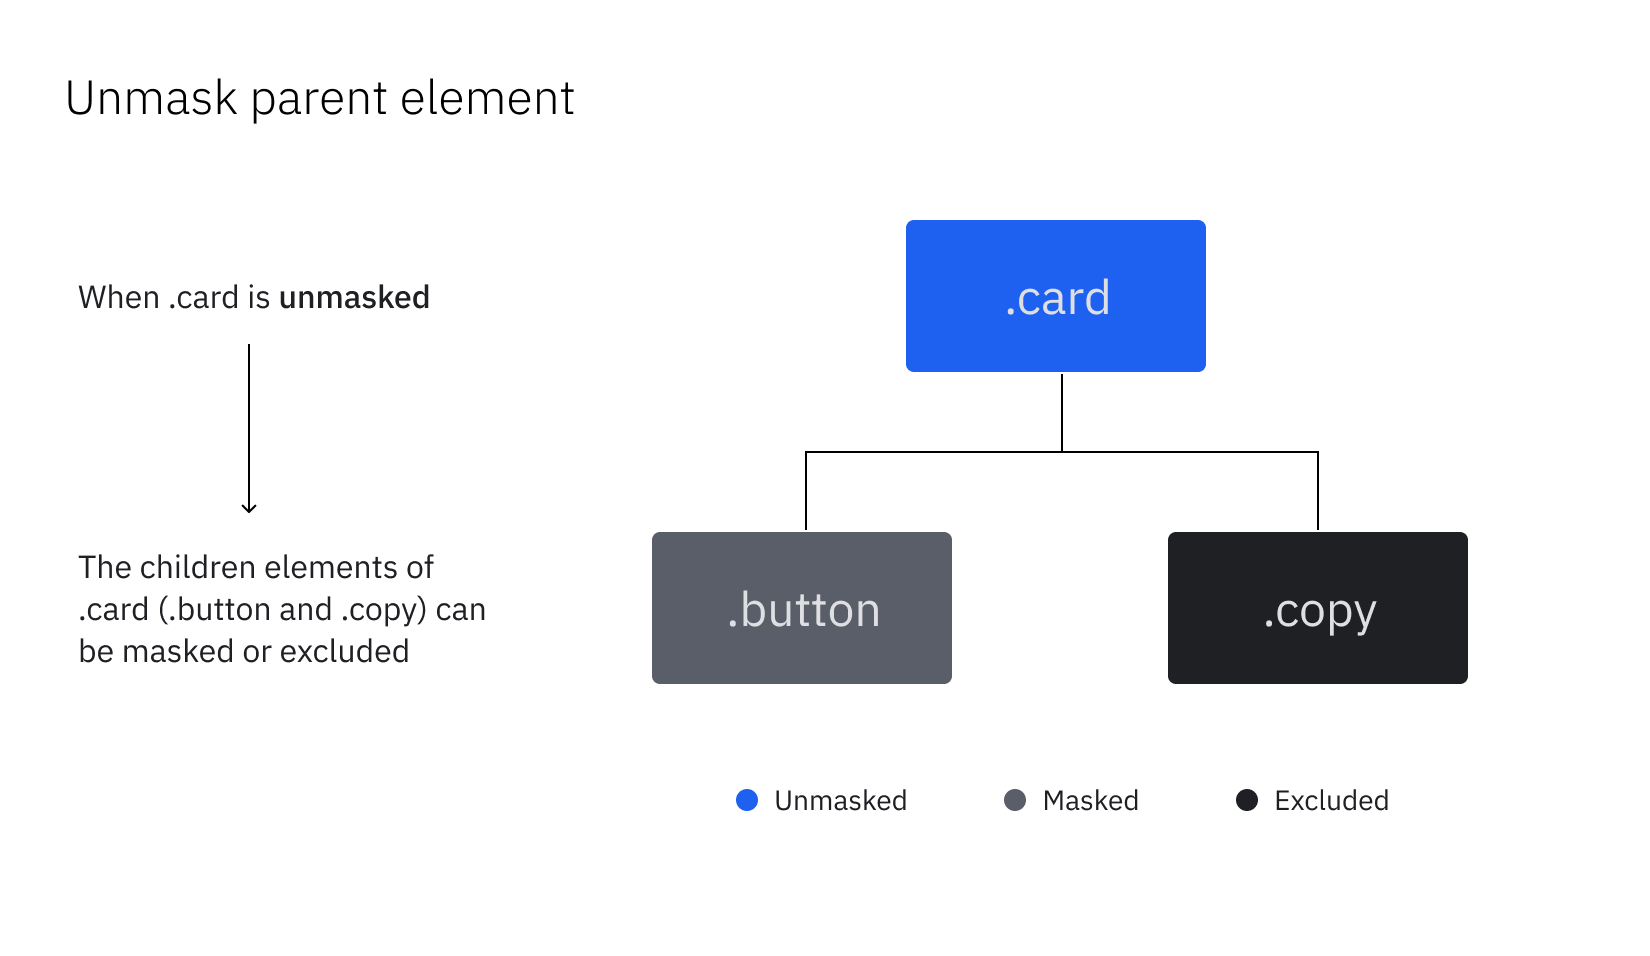
{% /tab %}
{% tab name="exclude" %}
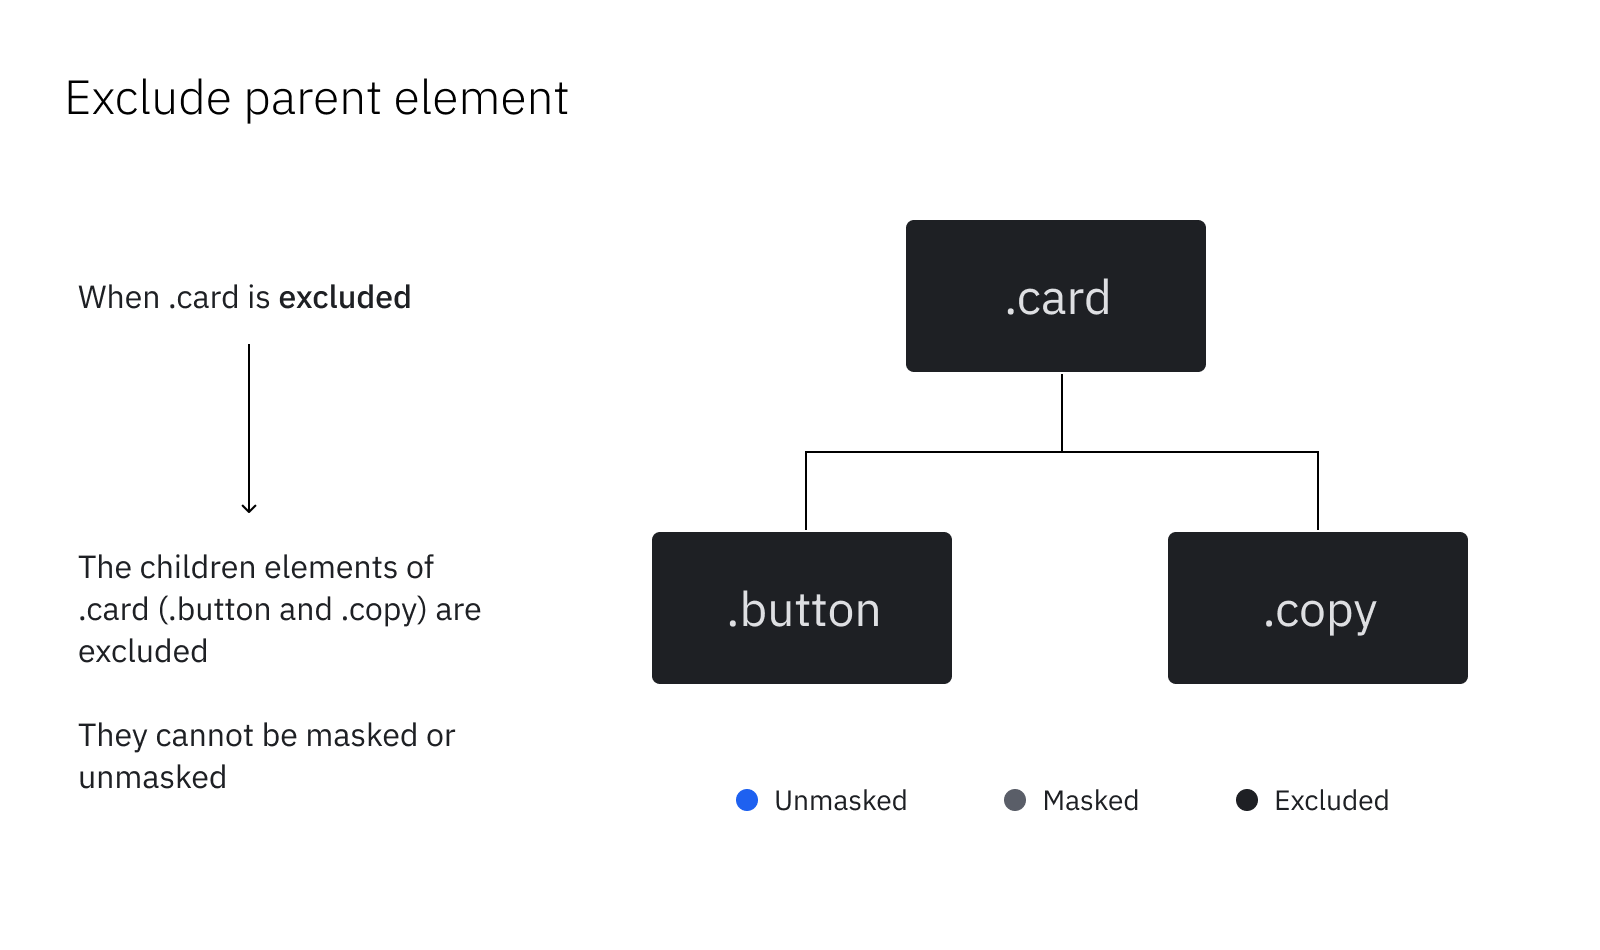
{% /tab %}
{% /tabs %}
{% callout type="tip" heading="Avoid site performance issues with masking" %}
If you experience a decrease in site performance due to the number of [masking](https://amplitude.com/docs/sdks/session-replay/session-replay-standalone-sdk#mask-on-screen-data) rules you create, Amplitude recommends excluding or blocking content with the `.amp-block` class, rather than masking it.
Blocking or excluding content replaces the element with a placeholder of the same dimensions.
{% /callout %}
## How Session Replay resolves conflicts between the SDK and the UI
When the SDK and the Session Replay settings page conflict on how to handle a particular element (whether Amplitude should mask, unmask, or exclude it), the Session Replay settings page takes precedence.
For example, imagine you have used the Session Replay settings page to mask `.selector1` and unmask `.selector2`. An engineer then changes the SDK to mask `.selector3`, and at the same time inadvertently unmasks `.selector1`.
In this case, Session Replay combines the settings from the SDK and the UI, but the settings specified for `.selector1` in the UI take precedence:
| | .selector1 | .selector2 | .selector3 |
| ----------------------- | ---------- | ---------- | ---------- |
| Session Replay settings | MASK | UNMASK | |
| SDK settings | UNMASK | | MASK |
| End results | MASK | UNMASK | MASK |
{% callout type="note" heading="Remote configuration" %}
If you enable remote configuration and it fails to load, Session Replay doesn't capture any sessions. This behavior ensures that Amplitude respects any privacy settings you define in the Admin interface, and that you don't accidentally capture sensitive data.
{% /callout %}
### CSS selectors
Session Replay's configuration supports many types of [CSS Selector](https://developer.mozilla.org/en-US/docs/Learn/CSS/Building_blocks/Selectors). Specify an element tag (`h1` or `textarea`), a class name (`.hidden`), or a data attribute.
Data attributes may be useful if your class names change often due to hashing. To use data attributes, add a custom attribute like `data-amp-unmask` or `data-amp-mask` to any HTML element. For example, `<textarea data-amp-unmask></textarea>`. Then enclose the attribute in square brackets when you specify the selector, `[data-amp-unmask]`.
================================================================================
# Best practices for managing user consent
URL: https://amplitude.com/docs/session-replay/best-practices-for-managing-user-consent
================================================================================
# Best practices for managing user consent
When you use Session Replay, you must disclose the recording in your privacy policy and capture user consent where local privacy laws require it. These best practices cover how to word your privacy policy disclosure, set up cookie banners and consent management tools, and apply Amplitude's built-in privacy controls.
## Disclosure and consent
Session Replay reconstructs and analyzes real user interactions on your site or app. Some jurisdictions require a notice or consent for this kind of tracking.
## Inclusions for your privacy policy
Amplitude recommends that you update your privacy policy to clearly explain:
- That you use Session Replay technology.
- The kind of data you collect, such as clicks, navigation patterns, or form interactions.
- The reason you collect this data, such as to improve usability, troubleshoot issues, or better understand user behavior.
- How you store, process, and protect data.
- The options that users have to opt out, if applicable.
### Sample disclosure language
Modify the following examples to match your company's tone and policy structure.
> We may use cookies and similar technologies to collect information about our customers' interactions with our products and services in a manner that allows us to reproduce and fix issues and to identify areas of improvement for our products and services. You can opt out of the use of this software by contacting us at privacy@company.com.
> We use session replay technology to help us understand how users interact with our website and improve their experience. This technology captures user interactions, such as clicks, scrolling, and typing behavior, so we can identify usability issues and optimize our content. Sensitive information is automatically masked, and we do not use Session Replay to collect or store passwords, credit card numbers, or other sensitive data.
## Cookie banners or consent management tools
In regions that require prior consent, like the EU, include Session Replay in your cookie consent banner or Consent Management Platform (CMP). Amplitude's Session Replay SDK integrates Session Replay and its associated cookies with your CMP.
### Cookie and consent banner tips
Apply the following best practices when you update your banners:
- Categorize Session Replay under "analytics" or "functional" cookies. Session Replay cookies are **first-party** cookies, and Amplitude never uses your data for its own purposes.
- Don't enable Session Replay by default before consent, if your local laws require consent.
- Give users clear control over enabling or disabling Session Replay.
- Consider including a link to your privacy policy or a dedicated Session Replay information page.
### Sample banner wording
Modify the following examples to match your company's tone and style.
> We use cookies on our websites. Your interactions with our website and associated personal data may be collected by us in accordance with our Privacy Policy [hyperlink to privacy policy that includes session replay disclosure].
> We use cookies to personalize content and analyze traffic. We also use tools like session replay to better understand how users navigate our site and improve their experience. You can choose which cookies to allow.
## Amplitude's privacy controls
To help you stay compliant, Session Replay includes:
- [Privacy settings](https://amplitude.com/blog/session-replay-privacy) to fit your specific privacy requirements.
- Custom masking options that let you define which elements Session Replay captures or excludes.
- Configurable data retention to meet your company's data lifecycle policies.
## Related resources
- [Building a Privacy-first Session Replay with Amplitude](https://amplitude.com/blog/session-replay-privacy)
- Amplitude's [Trust](https://amplitude.com/trust) page
- [Session Replay Privacy settings](https://amplitude.com/docs/session-replay/manage-privacy-settings-for-session-replay)
For more detailed legal guidance, consult with your legal team or privacy counsel.
================================================================================
# Session Replay API
URL: https://amplitude.com/docs/apis/analytics/session-replay
================================================================================
# Session Replay API
## Authentication and request requirements
- All endpoints use HTTP Basic auth. Use your project's API key as the username and secret key as the password.
- The `project_id` parameter isn't needed. The authenticated API key identifies the project.
- Presigned file URLs expire after 15 minutes.
- Pagination cursors are opaque strings. Don't construct or modify them. Pass `next_page_token` from the previous response as-is.
- The `sort_order` parameter must be consistent across all pages of a paginated request. Passing a `page_token` from an `asc` request with `sort_order=desc` returns a 400 error.
- `amplitude_id` and `replay_id` are mutually exclusive. Passing both returns a 400 error.
- `replay_id` and `page_token` are mutually exclusive. Passing both returns a 400 error.
- Each `replay_id` value must use `device_id/session_id` format. A leading or trailing slash returns a 400 error.
- You can pass up to 100 `replay_id` values per request. Passing 101 or more returns a 400 error.
- `amplitude_id` must be a valid integer. A non-numeric value returns a 400 error.
- When you use `replay_id`, the API ignores `page_size` and always returns `next_page_token` as `null`.
## EU data residency
For EU data residency, use `https://analytics.eu.amplitude.com` as the base URL instead of `https://amplitude.com`. For example:
- List session replays: `GET https://analytics.eu.amplitude.com/api/1/session-replays`
- Get session replay files: `GET https://analytics.eu.amplitude.com/api/1/session-replays/files`
## List session replays
Returns a paginated list of session replays for the authenticated project.
`GET https://amplitude.com/api/1/session-replays`
{% code-group %}
```curl cURL
curl --location 'https://amplitude.com/api/1/session-replays' \
-u '{api_key}:{secret_key}'
```
```bash HTTP
GET /api/1/session-replays HTTP/1.1
Host: amplitude.com
Authorization: Basic {api-key}:{secret-key} #credentials must be base64 encoded
```
{% /code-group %}
{% accordion title="Example: List replays with filters and descending sort" %}
{% code-group %}
```curl cURL
curl --location 'https://amplitude.com/api/1/session-replays?start_time=2024-01-01T00%3A00%3A00Z&end_time=2024-01-31T23%3A59%3A59Z&page_size=25&sort_order=desc' \
-u '{api_key}:{secret_key}'
```
```bash HTTP
GET /api/1/session-replays?start_time=2024-01-01T00%3A00%3A00Z&end_time=2024-01-31T23%3A59%3A59Z&page_size=25&sort_order=desc HTTP/1.1
Host: amplitude.com
Authorization: Basic {api-key}:{secret-key} #credentials must be base64 encoded
```
{% /code-group %}
{% /accordion %}
{% accordion title="Example: Filter replays by Amplitude user ID" %}
{% code-group %}
```curl cURL
curl --location 'https://amplitude.com/api/1/session-replays?amplitude_id=123456' \
-u '{api_key}:{secret_key}'
```
```bash HTTP
GET /api/1/session-replays?amplitude_id=123456 HTTP/1.1
Host: amplitude.com
Authorization: Basic {api-key}:{secret-key} #credentials must be base64 encoded
```
{% /code-group %}
{% /accordion %}
{% accordion title="Example: Fetch specific replays by replay ID" %}
{% code-group %}
```curl cURL
curl --location 'https://amplitude.com/api/1/session-replays?replay_id=abc123%2F1700000000000&replay_id=def456%2F1700000001000' \
-u '{api_key}:{secret_key}'
```
```bash HTTP
GET /api/1/session-replays?replay_id=abc123%2F1700000000000&replay_id=def456%2F1700000001000 HTTP/1.1
Host: amplitude.com
Authorization: Basic {api-key}:{secret-key} #credentials must be base64 encoded
```
{% /code-group %}
{% /accordion %}
### Query parameters
| Name | Description |
| -------------- | ---------------------------------------------------------------------------------------------------------------------------------------------------------------------------------------------------------------------------------------------------------------------------------------------------------------------------------------------- |
| `start_time` | Optional. ISO 8601 string. Lower bound on replay `start_time`, inclusive. For example, `2024-01-01T00:00:00Z`. |
| `end_time` | Optional. ISO 8601 string. Upper bound on replay `start_time`, inclusive. For example, `2024-01-31T23:59:59Z`. |
| `amplitude_id` | Optional. Integer. Filters results to replays belonging to a specific Amplitude user ID. Mutually exclusive with `replay_id`. |
| `replay_id` | Optional. String. Filters results to specific replays by ID, in `device_id/session_id` format. URL-encode the `/` separator as `%2F`. Repeat this parameter to request up to 100 replays. Mutually exclusive with `amplitude_id` and `page_token`. When you use this parameter, `page_size` is ignored and `next_page_token` is always `null`. |
| `page_size` | Optional. Integer. Number of results per page. Default is `50`, maximum is `200`. Ignored when `replay_id` is specified. |
| `page_token` | Optional. String. Opaque pagination cursor from a previous response's `next_page_token`. Mutually exclusive with `replay_id`. |
| `sort_order` | Optional. String. `asc` returns oldest replays first (default). `desc` returns newest replays first. Must be consistent across pages when using `page_token`. |
### Response
```json
{
"session_replays": [
{
"replay_id": "string",
"session_id": "string",
"device_id": "string",
"amplitude_id": 123456,
"start_time": "2024-01-01T00:00:00Z",
"end_time": "2024-01-01T00:05:00Z",
"retention_in_days": 90
}
],
"next_page_token": "string | null"
}
```
| Property | Description |
| ------------------------------------- | ------------------------------------------------------------------------------------------------------------------------------ |
| `session_replays` | Array of session replay objects. |
| `session_replays[].replay_id` | Unique identifier for the replay, in `device_id/session_id` format. Use this as the `replay_id` parameter when fetching files. |
| `session_replays[].session_id` | The session identifier. |
| `session_replays[].device_id` | The device identifier. |
| `session_replays[].amplitude_id` | The Amplitude user ID. |
| `session_replays[].start_time` | ISO 8601 timestamp of when the session started. |
| `session_replays[].end_time` | ISO 8601 timestamp of when the session ended. |
| `session_replays[].retention_in_days` | Number of days Amplitude retains the replay data. |
| `next_page_token` | Opaque cursor to pass as `page_token` to retrieve the next page. `null` when there are no more results. |
---
## Get session replay files
Returns a paginated list of presigned S3 URLs for the event files belonging to a specific replay. Each URL points to a gzip-compressed JSON array of rrweb events. Amplitude orders files by key, which encodes start time.
`GET https://amplitude.com/api/1/session-replays/files`
{% code-group %}
```curl cURL
curl --location 'https://amplitude.com/api/1/session-replays/files?replay_id={device_id}%2F{session_id}' \
-u '{api_key}:{secret_key}'
```
```bash HTTP
GET /api/1/session-replays/files?replay_id={device_id}%2F{session_id} HTTP/1.1
Host: amplitude.com
Authorization: Basic {api-key}:{secret-key} #credentials must be base64 encoded
```
{% /code-group %}
{% accordion title="Example: Fetch v2 files with pagination" %}
{% code-group %}
```curl cURL
curl --location 'https://amplitude.com/api/1/session-replays/files?replay_id={device_id}%2F{session_id}&version=2&page_size=50&page_token={page_token}' \
-u '{api_key}:{secret_key}'
```
```bash HTTP
GET /api/1/session-replays/files?replay_id={device_id}%2F{session_id}&version=2&page_size=50&page_token={page_token} HTTP/1.1
Host: amplitude.com
Authorization: Basic {api-key}:{secret-key} #credentials must be base64 encoded
```
{% /code-group %}
{% /accordion %}
### Query parameters
| Name | Description |
| ------------ | ----------------------------------------------------------------------------------------------------------------- |
| `replay_id` | Required. String. The replay identifier, in `device_id/session_id` format. URL-encode the `/` separator as `%2F`. |
| `version` | Optional. Integer. Recording format version. `2` or `3`. Default is `3`. |
| `page_size` | Optional. Integer. Number of files per page. Default is `100`, maximum is `1000`. |
| `page_token` | Optional. String. Opaque pagination cursor from a previous response's `next_page_token`. |
### Response
```json
{
"files": [
"https://s3.amazonaws.com/...presigned-url-1...",
"https://s3.amazonaws.com/...presigned-url-2..."
],
"next_page_token": "string | null"
}
```
| Property | Description |
| ----------------- | ----------------------------------------------------------------------------------------------------------------------- |
| `files` | Array of presigned S3 URLs. Each URL serves a gzip-compressed JSON array of rrweb events. URLs expire after 15 minutes. |
| `next_page_token` | Opaque cursor to pass as `page_token` to retrieve the next page. `null` when there are no more files. |
## Decompress and parse replay files
The format of each file depends on the `version` you requested.
### Version 3
Each file uses gzip compression. Decompress the file to get a JSON array of [rrweb](https://github.com/amplitude/rrweb) events ready to pass to an rrweb player.
{% code-group %}
```javascript JavaScript
async function fetchReplayEvents(fileUrl) {
const response = await fetch(fileUrl);
// The response is gzip-compressed; fetch decompresses automatically in browsers.
// In Node.js 18+, use the DecompressionStream API or the zlib module.
const buffer = await response.arrayBuffer();
const text = new TextDecoder().decode(buffer);
return JSON.parse(text); // array of rrweb events
}
```
```python Python
import gzip
import json
import urllib.request
def fetch_replay_events(file_url):
with urllib.request.urlopen(file_url) as response:
decompressed = gzip.decompress(response.read())
return json.loads(decompressed) # list of rrweb events
```
```bash cURL
curl -s '{presigned_url}' | gunzip | python3 -m json.tool
```
{% /code-group %}
The result is a JSON array of rrweb events:
```json
[
{ "type": 4, "data": { "href": "https://example.com", "width": 1440, "height": 900 }, "timestamp": 1700000000000 },
{ "type": 2, "data": { ... }, "timestamp": 1700000000050 },
...
]
```
### Version 2
Version 2 files require two decompression steps:
1. **gzip decompress** the file, then JSON parse → array of packed strings.
2. **zlib decompress** each string: each element is a JSON-encoded, zlib-compressed (DEFLATE) binary payload → rrweb event object.
{% code-group %}
```javascript JavaScript
const zlib = require("zlib");
async function fetchReplayEventsV2(fileUrl) {
const response = await fetch(fileUrl);
const buffer = Buffer.from(await response.arrayBuffer());
// Step 1: gzip decompress the file, then JSON parse → array of packed strings
const packedStrings = JSON.parse(zlib.gunzipSync(buffer).toString("utf8"));
// Step 2: unpack each string
return packedStrings.map((packed) => {
// Each packed string is itself a JSON string whose value is a latin1-encoded
// binary blob of zlib-compressed event data.
const compressedBinary = JSON.parse(packed);
const buf = Buffer.from(compressedBinary, "latin1");
return JSON.parse(zlib.inflateSync(buf).toString("utf8")); // rrweb event
});
}
```
```python Python
import gzip
import json
import zlib
import urllib.request
def fetch_replay_events_v2(file_url):
with urllib.request.urlopen(file_url) as response:
# Step 1: gzip decompress, then JSON parse → list of packed strings
packed_strings = json.loads(gzip.decompress(response.read()))
# Step 2: unpack each string
events = []
for packed in packed_strings:
# Each packed string is a JSON string whose value is a latin1-encoded
# binary blob of zlib-compressed event data.
compressed_binary = json.loads(packed)
buf = compressed_binary.encode('latin1')
events.append(json.loads(zlib.decompress(buf)))
return events
```
{% /code-group %}
### Play back events
To replay a full session, fetch all files for a replay in order, unpack each file, concatenate the event arrays, and pass the result to Amplitude's [rrweb player](https://github.com/amplitude/rrweb). Use Amplitude's fork rather than upstream rrweb, because the fork includes fixes that may be incompatible with the upstream version.
```javascript
const events = (await Promise.all(fileUrls.map(fetchReplayEvents))).flat();
rrweb.replay({ events, root: document.getElementById("player") });
```
## Status and error codes
| Code | Description |
| ------------------ | --------------------------------------------------------------------------------------------- |
| `200 OK` | Successful request. |
| `400 Bad Request` | Invalid parameter value. Check the error message for details. |
| `401 Unauthorized` | Missing or invalid API credentials. |
| `404 Not Found` | No data found for the given `replay_id`. Amplitude only returns this error on the first page. |
================================================================================
# Zoning Insights
URL: https://amplitude.com/docs/zoning-insights
================================================================================
# Zoning Insights
Zoning Insights measures how users engage with specific regions of a page, such as hero sections, navigation bars, or call-to-action blocks. You draw named areas (zones) on a screenshot of the page, and Amplitude reports click, exposure, and scroll metrics for each zone. Use Zoning Insights when you care about engagement in specific regions like banners, forms, or CTAs. To aggregate clicks and scrolls across a whole page without defining custom areas, use Heatmaps instead.
Zoning Insights requires [auto-captured interaction data](https://amplitude.com/docs/data/autocapture) (for example, click exposures, or scrolls) to compute element-level metrics. Because Zoning Insights uses autocapture to collect page-level click events and interaction data, it can increase event volumes.
## Permissions
- If you have an Admin or Manager role, you can create, update, and delete any zoning analysis.
- If you have the Member role, you can create, update, or delete your own zoning analyses but can't edit anyone else's.
- If you have the Viewer role, you can only view zoning analyses. For details, go to [User roles and permissions](https://amplitude.com/docs/admin/account-management/user-roles-permissions).
## Availability
You can use Zoning Insights on Web and Mobile Web.
## How Zoning Insights relates to Session Replay and Heatmaps
Zoning Insights is different than either Session Replay or Heatmaps:
- **Session Replay**: Records user sessions so you can watch replays and debug behavior.
- **Heatmaps**: Aggregates clicks, scrolls, and selector-level interactions on a page without defining custom areas.
- **Zoning Insights**: Defines custom areas (zones) on a page and analyzes engagement within those areas. Zoning Insights complements Session Replay and Heatmaps when you care about specific regions (for example: banners, forms, or CTAs) rather than the whole page or raw selectors.
## Configure Zoning Insights
For full setup instructions across Browser SDK, Google Tag Manager, Tealium iQ, and Segment, refer to [Zoning Insights Instrumentation](https://amplitude.com/docs/zoning-insights/instrumentation).
The simplest and most complete setup is to enable full Autocapture. This gives you all Zoning Insights metrics plus data you can use across other Amplitude features:
```javascript
amplitude.init(AMPLITUDE_API_KEY, OPTIONAL_USER_ID, {
autocapture: true,
});
```
If you prefer to opt in selectively, the minimum required options are `pageViews` and `elementInteractions`:
```javascript
amplitude.init(AMPLITUDE_API_KEY, OPTIONAL_USER_ID, {
autocapture: {
pageViews: true,
elementInteractions: {
viewportContentUpdated: true,
},
frustrationInteractions: true,
},
});
```
- **Page Views**: Required. Computes page-level engagement metrics.
- **Element Interactions**: Required. Computes click rates, exposure rates, and scroll reach. The `viewportContentUpdated` option within `elementInteractions` tracks element exposure when content loads dynamically.
- **Frustration Interactions**: Optional. Not required for Zoning Insights to function, but enables rage-click and dead-click metrics. When set to `true`, rage clicks and dead clicks are on by default.
Optionally, you can pass additional options to `elementInteractions` such as `cssSelectorAllowlist` or `viewportContentUpdated.exposureDuration` (default: 150ms).
## Zoning Insights metrics
Zoning Insights computes the following metrics for each zone:
| Metric | Definition | Why it matters |
| -------------------------------- | ------------------------------------------------------------------------------------------------------------------------------------------------------------------------- | ------------------------------------------------------------------------------------------------------------------- |
| **Click recurrence** | Average number of clicks for each user who interacted with the element at least one time. | Flags elements users click repeatedly, which can indicate confusion or high intent. |
| **Click distribution** | Breakdown of clicks across elements on the page. | Shows what share of all clicks on this page goes to each element. All elements sum to 100%. |
| **Click rate (session level)** | Proportion of page viewers who clicked on a specific element. | Session-scoped measurement of what percentage of visitors click this element. |
| **Click rate (page view level)** | Proportion of page viewers who clicked on a specific element, measured for each page view. | Shows what percentage of visitors who see this page click this element. |
| **Exposure rate** | Percentage of page views where the element was visible. | Shows what percentage of page views include the element in the viewport. Separates low visibility from low engagement. |
| **Attractiveness rate** | Proportion of page views where a user saw the zone and clicked it, out of all page views where the zone was visible. Measures how often exposure converts to interaction. | Of users who saw the element, shows how many clicked it. This is the most direct engagement signal. |
| **Rage click (session level)** | Proportion of page viewers who rage-clicked a specific element. | Frustration signal: repeated rapid clicks on the element with no response. |
| **Rage click (page view level)** | Proportion of page viewers who rage-clicked a specific element, measured for each page view. | Frustration signal: repeated rapid clicks with no response, measured per page view. |
| **Scroll reach** | Percentage of page views where a specific element scrolled into view. | Shows how far users scroll down the page, similar to a scroll map. |
| **Revenue** | Total revenue attributed to interactions with this element. | Shows how much revenue interactions with this element generate. Use this metric for eCommerce performance analysis. |
| **AI Opportunity score** | AI-generated score combining multiple metrics to surface optimization opportunities. | Highlights zones with the most potential for improvement based on combined engagement signals. |
{% callout type="note" %}
You can purchase Revenue and AI Opportunity score separately as premium add-ons.
{% /callout %}
## Create an overlay
Create an overlay by drawing zones on a page and analyzing user engagement within those zones. An overlay uses either a single page or a page group as its data source:
- **Single page**: A single URL. For example: amplitude.com/pricing.
- **Page groups**: A group of related pages scoped by URL rules. For example: /product/\*. In page groups, overlays display aggregated engagement metrics across the set of pages.
### Create a single page overlay
1. Navigate to *Amplitude > Zoning Insights*.
2. Click **Create Overlay**.
3. Specify the URL. If your product supports the same URL matching options as [Heatmaps](https://amplitude.com/docs/heatmaps), you can use:
- **Exact match** for a single URL.
- **Pattern match** with wildcards for similar URLs.
- **Contains** for URLs that include a keyword or segment.
- **Starts with** for a URL prefix and its subpages.
4. Click **Continue to Page Capture**.
5. Confirm that the correct URL is visible, then click **Take Screenshot**.
6. Name the screenshot, describe it, and save it.
7. Click each zone to turn it on or off.
8. Save or apply the overlay so Amplitude can aggregate data for the defined zones.
After you save the overlay, review the metrics, user journeys, and session replays for each zone (for example, clicks, scrolls, or sessions that touched a zone). You can also create cohorts for each zone.
You can also turn on the Heatmap overlay to better understand [heatmap](https://amplitude.com/docs/heatmaps) clicks on your page.
## Page groups
Page groups let you organize your pages so you can scope overlays to a set of related pages rather than a single URL.
### AI-suggested page groups
Amplitude can analyze your site's URL structure to automatically suggest logical page groups, so you can set up in minutes instead of building rules manually. Accept the suggestions as-is or modify them before saving.
### Create a page group
1. Click **Create Page Group** and enter a name for the group.
2. Set a condition or rule for the group. For example, set the URL to begin with a specific domain such as _amplitude.com/_.
3. Finish adding rules and click **Create Page group**.
4. Specify the URL(s) to analyze. If your product supports the same URL matching options as [Heatmaps](https://amplitude.com/docs/heatmaps), you can use:
- **Exact match** for a single URL.
- **Pattern match** with wildcards for similar URLs.
- **Contains** for URLs that include a keyword or segment.
- **Starts with** for a URL prefix and its subpages.
5. Click **Save**.
### Edit or delete site maps and page groups
- To edit or delete a site map, hover over it in the left sidebar and select **...**, then choose **Edit** or **Delete**.
- To edit or delete a page group, select **...** in the page group row, then choose **Edit** or **Delete**.
If your list is long, select **Load More** at the bottom to load additional items.
## Compare overlays
To compare two overlays side by side, select **Compare** in the overlay toolbar, then choose a second overlay to display alongside the active overlay. Amplitude renders both overlays simultaneously so you can evaluate changes between time periods, page variants, or different audience segments.
## Page comparator
The **Page Comparator** tab lets you compare performance metrics across page groups side by side in a table. Select a site mapping and an optional conversion goal to populate the table. Columns include views, sessions, views per session, bounce rate, exit rate, scroll depth, page height, time spent, activity, and load time (LCP). Use **Customize columns** to adjust which metrics appear, and **Compare** to select specific page groups for direct comparison.
## Zone context menu actions
Right-click any saved zone to open its context menu. The context menu includes the following actions:
- **View user journey**: Opens a user journey analysis scoped to sessions that interacted with this zone.
- **View session replays**: Filters Session Replay to show replays where users interacted with this zone.
- **Create cohort**: Creates a behavioral cohort of users who interacted with this zone, which you can use in other Amplitude charts.
- **Delete zone**: Removes the zone from the overlay.
## Export a Zoning Insights analysis
Export your Zoning Insights data to share with teammates or include in presentations and reports.
Select the **Share** dropdown in the overlay editor toolbar to export an analysis.
### Download a CSV
Export zone metrics for the current overlay as a CSV file. Use CSV exports for offline analysis, importing into spreadsheets, or sharing engagement data across teams.
- Exports all zone metrics for the visible overlay.
- Works in both single view and compare view.
### Download a PNG
Export the current overlay view as a PNG image. The export includes the page screenshot with all zone overlays and metric labels visible.
- Captures the full overlay with metric badges.
- The export runs in the background: a loading indicator appears while Amplitude generates the image.
- The file downloads automatically when ready.
- Works in both single view and side-by-side compare view.
### Copy a link
Copy a shareable URL to the current overlay. Anyone in your organization with access to Zoning Insights can open the link.
### Copy link to compare view
Copy a URL that opens the overlay in compare mode with the current comparison target. The **Copy link to compare view** option only appears when you're actively comparing overlays.
### Export requirements
- Save your overlay before exporting. Amplitude disables export options for unsaved overlays.
- CSV and PNG export may require a paid plan depending on your organization's subscription. If your plan restricts this feature, a lock icon appears on the export menu items.
================================================================================
# Zoning Insights Instrumentation
URL: https://amplitude.com/docs/zoning-insights/instrumentation
================================================================================
# Zoning Insights Instrumentation
Amplitude's autocapture powers Zoning Insights. Choose the instrumentation method that matches your setup. You only need one method — each option enables the same autocapture events that power Zoning Insights.
## Browser SDK
Use the Browser SDK for the most direct path to instrumentation. Zoning Insights requires Browser SDK version 2.39.0 or higher.
### Install the SDK
```bash
npm i @amplitude/analytics-browser@2.39.0
```
### Configure autocapture
After installing the SDK, initialize Amplitude with autocapture enabled. This configures the two settings Zoning Insights needs: `pageViews` to track page views, and `elementInteractions` to track clicks and element visibility.
```javascript
import * as amplitude from '@amplitude/analytics-browser';
const AMPLITUDE_API_KEY = '<API_KEY>'; // replace with your project API key
const options = {
autocapture: {
pageViews: true,
elementInteractions: {
viewportContentUpdated: true,
},
frustrationInteractions: true,
},
}};
amplitude.init(AMPLITUDE_API_KEY, options);
```
### Advanced: fine-tune exposure tracking
For more control, pass an object to `elementInteractions` to configure `viewportContentUpdated` directly. For example, set `exposureDuration` to control how long an element must be visible before it counts as an exposure (default: 150ms).
```javascript
import * as amplitude from '@amplitude/analytics-browser';
const AMPLITUDE_API_KEY = '<API_KEY>';
const options = {
autocapture: {
pageViews: true,
elementInteractions: {
viewportContentUpdated: {
enabled: true,
exposureDuration: 150,
},
},
},
};
amplitude.init(AMPLITUDE_API_KEY, options);
```
### Find your API key
In Amplitude, go to *Settings → Projects → [Your Project] → General → API Key*. Replace `<API_KEY>` with your project's API key.
## Google Tag Manager
Use the official Amplitude template from the GTM Template Gallery or a Custom HTML tag. Both approaches load the SDK and enable autocapture for Zoning Insights.
### Option A: Official Amplitude GTM template (recommended)
The official Amplitude GTM template gives you a form-based UI for all SDK settings — no code editing required.
**Step 1: Add the template**
1. In your GTM workspace, go to *Workspace → Templates → Search Gallery*.
2. Search for "Amplitude" and select **Amplitude Analytics Browser SDK**.
3. Click **Add to workspace** and accept the permissions.
**Step 2: Create an Init tag**
1. Go to *Tags → New* and select the Amplitude template.
2. Set **Tag Type** to **Initialize**. This tag must fire before all other Amplitude tags.
3. Enter your Amplitude API key.
4. Under **Autocapture Events**, make sure **Page Views** and **Element Interactions** are enabled.
5. Set the trigger to **All Pages — Initialization** or **All Pages — DOM Ready**.
| Trigger | Behavior |
| ------- | -------- |
| **All Pages — Initialization** | Fires earliest — catches all interactions. |
| **All Pages — DOM Ready** | Fires after DOM is parsed — catches nearly all interactions. |
| **All Pages — Window Loaded** | Fires too late — early clicks may be missed. |
**Step 3: Preview and publish**
Use GTM's Preview mode to confirm the init tag fires on every page. Check the browser **Network** tab for requests to `api2.amplitude.com`, then verify that the `[Amplitude] Viewport Content Updated` event appears. Once confirmed, publish the container.
### Option B: Custom HTML tag
For a faster single-site setup, use a Custom HTML tag. Go to *Tags → New → Custom HTML*, paste the snippet below, and set the trigger to **All Pages — DOM Ready**.
```html
<!-- GTM → Tags → New → Custom HTML -->
<!-- Trigger: All Pages — DOM Ready -->
<script src="https://cdn.amplitude.com/libs/analytics-browser-2.39.0-min.js.gz"></script>
<script>
window.amplitude.init('YOUR_API_KEY', {
autocapture: {
pageViews: true,
elementInteractions: true,
},
});
</script>
```
### Content Security Policy
If your site uses CSP headers, add `cdn.amplitude.com` to `script-src` and `api2.amplitude.com` to `connect-src`.
## Tealium iQ
Use a JavaScript Extension in Tealium iQ to load the Amplitude SDK with autocapture enabled.
{% callout type="warning" %}
Tealium's server-side Amplitude connector doesn't run the Browser SDK on the page. Zoning Insights requires the SDK running client-side in the browser. Use the JavaScript Extension below instead of, or in addition to, the server-side connector.
{% /callout %}
### Create a JavaScript Extension
1. In Tealium iQ, go to *Extensions → Add Extension → JavaScript Code*.
2. Set the scope to **Before Load Rules** and the condition to **All Pages**.
3. Paste the code below.
4. Replace `YOUR_API_KEY` with your Amplitude project API key.
```javascript
// Tealium iQ → Extensions → JavaScript Code
// Scope: Before Load Rules | Condition: All Pages
(function() {
var s = document.createElement('script');
s.src = 'https://cdn.amplitude.com/libs/analytics-browser-2.39.0-min.js.gz';
s.async = false;
s.onload = function() {
if (!window.amplitude) return;
window.amplitude.init('YOUR_API_KEY', {
autocapture: {
pageViews: true,
elementInteractions: true,
},
});
};
document.head.appendChild(s);
})();
```
5. Use Tealium's QA mode to verify the extension fires on all pages, then publish the profile.
### Running alongside Tealium EventStream
You can run Tealium's server-side Amplitude connector in parallel with this client-side Extension. EventStream handles your server-side business events; the Extension handles Zoning Insights autocapture. Both write to the same Amplitude project using the same API key.
## Segment
Load the Amplitude Browser SDK alongside Segment. Zoning Insights requires the SDK running client-side — Segment's server-side Amplitude destination alone isn't enough.
{% callout type="warning" %}
Segment's cloud-mode Amplitude (Actions) destination routes events to Amplitude's HTTP API — it doesn't load the Browser SDK or enable autocapture on the page. You need the SDK running in the browser for Zoning Insights to work.
{% /callout %}
Load both SDKs in parallel. Amplitude handles Zoning Insights autocapture; Segment handles your existing custom event pipeline. The two SDKs don't conflict.
```javascript
import * as amplitude from '@amplitude/analytics-browser';
import { AnalyticsBrowser } from '@segment/analytics-next';
// Amplitude — handles Zoning Insights autocapture
amplitude.init('YOUR_AMPLITUDE_API_KEY', {
autocapture: {
pageViews: true,
elementInteractions: true,
},
});
// Segment — your existing event pipeline
const analytics = AnalyticsBrowser.load({
writeKey: 'YOUR_SEGMENT_WRITE_KEY',
});
// Keep user identity in sync
function identify(userId, traits = {}) {
analytics.identify(userId, traits);
amplitude.setUserId(userId);
const evt = new amplitude.Identify();
Object.entries(traits).forEach(([k, v]) => evt.set(k, v));
amplitude.identify(evt);
}
```
## Verify your setup
After setting up any of the methods above, confirm that autocapture events are flowing into your Amplitude project.
### Option A: Event Segmentation chart
In Amplitude, create an Event Segmentation chart on the project you sent data to. Search for the event:
```text
[Amplitude] Viewport Content Updated
```
If data appears, autocapture is working correctly and Zoning Insights can start computing metrics.
### Option B: Amplitude Chrome Extension
Install the [Amplitude Chrome Extension](https://chromewebstore.google.com/detail/amplitude-event-explorer/acehfjhnmhbmgkedjmjlobpgdicnhkbp) and navigate to your instrumented site. The extension shows events being tracked in real time. Look for `[Amplitude] Viewport Content Updated` and `[Amplitude] Element Clicked` events appearing as you scroll and click.
### What to look for
Once you see `[Amplitude] Viewport Content Updated` events flowing into your project, Zoning Insights has the data it needs. Zones begin populating with metrics like click rate, exposure rate, scroll reach, and rage click rate.
================================================================================
# Comparing Overlays
URL: https://amplitude.com/docs/zoning-insights/comparing-overlays
================================================================================
# Comparing Overlays
Comparing two overlays side by side shows how zone behavior differs between pages, segments, or points in time. It's one of the fastest ways to spot outliers and validate whether a change moved the needle.
## How to compare
1. Create and save the two overlays you want to compare, one at a time. Configure the page scope, metric, date range, and segment as part of creating each one.
2. Open one of the saved overlays.
3. Click **Compare** in the top bar.
4. Select the other overlay to compare against.
Both overlays open side by side. Each panel keeps its own controls, so you can adjust the metric, date range, segment, or screenshot on either side independently.
## Set up the right comparison
A comparison only tells you something useful when you set up both sides intentionally. That doesn't always mean identical; sometimes you want a deliberate difference (apples to oranges), but the difference should be the one you're studying, not an accident.
Check these before you trust the numbers:
- **Set the right segment on each side.** If you're comparing desktop to mobile, filter the left panel to desktop users and the right panel to mobile users. If you're comparing logged-in to logged-out, set the segment on each side to match. A mismatched segment is the most common reason a comparison looks off.
- **Match your screenshot to the segment.** Each overlay's screenshot is the visual reference your zones sit on top of. For a mobile comparison, capture the screenshot at mobile width. Resize your browser before taking the screenshot so the layout reflects what mobile users actually saw.
- **Align your date ranges.** Use the same time window on both sides unless you're running a deliberate before/after.
- **Use the same metric on both panels.** Click rate and attractiveness rate tell different stories.
## Name overlays for the compare picker
When you click **Compare**, you see a list of every saved overlay. Good names make it easy to find the right one. A useful pattern:
`[Page or page group] - [Variant or detail] - [Device]`
Examples:
- PDP - SG Standard - Mobile
- PDP - Les Paul Standard - Desktop
- Checkout - Experiment Variant A
- All PDPs - Last 30 days
Avoid generic names like `Overlay 4` or `Untitled`; they make the picker hard to scan.
## Common comparison patterns
Each pattern starts the same way: create one overlay for each side, save them, then compare.
- **Desktop and mobile.** Same page, different device segment for each side. Capture each screenshot at the matching browser width.
- **High-converting and low-converting pages.** For example, your best-performing PDP and one that's underperforming.
- **A/B experiment variants.** One overlay for each variant. Filter each panel to users who saw that variant to see *why* one variant won at the zone level.
- **Page group and a specific page.** Compare all PDPs together (a page group with a `contains /product` rule) against a single PDP. Useful for spotting whether one page is an outlier compared to the group.
- **Before and after a launch or redesign.** Create one overlay before the change and another after, then compare to see how zone behavior shifted.
- **New and returning users.** Same page, different audience segment for each side.
- **Paid and organic traffic.** Same page, different acquisition segment for each side.
- **Two landing pages.** For example, two campaign pages from the same launch.
## Share a comparison
You can share a comparison two ways:
- Copy the URL from your browser's address bar. The URL reflects exactly what you're looking at, including both overlays.
- Click **Share** on either panel, then choose **Copy link to compare view**. Same result, accessible from inside the product.
From the **Share** menu you can also download either panel as a CSV or PNG.
## After you spot a difference
A comparison surfaces that something is different. The next step is figuring out why and deciding what to do about it.
- **Watch replays for the zones with the biggest delta.** Click into a zone to open replays of users who interacted with it. Seeing the behavior in motion usually explains the number faster than any chart.
- **Turn the finding into your next test.** A real difference is a hypothesis. Feed it into Web Experiment: change the layout, copy, or interaction on the weaker side, and test whether you can close the gap.
================================================================================
# Heatmaps
URL: https://amplitude.com/docs/heatmaps
================================================================================
# Heatmaps
Heatmaps uses Session Replay to turn user interactions into a visual map of engagement on your website or application. Analyze where users click, what they interact with, and how far they scroll to find trends, anomalies, and the areas that drive the most engagement.
{% outcomes heading="Explore Heatmaps" %}
{% outcome icon="Plug" title="Create a heatmap" href="https://amplitude.com/docs/heatmaps/create-a-heatmap" %}
Check the prerequisites, then build a heatmap and target the pages and users you care about.
{% /outcome %}
{% outcome icon="LineChart" title="Compare the map types" href="https://amplitude.com/docs/heatmaps/map-types" %}
Use click, selector, and scroll maps to understand how users engage with a page.
{% /outcome %}
{% outcome icon="Target" title="Apply heatmaps to your goals" href="https://amplitude.com/docs/heatmaps/use-cases" %}
Optimize conversion, validate redesigns, and compare behavior across segments and devices.
{% /outcome %}
{% outcome icon="ClipboardList" title="Troubleshoot heatmaps" href="https://amplitude.com/docs/heatmaps/troubleshooting" %}
Fix blank heatmaps, missing data, incorrect backgrounds, and availability issues.
{% /outcome %}
{% /outcomes %}
## Availability
Customers with the Session Replay addon can use Heatmaps. All users with [View permissions](https://amplitude.com/docs/admin/account-management/user-roles-permissions) can create Heatmaps.
{% callout type="note" heading="Heatmap retention" %}
Heatmaps use an anonymized session replay that's decoupled from any user behavior and isn't subject to your Session Replay retention period.
{% /callout %}
{% callout type="note" heading="Legacy organizations" %}
If you receive a message that states "Heatmaps isn't available for your organization", contact [Amplitude Support](https://gethelp.amplitude.com) to enable Heatmaps. Legacy organizations require manual enablement, and may require an increase in property limit. For more information, go to [Troubleshoot Heatmaps](https://amplitude.com/docs/heatmaps/troubleshooting).
{% /callout %}
================================================================================
# Heatmap use cases
URL: https://amplitude.com/docs/heatmaps/use-cases
================================================================================
# Heatmap use cases
Heatmaps build on Session Replay to show product engagement at a visual, macro level. Each map type answers a different question about how users interact with a page. Use the examples on this page to decide which map type fits your goal, then turn what you find into events, replays, and cohorts.
## Optimize clicks and calls to action
Use a [click map](https://amplitude.com/docs/heatmaps/map-types#click-map) to see where visitors click on a page. Busy areas appear in warmer colors, so you can confirm that primary calls to action draw attention and spot areas that get more clicks than expected. Clicks on non-interactive elements can reveal where users expect a link or button that doesn't exist.
## Rank and validate key elements
Use a [selector map](https://amplitude.com/docs/heatmaps/map-types#selector-map) to rank the most interacted with elements on a page in descending order. Use the ranking to confirm that the elements you consider most important also get the most engagement. The ranking also shows which of two competing buttons or links draws more engagement.
## Improve content placement
Use a [scroll map](https://amplitude.com/docs/heatmaps/map-types#scroll-map) to see where the average page fold falls and how far users scroll. Use scroll depth to decide what belongs above the fold and to find content that few users ever reach.
## Compare segments and devices
When you create a heatmap, you can apply a segment based on user properties or cohorts, and view the map by device type. Compare the same page across desktop, mobile, and tablet, or across user segments, to understand how engagement differs. You can also compare a page before and after a redesign to validate the change.
## Turn engagement into action
The three map types show where users engage. To understand why users engage, use [Microscope](https://amplitude.com/docs/heatmaps/map-types#click-map-microscope) on click and selector maps to:
- View the events behind a zone or element, and create a chart to analyze the trend across your data.
- Watch the Session Replays tied to those events to add qualitative context.
- Create a [cohort](https://amplitude.com/docs/analytics/behavioral-cohorts) of users who interacted with an area or element. You can reuse the cohort in Amplitude or send the cohort to a third-party destination, such as a CRM or marketing platform, for targeted outreach.
================================================================================
# Create a heatmap
URL: https://amplitude.com/docs/heatmaps/create-a-heatmap
================================================================================
# Create a heatmap
Before you create a heatmap, confirm that your Amplitude instrumentation meets the prerequisites, then follow the steps to build and target your first heatmap.
## Prerequisites
Your Amplitude instrumentation must meet the following requirements.
### Session Replay
{% callout type="note" heading="Client availability" %}
Heatmaps supports web-based session replays only, and doesn't support mobile apps or SDKs.
{% /callout %}
Heatmaps requires these minimum SDK versions:
- [Session Replay Browser SDK Plugin](https://amplitude.com/docs/sdks/session-replay/session-replay-plugin): 1.7.0.
- [Session Replay Standalone SDK](https://amplitude.com/docs/sdks/session-replay/session-replay-standalone-sdk): 1.14.0.
{% callout type="note" heading="Session Replay sample rate" %}
Heatmaps use Session Replay data to track interactions on your pages. If you use a sample rate to limit the number of replays you generate, you also limit the events available to build heatmaps. A limited sample rate produces a less comprehensive view of user interactions and can reduce heatmap accuracy.
{% /callout %}
### Heatmap data requirements
Heatmaps appear after Amplitude collects enough replay click data across your site: at least 10 separate pages, with about 500 tracked replay clicks on each page. These thresholds are approximate and may change as Heatmaps evolves.
### Matching device identifiers
Heatmaps require that the `device_id` on heatmap events from the Session Replay Plugin or Standalone Session Replay SDK matches the `device_id` on your Amplitude analytics events.
If you use the [Browser SDK 2.x with the Session Replay Plugin](https://amplitude.com/docs/sdks/session-replay/session-replay-plugin) or the [Unified SDK](https://amplitude.com/docs/sdks/analytics/browser/browser-unified-sdk), Amplitude manages `device_id` alignment automatically.
If you use the [Standalone Session Replay SDK](https://amplitude.com/docs/sdks/session-replay/session-replay-standalone-sdk) with a third-party or homegrown analytics pipeline, pass the same `device_id` and `session_id` to Session Replay that you attach to your analytics events. If your backend generates device identifiers that differ from the browser, heatmap segment filters and event joins won't work correctly.
When `device_id` values don't match:
- **Unsegmented heatmaps** (URL and date filters only) still render from heatmap events.
- **Segment and cohort filters** return empty or incorrect results, because Amplitude can't join heatmap clicks to analytics users.
- **Microscope actions** (view events, view replays, create cohort from a heatmap selection) won't link to the right users.
- **Session Replay playback** for a specific replay may still work, because replays are keyed by the SR SDK's `device_id`/`session_id`.
If your analytics pipeline sets `user_id` for logged-in users, use the same `user_id` on both sides as well.
### Create a development project (optional)
Amplitude recommends that you create a separate development project to test Heatmapping without impacting your production environment.
{% callout type="note" heading="Event taxonomy impact" %}
Heatmap and Session Replay events don't count toward your allotted event volume, and Amplitude doesn't bill you for them.
{% /callout %}
## Create a heatmap
To create a new Heatmap:
1. Navigate to **Heatmaps** in the left navigation in Amplitude.
2. Click **+ New Heatmap**.
3. Choose a [Heatmap type](https://amplitude.com/docs/heatmaps/map-types). You can update the map type at any point.
4. Select the URL to analyze. Use the following URL matching options to target the pages you care about.
- **Exact match**: Matches the URL exactly as you specify it. Ideal for single URLs. For example, `https://amplitude.com`.
- **Pattern match**: Uses wildcards to match more than one URL with a similar pattern. Useful for targeting dynamic paths. For example, `https://amplistore/products/*` matches `/products/shoes` and `/product/accessories`.
- **Contains**: Matches URLs that contain a specific keyword or segment anywhere in the URL. Useful for common themes. For example, `/search?q=` matches the search results page for any user query.
- **Starts with**: Matches all URLs that begin with a specific prefix. Useful for capturing sections of a site. For example, `https://amplitude.com/blog` captures the `/blog` page and all subpages.
5. Select or create a **Segment** using user properties or cohorts to narrow the focus to a specific set of users.
6. Optionally, select different device types to understand how users interact on devices of different widths.
7. Choose a background for your heatmap. Backgrounds are snapshots of a session replay and represent the page's state during replay collection. Each heatmap generates eight backgrounds. Amplitude selects each background from the page state that generates the most actions during a session.
================================================================================
# Map types
URL: https://amplitude.com/docs/heatmaps/map-types
================================================================================
# Map types
Heatmaps provides three views that help you understand how users engage with a specific page. When you [create a heatmap](https://amplitude.com/docs/heatmaps/create-a-heatmap), choose the map type that fits your goal, and switch between types at any time. For examples of when to reach for each one, go to [Heatmap use cases](https://amplitude.com/docs/heatmaps/use-cases). If a map renders without data, go to [Troubleshoot Heatmaps](https://amplitude.com/docs/heatmaps/troubleshooting).
## Click map
Click maps provide a color-coded display of the clicks, or "heat" on your page. Areas with few clicks appear blue. Busier areas appear green, yellow, orange, and red in order of increasing clicks. Use a click map to [find high-traffic areas and optimize your calls to action](https://amplitude.com/docs/heatmaps/use-cases#optimize-clicks-and-calls-to-action).
### Click map Microscope
Highlight an area of the click map to access Microscope. From Microscope, you can:
- View the events in the highlighted area for deeper visibility into user actions, or create a chart to analyze trends and behaviors across your data.
- View replays of user sessions that contain the events in your selection. Replays combine the quantitative insights from Heatmaps with the qualitative context from [Session Replay](https://amplitude.com/docs/session-replay/overview).
- Create a cohort of users who interact with a specific area of a page. For more information, go to [Behavioral Cohorts](https://amplitude.com/docs/analytics/behavioral-cohorts).
## Selector map
The Selector view displays a wire frame of clickable elements on the page, ranked by number of clicks in descending order. Select an element on the map or in the list to watch [Session Replays](https://amplitude.com/docs/session-replay/overview) of those events, view the raw events, or create a cohort of users who engaged with the selector. Use the ranking to [confirm that your most important elements get the most engagement](https://amplitude.com/docs/heatmaps/use-cases#rank-and-validate-key-elements).
{% callout type="note" heading="Page length" %}
Selector maps display the page up to the lowest interactive element recorded, plus a small buffer. For instance, if the lowest button on a page is 1,200px down, the map shows up to that point, even if the full page is longer.
{% /callout %}
### Selector map Microscope
Select a ranked element on the page to access Microscope. From Microscope, you can:
- View the events associated with the element area for deeper visibility into user actions, or create a chart to analyze trends and behaviors across your data.
- View replays of user sessions that contain an interaction with the selected element. Replays combine the quantitative insights from Heatmaps with the qualitative context from [Session Replay](https://amplitude.com/docs/session-replay/overview).
- Create a cohort of users who interact with a specific element. For more information, go to [Behavioral Cohorts](https://amplitude.com/docs/analytics/behavioral-cohorts).
## Scroll map
The scroll map shows the number of sessions and percentage of sessions that have scrolled that part of the page into their viewport. Use the handle on the slider to adjust the scroll depth.
The scroll map also shows the average fold of your page: the amount of the page that appeared on a user's device without the need to scroll. Use scroll depth to [decide what belongs above the fold](https://amplitude.com/docs/heatmaps/use-cases#improve-content-placement).
On the list to the right of the map, select Watch Replays to view [Session Replays](https://amplitude.com/docs/session-replay/overview) where the session scrolled at least that much of your page.
{% callout type="note" heading="Microscope availability" %}
The microscope in heatmaps is only available for click maps and selector maps. The microscope isn't available for scroll maps.
{% /callout %}
{% callout type="note" heading="Page length" %}
Scroll maps reflect the farthest point users scrolled on the page within sessions, with no set limit. For example, if some sessions show a 1,000px version of a page and others show a 2,000px version, the heatmap combines scroll data from both versions. Choose from available background snapshots to align the heatmap with the version most relevant to your analysis.
{% /callout %}
================================================================================
# Troubleshoot Heatmaps
URL: https://amplitude.com/docs/heatmaps/troubleshooting
================================================================================
# Troubleshoot Heatmaps
Use this page to resolve the most common Heatmaps issues. Confirm that your instrumentation meets the [prerequisites](https://amplitude.com/docs/heatmaps/create-a-heatmap#prerequisites) before you start.
## "Heatmaps isn't available for your organization"
This message appears for legacy organizations, which Amplitude created before its current packaging. Legacy organizations require manual enablement and a few considerations:
- Heatmaps sends heatmap events directly to your project, so the events appear in your [event taxonomy](https://amplitude.com/docs/data/data-planning-playbook). Blocking any heatmap event type or property can stop Heatmaps from working, and these events can appear in "Any Event" queries, especially in group-bys.
- If your organization uses [CDP integrations](https://amplitude.com/docs/cdp), Amplitude can forward heatmap events to your data warehouse.
- Heatmaps sends new event properties. If your organization is at its [property limit](https://amplitude.com/docs/faq/limits-and-quotas), raise the limit before Heatmaps can work.
To enable Heatmaps for a legacy organization, contact [Amplitude Support](https://gethelp.amplitude.com).
## A heatmap is blank or shows "No heatmap available"
A blank heatmap usually means the data is brand new, the URL filter doesn't match, or your instrumentation doesn't meet the requirements. Work through these checks:
- **Wait for processing.** Right after you install or enable Session Replay, the URL list and overlays can be empty until Amplitude processes replay and click data. This can take a few minutes.
- **Check the URL filter.** Confirm that your [URL match option](https://amplitude.com/docs/heatmaps/create-a-heatmap#create-a-heatmap) matches URLs in your Amplitude events. A pattern that's too narrow returns no data.
- **Confirm SDK versions.** Heatmaps requires the [Session Replay Browser SDK Plugin](https://amplitude.com/docs/sdks/session-replay/session-replay-plugin) 1.7.0 or later, or the [Session Replay Standalone SDK](https://amplitude.com/docs/sdks/session-replay/session-replay-standalone-sdk) 1.14.0 or later. Verify that the live deployed site serves the updated SDK, not only that the version changed in your code.
- **Confirm the data thresholds.** Heatmaps appear after Amplitude collects enough data: at least 10 separate pages, with about 500 tracked replay clicks on each page.
- **Restore the page URL property.** If the `[Amplitude] Page URL` property is missing, Heatmaps can't match URLs. Restore it in _Data > Properties_: search for `[Amplitude] Page URL` and click **Restore**.
If a heatmap still shows no data after these checks, contact [Amplitude Support](https://gethelp.amplitude.com).
## The background doesn't show the right page state
A heatmap background is a snapshot of a Session Replay, so the default snapshot might capture an unwanted state, such as a page with an open modal that covers the content. Use the **Choose Background** option to move through the available snapshots and select a state that matches the page you want to analyze. Each heatmap fetches eight backgrounds from the states that generated the most actions.
Backgrounds aren't a pixel-perfect copy of the live page. Pages that rely on a content security policy (CSP) that blocks external resources, or that use Shadow DOM styling, can render differently in the background.
## A mobile heatmap shows no data
Heatmaps supports web-based session replays only and doesn't support mobile apps or SDKs. If a mobile _web_ heatmap shows no data even though mobile replays exist, confirm that the device type you selected for the heatmap matches the viewport you captured. A mismatch between the selected device type and the captured screenshot can produce warnings, poor rendering, or no usable background.
## Clicks merge on single-page apps
Heatmaps compute data per URL string, not per view. On a single-page app (SPA) where many states share one URL, a heatmap merges the clicks from all of those states into one overlay. To separate the states, create individual heatmaps with narrower URL filters that target each state, or adjust your URL structure so each view has a distinct URL.
## Heatmaps look incomplete when you use sampling
If you apply a Session Replay [sample rate](https://amplitude.com/docs/session-replay/session-replay-settings#sampling), Heatmaps still generate, but each heatmap reflects only the sessions you captured. For example, a 1% sample rate builds the heatmap from 1% of sessions, which gives a less comprehensive view and can reduce accuracy. Raise the sample rate to capture more interactions.
## Heatmaps appear that you didn't create
Amplitude automatically creates a small set of heatmaps for your highest-traffic pages after your data meets the thresholds. This automatic creation runs one time and selects the pages with the most tracked clicks. You can safely delete these heatmaps, and Amplitude doesn't recreate them.
## A banner asks you to update your SDK
A banner that prompts you to update your SDK to get the full benefit of Heatmaps means you're running an older Session Replay SDK version. Upgrade to the latest version of the [Session Replay Browser SDK Plugin](https://amplitude.com/docs/sdks/session-replay/session-replay-plugin) or the [Session Replay Standalone SDK](https://amplitude.com/docs/sdks/session-replay/session-replay-standalone-sdk) to get the latest capture and rendering improvements.
================================================================================
# Guides and Surveys
URL: https://amplitude.com/docs/guides-and-surveys
================================================================================
# Guides and Surveys
Build in-product guides and surveys to drive feature adoption and gather feedback in context. Amplitude Guides and Surveys helps users learn your product and shares signals back to the teams who shape it.
{% outcomes heading="Explore Guides and Surveys" %}
{% outcome icon="MessageSquare" title="Help users get to value faster" href="https://amplitude.com/docs/guides-and-surveys/guides" %}
Add tooltips, modals, and walkthroughs so users discover features and finish onboarding without a support ticket.
{% /outcome %}
{% outcome icon="ClipboardList" title="Ask users while it's fresh" href="https://amplitude.com/docs/guides-and-surveys/survey-overview" %}
Capture sentiment, intent, and unmet needs in the moment, not in a post-hoc email survey.
{% /outcome %}
{% outcome icon="Eye" title="Make every message feel native" href="https://amplitude.com/docs/guides-and-surveys/themes" %}
Style guides and surveys with reusable themes so they look like your product, not a third-party widget.
{% /outcome %}
{% outcome icon="Target" title="Reach the user who needs it" href="https://amplitude.com/docs/guides-and-surveys/setup-and-target" %}
Trigger on behavior, properties, and cohorts so each user sees the message that fits where they are.
{% /outcome %}
{% outcome icon="Users" title="Speak every user's language" href="https://amplitude.com/docs/guides-and-surveys/localization" %}
Localize guides and surveys from one source so international users get the same experience.
{% /outcome %}
{% outcome icon="LineChart" title="Prove guides moved the needle" href="https://amplitude.com/docs/guides-and-surveys/analyze-a-survey" %}
Tie guide and survey interactions back to product metrics so you know which messages actually changed behavior.
{% /outcome %}
{% /outcomes %}
## Design in-product experiences
Create guides and surveys that match your product, ask timely questions, and help users complete important workflows.
- [Create guides](https://amplitude.com/docs/guides-and-surveys/guides) to introduce features, announce changes, and support onboarding.
- [Build surveys](https://amplitude.com/docs/guides-and-surveys/build-a-survey) to collect feedback while users work in your product.
- [Use templates](https://amplitude.com/docs/guides-and-surveys/templates) to start from common guide and survey patterns.
- [Customize themes](https://amplitude.com/docs/guides-and-surveys/themes) so each experience matches your brand.
## Target and measure experiences
Use behavioral data to decide who receives an experience, then measure how users respond.
- [Set up targeting](https://amplitude.com/docs/guides-and-surveys/setup-and-target) to trigger guides and surveys for specific users.
- [Personalize content with variables](https://amplitude.com/docs/guides-and-surveys/personalize-with-variables) to tailor messages with user and account properties.
- [Localize guides and surveys](https://amplitude.com/docs/guides-and-surveys/localization) to support users across languages.
- [Analyze survey results](https://amplitude.com/docs/guides-and-surveys/analyze-a-survey) to connect responses to product behavior.
{% academy-link
title="Engage Your Users with Guides and Surveys"
url="https://academy.amplitude.com/engage-your-users-with-guides-and-surveys"
description="Learn to deliver targeted, in-product messages that drive adoption, engagement, and retention with Amplitude's Guides and Surveys."
/%}
================================================================================
# Get Started
URL: https://amplitude.com/docs/guides-and-surveys/get-started
================================================================================
# Get Started
Guides and Surveys displays in-product guides and surveys to users on web, iOS, Android, and React Native apps. To get started, install one of the available SDKs based on where you want to display guides and surveys.
To open Guides and Surveys, select **Guides and Surveys** in the left navigation in Amplitude.
## Overview tab
The Overview tab shows how your guides and surveys perform. It provides insights into engagement, interactions, and user behavior, so you can track in-product guidance performance in one place.
### Filter card
The Filter card narrows the scope of your analysis to a specific date range, segment, or property condition. For example, view users on a specific account tier, or find users who performed a specific action.
### Views and completions over time
This section displays line charts for surveys viewed, surveys completed, guides viewed, and guides completed over the time range defined in the filter card.
Use [Microscope](https://amplitude.com/docs/analytics/microscope) on this chart to investigate with session replays and user streams. You can also target users in a data point with follow-up guides or surveys, create a cohort, or download the users for export to another system.
### Total guide views
This section shows the total number of non-unique views for guides over the last 30 days. Use this number to track engagement across all live guides.
### Recent guides performance
This section displays individual guides and their view counts over the last 30 days. Use this section to compare how different guides perform.
### Total survey responses
This section shows the total number of survey responses from all active surveys over the last 30 days.
### Recent survey performance
This section displays individual surveys and their response counts over the last 30 days. Use this section to analyze user response rates and identify trends.
### Rage closes
This section measures the percentage of users who rage closed a guide or survey. A high rage close rate can indicate poor timing or intrusive placement.
{% callout type="tip" heading="Rage closes" %}
Amplitude treats a guide or survey that a user rapidly dismisses or exits as "rage closed". This behavior indicates user dissatisfaction.
{% /callout %}
### Guides and Surveys interactions
This section provides a real-time feed of how users interact with your guides and surveys. Use this feed to track engagement patterns and optimize your content.
## Supported apps
Guides and Surveys supports web, iOS, Android, and React Native apps. Select the target app or environment when you create a new guide or survey.
### Enable or disable apps
Guides and Surveys has a project-level setting that enables or disables different environments, called "apps". When you enable an app, it appears as an option when you create a new guide or survey.
================================================================================
# Proxy requests to Guides and Surveys
URL: https://amplitude.com/docs/guides-and-surveys/proxy
================================================================================
# Proxy requests to Guides and Surveys
Set up a single AWS CloudFront distribution to reverse proxy both static assets and Guides and Surveys API traffic. A reverse proxy can help circumvent domain blocking in certain regions or by specific extensions and DNS servers. Guides and Surveys APIs and static assets are latency-sensitive, so Amplitude recommends using edge-hosted solutions to minimize round-trip time.
## Create a unified CloudFront distribution
This setup uses one CloudFront distribution with three origins and three cache behaviors:
- The **default origin** proxies `cdn.amplitude.com` or `cdn.eu.amplitude.com` for static SDK assets.
- A **secondary origin** proxies `gs.amplitude.com` or `gs.eu.amplitude.com` for API requests prefixed with `/sdk/`.
- A **third origin** proxies `engagement-static.amplitude.com` or `engagement-static.eu.amplitude.com` for nudge images using a wildcard pattern.
### Step-by-step configuration
1. In AWS, open **CloudFront** and click **Create CloudFront distribution**.
2. Configure the first origin:
- **Origin domain**: `cdn.amplitude.com` for the US data center, or `cdn.eu.amplitude.com` for the EU data center
- **Allowed HTTP methods**: `GET, HEAD, OPTIONS`
- **Cache HTTP methods**: `OPTIONS`
- **Cache policy**: Choose a suitable caching policy for static assets (for example, `CachingOptimized`)
- **Origin request policy**: `AllViewerExceptHostHeader`
- **Response headers policy**: `CORS-with-preflight-and-SecurityHeadersPolicy`
- **Web Application Firewall (WAF)**: Don't enable security protections.
Click **Create distribution**
3. Add a second origin for the Guides and Surveys API. Navigate to the _Origins_ tab and click **Create origin**:
- **Origin domain**:
- `gs.amplitude.com` for the US data center, or
- `gs.eu.amplitude.com` for the EU data center
4. Navigate to the 'Behaviors' tab and click **Create behavior**:
- **Path pattern**: `/sdk/*`
- **Origin**: Select `gs.amplitude.com` or `gs.eu.amplitude.com`
- **Allowed HTTP methods**: `GET, HEAD, OPTIONS, PUT, POST, PATCH, DELETE`
- **Cache HTTP methods**: `OPTIONS`
- **Cache policy**: `CachingDisabled`
- **Origin request policy**: `AllViewerExceptHostHeader`
- **Response headers policy**: `CORS-with-preflight-and-SecurityHeadersPolicy`
{% callout type="warning" %}
Use the wildcard pattern `/sdk/*` exactly as shown. Don't hard code a list of specific paths like `/sdk/config`. The Guides and Surveys SDK makes requests to multiple endpoints under the `/sdk/` path, including `/sdk/admin/config` for preview mode functionality. Using specific paths instead of the wildcard pattern causes some features to fail.
{% /callout %}
5. Add a third origin for nudge images. Navigate to the _Origins_ tab and click **Create origin**:
- **Origin domain**:
- `engagement-static.amplitude.com` for the US data center
- `engagement-static.eu.amplitude.com` for the EU data center
6. Navigate to the 'Behaviors' tab and click **Create behavior**:
- **Path pattern**: `*`
- **Origin**: Select `engagement-static.amplitude.com` or `engagement-static.eu.amplitude.com`
- **Allowed HTTP methods**: `GET, HEAD, OPTIONS`
- **Cache HTTP methods**: `OPTIONS`
- **Cache policy**: Choose a suitable caching policy for static assets (for example, `CachingOptimized`)
- **Origin request policy**: `AllViewerExceptHostHeader`
- **Response headers policy**: `CORS-with-preflight-and-SecurityHeadersPolicy`
## Test the proxy
After AWS deploys the distribution, test both the API and CDN paths to confirm that requests route to the correct origins.
### Test the Guides and Surveys API
Replace `SUBDOMAIN` with the CloudFront domain name and `APIKEY` with your project’s API key.
```bash
curl -i 'https://SUBDOMAIN.cloudfront.net/sdk/v1/decide' -H 'Authorization: Api-Key APIKEY'
```
A successful response returns HTTP status `200 OK`.
### Test the CDN
```bash
curl -I 'https://SUBDOMAIN.cloudfront.net/engagement-browser/prod/index.min.js.gz'
```
A successful response returns HTTP status `200 OK`.
## Initialize the SDK with the proxy
Point `serverUrl`, `cdnUrl`, and `mediaUrl` to the same CloudFront domain:
```js
engagement.init("API_KEY", {
serverUrl: "https://SUBDOMAIN.cloudfront.net",
cdnUrl: "https://SUBDOMAIN.cloudfront.net",
mediaUrl: "https://SUBDOMAIN.cloudfront.net",
});
```
The `mediaUrl` parameter ensures that images used in nudges are also proxied through your CloudFront distribution. The `mediaUrl` parameter prevents images from failing to load when customer domains block requests to `engagement-static.amplitude.com`.
## Troubleshooting common proxy issues
- **Preview mode doesn't work**
- **Symptoms**: Preview mode fails to load or display guides properly
- **Cause**: Path pattern configured with specific paths instead of wildcard pattern `/sdk/*` (for example, using `/sdk/config`)
- **Solution**: Set the path pattern to `/sdk/*` exactly as specified in step 4. Preview mode makes requests to `/sdk/admin/config`, which won't be proxied with specific paths.
- **Guides don't persist dismissal or completion state**
- **Symptoms**: Guides reappear on the next session even after the user dismisses or completes them.
- **Cause**:
- Cause 1: Allowed HTTP methods don't include `POST`, which Guides and Surveys requires for state updates.
- Cause 2: the origin request policy isn't `AllViewerExceptHostHeader`
- **Solution**:
- Solution 1: Verify that allowed HTTP methods in step 4 include `POST` along with other required methods: `GET, HEAD, OPTIONS, PUT, POST, PATCH, DELETE`. Without `POST`, the SDK can't send requests to the `/state` endpoint to update user interaction state.
- Solution 2: Confirm the origin request policy is `AllViewerExceptHostHeader`. `POST` requests fail if the host header is overridden with an invalid value.
- **Images don't load in nudges**
- **Symptoms**: Images in guides appear as broken or missing, showing placeholder icons instead
- **Cause**:
- Cause 1: `mediaUrl` parameter not configured in SDK initialization.
- Cause 2: Missing wildcard `*` cache behavior for image origin.
- Cause 3: Image origin not configured correctly.
- **Solution**:
- Solution 1: Add `mediaUrl: "https://SUBDOMAIN.cloudfront.net"` to your SDK initialization.
- Solution 2: Confirm you have created a wildcard `*` cache behavior pointing to the `engagement-static.amplitude.com` or `engagement-static.eu.amplitude.com` origin.
- Solution 3: Verify the image origin domain matches your data center (US or EU).
### General debugging steps
1. **Check CloudFront logs**: Enable logging on your CloudFront distribution to see which requests are being made and their response codes.
2. **Verify all three origins are configured**: Confirm that you have the CDN origin (`cdn.amplitude.com` or `cdn.eu.amplitude.com`), the API origin (`gs.amplitude.com` or `gs.eu.amplitude.com`), and the image origin (`engagement-static.amplitude.com` or `engagement-static.eu.amplitude.com`).
3. **Test both endpoints**: Use the curl commands in the "Test the proxy" section to verify that both the API and CDN paths work correctly.
4. **Check browser network tab**: Look for failed requests in your browser's developer tools network tab, particularly 404 or 403 errors that may indicate routing issues.
================================================================================
# Overview
URL: https://amplitude.com/docs/guides-and-surveys/guide-overview
================================================================================
# Overview
Guides are in-product messages that prompt users to complete tasks, explore features, or learn about your product. Guides use behavioral triggers, strike detection, and rate-limiting to avoid disrupting users.
Guides support [conditional logic](https://amplitude.com/docs/guides-and-surveys/conditional-logic) on buttons, so you can create personalized experiences that adapt based on user properties.
## Guide templates
When you create a guide, start with a blank guide or select a template:
| Template | Use case |
| ---------------------------------------------- | --------------------------------------------------------- |
| Tour | Guide users through your product. |
| Announcement | Share product changes, company updates, or new features. |
| Checklists {% platform-tag platform="web" /%} | Show step-by-step instructions for completing tasks. |
| Carousel {% platform-tag platform="mobile" /%} | Highlight key features in a swipeable onboarding flow. |
| Banners | Display important messages or alerts. |
| Tooltips | Provide tips or context for a specific element on screen. |
| Card embed {% platform-tag platform="web" /%} | Embed a card-format guide or survey in your page layout. |
================================================================================
# Guide form factors and properties
URL: https://amplitude.com/docs/guides-and-surveys/form-factors
================================================================================
# Guide form factors and properties
Guides and Surveys include a variety of form factors. Each form factor has a set of properties that control how it behaves for the end user.
## Form factors
Each form factor shares a similar set of [properties](#properties).
### Modal
Modals are a full-focus experience that takes center stage. Use modals to deliver important messages or guide users through a multi-step flow.
Customize your modal with the following:
- Pick a layout: classic, horizontal split, vertical split, or showcase.
- Add a button, and customize what happens when users click or tap it.
- Add an image or video. Amplitude places media elements depending on the selected layout.
- Animate the text. Text animation causes text to animate in when the guide appears.
Click the three dot menu to access format settings.
| Setting | Description |
| --------------------------- | ----------------------------------------------------------------- |
| Content layout | Updates the visual ordering of the guide's content. |
| Title and content alignment | Changes the alignment of the title and body text. |
| Actions bar {% platform-tag platform="web" /%} | Updates the placement and layout of the guide's buttons. |
| Click/Tap outside to close | Enables users to click or tap outside of the modal to dismiss it. |
| Text animation | Enables the modal's text to animate in with a typewriter effect. |
### Popover
A subtle nudge that appears near a contextually relevant element. Use popovers for quick tips or to direct users' attention without interrupting their flow.
Popovers offer many of the same customization options as modals.
Click the three dot menu to access format settings.
| Setting | Description |
| --------------------------- | ------------------------------------------------------------------ |
| Content layout | Updates the visual ordering of the guide's content. |
| Title and content alignment | Changes the alignment of the title and body text. |
| Actions bar {% platform-tag platform="web" /%} | Updates the placement and layout of the guide's buttons. |
| Z-index {% platform-tag platform="web" /%} | Specify a custom z-index value for the popover. |
| Text animation | Enables the popover's text to animate in with a typewriter effect. |
### Pin
Pins are persistent markers that remain on screen until a user interacts with them. Use pins to highlight key features or provide contextual help users can refer to.
{% callout type="note" heading="Pins can advance without CTA clicks" %}
By default, when a user clicks a pin's target element, the tour advances to the next step. You can disable this behavior with the **Disable auto-advance on target click** setting (web only). The **Advance trigger** setting in the [Pin](#pin) format settings lets you specify an additional element that also advances the tour when a user clicks it.
{% /callout %}
{% callout type="note" heading="Analytics impact for pins not set to open by default" %}
For pin guides that aren't set to **Open by default**, clicking the target element marks the guide as complete without generating a Guide Viewed event. This can result in more Guide Completed events than Guide Viewed events when users interact with the target element without first opening the pin beacon.
{% /callout %}
Pins offer different customization options than modals or popovers. Toggle between opening them by default, or start them closed. Use **Show mask** to display a semi-transparent overlay that highlights the pinned element and dims the rest of the screen.
Pins can use the following position settings:
- Auto
- Top of target
- Bottom of target
- Left of target
- Right of target
The position setting specifies where the pin message renders relative to its target. If the target element's location is incompatible with the specified position, Amplitude tries a different location. For example, if the target is on the far-left side of the page, the pin can't render to the left. Amplitude then attempts to render the pin above, below, or to the right of the target. If the pin can't display in any of the four positions, Amplitude doesn't render the pin.
Click the three dot menu for the pin to access format settings.
| Setting | Description |
| -------------------------------------------------- | -------------------------------------------------------------------------------------------------------------------------------------------------------------------------------------------------------------------------------------------- |
| Open by default | Enables the pin to open without user interaction. If disabled, users must click or tap the pin to open it. |
| Open on hover | Opens the pin when the user hovers over the hotspot. Disable **Open by default** to use this setting. When **Open by default** is disabled and the **Open on hover** setting is also disabled, users must click the hotspot to open the pin. |
| Show mask | Enables a background mask when the pin is open to help draw the user's focus. |
| Content layout | Updates the visual ordering of the guide's content. |
| Title and content alignment | Changes the alignment of the title and body text. |
| Actions bar {% platform-tag platform="web" /%} | Updates the placement and layout of the guide's buttons. |
| Z-index {% platform-tag platform="web" /%} | Specify a custom z-index value for the popover. |
| Text animation | Enables the pin's text to animate in with a typewriter effect. |
| Disable auto-advance on target click | When you enable this option, clicking on the target element doesn't advance the guide to the next step. |
| Skip if target not found | When you enable this option, the guide skips to the next step if it can't find the target element within `250ms` of the step becoming active. If the step is the last step and the guide skips it, the guide completes. |
| Advance trigger {% platform-tag platform="web" /%} | Enables advancing the guide to another step when the user interacts with the element you specify. |
### Tooltip
{% callout type="tip" heading="" %}
Tooltips are available in the Tooltip template, and contain one step.
{% /callout %}
Tooltips are like pins, but reveal only when a user clicks, taps, or hovers over them. Use tooltips to give inline details about a feature while saving UI space.
| Setting | Description |
| ------------------------------------------------------ | ----------------------------------------------------------------------------------------------------------------------------------------------------------------------------------------------------------------------------------------------------------------------------------------------------------- |
| Content layout | Updates the visual ordering of the guide's content. |
| Title and content alignment | Changes the alignment of the title and body text. |
| Actions bar {% platform-tag platform="web" /%} | Updates the placement and layout of the guide's buttons. |
| Z-index {% platform-tag platform="web" /%} | Specify a custom z-index value for the popover. |
| Pointer | Select the style that relates the dialog to the marker. |
| Marker | Select the appearance of the marker that reveals the tooltip message. |
| Element is marker {% platform-tag platform="web" /%} | The targeted element becomes the tooltip trigger. The tooltip displays when the user clicks or hovers the element, without a separate marker icon. Use this when the page element already has an obvious affordance, such as a button, link, or icon, and you don't want a second indicator overlaid on it. |
| Marker Width {% platform-tag platform="web" /%} | Define the width of the tooltip's marker (icon/image) in pixels. |
| Text animation | Enables the tooltip's text to animate in with a typewriter effect. |
| Show on hover/click {% platform-tag platform="web" /%} | Select the trigger that causes the tooltip message to appear. |
{% callout type="note" heading="" %}
Tooltips bypass cooldowns and remain visible even after a user completes them. For tooltip surveys, users can fill out the survey again as a new submission.
{% /callout %}
### Banner
{% callout type="tip" heading="" %}
Banners are available in the Banner template, and contain one step.
{% /callout %}
Banners are full-width blocks that show on either the top or bottom of the page. Use banners for longer-term announcements, status updates, or time-sensitive promotions.
{% callout type="info" heading="Banner display limitations" %}
Banners can overlap existing content on your website even when using the **Inline** display style. Overlap happens when your site has conflicting CSS styles on the `body` element or other page elements. If changing the display style from **Overlay** to **Inline** doesn't resolve content overlap, conflicting CSS in the application prevents the banner from rendering in the intended position.
{% /callout %}
{% callout type="tip" heading="Use card embeds as a workaround" %}
If banners aren't rendering as expected, try [card embeds](#card-embed). Card embeds render content directly into your page's DOM as native elements, which reduces the chance of CSS conflicts. For example, you can configure a card embed as **Prepend to children (first child)** on `<body>`, which typically renders the card as the top element on the page.
{% /callout %}
| Setting | Description |
| ------------------------------------------------ | ------------------------------------------------------------------------------------------------------------ |
| Sticky {% platform-tag platform="web" /%} | Keeps the banner visible while the user scrolls. |
| Display style {% platform-tag platform="web" /%} | Controls the way in which the banner interacts with the page's content. Mobile banners support overlay only. |
| Z-index {% platform-tag platform="web" /%} | Specify a custom z-index value for the popover. |
| Text animation | Enables the banner's text to animate in with a typewriter effect. |
### Checklist {% platform-tag platform="web" /%}
Checklists provide a form that helps users track progress toward a goal. They contain one header and one or more checklist items. Use checklist items to trigger actions.
| Setting | Description |
| ------- | ------------------------------------------------- |
| Z-index | Specify a custom z-index value for the checklist. |
#### Checklist items {% platform-tag platform="web" /%}
Checklist items compose a checklist.
| Setting | Description |
| --------- | ----------------------------------------------------------------------------- |
| Skippable | If enabled, the user can complete the checklist item through a "Skip" button. |
### Carousel {% platform-tag platform="mobile" /%}
Carousels present a multi-step guide as a single card that users swipe left or right to navigate, instead of relying on button taps. Use carousels for onboarding flows or feature tours you want users to browse at their own pace.
Carousels render full screen on phones and in a fixed-width card on tablets. Each step in a carousel uses the classic layout and supports the same [blocks](#blocks) and [properties](#properties) as other form factors.
| Setting | Description |
| ------------------- | ----------------------------------------------------------------------------------------------------------------------------------- |
| Show step counter | Displays the guide's progress as users swipe between steps. |
| Step counter format | Choose **Numeric** (for example, `1/3`), **Verbose** (for example, `1 of 3`), or **Dots** to represent progress with indicator dots. |
### Card embed
Card embeds render guides and surveys as native elements within your UI. Use them for persistent content that should feel like part of your application rather than an overlay.
{% callout type="note" heading="Unique identifier required" %}
Each card embed needs its own unique target identifier (mobile only). Use the same element tagging as pins and tooltips on most platforms (for example, `.amplitudeView` in SwiftUI). On Jetpack Compose, wrap the target in the `AmplitudeView` composable instead of the `.amplitudeView` modifier. Multiple card embeds can't share an identifier on the same screen. Sharing an identifier can cause cards not to render or to be positioned incorrectly.
{% /callout %}
Card embeds require a target element selector that specifies where to place the card. Go to [Element selector](#element-selector) for platform-specific targeting setup. Select from these position options to control how the card relates to the target element:
| Position | Description |
| -------------------------------------------------------------------- | ---------------------------------------------------------------------------------------------------------------------------------------------------------------------------------------------------------------------------------------------------------------- |
| Append to children (last child) {% platform-tag platform="web" /%} | Inserts the card as the last child element within the target. |
| Prepend to children (first child) {% platform-tag platform="web" /%} | Inserts the card as the first child element within the target. |
| Before element | Places the card immediately before the target element. |
| After element | Places the card immediately after the target element. |
| Replace element | Replaces the target element with the card. |
| Width | Choose **Auto** to let the card size to its content, **Fixed** to specify a pixel width, or **Full** to fill the container width. |
| Alignment | When width isn't **Full**, align the card to the **Left**, **Center**, or **Right** of its container. |
| Height | Choose **Auto** to let the card size to its content, **Fixed** to specify a pixel height, or **Full** to fill the container height. |
| Margin | Set the top, right, bottom, and left margin (in pixels) to control spacing between the card and surrounding UI elements. Margin differs from padding: margin controls external spacing around the card, while padding controls internal spacing within the card. |
Click the **three dot menu** to access format settings.
| Setting | Description |
| ------------------------------------------------- | --------------------------------------------------------------- |
| Content layout {% platform-tag platform="web" /%} | Updates the visual ordering of the guide's content. |
| Actions bar {% platform-tag platform="web" /%} | Updates the placement and layout of the guide's buttons. |
| Z-index {% platform-tag platform="web" /%} | Specify a custom z-index value for the card. |
| Text animation | Enables the card's text to animate in with a typewriter effect. |
## Element selector {% platform-tag platform="web" /%}
When you configure guides or surveys with pins, tooltips, card embeds, or element-based triggers, you must specify which element to target. How you specify the target depends on your platform.
### Web {% platform-tag platform="web" /%}
The element selector helps you identify and target specific page elements using CSS selectors.
#### How the element selector works
Amplitude's visual element selector automatically identifies the most stable CSS selector for the element you choose, so your guide continues to work even if minor page changes occur.
To use the visual selector:
1. Click **Test and Preview** in the guide builder.
2. Navigate to the page containing your target element.
3. Click the element you want to target.
4. Amplitude automatically generates a CSS selector for that element.
##### Selecting nested elements
To select nested elements (elements inside other elements), use the Alt key (Option key on Mac) while hovering over elements:
1. Click **Test and Preview**.
2. Hover over the parent element.
3. Hold the Alt/Option key.
4. Continue hovering to drill down into nested child elements.
5. Click to select the nested element you want.
Use this method to target specific elements within complex page structures, such as buttons within cards or icons within menus.
#### Override or provide your own selector
To specify your own selector or get more control, manually enter a CSS or XPath selector:
1. In the element selector field, paste your CSS selector or XPath expression.
2. Choose your selection strategy:
- **CSS Selector**: Standard CSS selector syntax (for example, `#submit-button`, `.primary-cta`).
- **XPath**: XPath expression for more complex targeting (for example, `//button[@id='submit']`).
3. Optionally, add fallback text that Amplitude uses if the selector doesn't find a match.
4. Test your selector with **Test and Preview** to confirm it targets the correct element.
{% callout type="tip" heading="Best practices for custom selectors" %}
- Use stable attributes like IDs or data attributes that are less likely to change.
- Avoid selectors that depend on specific positioning (like `:nth-child`) unless necessary.
- Test your selectors across different pages and screen sizes.
- Add data attributes specifically for guide targeting to ensure reliability.
- Use `:is()` to create flexible selectors that work across multiple similar elements.
{% /callout %}
**Examples of custom selectors:**
- CSS Selector: `.header-navigation > .menu-item:first-child`
- XPath: `//div[@class='container']//button[contains(text(), 'Submit')]`
- CSS with multiple elements: `:is([my-class="foo"],[my-class="bar"])`
{% callout type="tip" %}
Amplitude supports most modern CSS selector features, including functional pseudo-classes like `:is()`, `:not()`, `:nth-of-type()`, and `:where()`, so you can create more expressive and flexible selectors.
{% /callout %}
#### Target elements in shadow DOM
The visual element selector can't cross into shadow DOM boundaries. To target elements inside a shadow DOM, copy the JS path from your browser's DevTools and paste it into the selector field:
1. Open DevTools and navigate to the **Elements** panel.
2. Locate the target element inside the shadow root.
3. Right-click the element and select _Copy > Copy JS path_.
4. Paste the JS path into the element selector field in the guide builder.
Amplitude resolves through shadow roots and attaches the guide correctly.
{% callout type="note" %}
If the target element doesn't exist in the DOM when the step renders, the pinned step doesn't display. Guides and Surveys doesn't support virtual targeting or auto-skipping for missing anchor elements.
{% /callout %}
#### Requirements for placeholder elements
If you use a placeholder element to represent a shadow DOM component, ensure the element meets these requirements for the visual selector to detect it:
- The element isn't set to `display: none`.
- The element has non-zero dimensions (width and height).
- The element doesn't have `pointer-events: none`.
If the visual selector still can't detect the element, use DevTools to copy the CSS selector or JS path and paste it into the selector field manually.
### Mobile {% platform-tag platform="mobile" /%}
Guides and surveys that use pins, tooltips, or card embeds require the SDK to target specific views on screen. Tag each target view with a unique identifier in your app, then use that string in the guide or survey builder's element selector field.
On Jetpack Compose, wrap card embed targets in the `AmplitudeView` composable. Pins and tooltips can use the `.amplitudeView` modifier.
Go to the element targeting section for your platform:
- [Guides and Surveys iOS SDK](https://amplitude.com/docs/sdks/guides-and-surveys/guides-and-surveys-ios-sdk#enable-element-targeting)
- [Guides and Surveys Android SDK](https://amplitude.com/docs/sdks/guides-and-surveys/guides-and-surveys-android-sdk#enable-element-targeting)
- [Guides and Surveys React Native SDK](https://amplitude.com/docs/sdks/guides-and-surveys/guides-and-surveys-rn-sdk#element-targeting)
- [Guides and Surveys Flutter SDK](https://amplitude.com/docs/sdks/guides-and-surveys/guides-and-surveys-flutter-sdk#element-targeting)
## Properties
These properties apply across form factors, so you can customize your guide components. Options available for each property may differ across form factors.
### Position
Position controls where the guide appears on screen.
| Form factor | Options |
| --------------------------------------------------- | ---------------------------------------------------------------------------------------------------------------------------------------------------------------------------------------------------------------------------------------------------------------------------------------------------------------------------------------------------------------------- |
| Modal | Top right, top center, top left, right center, bottom right, bottom center, bottom left, left center, center. |
| Popover | Top right, top center, top left, right center, bottom right, bottom center, bottom left, left center, center. |
| Pins | Controls position of the pin relative to the target element. Select the position and the alignment of the guide. For example, Position: `Bottom of target` and Alignment: `Left` places the guide below the target element, and aligns the guide's left side with the target's left side. |
| Tooltip | Specify the side of the target element where the info marker appears. Add vertical or horizontal offset as necessary. |
| Banner | Top or bottom of the page. Set the **Sticky** option to keep the banner visible while the user scrolls. Choose the Display style: **Inline** to display the banner within the contents of the page, or **Overlay** to float the banner on top of the page contents. |
| Card embed {% platform-tag platform="web" /%} | Controls position relative to the target element. Select from **Append, Prepend, Before, After**, or **Replace**. Configure Width (**Auto, Fixed**, or **Full**), Alignment (**Left, Center**, or **Right**) when width isn't **Full**, Height (**Auto, Fixed**, or **Full**), and Margin (top, right, bottom, and left in pixels) to control spacing around the card. |
| Checklist header {% platform-tag platform="web" /%} | Bottom left or Bottom right, in relation to the page. |
### Steps
Use steps to create multi-step guides. Break down processes into smaller, actionable steps that guide users from start to finish.
{% callout type="tip" heading="" %}
Tooltips and Banners contain one step.
{% /callout %}
### Blocks
Blocks let you make your guide more engaging. Add a Button CTA, an image, or a video. Blocks align automatically based on the form factor and alignment you set.
#### Buttons
When you add a button, you can choose what happens when users click or tap it. Both primary and secondary buttons support all actions, including conditional logic.
| Action | Description |
| --------------------------------------------------------------------- | -------------------------------------------------------------------------------------------------------------------------------------------------------------------------------------------------------------------------------------------------------------------------------------------------------------------------------------------------------------------------------------------------------------------------------------------------------------------------------------------------------------------------------------------------------------------------------------------------------------------------------------- |
| Visit link | Opens the specified website. For **web** guides and surveys, choose **Same tab** (opens in the current tab/screen), **New tab** (opens in a new browser tab), or **Use router**, which uses your configured router and requires [router configuration](https://amplitude.com/docs/guides-and-surveys/sdk#router-configuration). For **mobile** guides and surveys, choose **Open in In-App Browser** (opens the link within your app), **Open in Device Browser** (opens in the device's default browser), or **Use router**. |
| Click/Tap element | Specify an element on the page that receives a click event when the user clicks the button in the guide. |
| Show guide | Launch another guide. |
| Show survey | Launch a survey. |
| Go back | Go to the previous step in the guide. |
| Go forward | Advance to the next step in the guide. |
| Go to step | Go to the specified step in the guide. |
| Evaluate conditional logic | Execute different actions based on user properties or survey responses. Create conditions to personalize the button's behavior for different users. Go to [Conditional Logic](https://amplitude.com/docs/guides-and-surveys/conditional-logic) for more information. |
| Run callback | Trigger a callback function defined in your Guides and Surveys instrumentation. For more information, go to [Register a callback](https://amplitude.com/docs/guides-and-surveys/sdk#register-a-callback) |
| Submit app store rating request {% platform-tag platform="mobile" /%} | Prompt the user to rate your app using the native in-app flow (App Store for iOS and Google Play for Android). The SDK calls the native rating API (StoreKit for iOS, Play In-App Review for Android). If the native API call itself returns an error (for example, no valid scene or activity) and you provide the app identifier in the survey configuration, the request falls back to the platform's app store page. If the call succeeds but the platform chooses not to show the rating dialog (due to rate limits, user opt-out, or other platform restrictions), the survey dismisses silently without opening the store page. |
| Open AI Assistant | Open the AI Assistant interface. |
| Open Resource Center | Open the Resource Center. |
| Open Document | Open a specified document. |
{% callout type="note" %}
[Apple](https://developer.apple.com/documentation/storekit/requesting-app-store-reviews) and [Google](https://developer.android.com/guide/playcore/in-app-review) control their own native app review display and may override requests for review from your guide.
{% /callout %}
#### Mark step complete when {% platform-tag platform="web" /%}
Only checklists have the **Mark step complete when** option. Amplitude marks a checklist step complete when one of the following activities occurs:
- `Button is clicked`
- `Page is visited`
- `Element is clicked`
- `Event is tracked`
For each option, the checklist step updates from "incomplete" to "complete" only if the action happens on the client while the checklist is visible. For example, if Amplitude tracks an event server side, or the event happens before the checklist is shown, the step isn't marked complete.
#### Image
Upload an image to include in your experience. The experience's layout determines the image's position.
#### Video
Paste the URL of a video (YouTube, Vimeo, Loom, Vidyard, or .MP4 file). Like images, layout determines the video's position.
================================================================================
# Templates
URL: https://amplitude.com/docs/guides-and-surveys/guide-templates
================================================================================
# Templates
When you create a new guide, start with a blank guide or use a template. Guides includes the following templates:
| Template | Use case |
| ------------ | --------------------------------------------------------------------------------------- |
| Tour | Guide users to explore your product. |
| Announcement | Share information with users, such as product changes, company updates, or new features. |
| Checklists | Help users complete tasks with step-by-step instructions. |
| Banners | Highlight important messages or alerts. |
| Tooltips | Provide quick tips or context for a specific element on screen. |
================================================================================
# Overview
URL: https://amplitude.com/docs/guides-and-surveys/survey-overview
================================================================================
# Overview
Surveys collect user feedback. Like [guides](https://amplitude.com/docs/guides-and-surveys/guides), surveys target specific users to increase response rates.
Surveys support [conditional logic](https://amplitude.com/docs/guides-and-surveys/conditional-logic) based on survey responses and user properties. Conditional logic lets you branch survey paths and create personalized follow-up questions.
## Survey templates
Surveys offer different templates than [guides](https://amplitude.com/docs/guides-and-surveys/guide-overview#guide-templates). When you create a new survey, start with a blank survey or choose a template:
| Template | Use case |
| -------------- | --------------------------------------------------------------------------------------------------------- |
| NPS | Measure customer satisfaction and loyalty by asking how likely a user is to recommend your product. |
| User feedback | Define your own questions to collect detailed input from users. |
| Rating | Gather initial reactions to evaluate product experiences. |
| Banner Survey | Build a custom survey using the Banner form factor. |
| Tooltip Survey | Build a custom survey using the Tooltip form factor. |
================================================================================
# Build a Survey
URL: https://amplitude.com/docs/guides-and-surveys/build-a-survey
================================================================================
# Build a Survey
The survey build experience contains many of the same features at the guide builder, and uses a subset of the available [form factors](https://amplitude.com/docs/guides-and-surveys/form-factors#form-factors) (modal, popover, pin) and [properties](https://amplitude.com/docs/guides-and-surveys/form-factors#properties).
## Survey blocks
Surveys offer four unique block types, each suitable for capturing a different kind of user feedback.
### Rating
The Rating block lets users provide structured feedback using a scale you define. Surveys provide the following rating types:
| Rating type | Description |
| ------------- | -------------------------------------------------------------------------------------- |
| Stars | A three or five point scale that displays star icons to the user. |
| Numbers | A three, five, seven, or ten point scale that displays numbers to the user. |
| Emojis | A two, three, or five point scale that displays emojis that you choose for each value. |
| NPS | A 0 - 10 point [Net Promoter Score](https://en.wikipedia.org/wiki/Net_promoter_score). |
Select the gear icon in the rating block to access more settings.
| Setting | Description |
| ------------------------ | ---------------------------------------------------------------------------- |
| Required | Enable to require the user to enter a rating. |
| Rating labels | Enter text labels that appear on the low and high ends of the scale. |
| Stars / Numbers / Emojis | Select the number of options available in the rating. Not applicable to NPS. |
#### Conditional logic
Conditional logic lets you create dynamic survey experiences based on user responses and user properties. On each survey step, add one or more conditions that trigger different actions based on user answers or user characteristics. Conditions can reference responses from any prior step in the survey, not just the current one.
Use conditional logic to:
* **Trigger actions based on responses**: Change what happens next based on how a user answers.
* **Branch survey paths**: Users who give a low rating might get a follow-up question asking why, while high ratings advance to a different step.
* **Branch based on earlier responses**: Reference answers from any previous step to create multi-layered survey paths. For example, use a rating from step 1 to determine what happens after step 3.
* **Personalized experiences**: Show different questions or steps based on previous responses or user properties.
* **Combine conditions**: Use both survey responses and user properties together to create branching logic.
For example, on a question with a five point scale, use the following logic:
* If `rating < 4` then `Go to step to ask what went wrong`
* If `rating > 3` then `Go to step with a 'thank you' message`
You can also reference responses from earlier steps. For example, in a multi-step survey:
* Step 1 asks for a feature rating.
* Step 2 asks a follow-up question.
* Step 3 uses conditional logic based on the step 1 rating: if `step 1 rating < 3` then `Go to a detailed feedback step`, otherwise `Go to a thank-you step`.
You can also combine survey responses with user properties. For example:
* If `rating > 8` AND `subscription_tier = premium` then `Show survey asking for app store review`
* If `rating < 5` AND `country = US` then `Show survey with US support contact information`
For details about conditional logic, including how to use it with buttons and guides, go to [Conditional Logic](https://amplitude.com/docs/guides-and-surveys/conditional-logic).
### Long answer
The Long answer block provides users space to provide unstructured feedback.
Select the gear icon in the Long answer block to access more settings.
| Setting | Description |
| ----------------------- | ---------------------------------------------------------------------------- |
| Required | Enable to require the user to enter a rating. |
### Short answer
The Short answer block provides users space to provide unstructured feedback.
Select the gear icon in the Short answer block to access more settings.
| Setting | Description |
| ----------------------- | ---------------------------------------------------------------------------- |
| Required | Enable to require the user to enter a rating. |
| Pre-fill key | Populate the input with a user property that you specify, using the ingested property name, for example `device_type`. If the user property isn't found for a specific user, nothing populates in the field. User properties must be available client-side during the current session. Go to [Set user properties](https://amplitude.com/docs/sdks/guides-and-surveys/sdk#set-user-properties) for implementation details. |
{% callout type="note" heading="Mobile pin limitations" %}
Short answer and long answer blocks aren't available for mobile pins.
{% /callout %}
### List
Lists provide a multiple choice input, letting users choose a response from a list that you define.
Select the gear icon in the List block to access more settings.
| Setting | Description |
| ------------ | ------------------------------------------------------------------------------------------------------------------------------------------------------------------------------------------------------------------- |
| Required | Enable to require the user to select an option. |
| Display as dropdown | Lets users select one option. Changes the block's form elements from radio buttons to a dropdown.
| Multi-select | Lets users select more than one option. Changes the block's form elements from radio buttons to checkboxes.
| Randomize order | Randomizes the item order in the list each time it displays to a user. |
| "Other" option | Provides users the option to select `Other` as a result, and optionally supply a written answer. |
## Setup and target your survey
Survey setup and targeting works the same as for [guides](https://amplitude.com/docs/guides-and-surveys/setup-and-target). Follow the guide instructions to set up your survey.
================================================================================
# Analyze a Survey
URL: https://amplitude.com/docs/guides-and-surveys/analyze-a-survey
================================================================================
# Analyze a Survey
Amplitude provides two levels of survey analysis: aggregate data on survey use and engagement, and response-level data on individual responses and the users who submitted them. Both views are available in the survey itself.
## Insights tab
The Insights tab shows how a survey is performing. The Insights tab tracks responses, identifies trends, and filters data to support decisions based on user feedback.
### Type-specific insights
Some survey types offer insights that are specific to the type of data they capture.
#### NPS
Net Promoter Score (NPS) survey questions provide a breakdown of promoters (score: 8 - 10), passives (score: 6 - 7), and detractors (score: 0 - 5). To calculate the NPS, subtract `% detractors` from `% promoters`.
#### List
Understand the breakdown of responses by option.
### Filter card
The Filter card narrows the scope of analysis to a specific date range, segment, or property condition. For example, view users on a specific account tier, or find users who performed a specific action.
Use the **Ignore test/preview data** toggle to filter out data from test users and preview mode. When you enable this toggle, Amplitude shows only production data in both the Insights tab and the Responses tab, so test activity does not skew your results.
### Views and completions over time
View line charts for surveys viewed and surveys completed over the time range defined in the filter card.
Use [Microscope](https://amplitude.com/docs/analytics/microscope) on this chart to investigate further with session replays and user streams. You can also target the users in a data point with follow-up guides or surveys, create a cohort, or export the user list to another system.
#### Time-based analysis
Track guide and survey engagement trends over predefined time periods.
* Hourly
* Daily
* Weekly
* Monthly
* Quarterly
Use these presets to review when users are most likely to engage with the guide or survey, and to check whether engagement changes after events such as a new product release.
#### Date range selection
Select a predefined range based on the unit of time, or select the calendar icon to define a custom range. Choose from:
* Rolling window (`Last # complete days and today`)
* Since date
* Between dates
Use the advanced settings to:
* Add a date offset to a rolling window
* Exclude Today
* Enable Time Range
## Responses tab
The Insights tab shows aggregate trends. The Responses tab shows the who, what, and when of survey data, with user-level detail tied to specific users and timestamps.
On the Responses tab, you can:
* **View individual responses**: Review what each user submitted.
* **Export responses**: Export a CSV of survey responses.
* **Sort and filter**: Organize responses by date, user ID, or specific answers.
* **Pin important columns**: Keep key data points visible while scrolling.
* **Adjust date ranges**: View responses over the past 7, 30, 60, or 90 days.
Use the **Ignore test/preview data** toggle to filter out data from test users and preview mode.
================================================================================
# Hosted Surveys
URL: https://amplitude.com/docs/guides-and-surveys/hosted-surveys
================================================================================
# Hosted Surveys
A hosted survey collects feedback through a standalone, Amplitude-hosted page that you share by link, instead of showing the survey inside your product. Share the link in an email, a support ticket, or a chat message, and recipients answer on a dedicated page without opening your app. Use a hosted survey to reach people who aren't in your product, such as churned or prospective users. To collect feedback from users while they're in your app, use an in-app survey instead.
## How hosted surveys work
A hosted survey has a unique URL that points to a dedicated page for that survey. Anyone who opens the link sees the survey on its own page and submits a response directly. Hosted surveys use a standardized layout, so the step type (for example, modal, pin, or popover) doesn't affect how the questions and inputs display.
## Get a survey link
1. In Amplitude, open the survey you want to share.
2. Open the survey's hosted link options using the globe icon in the upper right, near the Save and Publish buttons.
3. Copy the generated link from the modal.
4. Share the link through email, chat, a support tool, or any other channel.
## Identify respondents
By default, Amplitude records each response under a randomized user ID (for example, anonymous-hosted-survey-user-8db2f3c13af5). To attribute responses to known users, update the link to include identification parameters with the user's or device's unique ID:
- `userId`: associates the response with a specific user ID.
- `deviceId`: associates the response with a specific device ID.
For example, append a user ID to the link:
```text
https://<your-survey-link>?userId=user42
```
## Analyze hosted survey responses
Hosted surveys emit the same lifecycle events as in-app surveys, so you can analyze responses in Amplitude:
- Survey Viewed
- Step Completed
- Survey Completed
- Survey Submitted
Amplitude tags events and responses from a hosted survey with a distinct `App Type` property, so you can separate them from in-app responses in your analysis.
{% callout type="note" heading="" %}
Amplitude doesn't capture Survey Abandoned events for hosted surveys.
{% /callout %}
## Limitations
During Early Access, hosted surveys have the following limitations:
- You can't configure the survey buttons. Amplitude sets them based on your survey options.
- Hosted surveys don't have dedicated themes. You can control their styling with your existing themes.
- Hosted surveys don't respect targeting, triggers, or limits.
- Hosted surveys require Amplitude Analytics. They don't support third-party analytics tools, such as Segment.
================================================================================
# Templates
URL: https://amplitude.com/docs/guides-and-surveys/templates
================================================================================
# Templates
Templates are reusable starting points for your team's guides and surveys. They include pre-configured designs, placeholder content, targeting, and themes to keep content consistent and reduce setup time.
## Key benefits
- Consistency: every team member follows the same design standards and messaging approach.
- Time-saving: skip repetitive setup work by starting with pre-built foundations.
- Standardization: branding, themes, and structure stay consistent across all guides and surveys.
- Team efficiency: team members get started with proven templates.
- Quality control: review and polish templates before releasing them to your team.
## Built-in Amplitude templates
Amplitude provides pre-built survey templates for common survey types. These templates appear in the *Create Survey* menu:
- How did you hear about us: a two-step acquisition channel survey that identifies where new users discover your product. The first step asks users to select from common sources (social media, search engines, referrals, advertisements, or other). The second step collects more detail through an optional short-answer field.
- NPS (Net Promoter Score): measures how likely users are to recommend your product on a 0-10 scale. Track customer loyalty by identifying promoters (9-10), passives (7-8), and detractors (0-6), then calculate your overall NPS score. Use NPS for periodic health checks and benchmarking customer sentiment.
- User Feedback: a blank canvas for custom question sets. Use this template when you need tailored questions for specific research goals, qualitative insights, or exploratory feedback.
- Rating: quick reaction surveys using stars, numbers, or emojis. Use Rating to measure satisfaction at key moments (post-purchase, after feature use, support interactions) without disrupting the user experience.
- Banner Survey: surveys displayed as banners within your product. Use Banner Survey for broad reach without blocking the user flow, such as general announcements or low-priority feedback requests.
- Tooltip Survey: contextual surveys attached to specific UI elements. Use Tooltip Survey to gather feedback about particular features or flows where users interact with them.
You can customize built-in templates after creation to match your needs.
## Creating templates
##### Create a template from existing content
1. Open any existing guide or survey.
2. Click the three-dot menu next to the *Save* button.
3. Click **Create a template** to copy the guide or survey as the base for your template.
New templates are hidden from non-admins by default, so you can polish them before releasing them to your team.
### Template visibility and management
When you edit a template, Amplitude displays a blue banner at the top of the page indicating that you're editing a template rather than a guide or survey.
## Building with templates
##### Using templates to create new content
1. Navigate to the *Create Guide* or *Create Survey* menu.
2. Your custom templates appear below the built-in Amplitude templates.
3. Select the template you want to use as your starting point.
4. Customize the content for your use case.
### Template best practices and tips
- Choose a theme before you release the template to your team. The template's theme applies to every new guide or survey created from it.
- Use clear naming. When you create a template, Amplitude appends "Template" to the name. When team members create guides or surveys from templates, Amplitude removes this suffix.
- Polish templates while they're hidden, before sharing them.
- Design templates with your team's common use cases in mind.
- Update templates as needed. Updates don't affect guides or surveys your team previously created from the template.
================================================================================
# Setup and Targeting
URL: https://amplitude.com/docs/guides-and-surveys/setup-and-target
================================================================================
# Setup and Targeting
Targeting controls which users receive your guide or survey. Triggering controls when and where it appears. Both settings live in the **Setup** tab in the builder.
## Targeting
Not every message is for every user. Targeting lets you define which users receive your guide or survey, and when. You can target either **All Users** or **Targeted Users**.
**All Users** targets every user who visits your site with this guide or survey.
**Targeted Users** lets you create segments of users to receive your guide or survey.
Each segment can filter by property or cohort, and can have multiple filters. For example, target your guide or survey to users from outside the United States who are new users within the last 30 days.
The property picker includes transformed user properties defined in [Amplitude Data](https://amplitude.com/docs/data/transformations) alongside standard user properties. Targeting on transformed properties ensures the users your guide or survey reaches match the same population you see in Analytics charts and cohorts, because both use the same transformation rules.
{% callout type="note" heading="Array user properties" %}
Guides and Surveys evaluates targeting rules during remote evaluation. The user property store that powers this evaluation flattens nested objects, but it doesn't flatten array-valued properties.
If you send a property as an array of objects (for example, `subscription: [{plan, state, length}]`), dotted paths like `subscription.plan` aren't available at evaluation time, even if those paths appear on user profiles in Analytics. Cart Analysis creates those dotted properties for Analytics, but they don't sync to the user property store that Guides and Surveys reads.
To target on array-derived values, set a flat scalar user property (for example, `subscription_plan: "enterprise"`) and target that property instead.
{% /callout %}
You can set both rollout percentage and bucketing unit for your user segments. For example, target 10% of a segment when you first publish a guide, then increase it to 100% after you confirm the engagement data.
{% callout type="note" heading="Using more than one segment" %}
When you add more than one segment to your targeting, Amplitude `OR`s each segment. This means that if a user belongs to _any_ segment, Amplitude shows them the guide or survey.
{% /callout %}
### First Seen timestamp
The targeting property picker includes a built-in **First Seen** property. Guides and Surveys pulls this timestamp from the Amplitude ID table during remote evaluation, so it's available even on a user's very first session.
Use First Seen instead of cohorts when targeting new users. Cohort membership updates with a delay, which means a cohort-based new-user filter doesn't match users on their first visit. First Seen evaluates in real time.
**Example: Target users who signed up today**
In your targeting segment, add a filter where **First Seen** is greater than or equal to today's date. Only users whose First Seen timestamp is today or later are eligible.
{% callout type="note" heading="Missed first login" %}
If a user doesn't visit a page where the guide appears on their first login, they remain eligible on future logins. Their First Seen timestamp doesn't change, so they continue to match the targeting condition.
{% /callout %}
### Bucketing units
The bucketing unit determines how Amplitude assigns users to receive your guide or survey when you use rollout percentages. Bucketing keeps the experience consistent across devices and sessions for the same entity.
#### Available bucketing units
| Bucketing unit | Behavior |
| ------------------------------------- | ----------------------------------------------------------------------------------------------------------------------------------------------------------------------------------------------------------------------------------------------------------------------------------------------------- |
| **User ID** | Buckets users by user ID. When a user logs in from different devices, they remain in the same bucket and receive a consistent experience. This is the default. |
| **Device ID** | Buckets users by device identifier. Each device receives an independent assignment, so the same user on different devices might have different experiences. |
| **Account ID** or **Organization ID** | Buckets users by a custom property like account ID or organization ID. Use this when all users in the same organization need the same experience. For example, if you test a feature with 50% of accounts, all users in a selected account see the feature, and all users in excluded accounts don't. |
#### Bucketing examples
**Example 1: User ID bucketing**
You set a 50% rollout with User ID bucketing. A user logs in on a laptop and receives the guide. After the user later logs in on a phone with the same user ID, the user continues to see the guide because bucketing is based on user ID.
**Example 2: Account ID bucketing**
You set a 50% rollout with Account ID bucketing (using a custom `account_id` property). Account "Acme Corp" with 10 users falls into the selected 50%. All 10 users from Acme Corp see the guide, regardless of device. All users from "Beta Inc" in the other 50% don't see the guide.
**Example 3: Device ID bucketing**
You set a 50% rollout with Device ID bucketing. A user's laptop falls into the selected 50% and receives the guide. The same user's phone falls into the other 50%, so the guide doesn't appear on the phone, even though both devices belong to the same user.
#### When to use each bucketing unit
- **User ID**: Use when you want consistent experiences for logged-in users across their devices.
- **Device ID**: Use for anonymous users or when device-specific targeting matters.
- **Account/Organization ID**: Use when all users in an organization need the same experience. This is useful for B2B products or organizational rollouts.
### Exclude a group of users
You may want to exclude a group of users from a specific guide or survey. For example, you might run a survey but exclude customers in the United States, or exclude internal users to receive responses only from actual customers.
You can exclude users at the cohort or segment level. The process is similar for both. This section focuses on excluding at the cohort level. Refer to [Cohorts](https://amplitude.com/docs/analytics/behavioral-cohorts) for more information about cohorts.
To exclude a cohort of users, set the `where` statement to `does not equal` the cohort you want to exclude.
### Send a link to a guide
Send users a link to your guide or survey to target them more directly. From the guide or survey builder, expand the menu next to the Save button, and select **Share link**.
In the modal:
- For web, copy the query parameter and append it to a page on your site that's instrumented with Guides and Surveys. When the recipient selects the link with the query parameter attached, the guide displays.
- For mobile, scan the QR code or open the share link URL on a device with your app installed. The guide displays in the app.
{% callout type="note" heading="User and page targeting" %}
When you send a direct link to a guide or survey, Amplitude overrides any audience or user targeting you set on the guide.
Amplitude doesn't override page targeting. To ensure the link works as expected, confirm the page you send can display the guide.
{% /callout %}
## Triggers
Triggers control when and where the experience appears.
Within the targeting card, select what events or interactions launch the experience, gate the experience to specific pages, and adjust the priority.
### When
Amplitude provides the following options to trigger an experience.
| Trigger | Description |
| ----------------------------------------------------- | ---------------------------------------------------------------------------------------------------------------------------------------------------------------------------------------------------------------------------------------------------------------------------------------------- |
| **None** | The experience doesn't appear by default. Select this option to launch the experience through the SDK, through a call to action (CTA) in another guide or survey, or through any other external trigger. |
| **Immediately** | The experience appears after the page loads. |
| **When element appears** | Launches the experience when a specified element appears on screen. Enter a CSS Selector or XPath path expression, or select **Test and Preview** to launch the visual selector. This trigger fires once per page load. Amplitude can't detect whether the element has reappeared or is still present, so the experience doesn't re-trigger if the element scrolls out of view and back in. |
| **When element clicked/tapped** | Launches the experience when the user interacts with the specified element. Enter a CSS Selector or XPath path expression, or select **Test and Preview** to launch the visual selector. |
| **After time on page/screen** | Specify a delay (in minutes or seconds) that a user must spend on the page before they receive the experience. |
| **Smart delay** | Shows the experience after the user completes their current task. |
| **Rage click/tap** | Shows the experience after a rage click by the user. Amplitude considers a rage click to be rapid successive clicking or tapping in the same location. |
| **User confusion** {% platform-tag platform="web" /%} | Shows the experience when Amplitude detects user confusion, as signaled by the user's mouse movement. |
| **On event tracked** | Shows the experience after the user triggers an event that you define. The event must fire client-side so the Guides and Surveys SDK can observe it. Guides and Surveys doesn't support [Labeled Events](https://amplitude.com/docs/data/visual-labeling) or [Custom events](https://amplitude.com/docs/data/custom-events) as triggers. |
| **After N events in session** | Shows the experience after the user triggers a specific event at least N times in the current session. Configure the event name and minimum count in the guide or survey builder. **Minimum SDK version required:** iOS/Android v3.7.0+, React Native v3.7.0+, Web (all versions). This is a breaking feature. Guides and surveys with this trigger type don't reach users on older mobile SDK versions. Go to the [changelog](https://amplitude.com/docs/guides-and-surveys/guides-and-surveys-mobile-sdk-changelog). |
{% callout type="tip" heading="Show on element click: use the SDK" %}
To show a guide or survey when a button or other element is clicked, the recommended approach is to set the trigger to **None** and call the [`.show` SDK method](https://amplitude.com/docs/sdks/guides-and-surveys/sdk#show) from the element's `onclick` handler. This gives you precise control over which experience appears and when.
{% /callout %}
#### Trigger delay
For any trigger option besides **Immediately**, you can configure a delay (in seconds) before the guide or survey fires. Use a delay to make timing less intrusive. For example, show a survey five seconds after a user selects **Checkout** rather than the instant they click.
Previously, only the **After time on page/screen** trigger supported a wait. Trigger delay extends that capability to event-based, element-based, and other non-immediate triggers.
##### How to configure
In the nudge editor, open the **Trigger** section. After you select a non-immediate trigger, a **Delay** field appears. Enter the number of seconds Amplitude waits before firing the guide or survey.
##### Behavior
- The delay countdown starts when the trigger condition first matches. If the user navigates away before the delay elapses, the guide or survey doesn't fire on the original page.
- Delay is per-trigger. Different triggers on the same nudge can use different delays.
- When you combine a delay with [conditional logic](https://amplitude.com/docs/guides-and-surveys/conditional-logic) (for example, "fire only when element X is visible"), Amplitude re-evaluates the condition at firing time, after the delay, rather than at trigger time.
##### Example
To show an NPS survey ten seconds after a `purchase_completed` event, set the trigger to **On event tracked** with the event `purchase_completed`, and set **Delay** to `10`.
{% callout type="note" heading="SDK requirement" %}
Trigger delay requires a recent version of the Engagement Browser SDK. Update to the latest SDK release to use this feature.
{% /callout %}
#### Session properties
Session properties add a layer of trigger targeting restrictions for guides and surveys. When a guide or survey triggers and has session property conditions, all configured session property conditions must match for the experience to display.
The SDK sets session properties dynamically using the `setSessionProperty` method, and they can change throughout a user's session. When a session property value changes, the SDK automatically evaluates whether any guides or surveys can now display, making session properties effective with the "Immediately" trigger.
Common use cases for session properties include:
- **User belongs to multiple orgs**: Control guide or survey visibility based on features of the user's current organization (`isFeatureEnabled: true`).
- **Progress tracking**: Show guides and surveys based on user progression (`onboardingStep: 3`).
- **Dynamic state that shouldn't persist as a user property**: React to real-time user behavior or application state.
{% callout type="note" heading="Feature availability" %}
Session properties are a feature-flagged capability. Contact Amplitude support to use this feature in your implementation.
{% /callout %}
### Where
Control whether your guide or survey displays on all pages, only specific pages, or excludes specific pages.
When you include or exclude specific pages, Amplitude accepts the following match types:
- URL matches
- URL/screen matches exactly
- URL/screen matches pattern
- URL/screen contains
- URL/screen starts with
- URL/screen ends with
- URL/screen matches regex
- Element CSS selector on page
#### Element CSS selector on page
Configure your guide or survey to display only when a specific DOM element appears on the page. Enter a CSS selector that identifies the target element. This match type evaluates when the trigger event fires.
You can use this rule for exclusion. For example: exclude pages where an element with the CSS selector `.class-foo` is on the page.
#### Page targeting rules can be combined
You can combine URL and element conditions using AND/OR logic. For example, you can display a guide when (a) URL contains `/checkout` AND (b) there's an element with `.payment-success` visible.
#### Project-wide default page exclusions
Set default page exclusions at the project level to apply them to every experience automatically. Configure defaults under *Project Settings > Guides and Surveys > Default page exclusions*. Individual experiences can extend the project-wide default rules by specifying their own include or exclude rules in the **Where** section of the builder.
The same URL match types listed above (`URL matches`, `URL contains`, `URL starts with`, and others) apply to project-wide default exclusion rules.
Use project-wide exclusions when your app has pages where experiences should never appear, such as checkout flows, password reset flows, or error pages. Configuring exclusions once at the project level avoids repeating the same rules on every experience and prevents experiences added later from appearing on those pages.
### Priority
Use priority to rank the importance of a guide or survey relative to others the user might encounter.
- Urgent
- High
- Medium
- Low
#### Tiebreakers when multiple guides are eligible for display
When more than one guide or survey is eligible for display at the same time, Amplitude uses these tiebreakers to decide which experience to show:
1. **Active before inactive**: Amplitude shows active guides or surveys before inactive ones.
2. **Priority**: Higher-priority experiences display first (Urgent > High > Medium > Low).
3. **Most recently seen**: If the user has seen one or more of the tied experiences before, Amplitude shows the experience the user saw most recently.
4. **Most recently created**: If the user hasn't seen either experience, or saw both at the same time, Amplitude shows the most recently created experience.
#### Prioritization table
{% early-access %}
The new **Prioritization** table lets you order guides and surveys *within* a specific priority, so you can set a distinct order for every guide and survey. Sub-priority replaces rules 3 and 4 in the tiebreakers above.
Sub-priority is specific to each platform. Use the platform filter at the top of the prioritization view to switch to a specific platform (for example, **Web**, **iOS**, or **Android**) and set priorities and sub-priorities independently for each.
Sub-priority is also specific to form factor. These are the form factor groupings:
- Modals, pins, and popovers
- Checklists
- Banners
{% callout type="note" heading="" %}
Priority is irrelevant for tooltips and embeds. Tooltips and embeds always render if the targeting, trigger, and limits criteria are all met. Amplitude can render multiple tooltips and embeds simultaneously.
{% /callout %}
{% /early-access %}
## Limits
Limits prevent users from receiving too much messaging.
| Limit | Description |
| --------------------------- | ------------------------------------------------------------------------------------------------------------------------------------------------------------------------------------------------------------------------------------------------------------------------------------------------------- |
| Stop showing when completed | Enabled by default. When disabled, the experience is eligible to trigger again through its [trigger](#triggers) for the [targeted users](#targeting) after the user completes it. To disable this option, you must also disable `Stop showing when dismissed`. |
| Stop showing when dismissed | Enabled by default. When disabled, the experience is eligible to trigger again through its [trigger](#triggers) for the [targeted users](#targeting) after the user dismisses it. |
| Cooldown | When enabled, limits how often the experience can trigger for a user. Amplitude ignores cooldowns when (a) the experience is [active](#active-state) or (b) the SDK, a button action, or a share link force-triggers it. To enable this option, disable `Stop showing when dismissed` first. |
## Localization
Localization lets you serve guides and surveys in different languages without creating a new guide or survey for each language. Refer to [Localization](https://amplitude.com/docs/guides-and-surveys/localization) for more details.
## Status
Statuses let you manage when your guide or survey displays.
| Status | Description |
| --------- | ------------------------------------------------------------------------------------------------------------------------------- |
| Draft | Lets you make changes to and test the experience, but the experience doesn't appear to users. |
| Testing | The guide or survey can display to [test users](https://amplitude.com/docs/guides-and-surveys/testing#testing-status-function). |
| Published | The guide or survey is live. Any changes you make to a published experience appear to users after you save the guide or survey. |
| Scheduled | Define start and end dates during which your experience appears. Start and end times use the timezone set on your project. |
### Bulk unpublish
To unpublish multiple guides or surveys at once, go to the Guides and Surveys list page, select the items you want to unpublish, and click **Unpublish**.
Common use cases include:
- Unpublishing all active experiences before a demo or test run.
- Unpublishing multiple versions of the same guide across different platforms at once.
## Settings
Access guide or survey settings through the gear icon at the top of the builder.
| Setting | Description |
| ------------------------------------------------------------- | ---------------------------------------------------------------------------------------------------------------------------------------------------------- |
| **Dismissable** | Gives users an option to dismiss the experience. |
| **Snoozable** {% platform-tag platform="web" /%} | Lets the user snooze the experience for the specified duration. |
| **Label** {% platform-tag platform="web" /%} | The snooze button's text. Only visible when Snoozable is enabled. |
| **Duration** {% platform-tag platform="web" /%} | How long the snooze lasts. The experience doesn't re-appear for the user until at least that much time has passed. Only visible when Snoozable is enabled. |
| **Snoozable on all steps** {% platform-tag platform="web" /%} | If disabled, the guide or survey's first step is the only step with a snooze option. Only visible when Snoozable is enabled. |
| **Show step counter** | Adds a step counter to each step in the guide or survey. For example, on a guide with five steps, the indicator `2/5` appears on the second step. |
## Active state
When a user first views a guide or survey, the guide or survey becomes "active". The guide or survey remains active until the user completes or dismisses it. For example:
- A user sees a guide or survey on your homepage.
- The user navigates to the contact page.
- The guide or survey remains active even though the trigger condition didn't fire. The guide or survey follows the user to the contact page.
When Amplitude temporarily hides a guide or survey, it doesn't show it to the user, but the guide or survey remains active. After the `temporarily hide if` conditions no longer apply, the active guide or survey is eligible for display again.
================================================================================
# Experiments
URL: https://amplitude.com/docs/guides-and-surveys/experiments
================================================================================
# Experiments
Run A/B and multi-armed bandit experiments on your guides and surveys with Amplitude Experiment so you can compare variants and ship the version that performs best. Install the [Guides and Surveys SDK](https://amplitude.com/docs/guides-and-surveys/sdk) before you run an experiment.
{% callout type="note" heading="Manager or Administrator role required" %}
Running an experiment on your guide or survey requires the Manager role at a minimum. For more information about how roles impact who can use Guides and Surveys, go to [Getting Started | Roles and Permissions](https://amplitude.com/docs/guides-and-surveys/get-started#roles-and-permissions).
{% /callout %}
## How experiments work in Guides and Surveys
Guides and Surveys experiments test whether showing a guide or survey affects user behavior:
- **Control**: Users in the control group don't see the guide or survey.
- **Variants**: Users in variant groups see the guide or survey you create.
For example, to run a 50-50 test on whether a guide improves feature adoption:
- Set the control to 50% (these users don't see the guide).
- Set variant A to 50% (these users see the guide).
This split lets you measure the impact of your guide or survey against a baseline of users who don't see it.
## Run an experiment
To add experimentation to your guide or survey, select **Add experiment**.
After you add an experiment, Guides and Surveys controls the experience, and Experiment controls user targeting and variant distribution based on the experiment type you choose.
### Choose an experiment type
Guides and Surveys offers two experiment types.
#### A/B test
Choose an A/B test to create two variants of the same guide. Amplitude decides the winner based on the data it receives. Access results the same way as any other Amplitude experiment.
#### Multi-armed bandit test
Choose a [Multi-armed Bandit](https://amplitude.com/docs/feature-experiment/workflow/multi-armed-bandit-experiments) test for a more dynamic approach. The system allocates more traffic to the higher-performing variant in real time, which helps you optimize faster.
### Configure variants
After you select an experiment type, Guides and Surveys adds a control and two variants with autogenerated keys. The control serves as your baseline for measuring impact, and you can create multiple variants to test different versions of content or design.
To rename a variant, select it and click *More options*. From this menu, update the name, duplicate, or delete the variant.
{% callout type="warning" heading="Complete experiment setup" %}
Adding variants is only the first part of experimentation in Guides and Surveys. To ensure users experience variants as they should:
1. Make sure the experiment is running. Define a goal, review targeting, and click *Start Experiment*. For more information, go to [Manage the experiment](#manage-the-experiment).
2. If a specific user doesn't experience a variant, ensure the user is part of the experiment's target audience.
3. If a user sees one variant, they should continue to receive that variant. Navigate to *Users > User Profiles*. Search for the user and open their profile. Go to the *Guide* and *Survey* tabs to view which experiences the user has seen.
{% /callout %}
### Manage the experiment
Click *Manage Experiment* to open the experiment editor in a new tab. The experiment takes the name of your guide or survey, and contains any variants you added.
{% callout type="note" heading="Updating variants" %}
Variant names stay in sync between your guide or survey and the experiment when you save the guide or survey.
{% /callout %}
For more information about working with experiments, go to [Feature Experiment](https://amplitude.com/docs/feature-experiment/overview)
{% callout type="tip" heading="Exposures and assignments" %}
Exposure events in Guides and Surveys experiments work similarly to a standard experiment. However, some cases can cause an uneven split between control and variant exposures. The targets and limits you set affect how often treatment exposures occur.
Consider the following example:
Amplitude assigns User A to the control, and User B to the treatment.
- If Amplitude serves **User B** another guide or survey that blocks the display of the treatment, no exposure event fires. The exposure event fires only when User B sees the treatment.
- If the same scenario occurs for **User A** in the control group, the exposure event fires because User A doesn't receive the relevant guide, which is expected for the control group.
{% /callout %}
### End the experiment
To end the experiment, navigate to the experiment's configuration page, click *Stop Experiment*, and choose one of the following options:
- **Complete experiment**: Declare a winner. If one of the variants is the winner, Amplitude archives the losing variant and publishes the winning variant. If you select the control as the winner, the experiment returns to its initial state and sets the control rollout to 100%, which means no users see the guide or survey.
- **Continue running experiment**: The experiment remains live so you can collect more data.
## Insights
The Insights tab is the dashboard where you track how users engage with your guide or survey. Monitor trends in views and completions over time, and track how different variants perform relative to one another.
### Time-based analysis
Track guide and survey engagement trends over predefined time periods:
* Hourly
* Daily
* Weekly
* Monthly
* Quarterly
Use these presets to find when users are most likely to engage with the guide or survey, and whether engagement changes after a new product release.
#### Date range selection
Select a predefined range based on the unit of time, or click the calendar icon to define your own range. Choose from:
* Rolling window (`Last # complete days and today`)
* Since date
* Between dates
Use the advanced settings to:
* Add a date offset to a rolling window
* Exclude Today
* Enable Time Range
### Performance overview
The top chart on the Insights tab is the Performance Overview. Amplitude displays high-level metrics that track how your guide or survey is performing:
| Metric | Description |
| -------------------------- | --------------------------------------------------------------------------------------------- |
| Guides / Surveys viewed | The number of times the guide or survey was shown to users. |
| Guides / Surveys completed | The number of times the guide or survey was completed by users. |
| Trend graph | Tracks the view or completion count over the time range specified in the date range selector. |
================================================================================
# Testing and Publishing
URL: https://amplitude.com/docs/guides-and-surveys/testing
================================================================================
# Testing and Publishing
Amplitude lets you test your guides and surveys before publishing them. Testing confirms the setup and the behavior match your expectations.
There are two ways to test your guides and surveys:
- Preview mode: a quick first check to see how your guide or survey looks and confirm your setup.
- Testing status: a live test with specific users before launch.
## Preview mode
Preview mode confirms that your guides and surveys behave as expected. To check only the look of a guide or survey, open it in Amplitude. To confirm runtime behavior, test it in preview mode.
Amplitude recommends a thorough test before launch to confirm:
- Button actions behave as you intend.
- Multi-step guides and surveys have the right pace.
- Pins and tooltips appear where they should.
{% callout type="note" heading="Multi-page displays" %}
A known issue in Preview mode causes multi-page guides or surveys to display incorrectly in multi-page apps. This issue affects Preview mode only, not the published guide or survey.
{% /callout %}
To open Preview mode from the builder:
1. Open a guide or survey.
2. Click **Preview**.
3. For web, enter the URL of the page with the [Guides and Surveys SDK](https://amplitude.com/docs/guides-and-surveys/sdk) installed. For mobile, scan the QR code or open the preview URL.
4. Amplitude verifies that the SDK is available. For web, the URL opens in a new tab with the preview bar visible. For mobile, the preview opens in the app with the preview bar displayed.
By default, the preview window stays open until you close it. Disable **Don't automatically close the preview window** if you want the window to close after 10 seconds of waiting for app.amplitude.com to communicate with the G&S SDK in your application.
### Edit a guide or survey in Preview mode
You can change a guide or survey while you preview it, without switching back to the builder. Edits apply to both the dashboard and the preview as soon as you save, which speeds up position-heavy work like card embeds.
1. Open a guide or survey in Preview mode.
2. In the preview bar, click **Edit**.
3. Change the form factor, position, or other [properties](https://amplitude.com/docs/guides-and-surveys/form-factors#properties).
4. Click **Save**.
Amplitude applies your changes to the dashboard and the preview right away. This works for both anchored guides, such as pins, and non-anchored form factors, such as banners, modals, checklists, and popovers.
### Test User mode
{% callout type="info" heading="Mobile only" %}
Available on mobile only.
{% /callout %}
Test User mode lets you preview and debug guides and surveys on a real device without affecting your production analytics. The SDK treats users in Test User mode differently from regular users, so guides and surveys don't render the same way they do for everyone else.
Use Test User mode when you're doing one of the following:
- Installing the Amplitude SDK.
- Reproducing a reported issue.
- Verifying that a guide or survey triggers correctly.
Navigate to _Project Settings > Guides and Surveys_ to configure Test User mode.
Turn it off after you finish debugging. Leaving devices or accounts in Test User mode long-term can create confusion about expected rendering behavior.
### Conditions checked in preview mode
The preview bar shows the status of the three conditions Amplitude uses to decide whether to show the guide or survey:
- Trigger
- Limit
- Throttle
### Condition status
Each condition has three possible statuses:
| Status | Description |
| ------ | -------------------------------------------------------------------- |
| Green | The condition is passed, and ready to display the guide or survey. |
| Yellow | The condition isn't passed, and the guide or survey doesn't display. |
| Blue | The condition is pending or bypassed. |
### How preview mode works
Preview mode uses browser messaging to communicate between the Amplitude dashboard and your application. When you start a preview:
1. The Amplitude dashboard opens your application URL in a new tab.
2. The dashboard waits about 10 seconds for a message from the Guides and Surveys SDK running on your page.
3. If the SDK sends a message, the dashboard responds with preview information, including the guide or survey ID.
4. The SDK receives the preview information and displays the preview.
This communication relies on the browser's `window.postMessage` API to pass messages between the dashboard and your application.
### Troubleshooting preview mode
Sometimes the guide or survey doesn't appear in preview. If the instrumentation is correct, check the following:
{% callout type="tip" %}
Use the [Amplitude Chrome extension](https://amplitude.com/docs/data/chrome-extension-debug) to debug Guides & Surveys setup and troubleshoot why guides or surveys aren't showing. The extension's Guides & Surveys tab shows SDK setup status, trigger conditions, and lets you test event-based triggers.
{% /callout %}
- Confirm the preview user hasn't already seen the guide or survey. If the user has seen it, the preview bar shows a yellow (warning) status for the **Limit** condition. Hover over the condition and click **Reset User History**.
- Confirm the throttle limit isn't reached. If the limit is reached, the Throttle condition shows yellow (warning) status. Hover over the condition and toggle **Ignore Throttle Limits**.
- If the trigger condition is **On event tracked**, confirm the event fires. If the event hasn't fired, the Trigger condition shows blue status. Hover over the Trigger condition and click **Manually trigger event**.
#### No error message but preview doesn't appear
If the Amplitude dashboard shows no error but the preview doesn't appear:
- The dashboard received the initial message from your SDK.
- The SDK isn't receiving the response message from the dashboard.
To troubleshoot:
- Check your browser console for errors related to message passing.
- Verify that no browser extensions or security settings block cross-window messaging.
- Confirm the **Don't automatically close the preview window** option in the preview modal is enabled (default) to keep the window open for debugging.
#### Error message and preview doesn't appear
If the Amplitude dashboard displays an error after about 10 seconds, the dashboard didn't receive a message from the SDK. The cause is one of:
- The SDK isn't loading on your page.
- The SDK can't communicate with the dashboard.
To troubleshoot:
- Verify the SDK is installed correctly using `window.engagement` in your browser console.
- Confirm the **Don't automatically close the preview window** option is enabled (default) to extend the waiting time beyond 10 seconds.
- Confirm your application URL is correct and accessible.
#### Known issue: Cross-Origin-Opener-Policy header
If your application sets the `Cross-Origin-Opener-Policy` (COOP) header to `same-origin`, the COOP header prevents message passing between the Amplitude dashboard and your application, which blocks preview mode.
To resolve, either:
- Set the COOP header to `same-origin-allow-popups` instead of `same-origin`.
- Temporarily disable the COOP header for testing.
For more information about the COOP header, refer to the [MDN documentation](https://developer.mozilla.org/en-US/docs/Web/HTTP/Headers/Cross-Origin-Opener-Policy).
{% callout type="note" heading="Clear user history" %}
Amplitude keeps a record of the guides and surveys your users encounter. To remove a guide or survey from a user's history:
1. Open the user's profile in Amplitude.
2. Navigate to the Guides or Surveys tab.
3. Find the guide or survey to remove.
4. In the corresponding row, click the ellipsis menu and select **Clear history**.
{% /callout %}
## Testing status function
Preview mode approximates how your guide or survey appears to users. To test in a live environment, use the [**Testing** status](https://amplitude.com/docs/guides-and-surveys/setup-and-target#status) to test your guide or survey with specific users without affecting your broader audience.
When you set a guide or survey to Testing status:
- All specified test users (device IDs, user IDs, or cohorts) are eligible to see the guide or survey.
- Amplitude ignores limits to make testing easier.
- The guide or survey remains hidden from your production users.
{% callout type="note" heading="Test users in production" %}
Test users continue to receive the guide or survey when you update its status to **Published** or **Scheduled**. This allows for smooth transitions from testing to production.
{% /callout %}
##### To use the Testing status:
1. Open your guide or survey.
2. In the **Test users** section, specify your test users using device IDs, user IDs, or cohorts.
3. Change status to **Testing**.
## Publishing
After you finish editing and testing your guide or survey, click **Publish** in the builder to release the guide or survey to your users.
After you publish a guide, you can still make changes. Amplitude saves the changes as "unpublished" until you click **Publish** to explicitly publish them.
The dashboard's preview pane and Preview mode both show your guide or survey, including any unpublished changes. Use the version history to see how many changes you made since you last published.
================================================================================
# Throttling
URL: https://amplitude.com/docs/guides-and-surveys/throttling
================================================================================
# Throttling
Throttling limits how often Amplitude shows guides and surveys to the same user. Set a global cap on how many appear in a day, week, month, or session, add a delay between sequential guides, and layer per-tag advanced throttles for finer control.
Use throttling to slow message frequency over time. If you need to make sure a user sees only one message from a specific set (for example, a cross-app announcement), configure [mutual exclusivity](#mutual-exclusivity) instead.
Throttling works identically for guides and surveys, but the settings for each are separate. Separate settings give you more flexibility over how guides and surveys appear. To exclude specific pages from all guides and surveys, set [project-wide default page exclusions](https://amplitude.com/docs/guides-and-surveys/setup-and-target#project-wide-default-page-exclusions).
{% callout type="tip" heading="" %}
Your throttling settings apply globally to all guides or surveys in the list. You can further specify how and when your guides or surveys appear by modifying the Limits section for each guide or survey.
{% /callout %}
## Built-in display limits
Amplitude has built-in limits that control how many guides and surveys display at the same time. These limits prevent users from seeing too many messages at once:
- **Tooltips**
- **Display Limit**: Unlimited
- **Behavior**: Multiple tooltips can display at the same time.
- **Pins, Popovers, Modals**
- **Display Limit**: One at a time
- **Behavior**: Only one pin, popover, or modal displays at a time. When one of these form factors is already showing and another triggers, the first continues to show and the second doesn't display.
- **Checklists** {% platform-tag platform="web" /%}
- **Display Limit**: One at a time
- **Behavior**: When a checklist is already showing and another triggers, the first continues to show and the second doesn't display.
- **Banners**
- **Display Limit**: One at a time
- **Behavior**: When a banner is already showing and another triggers, the first continues to show and the second doesn't display.
{% callout type="note" heading="Checklists can display with other form factors" %}
Checklists can display at the same time as pins, popovers, or modals. Priority doesn't affect this behavior. For example, when a high-priority modal is already showing and a low-priority checklist triggers, both display at the same time.
{% /callout %}
### Example scenarios
**Multiple checklists triggered:** When checklist B triggers while checklist A is already showing, checklist A continues to show and checklist B doesn't display.
**Pin and modal:** When a modal is showing and a pin triggers, the modal continues to show and the pin doesn't display. This rule applies to any combination of pins, popovers, and modals.
**Checklist and modal together:** When a modal is showing and a checklist triggers, both display at the same time, regardless of priority settings.
**Pin and tooltip together:** A pin can display while multiple tooltips are visible, because tooltips have no display limit.
### Set throttling for Guides or Surveys
1. Go to _Guides and Surveys_ and then select either _Guides_ or _Surveys_.
2. Click the **Settings** icon for the list of artifacts.
3. Turn throttling **On**.
4. Set the throttling. You can set:
- **Limit**: The number of guides or surveys that appear.
- **Period**: The rate of time in which the maximum limit of guides or surveys can appear. Time periods can be:
- Day
- Week
- Month
- Session
5. Click **Save Changes**.
## Time between guides
Control the delay between sequential guides for the same user. A delay prevents users from seeing multiple guides in quick succession.
### Set the time between sequential guides
1. Go to _Guides and Surveys_ and then select either _Guides_ or _Surveys_.
2. Click the **Settings** icon for the list of artifacts.
3. In the Time Between section, enter the delay period.
4. Select the time unit from the dropdown:
- Minute
- Hour
- Day
5. Click **Save Changes**.
{% callout type="tip" heading="" %}
This setting applies to sequential guides for the same user. For example, a setting of "10 minutes" ensures that after a user sees one guide, they don't see another guide for at least 10 minutes.
{% /callout %}
## Advanced throttles
Advanced throttles set additional rate limits for guides or surveys grouped by tags. Tag-based throttles give you granular control over how different categories of content appear to users.
{% callout type="note" heading="Prerequisites" %}
Before you use advanced throttles, apply [tags](https://amplitude.com/docs/guides-and-surveys/tags) to your guides and surveys. Tags aren't required, but Amplitude recommends them because advanced throttling uses tags to create rate limits for different types of guides.
{% /callout %}
### Configure advanced throttles
1. Go to _Guides and Surveys_ and then select either _Guides_ or _Surveys_.
2. Click the **Settings** icon for the list of artifacts.
3. In the Advanced Throttles section, click **Add throttle**.
4. Configure your advanced throttle:
- **Limit**: The maximum number of guides/surveys for this tag group.
- **Tags**: Select one or more tags to group guides/surveys.
- **Period**: Choose the time period (Day/Week/Month/Session).
5. Click **Save Changes**.
### Advanced throttle examples
**Campaign throttling**: Limit `product-launch` tagged guides to three (3) for each day.
**Feature throttling**: Limit `onboarding` tagged content to five (5) for each session.
**Team coordination**: Limit `growth-team` guides to two (2) for each week.
{% callout type="tip" heading="" %}
Advanced throttles work alongside your global throttling settings. The most restrictive limit applies. For example, when global throttling allows 10 guides each day but an advanced throttle limits `onboarding` guides to two (2) each day, users receive at most two (2) onboarding guides each day.
{% /callout %}
### Multiple advanced throttles
Create multiple advanced throttles for different tag combinations to support detailed throttling strategies:
- **Urgent announcements**: `urgent` + `announcement` tags - 1 each day
- **Onboarding flow**: `onboarding` tag - 3 each session
- **Feature updates**: `feature-update` tag - 2 each week
## Mutual exclusivity
Mutual exclusivity groups guides and surveys so that each user sees only one item from the group. Use mutual exclusivity for multi-app announcements where users should see a message only once, regardless of which app they use.
### Multi-app use case
When you release a feature across multiple apps (web, iOS, and Android), announce the feature to users on whichever app they use first, without showing the same announcement again on other apps. Mutual exclusivity solves this by linking app-specific guides together.
For example, when you create:
- A web guide announcing a new feature.
- An iOS guide with the same announcement.
- An Android guide with the same announcement.
Add all three guides to a mutual exclusivity group. After a user sees the web guide, they don't see the iOS or Android versions later, even if they switch apps.
### Prevent popup fatigue
Mutual exclusivity also helps prevent popup fatigue for users who qualify for multiple similar guides. When you have several guides targeting overlapping audiences, group them so users see only the most relevant one.
### Create a mutual exclusivity group
1. Go to _Guides and Surveys_ and then select either _Guides_ or _Surveys_.
2. Click the **Settings** icon for the list of artifacts.
3. Expand the **Mutual exclusivity** section.
4. Click **Add group** to create a new mutual exclusivity group.
5. Give the group a name (for example, "Feature X Announcement").
6. Select the guides or surveys to include in the group.
7. Click **Save Changes**.
{% callout type="note" heading="" %}
Mutual exclusivity works across apps. After a user sees any guide or survey from the group on one app, they don't see other items from that group on any app.
{% /callout %}
### Mutual exclusivity and throttling
Mutual exclusivity and throttling serve different purposes but work together:
- **Throttling** limits how many guides or surveys a user sees over time.
- **Mutual exclusivity** ensures a user sees only one item from a specific group.
Apply both settings to the same guide. For example, a guide can belong to a mutual exclusivity group and also follow global throttling limits.
================================================================================
# Tags
URL: https://amplitude.com/docs/guides-and-surveys/tags
================================================================================
# Tags
Tags are custom labels that help you organize, search, and coordinate guides and surveys across teams.
## Key benefits
- **Better organization**: Group related guides and surveys together.
- **Improved searchability**: Find specific content using tag filters.
- **Team coordination**: Help teams manage their guides and surveys.
- **Bulk management**: Apply changes to multiple guides or surveys at once.
- **Event tracking**: Tags are automatically included as a property on all guide and survey events.
## Adding tags
##### Add tags to an individual guide or survey
1. In the guide or survey editor, click the Tags control under the title.
2. Select an existing tag, or enter a new one.
##### Add existing tags to multiple guides or surveys
1. From the list view, select the guides or surveys to which you want to apply a tag.
2. Click **Assign Tags** in the table header.
3. Select the tags you want to apply.
### Tag naming best practices
- Use descriptive, consistent names (for example, `onboarding`, `feature-announcement`, `user-feedback`)
- Keep tags concise but meaningful
- Use lowercase with hyphens for multi-word tags
- Establish naming conventions across your team
### Renaming tags and editing description
To rename a tag or update its description:
1. Go to the guides list view or surveys list view.
2. Enable the Tags column in table settings.
3. Hover over a cell in the Tags column and click edit.
4. Click the edit icon and update the name, description, or both.
5. Save.
The tag updates across all guides and surveys where it's used.
### Tag best practices for organization
Define a tag system that fits your team. For example:
- **Campaign tags**: Use tags like `spring-campaign`, `product-launch` for time-bound initiatives.
- **Feature tags**: Tag content related to specific features (for example, `analytics`, `billing`, `onboarding`).
- **Team tags**: Identify ownership with tags like `growth-team`, `product-team`.
## Searching and filtering by tags
1. Go to the Guides or Surveys list view.
2. Make sure the Tags column is visible.
3. Click **Add Filter** and select **Tags**.
4. Choose one or more tags from the available options.
The list updates to show only guides with the selected tags.
### Advanced filtering
Combine tag filters with other filters. For example, apply a team tag and a feature tag together to narrow results to a specific guide.
## Bulk operations with tags
From the guides list view or surveys list view, you can select multiple rows and bulk-apply tag updates.
## Tags and throttling
Tags drive [advanced throttling](https://amplitude.com/docs/guides-and-surveys/throttling#advanced-throttles). Use tags to define rate-limiting strategies for different categories of guides and surveys.
### Throttling use cases with tags
- **Campaign management**: Use campaign tags like `spring-launch` to limit promotional guides.
- **User journey stages**: Use tags like `onboarding`, `activation`, `retention` to control flow progression.
- **Content priority**: Use priority tags like `critical`, `important`, `optional` with different throttle limits.
{% callout type="tip" heading="" %}
Plan your tag strategy with throttling in mind. Consistent, meaningful tags make advanced throttling more effective and easier to manage.
{% /callout %}
For detailed setup instructions, refer to [Advanced Throttles](https://amplitude.com/docs/guides-and-surveys/throttling#advanced-throttles).
================================================================================
# Notifications
URL: https://amplitude.com/docs/guides-and-surveys/notifications
================================================================================
# Notifications
Set up notification alerts for your surveys in Guides and Surveys. When someone submits a survey response, Amplitude can send a notification to a Slack channel, email, or a webhook so your team stays informed in real time.
This page covers creating and managing notification alerts through the Guides and Surveys project settings. To connect your Slack workspace to Amplitude, refer to [Integrate Slack](https://amplitude.com/docs/analytics/integrate-slack).
For Microsoft Teams, send notifications to a [Teams webhook](https://support.microsoft.com/en-us/office/create-incoming-webhooks-with-workflows-for-microsoft-teams-8ae491c7-0394-4861-ba59-055e33f75498). For Google Chat, send notifications through a [webhook](https://docs.cloud.google.com/workflows/docs/notify-google-chat).
{% callout type="note" heading="Guides and Surveys permissions*" %}
You must have Guides and Surveys project settings permissions to create, edit, or delete notification alerts. To receive notifications, you only need to be a member of the Slack channel, on the email list, or the webhook endpoint. Contact your Admin if you need different permissions.
{% /callout %}
## Connect a Slack workspace
Connect your Slack workspace to Amplitude before you send alerts to a Slack channel.
##### To connect a Slack workspace to your survey notifications
1. Go to *Settings > Projects*, select your project, then click **Guides & Surveys**.
2. Expand the **Alerts** card.
3. Click **Connect To Slack**.
4. Click **Allow** to confirm that you want to connect Amplitude to Slack.
{% callout type="note" heading="" %}
If a Slack channel ID appears instead of the channel name, confirm that Amplitude is connected to your Slack workspace. If the workspace is connected, confirm that you are a member of the Slack channel. Contact the person who created the alert to add you to the channel.
{% /callout %}
## What triggers an alert
You receive an alert when a customer submits a response to any active survey that matches the alert's scope.
## Set up an alert
Create an alert to send notifications to Slack, email, or a webhook when someone submits a survey response.
##### To set up an alert
1. Go to *Settings > Projects*, select your project, then click **Guides & Surveys**. You can also click the bell icon on the *Guides & Surveys* list page and choose **Add Alert**.
2. Expand the **Alerts** card and click **Add Alert**.
3. Set the scope. Select one of:
- **All in Project**: Receive notifications for all survey responses in the project.
- **By Tag**: Receive notifications only for surveys with a specific tag.
- **By Survey**: Receive notifications for a single survey.
4. Choose how you want to receive your notifications:
- For Slack, click the dropdown to choose the channel for your alerts.
- For email, enter the email addresses you want to receive notifications.
- For a webhook, enter the URL and your signing key.
5. Name your alert.
6. Click **Create Alert**.
================================================================================
# Duplicating Across Projects and Platforms
URL: https://amplitude.com/docs/guides-and-surveys/duplicating-guides-and-surveys-across-projects
================================================================================
# Duplicating Across Projects and Platforms
Your organization may have multiple projects for different reasons. For example, you may use separate projects to differentiate between environments (such as staging and production) or between geolocations. Duplicating a guide, survey, or theme across projects or platforms saves you from recreating the same content for each environment or app, which saves time and encourages consistency.
{% callout type="note" heading="Duplication in Experiments" %}
You can't duplicate a guide or survey across your projects if it's part of an experiment. If you want the same guide or survey in experiments in multiple projects, you must manually recreate it.
{% /callout %}
When you duplicate a guide, survey, or theme to a new project, the new project treats the duplicated content as a new entity. Amplitude doesn't copy previous analytics to the new project. To move a guide, survey, or theme from one project to another, copy it to the destination project, then archive it from the originating project.
## Duplicate across projects
### Duplicate a guide or survey across projects
1. Navigate to *Guides and Surveys > Guides* or *Guides and Surveys > Surveys*.
2. Click the **three-dot** menu for the guide or survey you want to duplicate.
3. Click **Duplicate across projects**.
4. Click the **Destination** dropdown and select the target project or projects.
5. Select which of the following elements to duplicate:
- Targeting setup
- Trigger setup
- Limits setup
- Theme
- Translations
6. Click **Duplicate**.
### Duplicate a theme across projects
1. Navigate to *Guides and Surveys > Themes*.
2. Click the **three-dot** menu for the theme you want to duplicate.
3. Click **Duplicate across projects**.
4. Click the **Destination** dropdown and select the target project or projects.
5. Click **Duplicate**.
### Re-duplicate a guide, survey, or theme
If you duplicate a guide, survey, or theme to a project that already contains the duplicated content, Amplitude overwrites the content in the target project.
For example, you create a guide (Guide-1) in Project A and duplicate it to Project B. You then make changes to Guide-1 in Project A and want to re-duplicate it to Project B. Amplitude overwrites the original Guide-1 in Project B with the newest version. Amplitude doesn't keep both versions of Guide-1.
When you select the target project, Amplitude applies a badge to show whether the content you're duplicating is new for that project or already exists there. Click into the **Preview changes** section for more information.
## Duplicate across platforms
When you want the same guide or survey on multiple apps (for example, web, iOS, and Android), duplicate it to another platform instead of rebuilding it. When you select **Duplicate** and have multiple platforms configured, Amplitude shows a platform selection modal.
### Duplicate a guide or survey across platforms
1. Navigate to *Guides and Surveys > Guides* or *Guides and Surveys > Surveys*.
2. Click the **three-dot** menu for the guide or survey you want to duplicate.
3. Click **Duplicate**.
4. In the platform selection modal, select the destination platform or platforms.
5. Click **Duplicate**.
{% callout type="note" heading="" %}
The platform selection modal only appears if you have multiple platforms configured. If you have a single platform, Amplitude duplicates the guide or survey without a platform selection step.
{% /callout %}
================================================================================
# Themes
URL: https://amplitude.com/docs/guides-and-surveys/themes
================================================================================
# Themes
Guides and Surveys should match your branding and feel like part of your product. Themes give you control over the appearance of your guides and surveys.
Themes ensure that every in-product message matches your colors, typography, and aesthetic. A subtle guide or a full-page survey should look and feel like an extension of your product, not a random popup.
You control how users view guides and surveys, from buttons to borders and animations to background colors.
{% callout type="note" heading="Themes differ by platform" %}
Guides and surveys on web and mobile have different themes. Themes aren't compatible across platforms.
{% /callout %}
## Create a new theme
To create a new Guides and Surveys theme:
1. In Amplitude, go to _Guides and Surveys > Theme_.
2. Click **Create Theme**. The Theme editor appears.
3. Customize your theme with the [Brand](#brand-controls) and [Component](#component-editor) controls.
4. Click **Save** at any time to save your progress.
5. Click **Publish** to enable your theme for selection by a guide or survey.
{% callout type="note" heading="Updating a theme" %}
When you publish an update to an existing theme, the updates apply to any guide or survey that uses that theme.
{% /callout %}
{% callout type="tip" heading="Customize a specific guide or survey" %}
To customize the theme for a single guide or survey without affecting others, use the **Customize only this guide** or **Customize only this survey** option in the guide or survey editor. This option creates a unique theme version for that specific experience, so you can make one-off customizations without changing the base theme.
{% /callout %}
## Create a theme with Global Agent
Amplitude's [Global Agent](https://amplitude.com/docs/amplitude-ai/global-agent-overview) can generate a Guides and Surveys theme from a natural-language description, a reference image, or both. The result is a fully editable theme you can refine in the theme editor.
Global Agent generates both brand-level and component-level theme settings, including colors, typography, spacing, button styles, form controls, cards, widget dimensions, and component-level overrides. You can adjust any generated setting in the theme editor after creation.
{% callout type="note" heading="Availability" %}
This feature isn't available in the EU data center.
{% /callout %}
### Generate a theme
1. Open Global Agent from anywhere in the Amplitude dashboard, or click **Create Theme** on the _Guides and Surveys > Theme_ page.
2. Describe the theme you want. For example: "Use our marketing site palette: navy primary, coral accent, rounded corners on buttons and inputs." You can also attach a screenshot or Figma export as a visual reference.
3. Global Agent generates the theme and returns a link to it. Click the link to open the theme in the theme editor.
4. Review the generated settings. Adjust any brand or component values, then click **Publish** to make the theme available.
{% callout type="tip" heading="Tips for better results" %}
Include specific details in your description — brand colors (hex values), corner radius preferences, font names, and spacing guidelines produce more accurate themes. Attaching a screenshot of your product or a Figma mockup helps Global Agent match your visual style.
{% /callout %}
### What Global Agent doesn't generate
Global Agent doesn't generate animations or custom CSS. Configure animations in the [theme editor](#animations) and add custom CSS through [Custom CSS](https://amplitude.com/docs/guides-and-surveys/custom-css).
## Manage themes
The _Guides and Surveys > Theme_ page lists every theme in your project. Filter the list with the tabs at the top of the page to manage a large set of themes:
- **Active**: themes that a guide or survey uses.
- **Inactive**: themes that no guide or survey uses.
- **Archived**: themes you've archived.
- **All**: every theme, regardless of status.
To find a specific theme, use the **Search themes** box.
### Archive a theme
Archive a theme you no longer need to remove it from your **Active** and **Inactive** lists. Archiving doesn't change the guides or surveys that already use the theme.
1. In Amplitude, go to _Guides and Surveys > Theme_.
2. Find the theme you want to archive.
3. Open the theme's context menu, then select **Archive**.
### Restore a theme
Themes work the same as guides and surveys: archiving a theme isn't permanent, so you can restore it later. Restore an archived theme to make it available to guides and surveys again.
1. In Amplitude, go to _Guides and Surveys > Theme_.
2. Select the **Archived** or **All** tab.
3. Open the archived theme's context menu, then select **Restore**.
## Theme viewer
The Theme Viewer shows how the theme appears when applied to a guide or survey. When editing a theme, choose the specific guide or survey you want to preview to see how changes affect your real-world content.
Theme previews look different depending on where you preview them. When you build a guide or survey, theme previews show the published version. When editing themes, previews display draft changes and let you choose a guide or survey to preview against. This behavior helps ensure consistency between what you see when building guides and what your users experience in your product.
At the top of the viewer, toggle between the [brand](#brand-controls) and [component](#component-editor) editors, toggle between light and dark mode, and cancel, save, or publish your changes.
## Brand controls
Use the Theme Editor to customize elements of your brand and style.
{% callout type="tip" heading="CSS properties" %}
{.inline .my-0} Configure your branding using the same values you defined in your site's CSS. For example, specify font size in px, em, rem, or percent values.
{% /callout %}
### Accent
Accent represents your brand's primary color. This color appears on primary buttons and selected options.
In this example, the primary color is `#48705C`.
### Typography
Set the default typeface of your theme. Choose from the [Google font library](https://fonts.google.com/), or specify a custom typeface you've already defined on your site.
To use a font natively in your mobile Guides and Surveys, include the full font family in your app project and use a consistent file name for the font.
#### Android
- Place font files in the `/res/font` directory of your project.
- Use a clear and consistent naming convention:
- `[fontNameWithoutSpaces]_[style].[fileExtension]`
- For example: `adventpro_italic.ttf`
- Supported formats: **TTF**, **TTC**, **OTF**, and **XML**.
- After you add the font, you can reference it directly in your theme setup.
For more information, go to Android's [Font resources](https://developer.android.com/guide/topics/resources/font-resource).
#### iOS
- Add font files to your Xcode project.
- Use a clear and consistent naming convention:
- `[FontName]-[Style].[fileExtension]`
- For example: `Lora-Italic.ttf`
- Register the fonts in your app's `.plist` file.
- Alternatively, register fonts programmatically with Core Text using [`CTFontManagerRegisterFontsForURL`](https://developer.apple.com/documentation/coretext/ctfontmanagerregisterfontsforurl(_:_:_:)). In your theme setup, use the font's PostScript name (for example, `Lora-Italic`).
- Supported formats: **TTF**, **OTF**.
For more information, go to Apple's [Adding a custom font to your app](https://developer.apple.com/documentation/uikit/adding-a-custom-font-to-your-app).
{% callout type="note" heading="Font previews" %}
Custom fonts that aren't part of Google Fonts don't appear in the theme preview.
{% /callout %}
### Content
Define the supplementary colors that complete your brand's palette.
- Primary color
- Secondary color
- Disabled color
- Link color
- Link hover color
- Link visited color
- Highlight color
### Border
Specify the color of element borders in each of the following states:
- Primary color
- Primary hover color
- Disabled color
### Background
Update the background color of elements in the specified state.
Set each of the following background variants:
- Primary color
- Primary hover color
- Secondary color
- Secondary hover color
- Disabled color
### Form controls
Customize the appearance of the interactive elements in your guides or surveys.
Adjust the following, which apply to all form elements:
- Height
- Corner radius
- Padding
- Gaps
- Shadow
- Shadow color
- Background
- Active background
- Focus ring color
- Focus ring width
### Cards
Specify how individual cards display on screen. Adjust the following settings, which apply to all cards:
- Corner radius
- Padding
- Gaps
- Shadow
- Shadow color
### Widget dimensions
Specify the maximum dimensions for each type of widget.
| Widget | Available dimension |
| ------------- | ------------------------------------------------------------ |
| Modal | Max content width for modals and mobile carousels on tablets |
| Popover / pin | Max content width for pins |
| Tooltip | Max width for tooltips |
| Checklist | Max width and max height for checklists |
### Animations
Select the animation that each widget type uses to appear on screen, along with duration (in milliseconds) where applicable.
## Component editor
Components are reusable elements that you use across your guides and surveys. With components, you specify the contents one time, then apply them anywhere in the theme.
Each component includes states, such as default, hover, or focus, that you can customize.
## Theme component usage
Theme components appear throughout guides and surveys. This section describes where each component type appears in the application.
### Buttons
Buttons appear in the following locations:
- **Primary buttons**: The main call-to-action (CTA) buttons in guides and surveys. These buttons use the accent color you define in your theme.
- **Secondary buttons**: Alternative actions or less prominent CTAs. These buttons use the secondary color settings.
- **Button states**: All buttons support default, hover, active, and disabled states that you can customize in the component editor.
Buttons appear in:
- Guide steps with action buttons
- Survey submission buttons
- Modal dialogs
- Banner actions
- Form submissions
### Cards
Cards group and display content in guides and surveys. Card styling applies to:
- Guide step containers
- Survey question containers
- Content blocks within guides
- Information panels
- Result displays in surveys
Card properties (corner radius, padding, gaps, shadow) apply uniformly to all card elements in your guides and surveys.
### Form controls
Form controls are interactive elements in surveys and forms. These controls appear in:
- **Text inputs**: Short and long text input fields for survey responses.
- **Select dropdowns**: Dropdown menus for selecting from multiple options.
- **Checkboxes**: Multiple choice options where users can select more than one answer.
- **Radio buttons**: Single choice options where users can select only one answer.
- **Rating components**: Star ratings, emoji ratings, and numeric ratings for feedback.
- **List elements**: Ordered and unordered lists in survey questions.
All form controls share the same styling properties (height, corner radius, padding, gaps, shadow, focus ring) that you configure in the Form controls section.
### Widgets
Widgets are container elements that display guides and surveys. Each widget type has specific dimension settings:
- **Modals**: Full-screen or centered dialog boxes that appear over your application. Used for multi-step guides, surveys, and important announcements.
- **Popovers / Pins**: Small, contextual elements that appear near specific UI elements. Used for tooltips, hints, and inline guidance.
- **Tooltips**: Small informational boxes that appear when users hover over or interact with elements. Used for contextual help and explanations.
- **Checklists**: Interactive lists that users can check off as they complete tasks. Used for onboarding flows and task completion guides.
### Borders
Border colors apply to:
- Form control outlines
- Card edges
- Button borders
- Input field borders
- Separator lines between content sections
Border colors support primary, primary hover, and disabled states that you can customize.
### Backgrounds
Background colors apply to:
- Card backgrounds
- Form control backgrounds
- Button backgrounds (primary, secondary, and their hover states)
- Disabled element backgrounds
- Widget container backgrounds
Background settings support primary, primary hover, secondary, secondary hover, and disabled states.
### Typography
Typography settings apply to all text elements in guides and surveys, including:
- Guide step titles and descriptions
- Survey questions and instructions
- Button labels
- Form control labels
- Card content text
- Widget headers and body text
The typography you set becomes the default font for all text in guides and surveys that use your theme.
### Animations
Animations control how widgets appear on screen. Each widget type can have its own animation:
- **Modal animations**: Control how modals enter and exit the screen.
- **Popover / Pin animations**: Control how contextual elements appear.
- **Tooltip animations**: Control how tooltips fade in and out.
- **Checklist animations**: Control how checklist items appear.
Animation duration settings (in milliseconds) control the speed of these transitions.
### Content colors
Content colors apply to text and link elements:
- **Primary color**: Used for main text content.
- **Secondary color**: Used for secondary text and labels.
- **Disabled color**: Used for disabled text and inactive elements.
- **Link color**: Used for clickable links in guide and survey content.
- **Link hover color**: Used when users hover over links.
- **Link visited color**: Used for links that users have already clicked.
- **Highlight color**: Used to emphasize important text or selections.
## Advanced customization with Custom CSS
[Custom CSS](https://amplitude.com/docs/guides-and-surveys/custom-css) gives you control over specific elements using CSS class selectors for styling beyond what themes provide. Custom CSS is available for web SDKs only.
Amplitude recommends using themes for most styling. Use Custom CSS when themes don't provide the control you need.
================================================================================
# Custom CSS
URL: https://amplitude.com/docs/guides-and-surveys/custom-css
================================================================================
# Custom CSS
Amplitude provides two options for customizing the appearance of your guides and surveys. [Themes](https://amplitude.com/docs/guides-and-surveys/themes) control the overall appearance of your guides and surveys. Custom CSS offers fine-grained control for specific styling needs that themes can't address. Amplitude recommends using themes for most customizations, because themes offer better flexibility and backward compatibility.
{% callout type="note" heading="Web SDK only" %}
Custom CSS is available for the web SDK. Mobile SDKs (iOS, Android, React Native) don't support custom CSS.
{% /callout %}
## How custom CSS works
The Guides and Surveys SDK adds CSS classes to form factor elements so you can target the elements with CSS. These selectors:
- Provide stable targets for custom styling
- Focus on container and parent elements
- Work alongside existing theme settings
## Class selectors
Use CSS class selectors to target Guides and Surveys elements:
```css
/* Target banner container */
.amplitude-engagement-banner-container {
background-color: #f0f0f0;
}
/* Target modal overlay */
[data-amplitude-engagement-modal-overlay] {
background-color: rgba(0, 0, 0, 0.8);
}
```
### Form factor containers
| Form Factor | Selector |
| ------------- | ------------------------------------------- |
| Banner | `.amplitude-engagement-banner-container` |
| Card | `.amplitude-engagement-card-container` |
| Modal | `.amplitude-engagement-modal-container` |
| Modal overlay | `[data-amplitude-engagement-modal-overlay]` |
| Popover | `.amplitude-engagement-popover-container` |
| Tooltip | `.amplitude-engagement-tooltip-content` |
| Pin | `.amplitude-engagement-pin` |
| Checklist | `.amplitude-engagement-checklist` |
### Common elements
| Element | Selector |
| ------------ | ------------------------------ |
| Close button | `.amplitude-engagement-close` |
| Image | `.amplitude-engagement-image` |
| Video | `.amplitude-engagement-video` |
| Title | `.amplitude-engagement-title` |
| Content | `.amplitude-engagement-content`|
| Beacon | `.amplitude-engagement-beacon` |
### Banner-specific elements
| Element | Selector |
| ------------------- | ------------------------------------------- |
| Banner body | `.amplitude-engagement-banner-body` |
| Banner title | `.amplitude-engagement-banner-title` |
| Banner content | `.amplitude-engagement-banner-content` |
| Banner actions | `.amplitude-engagement-banner-actions` |
| Banner close button | `.amplitude-engagement-banner-close-button` |
### Tooltip-specific elements
| Element | Selector |
| ----------------------- | ---------------------------------------------- |
| Tooltip content | `.amplitude-engagement-tooltip-content` |
| Tooltip marker | `.amplitude-engagement-tooltip-marker` |
| Tooltip marker (image) | `.amplitude-engagement-tooltip-marker__image` |
| Tooltip marker (icon) | `.amplitude-engagement-tooltip-marker__icon` |
| Tooltip marker (beacon) | `.amplitude-engagement-tooltip-marker__beacon` |
{% callout type="note" heading="" %}
When a tooltip uses the **Element is marker** setting (web only), Amplitude doesn't render a separate marker element, so the tooltip marker selectors in the table above don't match any elements. Go to [Tooltip](https://amplitude.com/docs/guides-and-surveys/form-factors#tooltip) in the form factors guide for details.
{% /callout %}
### Pin-specific elements
| Element | Selector |
| ----------- | ----------------------------------- |
| Pin | `.amplitude-engagement-pin` |
| Pin beacon | `.amplitude-engagement-pin-beacon` |
| Pin content | `.amplitude-engagement-pin-content` |
| Pin arrow | `.amplitude-engagement-pin-arrow` |
| Pin mask | `.amplitude-engagement-pin-mask` |
### Checklist-specific elements
| Element | Selector |
| --------------------------------- | -------------------------------------------------------- |
| Checklist | `.amplitude-engagement-checklist` |
| Checklist header | `.amplitude-engagement-checklist-header` |
| Checklist title | `.amplitude-engagement-checklist-title` |
| Checklist subtitle | `.amplitude-engagement-checklist-subtitle` |
| Checklist progress | `.amplitude-engagement-checklist-progress` |
| Checklist close button | `.amplitude-engagement-checklist-close-button` |
| Checklist item header (expanded) | `.amplitude-engagement-checklist-item-header__expanded` |
| Checklist item header (collapsed) | `.amplitude-engagement-checklist-item-header__collapsed` |
| Checklist item body | `.amplitude-engagement-checklist-item-body` |
| Checklist item content | `.amplitude-engagement-checklist-item-content` |
| Checklist item buttons | `.amplitude-engagement-checklist-item-buttons` |
| Checklist item button (primary) | `.amplitude-engagement-checklist-item-button__primary` |
| Checklist item button (secondary) | `.amplitude-engagement-checklist-item-button__secondary` |
### Card-specific elements
| Element | Selector |
| ------------ | ------------------------------------- |
| Card | `.amplitude-engagement-card` |
| Card content | `.amplitude-engagement-card-content` |
### Modal-specific elements
| Element | Selector |
| ----------- | ----------------------------------- |
| Modal body | `.amplitude-engagement-modal-body` |
### Actions bar elements
Use these selectors to target the action bar area of nudge footers. Each layout applies a base class and a layout-specific variant class, so you can style all layouts together or target a specific layout.
| Element | Selector |
| ------------------------------ | ----------------------------------------------------- |
| Actions bar container | `.amplitude-engagement-actions-bar-container` |
| Actions bar | `.amplitude-engagement-actions-bar` |
| Classic and split layout variants | `.actions-bar-layout-classic` |
| Stacked layout variant | `.actions-bar-layout-stacked` |
| Centered layout variant | `.actions-bar-layout-centered` |
For example, to add a border above CTAs in all nudge footer layouts, or to style only a specific layout:
```css
/* Add a border above CTAs in all guide/survey footer layouts */
.amplitude-engagement-actions-bar-container {
border-top: 1px solid #000000;
}
/* Style only Classic and Split layout footers */
.amplitude-engagement-actions-bar.actions-bar-layout-classic {
padding-top: 12px;
}
```
### Buttons and actions
| Element | Selector |
| ---------------------- | --------------------------------------------- |
| CTA button | `.amplitude-engagement-cta-button` |
| CTA button (primary) | `.amplitude-engagement-cta-button__primary` |
| CTA button (secondary) | `.amplitude-engagement-cta-button__secondary` |
| Banner actions | `.amplitude-engagement-banner-actions` |
### Form elements (Survey elements)
| Element | Selector |
| ------------------------ | ---------------------------------------------- |
| Survey prompt | `.amplitude-engagement-survey-prompt` |
| List | `.amplitude-engagement-list` |
| List dropdown | `.amplitude-engagement-list-dropdown` |
| Rating | `.amplitude-engagement-rating` |
| Rating (emojis) | `.amplitude-engagement-rating__emojis` |
| Rating (numbers) | `.amplitude-engagement-rating__numbers` |
| Rating (stars) | `.amplitude-engagement-rating__stars` |
| Rating label | `.amplitude-engagement-rating-label` |
| Rating label (start) | `.amplitude-engagement-rating-label-start` |
| Rating label (end) | `.amplitude-engagement-rating-label-end` |
| Text input | `.amplitude-engagement-text-input` |
| Short text input | `.amplitude-engagement-short-text-input` |
| Input | `.amplitude-engagement-input` |
| Select | `.amplitude-engagement-select` |
| Select input | `.amplitude-engagement-select-input` |
| Checkbox option | `.amplitude-engagement-checkbox-option` |
| Radio option | `.amplitude-engagement-radio-option` |
The `.amplitude-engagement-survey-prompt` selector targets question prompt labels across rating, text, list, and dropdown survey blocks. The `.amplitude-engagement-rating-label-start` and `.amplitude-engagement-rating-label-end` selectors target the two scale-endpoint labels inside `.amplitude-engagement-rating-label`.
## Using class selectors
### Basic styling
```css
/* Style banner background */
.amplitude-engagement-banner-container {
background: linear-gradient(to right, #667eea, #764ba2);
}
/* Customize CTA button appearance */
.amplitude-engagement-cta-button {
border-radius: 8px;
text-transform: uppercase;
}
/* Style close button hover state */
.amplitude-engagement-close:hover {
opacity: 0.7;
}
```
### Target specific form factors
```css
/* Style banners with custom background */
.amplitude-engagement-banner-container {
background: linear-gradient(to right, #667eea, #764ba2);
}
/* Style primary CTA buttons in banners */
.amplitude-engagement-banner-container
.amplitude-engagement-cta-button__primary {
width: 100%;
}
/* Style checklist progress bars */
.amplitude-engagement-checklist-progress {
background-color: #f5f5f5;
}
```
## Important considerations
Note the following considerations when you implement custom CSS.
### Specificity
You may need to use `!important` to override default styles:
```css
.amplitude-engagement-banner-container {
background-color: #custom-color !important;
}
```
### Selector stability
Target the documented CSS classes rather than:
- Internal generated class names
- Element structure that may change
- Undocumented classes or attributes
================================================================================
# Personalize with Variables
URL: https://amplitude.com/docs/guides-and-surveys/personalize-with-variables
================================================================================
# Personalize with Variables
The Personalize with variables feature (also called interpolation) dynamically displays user properties to customize content in a guide or survey. Use this feature to customize content for each user, such as displaying their first name or `user_id`. You can add personalized variables to:
- Titles
- Content
- Button labels
- Button Action URLs
## Common examples
### Replacing parts of a URL
Use user property variables in CTA links to personalize URLs. For example, create a link like:
```
www.example.com/path?user_id=@{{property.user_id}}&country=@{{property.country}}
```
When a user clicks the CTA link, Amplitude replaces the user property variables with actual values:
```
www.example.com/path?user_id=12345&country=US
```
### Personalizing guides with a user's name
Create a user property that holds the user's first name, such as `firstName`. Place the `firstName` property in any guide or survey field where you want to address users by name.
## Providing fallback values
A user property isn't always available for every user or every session. Use a fallback value to display a default when the property is missing. For example, to display "Hey there" instead of "Hey {firstName}" when a user hasn't provided their name, use a fallback like `{{property.firstName | there}}`.
## User property requirements
Send user properties from the client during the active session, using either the Amplitude SDK or the Engagement SDK. Properties sent in prior sessions, and properties stored only on the server, aren't supported.
To set user properties, use the [`_setUserProperties`](https://amplitude.com/docs/sdks/guides-and-surveys/sdk#set-user-properties) method in the Engagement SDK, or `amplitude.identify()` in the Amplitude SDK.
{% callout type="tip" heading="" %}
Amplitude autopopulates `user_id` and `device_id` for you. These variables are always available without additional setup.
{% /callout %}
{% callout type="tip" heading="User properties in conditional logic" %}
User properties can also power [conditional logic](https://amplitude.com/docs/guides-and-surveys/conditional-logic). Use conditional logic to create different button actions or survey paths based on user characteristics. For example, direct premium users to different content than free users.
{% /callout %}
##### Add personalized variables to a guide or survey
1. Open an existing guide or survey, or create a new one.
2. Select the title, content block, button name, or other text field. The personalize variable icon appears on the right of the selected field.
3. Select the [user property](https://amplitude.com/docs/sdks/guides-and-surveys/sdk#set-user-properties) icon.
4. In the popup, enter the user property name.
5. (*Optional*) Enter a fallback value for the user property.
6. Select **Insert**.
7. Repeat for every field where you want to add property variables.
================================================================================
# Conditional Logic
URL: https://amplitude.com/docs/guides-and-surveys/conditional-logic
================================================================================
# Conditional Logic
Conditional logic creates dynamic, personalized experiences that adapt based on user properties and survey responses. Use conditional logic to branch survey paths, trigger different actions, or show different content to different users.
## Where you can use conditional logic
Conditional logic works with both guides and surveys. You can select it as an action for either primary or secondary buttons.
## Types of conditions
Create conditions based on two types of data:
### User properties
User properties are attributes about your users, such as location, subscription tier, or account type. User properties must be shared client-side during the session with either the Amplitude SDK or the Engagement SDK.
Common user property examples:
* `subscription_tier`
* `country`
* `account_type`
* `initial_referring_domain`
{% callout type="note" heading="User property requirements" %}
Properties must be available client-side during the current session. Properties shared from prior sessions or properties stored only on the server aren't supported. Go to [Set user properties](https://amplitude.com/docs/sdks/guides-and-surveys/sdk#set-user-properties) for implementation details.
{% /callout %}
### Survey responses
Survey responses are the answers users provide to questions in your surveys. Use survey responses to branch your survey based on how users answer. Conditions can reference responses from any prior step in the survey, not just the current one. This lets you build multi-layered branching logic that considers the full context of a user's answers.
Survey response examples:
* NPS ratings
* Star ratings
* Single-select list selections
* Text input values
{% callout type="note" heading="Multi-select list inputs aren't supported" %}
Conditional logic on multi-select list inputs isn't supported within the same step or in later steps. In the survey builder, multi-select list questions appear in the *Survey Responses* dropdown but are disabled. A tooltip explains the limitation. Use a single-select list if you need to branch on the answer. Multi-select conditional logic support is a longer-term follow-up.
{% /callout %}
### Combining conditions
Combine multiple conditions to create more advanced logic. When you add multiple conditions, all conditions must be met for the action to execute.
For example: if `subscription_tier = premium` AND `country = US`, then visit link to premium US-specific content.
## Set up conditional logic
The setup process is similar whether you add conditional logic to buttons or to survey steps.
### Add conditional logic to buttons
1. In your guide or survey, add a primary or secondary button.
2. Click the **On button click** dropdown.
3. Select **Evaluate conditional logic**.
4. Navigate to the Conditional Logic section.
5. Under **When**, select either **User Property** or **Survey Response** from the dropdown.
6. Configure your condition:
- For **User Property**: Select the property, operator, and value.
- For **Survey Response**: Select the question, operator, and value. Multi-select list questions aren't supported; use a single-select list if you need to branch on the answer.
7. (*Optional*) Click **Add condition** to add more conditions.
8. Under **Do this**, select the action to execute when the condition is met.
9. Configure the action based on your selection.
{% callout type="tip" heading="Multiple conditional actions" %}
Add multiple conditional actions to handle different scenarios. For example, one action for premium users and another for free users. Amplitude evaluates conditions in order and executes the first matching action.
{% /callout %}
## Examples and use cases
### Branch survey based on NPS score
Create a survey that asks different follow-up questions based on a user's NPS score:
1. Add an NPS rating block asking "How likely are you to recommend us?"
2. Add conditional logic:
- If `rating ≤ 6` (Detractors), then go to step asking "What can we improve?"
- If `rating ≥ 9` (Promoters), then go to step saying "Thank you! Would you leave us a review?"
### Redirect users based on subscription tier
Create a guide with a button that directs users to different pages based on their subscription level:
1. Add a primary button labeled "View Features".
2. Select **Evaluate conditional logic**.
3. Add conditions:
- If `subscription_tier = premium`, then visit link `www.example.com/premium-features`.
- If `subscription_tier = free`, then visit link `www.example.com/upgrade`.
### Show guide only to specific user segments
Launch a secondary guide based on both user property and survey response:
1. Add a primary button labeled "Next".
2. Select **Evaluate conditional logic**.
3. Add conditions:
- If `country = US` AND `rating > 8`, then show guide "US-specific-offer".
- If `country ≠ US` AND `rating > 8`, then show guide "international-offer".
### Branch based on a prior step's response
Create a survey that uses an earlier step's response to determine a later branch:
1. Step 1: Add a rating block asking "How satisfied are you with this feature?"
2. Step 2: Add a multiple choice question asking "Which area needs improvement?"
3. On step 2, add conditional logic that references the step 1 rating:
- If `step 1 rating ≤ 3`, then go to a step asking for detailed feedback about the issue.
- If `step 1 rating ≥ 4`, then go to a thank-you step.
This approach lets you combine context from multiple steps to personalize the survey path.
### Personalized CTA based on user properties
Create a button action that clicks different elements based on user characteristics:
1. Add a primary button labeled "Get Started".
2. Select **Evaluate conditional logic**.
3. Add conditions:
- If `user_type = new`, then click element `[data-testid="onboarding-flow"]`.
- If `user_type = returning`, then click element `[data-testid="dashboard"]`.
## Best practices
* **Test thoroughly**: Use [preview mode](https://amplitude.com/docs/guides-and-surveys/testing#preview-mode) to test all conditional paths before publishing.
* **Keep logic simple**: Complex nested conditions can be difficult to maintain and debug.
* **Monitor results**: Use [analytics](https://amplitude.com/docs/guides-and-surveys/analytics-glossary) to track how users flow through your conditional experiences.
================================================================================
# Content editor
URL: https://amplitude.com/docs/guides-and-surveys/content-editor
================================================================================
# Content editor
The content editor in Guides and Surveys supports rich content creation through Markdown and HTML, giving you control over how your content appears to users. The content editor works for the content field only. Other fields, such as titles or buttons, aren't supported.
## Markdown support
The description editor supports standard Markdown formatting, so you can create rich text content without writing HTML. Use Markdown for:
- \*\*Bold text\*\* and \*italic text\* or \_italic text\_
- Headers and subheaders
- Lists (bulleted and numbered)
- Links and images
- Code blocks and inline code
### Example Markdown content
```markdown
## Welcome to our *new* feature!
This **important update** includes:
1. Enhanced performance
2. New user interface
3. Better accessibility
> **Note:** This feature is available to all users.
For more information, visit our [help center](/help).
```
## HTML and inline CSS
For advanced customization, you can use HTML with inline CSS directly in the step description editor. HTML with inline CSS gives you control over styling and layout.
{% callout type="info" heading="HTML is sanitized" %}
Anything outside of inline styling, such as an `onclick`, is ignored.
{% /callout %}
### Example HTML with inline CSS
```html
<h2 style="margin: 0 0 10px 0; font-size: 24px; color: blue;">Special Announcement</h2>
<p style="margin: 0; font-size: 16px; background:yellow;">We're excited to share this update with you!</p>
```
## Custom CSS on themes
For more systematic use of custom CSS, you can write custom CSS directly in your [themes](https://amplitude.com/docs/guides-and-surveys/themes#advanced-customization-with-custom-css). Use the CSS selectors in the [Custom CSS documentation](https://amplitude.com/docs/guides-and-surveys/custom-css) to target specific elements and create cohesive designs across all your guides and surveys.
{% callout type="tip" heading="Content preview" %}
Use the theme preview feature to see how your Markdown and HTML content will appear to users before publishing your guide or survey.
{% /callout %}
================================================================================
# Guide or Survey seen too often
URL: https://amplitude.com/docs/guides-and-surveys/troubleshooting/guide-or-survey-seen-too-often
================================================================================
# Guide or Survey seen too often
Users sometimes report seeing the same guide or survey repeatedly, or receiving more guides and surveys than you intended. Most often, you notice the issue in your analytics first: a single user logs an unexpectedly high number of Guide Viewed events. This page describes the most common causes and how to fix them.
This article assumes you know how to configure a guide or survey. If you need a refresher, review [Setup and Targeting](https://amplitude.com/docs/guides-and-surveys/setup-and-target) and [Throttling](https://amplitude.com/docs/guides-and-surveys/throttling) before proceeding.
## Troubleshooting checklist
Use these questions as a quick checklist when a guide or survey appears too often. If you can answer "yes" to a question, that setting is unlikely to be the cause of your issue.
**Is "Stop showing when completed" enabled?**
The [Limits](https://amplitude.com/docs/guides-and-surveys/setup-and-target#limits) section of the builder controls whether an experience can repeat. Amplitude enables `Stop showing when completed` by default. When you disable it, the experience remains eligible to trigger again after the user completes it, so the same user can see it every time the trigger condition fires.
**Is "Stop showing when dismissed" enabled?**
Amplitude also enables `Stop showing when dismissed` by default. When you disable it, the experience can trigger again after the user dismisses it. If users close a guide and it reappears on their next page load, check this setting first.
**Is a cooldown configured, and is it long enough?**
If you disabled `Stop showing when dismissed` on purpose, add a [cooldown](https://amplitude.com/docs/guides-and-surveys/setup-and-target#limits) to limit how often the experience can trigger for a user. Without a cooldown, the experience can fire every time its trigger condition matches. If a cooldown exists but users still see the experience too often, increase its duration.
**Is throttling turned on for your project?**
[Throttling](https://amplitude.com/docs/guides-and-surveys/throttling) sets a global limit on how many guides or surveys each user sees within a period (day, week, month, or session). Throttling settings for guides and surveys are separate, so confirm you configured the one that's causing complaints. Also check the **Time Between** setting, which enforces a delay between sequential guides for the same user.
**Is the trigger broader than you intended?**
A guide with the **Immediately** trigger and no page targeting fires on every page load until a limit stops it. Review the [When and Where settings](https://amplitude.com/docs/guides-and-surveys/setup-and-target#triggers) to confirm the trigger and page conditions match your intent. Narrow the **Where** condition to specific pages if the experience should only appear in one part of your product.
**Does the user resolve to the same identity across sessions?**
Amplitude stores the guides and surveys a user has encountered as part of their user history. If a user's identity changes between visits, Amplitude treats them as a new user and shows the experience again. This happens when users don't always receive a user ID and their device ID changes frequently, for example when anonymous users clear cookies or browse in incognito mode.
A related symptom is a user profile with many [merged Amplitude IDs](https://amplitude.com/docs/data/sources/instrument-track-unique-users). When an existing user starts a new session with a new device ID and without a user ID, Amplitude treats them as a new user and shows the experience again. Later, the user signs in and receives a user ID, and Amplitude merges the two IDs into a single profile. That Amplitude profile will now show both _Viewed_ events which can be unintuitive when a guide or survey was configured to be seen only once.
The most robust setup is to initialize the Guides and Surveys SDK only after the user signs in and has a proper user ID.
## Situations that look like over-delivery
Some expected behaviors can feel like a guide or survey appears too often.
### The reporting user is a test user
When a guide or survey uses the [Testing status](https://amplitude.com/docs/guides-and-surveys/testing#testing-status-function), Amplitude ignores limits for test users to make testing easier. Test users also continue to receive the guide or survey after you change its status to **Published** or **Scheduled**. If an internal user reports seeing an experience repeatedly, check whether their device ID, user ID, or cohort appears in the **Test users** section.
Similarly, devices left in [Test User mode](https://amplitude.com/docs/guides-and-surveys/testing#test-user-mode) (mobile only) don't render guides and surveys the way regular users do. Turn Test User mode off after you finish debugging.
### Something bypassed throttling
Throttling and cooldowns don't apply in every situation. Amplitude ignores them when:
- The guide or survey has **Urgent** [priority](https://amplitude.com/docs/guides-and-surveys/setup-and-target#priority).
- A force trigger displays the experience: the SDK, a call to action (CTA) in another guide, the Amplitude Assistant, or a [share link](https://amplitude.com/docs/guides-and-surveys/setup-and-target#send-a-link-to-a-guide). A share link also overrides audience targeting, so users who follow a link with the guide's query parameter attached see the guide regardless of their history.
- Someone reset the user's interactions with the guide through the [user profile](https://amplitude.com/docs/guides-and-surveys/testing#troubleshooting-preview-mode). Clearing a guide from a user's history makes that user eligible to see it again.
### The guide is active and follows the user
When a user first views a guide or survey, it becomes [active](https://amplitude.com/docs/guides-and-surveys/setup-and-target#active-state) and remains active until the user completes or dismisses it. An active guide shows up on every page load and follows the user across pages, even where the trigger condition didn't fire. This is expected behavior, not a repeat display. The guide stops following the user after they complete or dismiss it.
To confirm the active state is the cause, inspect the guide's display events in the Event Explorer. The `source.type` property shows whether the active state or a new trigger caused each display.
### The user snoozed the guide instead of dismissing it
If the experience is [snoozable](https://amplitude.com/docs/guides-and-surveys/setup-and-target#settings), a snoozed guide reappears after the snooze duration passes. Users who snooze rather than dismiss see the experience again by design. Increase the snooze duration if it reappears too quickly.
================================================================================
# Cohort targeting
URL: https://amplitude.com/docs/guides-and-surveys/troubleshooting/cohort-targeting
================================================================================
# Cohort targeting
Users sometimes don't see a guide or survey you expected them to receive, or they see it when you thought a cohort exclusion would block them. When your targeting includes a cohort filter, the cause is often cohort sync timing rather than a misconfigured trigger or limit.
Guides and Surveys audience targeting is a subset of [Feature Experiment](https://amplitude.com/docs/feature-experiment/overview) targeting. It supports [remote evaluation](https://amplitude.com/docs/feature-experiment/remote-evaluation) only and follows the same asynchronous cohort sync rules as Experiment. For a deeper explanation of how cohort targeting works in Experiment, go to [Cohort Targeting](https://amplitude.com/docs/feature-experiment/cohort-targeting).
This article assumes you know how to configure targeting in the builder. If you need a refresher, review [Setup and Targeting](https://amplitude.com/docs/guides-and-surveys/setup-and-target) before proceeding.
## How cohort targeting works in Guides and Surveys
When you add a cohort to a targeting segment, Guides and Surveys evaluates the user through remote evaluation. Amplitude syncs the cohort to the **Amplitude Experiment** destination and checks whether the user belongs to that cohort at evaluation time.
Guides and Surveys doesn't support [local evaluation](https://amplitude.com/docs/feature-experiment/local-evaluation) cohort targeting. You can't download cohort membership to the SDK for client-side evaluation the way server-side Experiment SDKs do.
Dynamic cohorts don't update in real time. Amplitude syncs them to the Experiment destination on an hourly schedule by default. If you target a cohort of users who performed a `Sign Up` event, a user who just signed up might not match the cohort until the next sync completes.
Large cohorts can also take longer on the initial sync or after a significant membership change. The first sync of a 10-million-user cohort takes longer than later incremental syncs.
Remote evaluation supports cohorts up to 10 million users.
## Troubleshooting checklist
Use these questions when a user doesn't match your cohort-based targeting as expected.
**Does the cohort use the Amplitude Experiment sync destination?**
For remote evaluation cohort targeting, the cohort must sync to the **Amplitude Experiment** destination. Open the cohort in Analytics and confirm the sync destination includes **Amplitude Experiment**. Without this destination, Guides and Surveys can't evaluate cohort membership during remote evaluation.
**Is the user in the cohort right now?**
Open the cohort in Analytics and confirm the user appears in the current membership. If the user isn't in the cohort yet, the guide or survey won't target them regardless of other settings.
**Did the user join the cohort after the last sync?**
Dynamic cohort membership updates asynchronously. If the user entered the cohort recently, check the cohort's sync history. The user might have been added in a sync that completed after the evaluation occurred. Wait for the next hourly sync and test again.
**Are you targeting new users with a cohort?**
Cohort membership updates with a delay, so a cohort-based new-user filter doesn't match users on their first visit. Use the built-in **First Seen** property instead when you need real-time new-user targeting. Go to [First Seen timestamp](https://amplitude.com/docs/guides-and-surveys/setup-and-target#first-seen-timestamp) for setup details.
**Is the user's identity consistent across sessions?**
If a user's identity changes between visits, Amplitude treats them as a different user for targeting purposes. This affects cohort membership the same way it affects limits and history. To learn how Amplitude resolves user identity across devices and sessions, go to [Track unique users](https://amplitude.com/docs/data/sources/instrument-track-unique-users). For identity troubleshooting steps, go to [Guide or Survey seen too often](https://amplitude.com/docs/guides-and-surveys/troubleshooting/guide-or-survey-seen-too-often#does-the-user-resolve-to-the-same-identity-across-sessions).
**Did a share link or force trigger bypass targeting?**
Direct [share links](https://amplitude.com/docs/guides-and-surveys/setup-and-target#send-a-link-to-a-guide) override audience targeting, including cohort filters. SDK triggers, CTAs, and urgent-priority experiences can also display a guide outside normal targeting rules.
## Situations that look like cohort targeting failures
Some expected behaviors can feel like cohort targeting isn't working.
### The user just qualified for the cohort
Behavioral cohorts update on a schedule, not at the moment the qualifying event fires. A user who completes the action that defines the cohort might not match the filter until the next sync. This is expected behavior for dynamic cohorts in remote evaluation.
If you need immediate targeting based on a user property or event, pass the property explicitly through remote evaluation or use a real-time property like **First Seen** instead of a cohort.
### The cohort membership changed significantly
Adding or removing a large number of users from a cohort can extend the next sync duration. Users at the edge of membership changes might evaluate against stale membership until the sync finishes.
### You're excluding a cohort
Excluding a cohort works the same way as including one, with the same sync delays. If a user recently left an excluded cohort, they might remain excluded until the next sync updates membership on the Experiment destination.
## Learn more in Feature Experiment
Guides and Surveys reuses Experiment's remote evaluation pipeline for cohort targeting. For full details on sync destinations, supported cohort sizes, and advanced troubleshooting, go to:
- [Cohort Targeting](https://amplitude.com/docs/feature-experiment/cohort-targeting)
- [Remote evaluation](https://amplitude.com/docs/feature-experiment/remote-evaluation)
================================================================================
# Localization
URL: https://amplitude.com/docs/guides-and-surveys/localization
================================================================================
# Localization
Localization lets you serve guides and surveys in different languages without creating a new guide or survey for each language. Supported languages are configured per project.
To create localized versions of your guides and surveys, you must:
- Update the SDK to record the user's locale.
- Update your project settings to specify which languages to support.
- Specify how each supported language behaves.
- Create the translated versions of your guides and surveys.
## Update the Guides and Surveys SDK to record locale
Update the SDK to record each user's locale during the Guides and Surveys [SDK initialization](https://amplitude.com/docs/guides-and-surveys/sdk). With an accurate user locale, the SDK serves the correct translation of your guide or survey.
Make the following change in your SDK:
{% code-group %}
```js Amplitude SDK
const currentLocale = getLocale(); // "en" or "en-US"
amplitude.add(window.engagement.plugin({ locale: currentLocale }));
```
```js Third-party analytics
// replace with the function you need
const currentLocale = navigator.language; // for example: "en-US"
engagement.init(apiKey, { locale: currentLocale }); // for use with third-party Analytics SDKs
```
{% /code-group %}
{% callout type="note" heading="Locale code" %}
Amplitude considers the language of a locale code for certain languages. Refer to the supported locales list below for details.
{% /callout %}
## Update project settings to support multiple languages
Navigate to _Project Settings > Guides and Surveys_ to configure localization.
On this tab, you can:
- Enable or disable localization
- View the default language
- Define the languages available for your guides and surveys
- Set the fallback behavior when a translation file is unavailable or out of date
Guides & Surveys supports [ISO 639](https://en.wikipedia.org/wiki/List_of_ISO_639_language_codes) language codes, and the following locales:
- English: `en-US`, `en-GB`, `en-AU`, `en-CA`, `en-IN`
- Spanish: `es-ES`, `es-MX`, `es-AR`, `es-CO`
- French: `fr-FR`, `fr-CA`
- Portuguese: `pt-BR`, `pt-PT`
- Chinese: `zh-CN (Simplified)`, `zh-TW (Traditional)`, `zh-HK (Hong Kong, Traditional)`
- German: `de-DE`, `de-AT`, `de-CH`
- Arabic: `ar-SA`, `ar-EG`, `ar-MA`
{% callout type="note" heading="" %}
English is the default language for all projects. Only Amplitude Support staff can change this default. To update your default language, contact [Amplitude Support](https://gethelp.amplitude.com).
{% /callout %}
##### To add a supported language
1. In the Supported languages section, click **Add language**.
2. In the menu, search for or scroll to select the languages you need. You can select as many as you need.
3. Click **Apply**.
### Configure fallback behavior
Fallback behavior controls what appears when localized content isn't available. You can configure two types of fallback:
- **When translation is unavailable**: If a translation for a guide or survey isn't uploaded, choose whether the content appears in the default language or doesn't appear at all.
- **When translation is outdated**: If the default content changes but the translated content doesn't reflect the change, choose whether to show the default language, show the outdated translated version, or hide the content.
## Add localized content to a guide or survey
You can add localized versions to existing guides or surveys, or include localized content as you create new ones.
##### To add localized content to a guide or survey
1. Open an existing guide or survey, or click **Create Guide** or **Create Survey**.
2. For an existing guide or survey, click **Setup**.
3. For a new guide or survey, create and save the default content, then click **Setup**.
4. Scroll to the Localization section.
### Translatable strings
You can localize the following parts of guides and surveys:
{% accordion title="Click for more information..." %}
- Guide step title
- Guide step description
- Survey step title
- Survey step description
- Checklist title
- Checklist description
- Button text (primary and secondary)
- Checklist done button label
- Snooze label
- Survey text prompt
- Survey rating lower label
- Survey rating upper label
- Survey list required message
- Survey list "other" option label
- Survey list "other" option placeholder
- Survey list input options
- Video URL
{% /accordion %}
### Translate content
You can add localized content to your guide or survey in several ways:
- Use the web interface to add or edit translations. Amplitude recommends this method.
- Use AI localization to translate your content automatically. Amplitude recommends this method for quick, automated translations.
- Use the .xliff file to add or edit translations. Amplitude recommends this method if you integrate with a custom translation workflow.
- Use the [localization API](https://amplitude.com/docs/apis/guides-and-surveys/guides-and-surveys-api-localization) to add or edit translations. Amplitude recommends this method for automated translation workflows. The API takes longer to set up, but suits larger teams or teams that support many languages.
{% tabs tabs="Web interface, AI localization, XLIFF file upload" %}
{% tab name="Web interface" %}
The web interface is the preferred method for adding localized content because it maps directly to each text string.
1. Click the **Build** tab of your guide or survey.
2. In the upper-right of the screen, click the language toggle. The default is **English**.
3. Select the language you need.
4. Update the individual strings with your translated content. Amplitude associates each string with the language shown in the language toggle.
{% /tab %}
{% tab name="AI localization" %}
AI localization translates your guide or survey content automatically using [Claude](https://claude.ai/login?returnTo=%2F%3F). Amplitude takes the strings from the default language and attempts to:
- Maintain the original meaning and tone.
- Make the translations natural and user-friendly.
- Preserve HTML tags, formatting, and special characters.
Amplitude can't guarantee the accuracy of AI-translated strings, so review AI-translated content manually before publishing. You can edit AI translations through the web interface.
##### To use AI localization
1. Complete the guide or survey's steps in the default language.
2. In the Localization section of the Setup tab, select one of the following:
- **Translate All Languages**: Translate your content into all languages set in your project settings.
- **Translate Selected Language**: Translate your content for a single language.
{% /tab %}
{% tab name="XLIFF file upload" %}
If you want to integrate with your own translation workflow, you can download an [.xliff](https://en.wikipedia.org/wiki/XLIFF) file for each language.
##### To upload an XLIFF file
1. Create the guide or survey in the default language.
2. Download the translation template. This template is a .xliff file that contains [translatable strings](#translatable-strings) from each step of your guide or survey.
{% callout type="tip" heading="Adding translations to the xliff files" %}
Guides and Surveys template files put untranslated content inside `<source>` tags in an .xliff file. Don't change the content in these tags. Add translations to the `<target>` tags. For example:
`xml
<trans-unit id="done_label">
<source>Finish</source>
<target>Terminer</target>
</trans-unit>
`
{% /callout %}
3. Create translations to your target languages with the template file and upload a translated .xliff file for each language. If you don't upload a file for a language, Guides and Surveys follows the specified fallback setting for a missing translation. To include HTML in your guide or survey content (for example, `<br>` tags), escape the HTML in the `<target>` tag. For example:
`xml
<target>First line<br>Second line</target>
`
4. After you upload an .xliff file, review the content by toggling through the language picker.
{% callout type="tip" heading="Update translations" %}
After you upload a translation .xliff file, you can still update localized content on the appropriate step of the guide or survey. Amplitude applies your updates to the uploaded .xliff file to keep it in sync.
{% /callout %}
{% /tab %}
{% /tabs %}
### Preview a translation
When you preview a localized guide or survey, the preview bar displays translation-related issues that may prevent the guide or survey from showing.
================================================================================
# Analytics Glossary
URL: https://amplitude.com/docs/guides-and-surveys/analytics-glossary
Updated: 2025-08-25
================================================================================
# Analytics Glossary
This glossary lists the events and event properties Amplitude tracks automatically for Guides and Surveys.
{% analytics-glossary /%}
================================================================================
# AI Assistant
URL: https://amplitude.com/docs/assistant
================================================================================
# AI Assistant
Amplitude AI Assistant is an in-product AI helper that answers questions, recommends content, and launches in-app guides to walk users through common tasks. It bases its answers on the docs, help articles, and custom guidance your team connects to Amplitude, so it helps users succeed in your product, not as a general-purpose support bot.
{% callout type="note" %}
AI Assistant embeds an AI helper for your end users inside your product, grounded in your content. To ask AI about your own product data, such as charts, cohorts, and replays, go to [Amplitude AI](https://amplitude.com/docs/amplitude-ai) instead.
{% /callout %}
{% outcomes heading="Explore AI Assistant" %}
{% outcome icon="MessageSquare" title="Answer user questions instantly" href="https://amplitude.com/docs/assistant#capabilities" %}
Resolve how-to and troubleshooting questions in product, grounded in your own docs and help articles.
{% /outcome %}
{% outcome icon="Rocket" title="Turn answers into action" href="https://amplitude.com/docs/assistant#capabilities" %}
Launch Guides and Surveys straight from a conversation so users finish the task, not just read about it.
{% /outcome %}
{% outcome icon="Workflow" title="Let users do, not just ask" href="https://amplitude.com/docs/assistant/configure-assistant" %}
Wire up tools and workflows so AI Assistant kicks off product experiences from a single chat message.
{% /outcome %}
{% outcome icon="Target" title="Sound like your product" href="https://amplitude.com/docs/assistant/configure-assistant" %}
Set the tone and use Amplitude targeting so each segment gets the assistant experience that fits.
{% /outcome %}
{% outcome icon="Eye" title="Learn what your users keep asking" href="https://amplitude.com/docs/assistant/use-assistant" %}
Review conversations and feedback to find content gaps and improve the assistant over time.
{% /outcome %}
{% outcome icon="ShieldCheck" title="Stay in control of sensitive actions" href="https://amplitude.com/docs/assistant#privacy-and-trust" %}
Keep answers grounded in your content and require admin approval before AI Assistant takes action.
{% /outcome %}
{% /outcomes %}
## How AI Assistant and Resource Center fit together
AI Assistant lives in the same widget as Resource Center:
- **Resource Center** is the content hub that surfaces docs, guides, and other resources in-product.
- **AI Assistant** is the conversational interface that:
- Searches that same content.
- Pulls in specialized AI Assistant-only content such as **Answers**.
- Launches Guides & Surveys through tools and workflows, or directly from the chat itself.
AI Assistant and Resource Center share:
- The same front-end widget (launcher, panel, layout).
- Themes and styling.
- The same underlying Content & Sources (for articles and documents), with additional AI Assistant-specific layers like Answers.
## Capabilities
AI Assistant can:
- **Answer how-to and troubleshooting questions** based on your connected documentation and help content.
- **Link directly to relevant articles** so users can explore deeper.
- **Launch in-app guides and checklists** created in Guides & Surveys to walk users through multi-step tasks.
- **Run workflows or tools** that you enable. For example, you can launch a specific product experience based on user input.
You can:
- Customize AI Assistant's communication style and tone.
- Use Amplitude targeting to customize how individual users or groups of users experience AI Assistant.
- View conversation history and customer feedback.
## Limitations
- AI Assistant doesn't read or cite arbitrary external websites unless your team has explicitly connected them as a content source.
- AI Assistant doesn't change data or take sensitive actions unless:
- Your team has set up a tool or workflow for the action.
- The user gives explicit approval in chat (where configured).
## Privacy and trust
AI Assistant operates within your organization's existing Amplitude environment:
- It bases answers on your org's content sources, not on random public content.
- Your admins control which tools and workflows AI Assistant can use.
- For sensitive actions, your admins can configure AI Assistant to ask for explicit user approval in chat before it proceeds.
If you have questions about how AI Assistant uses data in your specific deployment, contact your internal Amplitude admin or support team.
================================================================================
# Use AI Assistant
URL: https://amplitude.com/docs/assistant/use-assistant
================================================================================
# Use AI Assistant
How your users open AI Assistant depends on how you configure the widget, but the basic pattern is:
1. **Find the AI Assistant widget launcher.**
Look for a help or chat icon, often in the bottom-right corner of the page. Your team may label it with your brand, for example, "Help", "Need assistance?", or your company name.
2. **Open the widget.**
Select the launcher. The AI Assistant widget opens as a panel on the page. Depending on configuration, the widget may include:
- A **Chat** tab where they can talk with AI Assistant.
- A **Resource Center** tab with recommended and searchable content.
- Both, as separate tabs in the same widget.
3. **Switch between Chat and Resource Center.**
If your team enabled both, use the tabs at the top of the widget, for example, **Chat** and **Resources**, to switch modes:
- **Chat** for conversational help.
- **Resources** for browsing and searching articles, guides, and other content.
## Ask a question
On the **Chat** tab, users can ask AI Assistant any question that your connected content and tools can answer. Typical use cases include:
- "How do I invite a teammate?"
- "Why is my dashboard empty?"
- "Show me a quick tour of the new feature."
- "Where can I find your billing documentation?"
To ask a question:
1. Select the **message box** at the bottom of the **Chat** tab.
2. Type your question in plain language.
3. Press **Enter** or select **Send**.
AI Assistant processes your request and then:
- Streams its answer into the chat.
- May include links to relevant docs or Resource Center items.
- May open an in-app guide, checklist, or survey that walks you through a flow.
## Continue a conversation
AI Assistant keeps track of context within a single chat:
- You can ask follow-up questions without repeating yourself.
- AI Assistant can refer back to earlier messages in the same conversation.
For example:
1. You: "How do I set up SSO?"
2. AI Assistant: Explains the process and links a setup guide.
3. You: "Can I require this for all users?"
4. AI Assistant: Builds on the previous answer to cover enforcement.
If you want to switch topics completely, start a new question in the same chat. AI Assistant keeps context within a conversation, not across unrelated threads.
## Give feedback on answers
End users can help improve AI Assistant by giving feedback:
- **Thumbs up** a helpful answer so your admins know it worked well.
- **Thumbs down** an unhelpful answer. AI Assistant (and your admins) use this to improve:
- AI Assistant may try an alternative answer or ask for clarification.
- Your admins can review that this answer didn't work and adjust content or configuration.
## Inspect answers with X-ray
AI Assistant includes a detailed inspection view that explains how AI Assistant produced each answer.
At a high level, X-ray lets you:
- Review which content sources AI Assistant used to generate an answer.
- Review which tools or workflows AI Assistant called.
- Read a short reasoning explanation of how AI Assistant derived the answer.
- Audit both live test chats and historical user chats.
### Open X-ray from a chat
There are two main entry points:
1. **While testing in the AI Assistant admin area.**
When you test AI Assistant directly in its configuration view:
- Start a conversation on the right side of the screen.
- Open the **X-ray** tab for that conversation.
- For each AI Assistant message, open the details to review:
- The **Thinking** timeline (tool calls and intermediate reasoning).
- The **Sources** that AI Assistant retrieved and cited.
2. **From historical chats in analytics.**
From the AI Assistant or chat analytics area:
1. Filter or search to find a chat you care about, for example, a chat that hit a fallback or received negative feedback.
2. Open the chat detail view.
3. Select the **X-ray** or **Inspect** button.
4. Review each response in the same way: thinking, sources, and (where applicable) workflows.
### Understand the Thinking view
The **Thinking** timeline gives a chronological account of how AI Assistant handled the message.
Use this view to:
- Verify that AI Assistant calls the right tools in the right order.
- Check that AI Assistant selects workflows when it should.
- Spot cases where AI Assistant skipped a tool you expected it to use.
### Understand the Sources view
The **Sources** tab shows what information AI Assistant had access to when it wrote its answer. Typical information includes:
- **Cited sources** — passages and Answers that most directly shaped the answer.
- **Other considered sources** — content that AI Assistant retrieved and evaluated but didn't directly cite.
- **Per-source details** — such as the title, URL, and content section.
Internally, AI Assistant stores point-in-time snapshots of the relevant passages so you can review what it used, even if someone edited or removed the underlying article later.
Use this view to:
- Confirm that AI Assistant uses the right documents.
- Identify when outdated or incorrect content drives bad answers.
- Decide whether to:
- Update an article.
- Create an Answer with a clearer answer.
- Adjust content tags or indexing.
## Analyze chats and improve AI Assistant
AI Assistant's value increases as you iterate. Use chat analytics plus X-ray to improve coverage and quality.
### Find problem areas
From the chat analytics area:
1. Filter chats by:
- High fallback rate.
- Negative feedback.
- A specific topic or keyword.
2. Open individual chats and inspect them with X-ray to review:
- Which sources AI Assistant used.
- Which tools AI Assistant called.
- Whether the answer was incomplete or incorrect.
### Fix gaps
Based on what you find:
- **Update or add content in your docs or help center.**
- **Create Answers for recurring high-importance questions.**
- **Adjust workflows or tools if AI Assistant isn't choosing the right path.**
- **Tighten or expand targeting for Resource Center content so articles appear when and where users need them.**
- **Create a guide for important or confusing product areas.**
Over time, this loop—chat, X-ray, then content or configuration updates—turns AI Assistant into a high-quality, product-specific helper rather than a generic chatbot.
================================================================================
# Configure AI Assistant
URL: https://amplitude.com/docs/assistant/configure-assistant
================================================================================
# Configure AI Assistant
Configure AI Assistant and Resource Center in Amplitude by enabling the assistant, connecting content sources, creating custom answers, setting fallbacks and communication style, building workflows and tools, and styling the widget. Amplitude admins and builders handle this configuration.
## Enable AI Assistant and choose where it appears
Configuration typically involves:
1. **Enable AI Assistant for your org.**
Make sure you enable AI Assistant for your organization and projects. This may involve:
- Having AI Assistant included in your Amplitude plan.
- Enabling AI Assistant in _AI Assistant > Settings > AI Assistant_.
2. **Configure the widget launcher.**
From the _Assistance / AI Assistant_ or _Resource Center_ configuration area:
- Choose a pre-built launcher, a custom element, or custom code to determine where the launcher appears. For example, on the bottom-right of all pages, or only on certain screens.
- Specify targeting logic based on:
- User properties (such as role or plan).
- Cohorts defined in Amplitude.
- URL or route rules.
3. **Choose which surfaces to enable.**
In the widget configuration:
- Turn **Chat (AI Assistant)** on or off.
- Turn **Resource Center** on or off.
- Decide whether users land on Chat or Resource Center by default when the widget opens.
## Connect content sources
AI Assistant is only as good as the content you give it. You manage that content through **Content & Sources** and Resource Center.
### Add content sources
Examples of sources include:
- Your public docs or help center.
- An internal knowledge base.
- Product marketing pages.
- A blog with how-to content.
To connect a source:
1. Go to _AI Assistant > Content > Sources_.
2. Click **Add source** and choose the type (for example, "Help center", "Web", or "Docs site").
3. Provide the required details such as base URL, credentials if needed, or site map.
4. Configure the **sync frequency** (automatic or on-demand).
5. Save and run an initial sync.
Each source ingests many content items (individual articles, pages, or documents). Amplitude indexes these for both:
- Resource Center (search and recommendations).
- AI Assistant (through its documentation search tool).
Plan limits may control how many sources and documents for each source you can connect; check your Amplitude plan if you hit a limit.
### Curate Resource Center recommendations
Use the Resource Center configuration to build recommendation sets for different contexts:
- By page or feature.
- By user segment.
- As a global default.
You can include:
- Articles and documents.
- Guides & Surveys content (tours, checklists, surveys).
- Links or other resources.
AI Assistant can then:
- Link users to these items in its answers.
- Trigger guides or surveys as part of workflows.
## Create custom answers
Custom answers let you fill specific gaps in your documentation or enforce exact wording for high-importance topics.
Typical use cases:
- "What is your SLA?"
- "What's the difference between the Business and Enterprise plans?"
- "How do I cancel my subscription?"
To create an answer:
1. Navigate to _AI Assistant > Content > Answers_.
2. Click **Create New**.
3. Set the following:
- **Status**: `Draft` or `Published`. Controls whether AI Assistant can use the answer.
- **Title**: A title or short description of the answer.
- **Answer**: The text you want AI Assistant to use.
- **Answer is verbatim**: Instructs AI Assistant to use the text as you provide it, rather than interpret it. This is useful when you have specific or important topics you want to convey, for example, when a user asks about a refund.
4. Click **Create**.
Amplitude indexes answers and makes them available to AI Assistant. Answers don't appear in Resource Center as standalone articles. They exist specifically to power AI Assistant's responses.
## Configure fallbacks and handoffs
When AI Assistant can't confidently answer a question, it falls back gracefully rather than guessing.
To configure a fallback:
1. Navigate to _AI Assistant > Behavior > Fallbacks_.
2. Configure a fallback for each of the following scenarios:
- AI Assistant can't find an answer to a user's question.
- A user provides negative feedback.
- A user requests to escalate to a human.
{% callout type="note" heading="" %}
AI Assistant requires at least one fallback to support cases where it can't find a suitable answer. This fallback must target all users.
{% /callout %}
Each fallback includes:
- **Targeting**, so you can configure different fallback options for different cohorts or segments of users.
- A **fallback message** that you define, for example: "I'm not confident I can answer that correctly. Let me connect you with another resource."
- An **action or assist**:
| Action | Description |
| --------------------- | ------------------------------------------------------------------------------------------------------------- |
| Visit link | Supply a URL that opens along with AI Assistant's response. |
| Click element | Specify an element on the page, which you can use to trigger another action. |
| Run callback | Run a callback function you defined in the Guides & Surveys SDK. |
| Open third-party chat | Select a chat provider to direct the user to. This action is most useful with the Escalate to human fallback. |
| Show guide | Select an existing guide to launch. |
| Show survey | Select an existing survey to launch. |
| Open article | Select an indexed article to open in Resource Center. |
| Play video | Select a video to play. Add and manage available videos in _Guides and Surveys > Content > Videos_. |
## Configure communication style
Use _AI Assistant > Behavior > Communication Style_ to control how AI Assistant formats its responses and how it appears to users in the chat interface.
### Format instructions
To specify how AI Assistant formats its responses:
1. Go to _AI Assistant > Behavior > Communication Style > Advanced_.
2. Enter format instructions. For example, "Respond in bullet points" or "Keep answers under three sentences."
AI Assistant applies these instructions when generating responses.
### Chat assistant icon
To upload a custom icon for the chat assistant:
1. Go to _AI Assistant > Behavior > Communication Style_.
2. Upload an image to use as the chat assistant icon.
## Configure workflows and tools
Under the hood, AI Assistant can call tools (APIs) and workflows (multi-step procedures) so it can do more than just answer questions.
### Built-in tools
By default, AI Assistant has access to tools such as:
- **Documentation search**: finds relevant help content.
- **Guides search**: finds relevant Guides & Surveys experiences.
- **Guide launcher**: starts a specific guide or checklist in the user's product.
- **Fallback tools**: AI Assistant uses these when it can't answer confidently or when users provide negative feedback.
AI Assistant automatically considers these tools whenever they could help answer or act on a user's request.
### Workflows
Workflows string together multiple steps and tools into a reusable pattern. For example:
- "Help a user reset their password."
- "Troubleshoot why a dashboard is empty."
- "Walk through a feature adoption checklist."
A typical workflow might:
1. Ask clarifying questions in chat.
2. Call an internal API to look up data.
3. Decide between multiple branches based on that data.
4. Launch a relevant guide or checklist.
5. Exit back to AI Assistant chat with a summary.
To create a workflow:
1. Navigate to _AI Assistant > Automations > Workflows_ and click **Create**.
2. Define the workflow's trigger. For example, define the words or phrases that trigger the workflow when a user enters them. Optionally, tell AI Assistant when to exit a workflow, for example, when the user changes topic or no longer responds.
3. Define the workflow. Use natural language to inform AI Assistant how it should respond. Click **Insert Actions** or enter `@` to insert an action into the workflow.
4. Set targeting for the workflow.
5. Click **Save** and **Enable** to activate the workflow.
#### Example workflow
This workflow helps users troubleshoot an empty dashboard by checking their plan and launching a relevant guide.
**Trigger**:
```text
Use this workflow whenever the user reports that their dashboard or charts aren't showing data, or asks why their data is missing.
```
**Prompt**:
```text
First, ask the user whether they recently set up a new project or whether data was previously showing.
Then, check the user's account and plan status using @Get user account information.
If the account is on a free plan, let the user know that data may take up to 24 hours to appear and launch @Empty dashboard troubleshooting guide.
If the account is on a paid plan, ask whether they've verified that events are being sent using the Amplitude Debugger, then launch @Instrumentation troubleshooting guide.
Exit the workflow and return to AI Assistant chat with a brief summary of what you recommended.
```
### Tools
Extend AI Assistant with custom tools backed by your own APIs. For each tool you define:
1. A name and description (written in plain language as if you're describing it to a human agent).
2. One or more **input parameters**, with types and validations.
3. A backend endpoint that receives the request.
AI Assistant then uses these tools to:
- Look up internal information (for example, account status, plan limits).
- Perform actions (for example, create a support ticket, start an internal workflow).
- Provide more personalized, contextual help.
To create a new tool:
1. Navigate to _AI Assistant > Automations > Tools_ and click **Create**.
2. Enter details about the tool. Provide a name and description written in plain language, as if you're explaining the tool to a human agent. Optionally, enable a confirmation dialog that prompts the user before the tool runs.
3. Define the API call:
- **Select the HTTP method**: GET, POST, PUT, PATCH, or DELETE.
- **Add the API endpoint**: Enter the full URL on your server that receives the request. The endpoint must be a valid `http` or `https` URL.
- **Define the request parameters**: Parameters are the inputs that AI Assistant can fill in when it calls the tool. For each parameter, set the **Type** (for example, `string` or `number`), **Key**, **Required** state, and **Description**. Write the description in plain language so AI Assistant understands when and how to use the parameter.
- **Wire parameters into the endpoint or body**: AI Assistant doesn't automatically append parameters to the URL or request body. To use a parameter, reference it with a `{{parameter_name}}` placeholder in the endpoint URL, request body, or both. AI Assistant ignores any parameter you define but don't reference with a placeholder.
- **Define the request body**: Supply valid JSON. The body must be a JSON object (not an array). Reference parameters in the body with `{{parameter_name}}` placeholders. Leave the body empty for GET requests that pass all parameters through the URL.
- **Define the request headers**: Supply valid JSON. For example, `{"Content-Type": "application/json"}` or `{"Authorization": "Bearer YOUR_TOKEN"}`.
4. Test the response. Enter values for each parameter you defined, send a test request to the endpoint, and review the response.
#### Example GET request
A simple GET request that passes a parameter as a query string value:
- **Method**: `GET`
- **Endpoint**: `https://weather.example.com/search?city={{city}}`
- **Parameters**: `city` (string, required) - "The city to look up the weather for."
- **Body**: Leave empty.
For GET requests, embed parameters directly in the endpoint URL. For example, use `?city={{city}}`, not just `?city`. The `{{city}}` placeholder is what tells AI Assistant where to insert the value.
#### POST request with URL and body parameters
You can mix parameter placeholders in both the URL path and the request body, and include static values alongside them:
- **Method**: `POST`
- **Endpoint**: `https://api.example.com/update_order/{{order_id}}`
- **Parameters**: `order_id` (string, required); `shipping` (string, required) - "The shipping method for the order, for example 'standard' or 'express'."
- **Body**:
```json
{
"shipping": "{{shipping}}",
"notify_customer": true
}
```
- **Headers**:
```json
{
"Content-Type": "application/json",
"Authorization": "Bearer YOUR_TOKEN"
}
```
In this example, the URL path uses `{{order_id}}`, the body uses `{{shipping}}`, and `"notify_customer": true` is a static value that doesn't come from a parameter.
#### Key things to know about parameters
- Parameters define the values AI Assistant can provide when it calls the tool. They don't automatically generate query strings, form fields, or body content.
- You must wire each parameter into the endpoint URL or body yourself using `{{parameter_name}}` placeholders.
- AI Assistant validates required parameters before the tool runs. If a required parameter is missing, AI Assistant won't send the request.
- The tool sends all requests as JSON, so custom tools work best with JSON APIs.
### User approvals and safety
For tools that affect user data or perform sensitive actions, you can require user approval:
- AI Assistant explains what it wants to do in plain language.
- The user confirms or rejects the action.
As you add tools:
- Start with read-only tools to minimize risk.
- Limit write-capable tools to well-scoped, high-value actions.
- Use X-ray to audit when, how, and why AI Assistant called tools.
## Style AI Assistant and Resource Center
AI Assistant uses the same theme system as Guides & Surveys and Resource Center, which lets you maintain a consistent in-app brand.
### Choose or create a theme
1. Navigate to _AI Assistant > Themes_.
2. Select an existing theme to edit, or click **Create Theme**.
{% callout type="note" heading="" %}
AI Assistant and Resource Center don't share themes with Guides and Surveys, but each supports the same settings and configuration.
{% /callout %}
A theme typically controls:
- Primary and secondary colors.
- Fonts and typography.
- Button styles.
- Panel backgrounds and borders.
### Apply themes to Resource Center and AI Assistant
In the Resource Center configuration:
1. Select the **theme** you want the widget to use.
2. Confirm that the theme's components for **Launcher**, **Panel / header**, **List items**, and **Tabs (Chat / Resources)** (when available) look the way you want.
AI Assistant shares the same base theme but may expose additional configuration for:
- **Chat tab styling** such as chat bubble colors and background.
- AI Assistant **name and avatar**.
- Icon used for the launcher.
================================================================================
# Overview
URL: https://amplitude.com/docs/assistant/resource-center/resource-center-overview
================================================================================
# Overview
Resource Center is a widget that integrates directly (with no other installation requirements) into the [Guides and Surveys SDK](https://amplitude.com/docs/guides-and-surveys/sdk). It surfaces insightful and useful information to your users from anywhere on your site. The Resource Center widget appears as a clickable help icon. The center itself provides:
- Search functionality.
- Recommended content.
- Quick links.
- Call-to-action button.
Your Resource Center can use external or publicly available documentation repositories, articles, videos, or third-party chat modules like Intercom.
Before your users can access the Resource Center to find relevant information, set it up first. Setting up the Resource Center includes the following activities:
- [Specifying the content](https://amplitude.com/docs/assistant/resource-center/resource-center-source-content) from which the Resource Center pulls information.
- [Creating the Resource Center links](https://amplitude.com/docs/assistant/resource-center/resource-center-recommendation-sets).
- [Setting up targeting and priority](https://amplitude.com/docs/assistant/resource-center/resource-center-targeting-recommendation-sets) levels for users and pages.
- [Specifying the Resource Center settings](https://amplitude.com/docs/assistant/resource-center/resource-center-settings).
- [Reviewing Resource Center best practices](https://amplitude.com/docs/assistant/resource-center/resource-center-best-practices).
## Search result highlighting
When you open an article from a Resource Center search result, Amplitude highlights the matched search terms inside the article and scrolls to the first highlighted passage. This takes you straight to the part of the article that matched your search instead of the top of the page.
This behavior works with the existing [Guides and Surveys SDK](https://amplitude.com/docs/guides-and-surveys/sdk) and needs no configuration.
{% callout type="note" heading="" %}
When a search result comes from a semantic match that doesn't appear word for word in the article, Amplitude can't locate the passage to highlight. In that case, the article opens at the top with no highlights.
{% /callout %}
================================================================================
# Best Practices
URL: https://amplitude.com/docs/assistant/resource-center/resource-center-best-practices
================================================================================
# Best Practices
- Autopilot uses a semantic search algorithm to optimize recommendation relevance.
- Only one recommendation appears at a time.
- A recommendation set's priority level decides which article appears first.
- If multiple recommendation sets have the same priority level, the recommendation set with the most recent sync has higher priority.
- Use the website scraper to [source content from a public website](https://amplitude.com/docs/assistant/resource-center/resource-center-website-scraper). Websites with a lot of rich content or complex formatting might not reproduce exactly as expected.
- If you want to remove an article from being visible to your users, set that article to **Draft** to unpublish it.
================================================================================
# Source Content
URL: https://amplitude.com/docs/assistant/resource-center/resource-center-source-content
================================================================================
# Source Content
Select internal help repositories, specific external content, or third-party chat integrations like Intercom as source content. Documentation repositories usually provide a large selection of information that applies widely to each page with which your users interact.
- The Resource Center requires you to add documentation repositories, videos, and chat integrations individually.
- Each documentation source requires slightly different information to successfully add it to the Resource Center. Follow the onscreen prompts for required fields.
- If you don't find your specific documentation repository as an option, select the [Website](https://amplitude.com/docs/assistant/resource-center/resource-center-website-scraper) option to sync to a public website.
- Use a Survey to suggest Resource Center content integrations to Amplitude.
## Add documentation content to Resource Center
1. Go to **Guides and Surveys > Content**.
2. On the **Sources** tab, click **Add source**.
3. Select the source where your documentation resides.
4. Click **Next**.
5. For each source type, enter the required information in the **Details** section.
6. In the **Sync options** section, specify how often you want the Resource Center to sync to your data repository.
7. In the **Default visibility** field, decide if you want newly created articles set to **Published** (visible) or **Draft** (hidden). **Default visibility** defaults to **Draft**.
8. Specify if you want to target this repository to specific users.
- If you target the content, specify the segments you want. For more information, go to [Setup and Targeting](https://amplitude.com/docs/guides-and-surveys/setup-and-target).
9. Click **Add source**.
## Add video content to Resource Center
1. Go to **Guides and Surveys > Content > Videos**.
2. Click **Add source**.
3. In the **Status** drop-down, specify the status of the video. Choose one of these statuses:
- **Draft**: Not visible to users.
- **Published**: Visible to all applicable users.
4. Enter a title for your video in the **Title** field.
This title appears as the link text.
5. Enter the video URL.
6. Click **Add video**.
After you add your content sources, create your [Resource Center recommendation sets](https://amplitude.com/docs/assistant/resource-center/resource-center-recommendation-sets).
## Managing source content
As your organization grows and evolves, your source content also grows and changes. Keep Resource Center content up to date with your source repositories. Specify how frequently you want the Resource Center to automatically sync with your source content. Alternatively, manually trigger the sync as needed.
During source content sync, you can manage some aspects of the content from the Resource Center:
- Remove specific articles from appearing in the Resource Center.
- Review new or updated content before it goes live to your users.
- Review sync errors.
- Review the sync history to understand how recent your content is in the Resource Center.
### Manage source content within Resource Center
1. Go to **Guides and Surveys > Content**.
2. Click the source content you want.
3. In the new page, select individual articles.
4. Specify if you want to set them to **Draft** (unpublish) or re-sync them to the source.
================================================================================
# Recommendation Sets
URL: https://amplitude.com/docs/assistant/resource-center/resource-center-recommendation-sets
================================================================================
# Recommendation Sets
Recommendation sets are customizable, in-the-moment articles and information embedded throughout your website to help your users as they need it. Think of them like personalized landing pages for your Resource Center. For example, you could create unique recommendation sets for:
- Advanced articles targeted to your power users.
- Getting started articles for new users.
- Custom marketing campaigns to highlight new features on specific pages.
You can create multiple recommendation sets for specific pages, or you can create a single recommendation set for your entire site. It's up to you how detailed you want to be.
{% callout type="note" heading="" %}
If you don't know how detailed you want your recommendation sets, use the Resource Center [Autopilot](https://amplitude.com/docs/assistant/resource-center/resource-center-autopilot) feature. This lets Amplitude decide which articles are most relevant for users.
{% /callout %}
## Create a recommendation set
1. Click **Create New**.
2. Enter a name for the Resource Center recommendation set. Choose something short and descriptive.
3. On the **Build** tab, click the link drop-down icon to select one of the following actions:
- **Visit link**: A URL link to a website page.
- **Click element**: Select an element on the page and make it selectable.
- **Run callback**: Select a callback key.
- **Open third-party chat**: Opens a chat window for your user to connect with a third-party provider.
- **Show Guide**: Opens a specific guide.
- **Show Survey**: Opens a specific survey.
- **Open article**: Opens a specific article.
- **Play video**: Opens a specific video.
4. For your chosen action, enter the specific information to connect to your recommendation set.
For example, if you choose **Visit link**, enter the web page URL. You may also have options to open the link in the same tab or in a new tab.
5. Enter a label for your link. Resource Center uses the label as the link title in the recommendation set.
6. Click **Save**.
================================================================================
# Recommendation Set Targeting
URL: https://amplitude.com/docs/assistant/resource-center/resource-center-targeting-recommendation-sets
================================================================================
# Recommendation Set Targeting
Resource Center targeting works the same way as targeting in the rest of Amplitude. For more information, go to [Cohort Targeting](https://amplitude.com/docs/guides-and-surveys/setup-and-target).
Keep these things in mind:
- If you have specified targeting on your content source, that targeting takes precedence before the entry targeting.
- For example, if you designate source content as only applicable for people in the European Union (EU), that content won't appear in search results for users outside of that region.
- If source content targets a specific segment but you also add it to a recommendation set with different targeting, the targeting for the recommendation set takes precedence.
## Target a specific recommendation set
1. For the resource entry you want, click **Setup**.
2. In the **Targeting** section, click **Targeted Users**, and then specify your segments.
3. Under the **Page targeting** section, specify whether you want the entries to appear on any page or only on specific pages.
4. If you only want content to appear on specific pages, click **On specific pages**, and then specify the specific pages you want.
5. Specify the priority level. All entries default to **Medium** priority.
6. Click **Save**.
================================================================================
# Settings
URL: https://amplitude.com/docs/assistant/resource-center/resource-center-settings
================================================================================
# Settings
Resource Center settings apply to the Resource Center as a whole.
## Access the settings page
From the Resource Center main page, click **Settings**.
## Targeting
Targeting from the Resource Center settings page applies to the entire Resource Center module. This is different from the targeting you can apply to either the [source content](https://amplitude.com/docs/assistant/resource-center/resource-center-source-content) or the [Resource Center sets](https://amplitude.com/docs/assistant/resource-center/resource-center-targeting-recommendation-sets).
Use this targeting if, for example, you only want the widget to appear to users in specific geographies or for users with specific job titles.
The other types of targeting you may have applied are still in effect. Because of this, don't try to restrict the widget, recommendation sets, and source content at the same time until you're very familiar with how your users may interact with the Resource Center recommendations. Using all three types of targeting at the same time risks restricting content from users who need to receive recommendations from the Resource Center.
### General
The general settings let you specify the following:
- **Enable Resource Center**: Turns the entire widget on or off. If you set this to **Off**, the Resource Center isn't available for your users.
- **Autopilot**: Automatically suggests articles and information based on what page your user is on when they click the Resource Center icon. Autopilot defaults to **On**.
### Quick links
The Quick links section adds permanent links to the bottom of the Resource Center widget. These are links to your main website, specific guides or surveys, videos, a support chat widget, or similar resources.
The Quick links section also provides a primary call-to-action (CTA) button that encourages user interaction.
### Add a quick link
1. Set **Quick links** to **On**.
2. Click **Add link**.
3. Click **Link** to specify what type of link you want.
4. Enter the link URL.
5. In the **Label** field, enter the name of the link.
6. Click **Save Changes**.
### Add a CTA button
1. Click the **Primary CTA** slider to **On**.
2. In the **CTA Label** field, enter the name of the CTA.
3. Click **Link** to specify what type of link you want.
4. Enter the link URL.
5. Click **Save Changes**.
### Text customization
The Text customization section lets you customize the text on the Resource Center itself. You can specify customized content for:
- Resource Center name.
- Search input placeholder text.
- Quick links label.
- View article button label.
- Featured content section header.
- No results title.
- No results description.
### Launcher
The launcher is the icon that lets your users interact with the Resource Center.
#### Pre-built icon
By default, this is a pre-built icon that appears on the bottom-right corner of your pages.
In the pre-built icon, customize the launcher in the following ways:
- **Style**: Specify whether you want to use an icon or a self-uploaded image.
- **Bottom position**: The location where the launcher appears:
- Top right.
- Top left.
- Bottom right.
- Bottom left.
- **Offset**: Modifies the exact horizontal or vertical position of the icon.
- **Z-index**: Specifies the CSS position where the icon appears.
Alternatively, customize the launcher by:
- Custom element (no code).
- With code.
#### Custom element (no code)
The custom element feature lets you specify an existing element on your site that you can use to launch the Resource Center. You could use images, page headers, logos, buttons, or anything else that appears on your website as the launcher.
To specify a target:
1. Select **Custom element (no code)**.
2. Click **Select target**.
3. Enter your website.
4. When your website appears, click the element that you want.
{% callout type="note" heading="" %}
Alternatively, enter the CSS or XPath selector in the field.
{% /callout %}
#### With code
Use the Guides and Surveys [SDK](https://amplitude.com/docs/guides-and-surveys/sdk) to code the launcher directly.
## Theme
Specify a theme for the Resource Center widget. If you previously created a theme for your Guides and Surveys, your theme appears as an option for the Resource Center.
For more information about creating themes, go to [Themes](https://amplitude.com/docs/guides-and-surveys/themes).
================================================================================
# Autopilot
URL: https://amplitude.com/docs/assistant/resource-center/resource-center-autopilot
================================================================================
# Autopilot
Autopilot for Resource Center recommendation sets automatically surfaces useful articles to your users as they interact with your site. It provides a smart fallback if a page doesn't have dedicated recommendation sets. Autopilot pulls content from your repositories, so you don't have to manually create recommendation sets yourself. This reduces the setup and maintenance time for Resource Center as a whole.
Autopilot uses semantic search to power the recommendations it provides from each page. These smart recommendations analyze the page and then scan your content repositories for relevant or useful information. For example, if your users are on a sign-up page, Autopilot might surface a video that illustrates the sign-up process.
Resource Center enables Autopilot by default. Change this setting from the [Resource Center settings](https://amplitude.com/docs/assistant/resource-center/resource-center-settings) page.
================================================================================
# Scraper
URL: https://amplitude.com/docs/assistant/resource-center/resource-center-website-scraper
================================================================================
# Scraper
The Website source repository lets you scrape a public-facing website to pull in articles that might help your users. Because websites and rich content vary widely, read the following information carefully when using this content source.
{% callout type="note" heading="" %}
If an integration supports your documentation platform, use the integration. Dedicated Resource Center integrations offer a better end-to-end experience. The website scraper is a powerful tool, but treat it as a fallback option.
{% /callout %}
## Website options
The website scraper provides unique options for source setup. Use this information with the procedure on the main Source Repository page.
### Extract from URLs
There are two options when specifying the exact URLs you want to include:
- **URLs**: Directly include as many URLs as you want. You can specify specific links or your entire website. Click **Add URL** to add each link.
- For each URL entered, Amplitude recursively pulls as many links as possible attached to those sites.
- Use multiple URLs if you have support articles that you can't access from the main URL link.
- This method might not find all applicable links.
- **Upload**: Uploads a CSV or XML site map file of the specific URLs you want to include.
- Use this method if you want to specify the exact URL links and pages that form the source repository.
- When you provide the sitemap, you hard-code the source repository and prevent it from automatically incorporating any new articles. You then add new articles manually.
- CSV and XML files don't need special formatting associated with the URLs. Use a sitemap.
### Advanced options
Click **Advanced** beneath the URL section to access the following options:
- **Only include these URL paths**: Lets you filter the source repository even further by only including specific URLs. This is most useful when adding entire websites.
- **Exclude these URL paths**: Lets you filter the source repository even further by excluding specific URLs from the source repository. This is useful if, for example, you want to exclude your company's blog posts from the source repository.
- **Override default selectors**: Lets you specify only the content selectors that you want to include or lets you ignore website elements. For more information, review the following sections:
{% tabs tabs="Content selectors, Ignore elements" %}
{% tab name="Content selectors" %}
The website scraper pulls in all information about a page by default, not just the main content. This can include the page header, metadata, and other information. As a result, Resource Center articles can include both the main page content and extraneous content. Amplitude uses heuristics to identify and remove as much extraneous content as possible, but some content may still appear in the article. Use content selectors to target and identify content to add to the Resource Center article.
Selectors override what the scraper considers the main content on your page. The website scraper uses the selector to pull only content associated with that selector. You can create multiple selectors to target different pieces of content.
When you have multiple selectors, the website scraper looks for each selector in the order that you created it. If the website scraper doesn't find selectors in a specific URL link, it saves information based on Amplitude heuristics.
{% /tab %}
{% tab name="Ignore elements" %}
The ignore elements selectors let you remove content from the final output of a Resource Center article. For example, you may not want to include tooltips, images, or sidebars that, while useful on your website, aren't relevant in a Resource Center article.
As with the main content selectors, you can add multiple ignore selectors and the website scraper looks for each one in the order that they appear. If the website scraper doesn't find ignore selectors in a URL link, it includes all content.
{% /tab %}
{% /tabs %}
## Re-sync excluded pages
The website scraper automatically ignores some pages. These typically include landing pages or pages that only contain links and no other text. Usually, these types of pages don't contain information suitable for a Resource Center article, and you can safely remove them from the source repository.
However, occasionally, you may want to re-include these pages so they stay active in your source repository.
### Re-sync pages
1. Go to **Guides and Surveys > Content** and select the source repository you want.
2. Click **Sync errors**.
3. Search through the excluded pages and select the ones you want to re-include.
4. Click **Force Sync and Publish**.
================================================================================
# Web Experiment
URL: https://amplitude.com/docs/web-experiment
================================================================================
# Web Experiment
Turn every page on your website into a testing ground for what works. Amplitude Web Experiment pairs a point-and-click editor with rigorous analytics so product, marketing, and growth teams can ship changes that move the numbers, without waiting on engineering.
{% outcomes heading="Explore Web Experiment" %}
{% outcome icon="Zap" title="Ship tests without an engineering ticket" href="https://amplitude.com/docs/web-experiment/set-up-a-web-experiment" %}
Launch experiments from a visual editor so marketing and growth move at their own speed.
{% /outcome %}
{% outcome icon="Target" title="Show each visitor the right variant" href="https://amplitude.com/docs/web-experiment/targeting" %}
Target by URL, behavior, and user property so the test reaches the audience that matters.
{% /outcome %}
{% outcome icon="FlaskConical" title="Test copy, design, and layout" href="https://amplitude.com/docs/web-experiment/actions" %}
Edit text, swap images, and restyle elements on the page itself instead of mocking up a new one.
{% /outcome %}
{% outcome icon="Eye" title="Try a different page entirely" href="https://amplitude.com/docs/web-experiment/pages" %}
Run page-level experiments when one tweak isn't enough and you need to redesign the whole flow.
{% /outcome %}
{% outcome icon="LineChart" title="Prove the variant moved the metric" href="https://amplitude.com/docs/web-experiment/post-experiment" %}
Tie results to revenue, signups, or conversion so you know which variant actually won.
{% /outcome %}
{% outcome icon="Rocket" title="Personalize without rebuilding the page" href="https://amplitude.com/docs/web-experiment/out-of-the-box-widgets" %}
Drop in prebuilt banners and modals to tailor the visitor experience in minutes.
{% /outcome %}
{% /outcomes %}
## Build web experiments
Use the visual editor to create page changes, redirects, and widgets without a full release cycle.
- [Set up a web experiment](https://amplitude.com/docs/web-experiment/set-up-a-web-experiment) to create the experiment, choose pages, and define goals.
- [Edit page elements](https://amplitude.com/docs/web-experiment/actions) to change text, images, styles, and layout.
- [Run page experiments](https://amplitude.com/docs/web-experiment/pages) to test full-page changes across matching URLs.
- [Use URL redirect testing](https://amplitude.com/docs/web-experiment/url-redirect-testing) when each variant needs a separate destination.
## Target and measure visitors
Connect web experiments to Amplitude data so each test reaches the right audience and reports on the right outcomes.
- [Configure targeting](https://amplitude.com/docs/web-experiment/targeting) to include visitors by URL, behavior, and user properties.
- [Track web experiments](https://amplitude.com/docs/web-experiment/tracking) to send exposure and interaction data to Amplitude.
- [Analyze results](https://amplitude.com/docs/web-experiment/post-experiment) to compare variants and make launch decisions.
- [Review performance guidance](https://amplitude.com/docs/web-experiment/performance) to reduce page impact from experiment code.
{% academy-link
title="Getting Started with Amplitude Web Experimentation"
url="https://academy.amplitude.com/getting-started-with-amplitude-web-experimentation"
description="Learn how to use Web Experimentation to fuel conversion rates in your web experiences and single-page apps."
/%}
================================================================================
# Set up a web experiment
URL: https://amplitude.com/docs/web-experiment/set-up-a-web-experiment
================================================================================
# Set up a web experiment
Web Experiment lets you create an A/B or [multi-armed bandit experiment](https://amplitude.com/docs/feature-experiment/workflow/multi-armed-bandit-experiments) without new code. Open your site in the [Visual Editor](#the-visual-editor), choose the elements you want to experiment with, and change their content or properties directly.
Web Experiments use [Pages](https://amplitude.com/docs/web-experiment/pages) to control where your experiment variants apply on your website. Pages let you scope experiments to specific URLs without affecting unrelated parts of your site.
## Before you begin
Before you set up a web experiment, [implement](https://amplitude.com/docs/web-experiment/implementation) the Web Experiment script on your site.
Creating and running a web experiment differs from [Feature Experiment](https://amplitude.com/docs/feature-experiment/workflow/create), though some steps overlap.
## Set up a web experiment
##### To set up a web experiment
1. In Amplitude Experiment, navigate to _Experiments > Create Experiment > Web Experiment_.
2. In the New Experiment modal, name your experiment.
3. Enter the URL of a page this experiment targets and select the project from the drop-down. Amplitude uses this URL to create your first [Page](https://amplitude.com/docs/web-experiment/pages). You must instrument Web Experiment on this URL for the experiment to work.
If the script is on the page you specified, Amplitude Experiment opens the page in the [Visual Editor](#the-visual-editor) as a new variant in your experiment.
You have two options for the treatment variant action: [element changes](https://amplitude.com/docs/web-experiment/actions#element-changes) or [URL redirect](https://amplitude.com/docs/web-experiment/actions#url-redirect).
{% callout type="warning" %}
If the script isn't on the page you specify, or if you have an ad blocker or other privacy extension enabled, Amplitude Experiment can't open the Visual Editor. Amplitude opens the Site Setup panel and prompts you to [implement](https://amplitude.com/docs/web-experiment/implementation) the script.
{% /callout %}
4. To change text, colors, or other elements of the page's UI, click **Element Changes**.
5. Click the element you want to change.
6. The editing toolbar opens beside the selected element with quick actions such as editing the element's content, or [move element](https://amplitude.com/docs/web-experiment/set-up-a-web-experiment#move).
Click the expand icon to open the drawer and edit CSS style properties.
Changes apply automatically to the current variant.
7. Repeat this process for each element you want to change for your experiment.
8. (_Optional_), click **+** to add another variant.
9. When you're done, click **Continue**.
After you set the experiment, define the experiment's [goals](https://amplitude.com/docs/feature-experiment/workflow/define-goals).
##### To define your experiment's goals
1. In the **Pages** tab, configure which [Pages](https://amplitude.com/docs/web-experiment/pages) your experiment targets. Create new Pages or reuse existing saved Pages. If you're only targeting the page you set on creation, skip this step.
2. From the Include pages where dropdown, specify how Amplitude Experiment identifies these pages.
Use the same pattern to exclude the experiment from pages you select. Learn more about [managing Pages](https://amplitude.com/docs/web-experiment/pages) for precise experiment targeting.
3. Target the users you want to include in this experiment. Go to [audience targeting](https://amplitude.com/docs/web-experiment/targeting#audience-targeting) for more information. Web Experiment audience targeting works differently than Feature Experimentation.
4. Specify any [additional options](https://amplitude.com/docs/feature-experiment/workflow/finalize-statistical-preferences) in the Advanced tab.
5. Click **Save and Close** to finish creating your Web Experiment.
{% callout type="tip" heading="Create a new run of an existing experiment" %}
To re-run an experiment, go to [New Experiment Run](https://amplitude.com/docs/feature-experiment/troubleshooting/new-experiment-run).
{% /callout %}
## Test and preview your web experiment
Before you run your web experiment, Amplitude recommends you test and preview each variant.
##### To test your web experiment
1. Click **Test & Preview**. This puts your experiment in test instrumentation mode, but doesn't begin the experiment. Only users who open the page with the preview link experience your changes.
2. In the modal, click **Preview** to open a new tab that applies the changes you made for that variant.
3. Click the chain link icon to copy the URL to share with others.
Test each variant at least once. Test on more than one page if your experiment targets multiple pages.
If your changes aren't visible, wait up to 60 seconds for caches to refresh. If the changes don't appear correctly after that time, check your configuration for possible issues. To diagnose why an experiment isn't firing, use the [Amplitude Chrome extension](https://amplitude.com/docs/data/chrome-extension-debug#web-experiments) to inspect audience and page targeting, check exposure status, and preview variants.
{% callout type="warning" heading="Ad blockers" %}
Ad blocking plugins or extensions may prevent you from testing and previewing your experiment.
{% /callout %}
## The Visual Editor
The Visual Editor loads the site at the URL you specified on experiment creation and adds an overlay. The Visual Editor gives you access to every element of your site so you can modify the site for your experiment.
{% callout type="note" %}
When you modify your site in the Visual Editor, your live site remains unchanged until you launch the experiment. No changes in the Visual Editor appear on your site in real time.
{% /callout %}
When you click an element, the editing toolbar opens beside the selected element with quick actions such as editing the element's content or [move element](https://amplitude.com/docs/web-experiment/set-up-a-web-experiment#move). Changes in the visual editor apply automatically to the current variant.
To undo or redo changes, click the undo and redo buttons in the visual editor navigation bar, or use the keyboard shortcuts `Cmd+Z` (undo) and `Cmd+Shift+Z` (redo) on macOS, or `Ctrl+Z` (undo) and `Ctrl+Shift+Z` (redo) on Windows and Linux.
This toolbar consists of the following sections and tools:
- Selector
- Styles
- CSS
- HTML
- Move
- Navigation
### Selector
The selector is a unique identifier for the selected element on the current page. Web Experiment disables the selector by default. Update the selector if you're running the experiment on multiple pages, because the generated selector is only unique for the current page. As an alternative, edit the selector to target multiple elements.
#### Stability best practices
- Visual Editor behavior: The editor selects the shortest unique path, which may include dynamically generated class names such as `sm-contentWrapper_ab12c_3`. These class values often include a hash that changes between builds, causing the selector to stop matching.
- When classes have stable substrings: Prefer an attribute selector that matches the stable portion instead of the full hashed class.
```css
/* Instead of a fragile exact class */
.sm-contentWrapper_ab12c_3
/* Use a contains match on the class attribute */
div[class*="contentWrapper"]
```
This continues to match elements like `<div class="sm-contentWrapper_ab12c_3">` even if a later build generates `sm-contentWrapper_d9f7e_1`.
- Most reliable long-term approach: Add a stable attribute (for example, `data-*`) or a unique id to the element you want to modify, and target that.
```html
<div data-test-id="experiment-content"></div>
```
```html
[data-test-id="experiment-content"] /* or */ #experiment-content
```
#### Target elements in shadow DOM
Web Experiment applies variant changes to elements inside **open** shadow DOM trees. The experiment script resolves selectors through shadow boundaries when it applies element changes at runtime.
Web Experiment doesn't support targeting elements inside **closed** shadow roots.
{% callout type="note" %}
Shadow DOM styles are scoped to the shadow tree. Text, visibility, and display changes apply within the shadow boundary and don't leak styles to the rest of the page.
{% /callout %}
### Styles
The Styles tab contains frequently used CSS properties, including font size, font color, text alignment, padding, margin, background color, display, and visibility.
### CSS
The CSS tab lets you define any CSS property and value, which Amplitude applies inline to the selected element.
### HTML
The HTML tab lets you edit the HTML contents of the selected element.
### Move
Move the selected element up or down in the DOM tree to adjust its placement relative to its current node. The Move option appears in the primary tool menu bar. The Move control updates the underlying HTML of your page rather than moving elements by a predefined amount using CSS.
##### To move elements in the page
1. Click the element you want to move.
2. In the editor menu bar, click the **Up** or **Down** arrow buttons to move the element.
The element moves past one surrounding HTML element at a time.
3. Continue clicking the buttons until you move the element into the position you want.
Note the following as you move elements on the page:
- If changes don't apply, confirm you chose the correct selector for the intended element.
- Confirm that CSS styles on your page don't conflict with the updated positioning.
- Confirm that JavaScript doesn't reset your changes after you apply them.
- Moving an element ignores invisible elements in your DOM.
In addition to moving elements up or down, click **Rearrange** to enter preview mode. Preview mode lets you explore different element placements on the page.
### Navigation mode
Navigation mode lets you navigate between pages in your experiment without exiting the editor.
Navigation mode is useful for:
- Experiments spanning multiple pages, such as multi-step forms, checkout flows, or onboarding sequences.
- Editing variants across multiple pages within the same experiment.
##### To enter Navigation mode
1. Open your experiment and access the visual editor.
2. In the primary toolbar at the bottom of the page, click **Navigate**.
3. Navigate your site.
- When you click an element on the page, the element performs its intended function rather than acting as a selection for the experiment.
- If you navigate to a page not included in your experiment and attempt to make edits, the Visual Editor updates the page targeting rule to include the page URL and displays a confirmation message.
4. When you land on the page you want to edit, click the pencil icon to toggle the Visual Editor back to **Edit mode**.
5. Toggle between Edit and Navigation mode as needed to complete your experiment's configuration.
### Mobile Simulator
Mobile Simulator lets you preview and edit your experiment variants as they appear on mobile devices. Use the simulator to test responsive layouts, mobile-specific styling, and touch-friendly designs without leaving the Visual Editor.
{% callout type="warning" heading="Site restrictions" %}
Mobile Simulator loads your site in an iframe. Sites that set `X-Frame-Options: DENY` or `Content-Security-Policy: frame-ancestors 'none'` block this behavior, and the simulator can't display the page.
{% /callout %}
##### To enter Mobile Simulator
1. Open your experiment and access the visual editor.
2. In the primary toolbar at the bottom of the page, select **Mobile** in the device toggle.
================================================================================
# Web Experiment Out-of-the-box Widgets
URL: https://amplitude.com/docs/web-experiment/out-of-the-box-widgets
================================================================================
# Web Experiment Out-of-the-box Widgets
Out-of-the-box (OOTB) widgets let you test new website elements like modals and banners without designing or coding them yourself. OOTB widgets are pre-built, configurable components that you customize directly in the visual editor to match your brand. OOTB widgets remove engineering setup like SDK and UI framework integration, so you can validate ideas, gather learnings, and scale your experimentation program. Saved design presets and reusable styles keep your brand consistent across experiments. For more information on the Visual Editor and setting up a Web experiment, go to [The Visual Editor](https://amplitude.com/docs/web-experiment/set-up-a-web-experiment#the-visual-editor).
OOTB widgets use native Amplitude AI so you can design your Web experiment through conversational prompts instead of supplying precise brand style details.
The OOTB widgets library includes:
- **Buttons**: a call to action (CTA) button. When a customer clicks a CTA button, the button triggers an action, like sending the customer to a shopping cart or to your support agents.
- **Banner**: a notification or messaging bar. Message banners announce important information to your customer, like expected service disruptions, sales, or other communications.
- **Banner with a button**: a notification or messaging bar that includes a CTA button. Banners with buttons announce a specific action you want customers to perform, like applying a promo code to a shopping cart.
- **Modal pop-up**: a pop-up modal that appears on your page after a set amount of time. Modals include CTA buttons and messaging. A pop-up modal appears after a few seconds and encourages customers to take an action, like signing up for an account.
You can also save customized widgets to the library for future use. For example, if you create a notification banner that announces a quarterly sale, you can save that customized message and reuse it later. Everyone in your organization with permission to create experiments can access all saved widgets.
## Add an OOTB widget to a web experiment
You can add an OOTB widget to any Web experiment. After you create your [Web experiment](https://amplitude.com/docs/web-experiment/set-up-a-web-experiment), click **Open Visual Editor**. Click **Widgets** from the top menu bar. The OOTB widgets modal opens, and you can select the widget you want. Drag and drop the widget onto your experiment.
### Edit a widget
By default, you can edit the following aspects of any widget:
- Text.
- Button label.
- Background color.
- Font.
When you select a widget, the element toolbar lets you delete the widget or save the widget to the library.
The Visual Editor displays all changes in real time.
### Customize widget placement
You can freely move banners and buttons around your website:
- Banners can appear at the top or bottom of a page.
- Buttons can appear almost anywhere on the page. After you place a button, it snaps to a grid layout.
You can't customize the location of the pop-up modal, which appears in the center of your page.
For more information on moving banners and buttons, go to [Moving elements](https://amplitude.com/docs/web-experiment/set-up-a-web-experiment#move).
### AI Stylizer
AI Stylizer is an AI assistant in the Visual Editor that helps you refine copy, apply brand-aware styling, and clean up spacing, alignment, and hierarchy in your OOTB widgets. You don't need precise brand style guide details, design experience, or coding skills. Use natural-language prompts to align widgets or elements to your brand's style.
When you select a widget in the Visual Editor, the **AI Stylizer** control appears in the element toolbar as a sparkle icon. Select the control to open the AI Stylizer popover. You can describe what you want in plain language.
For example, enter "Make this headline more urgent", "Create a promotion for summer that contains a 15% discount promocode", or "Make the CTA more action-oriented." AI Stylizer updates the selected element based on your request.
You can use AI Stylizer in the following ways.
When you use AI Stylizer on a pre-built widget (modal, CTA, banner, or promo block), AI Stylizer adapts the element to your brand. AI Stylizer updates typography, colors, and spacing to match your site and can create or refine headline and CTA text so the component looks like part of your product.
- **Headlines:** make headlines more compelling or urgent, simplify and clarify the topic, or tailor headlines for new visitors.
- **Buttons (CTAs):** make CTAs more action-oriented, increase contrast and visibility, and customize CTAs for returning customers.
- **Banners:** make banners more prominent, simplify the messaging, and customize banners for new visitors.
- **Text blocks:** simplify and clarify the content, shift from features to benefits, and customize text for mobile users.
You can choose a preset prompt or enter your own custom prompt. AI Stylizer can generate multiple variants in a single interaction so you can pick the one you want. You can also revert to a previous AI-generated version from the AI Stylizer version history. You can continue to edit AI-created styles and copy after you apply the styles to your experiment. For example, you select a hero headline and ask AI Stylizer to make the headline more urgent or clearer. You like the first design and apply the design to your experiment. After you receive feedback from colleagues, you return and update the headline with their suggestions.
{% callout type="note" heading="Using AI Stylizer on embedded OOTB widgets" %}
You can't use AI Stylizer on an element that contains an embedded OOTB widget. If you try to apply AI Stylizer to such an element, Amplitude displays an error message.
{% /callout %}
================================================================================
# Implement Web Experiment
URL: https://amplitude.com/docs/web-experiment/implementation
================================================================================
# Implement Web Experiment
Web Experiment requires a standalone script that you add to your website. Paste the script into the `<head>` element of your site, as high as possible to avoid flickering.
The script tracks [impression events](https://amplitude.com/docs/web-experiment/tracking#impressions) with the [Browser SDK](https://amplitude.com/docs/sdks/analytics/browser/browser-sdk-2) already installed on your site, or a [third-party analytics SDK](#integrate-with-a-third-party-cdp).
## Add the experiment script
Replace `API_KEY` with your project's API key in one of the synchronous scripts below for your region.
{% code-group %}
```html US Data Center
<script src="https://cdn.amplitude.com/script/API_KEY.experiment.js"></script>
```
```html EU Data Center
<script src="https://cdn.eu.amplitude.com/script/API_KEY.experiment.js"></script>
```
{% /code-group %}
{% callout type="note" heading="Security headers" %}
Your site may need the following security header adjustments to work with Web Experiment.
{% tabs tabs="Content Security Policy, Cross-Origin-Opener-Policy" %}
{% tab name="Content Security Policy" %}
If your site defines the `script-src` content policy directive, add `*.amplitude.com` and `unsafe-inline` to the policy values. These changes enable loading the Web Experiment script and visual editor on your site.
```text
Content-Security-Policy: script-src *.amplitude.com unsafe-inline;
```
{% /tab %}
{% tab name="Cross-Origin-Opener-Policy" %}
If your site sets the `Cross-Origin-Opener-Policy` header, either remove the header or set it to `unsafe-none`. Setting `unsafe-none` allows the visual editor to load on your site.
```text
Cross-Origin-Opener-Policy: unsafe-none
```
{% /tab %}
{% /tabs %}
{% /callout %}
### Async script with anti-flicker snippet
The synchronous script above provides the best experience for your users. To load the script asynchronously, include the following anti-flicker snippet. The snippet masks elements on the page until Amplitude applies all changes. Replace `API_KEY` with your project's API key and set the timeout to control when the anti-flicker mask clears.
{% code-group %}
```html US Data Center
<script>
(function (d, h) {
// TODO: Replace API_KEY with your API key.
var apiKey = "API_KEY";
// TODO: Set a timeout in milliseconds for the anti-flicker.
var timeout = 1000;
// Hides the page and loads the script. Shows page if script fails to load,
// otherwise the script shows the page.
var id = "amp-exp-css";
try {
if (!d.getElementById(id)) {
var st = d.createElement("style");
st.id = id;
st.innerText =
"* { visibility: hidden !important; background-image: none !important; }";
h.appendChild(st);
window.setTimeout(function () {
st.remove();
}, timeout);
var sc = d.createElement("script");
sc.src =
"https://cdn.amplitude.com/script/" + apiKey + ".experiment.js";
sc.async = true;
sc.onerror = function () {
st.remove();
};
h.insertBefore(sc, d.currentScript || h.lastChild);
}
} catch (e) {
console.error(e);
}
})(document, document.head);
</script>
```
```html EU Data Center
<script>
(function (d, h) {
// TODO: Replace API_KEY with your API key.
var apiKey = "API_KEY";
// TODO: Set a timeout in milliseconds for the anti-flicker.
var timeout = 1000;
// Hides the page and loads the script. Shows page if script fails to load,
// otherwise the script shows the page.
var id = "amp-exp-css";
try {
if (!d.getElementById(id)) {
var st = d.createElement("style");
st.id = id;
st.innerText =
"* { visibility: hidden !important; background-image: none !important; }";
h.appendChild(st);
window.setTimeout(function () {
st.remove();
}, timeout);
var sc = d.createElement("script");
sc.src =
"https://cdn.eu.amplitude.com/script/" + apiKey + ".experiment.js";
sc.async = true;
sc.onerror = function () {
st.remove();
};
h.insertBefore(sc, d.currentScript || h.lastChild);
}
} catch (e) {
console.error(e);
}
})(document, document.head);
</script>
```
{% /code-group %}
### Integrate with a third-party customer data platform
If you use a customer data platform (CDP) other than Amplitude to send events, set up an integration to provide user identity information and track events. Without an integration, the script assumes Amplitude Browser SDK is installed on the same site.
The Web Experiment script supports common CDP integrations through an `integration` query parameter in the script URL.
#### Segment integration
Web experimentation supports Segment by default. Add `integration=segment` as a query parameter to the script URL. For example, in Amplitude's US region:
```html
<!-- Replace API_KEY with your project's API key -->
<script src="https://cdn.amplitude.com/script/API_KEY.experiment.js?integration=segment"></script>
```
#### Tealium integration
If you send events through [Tealium](https://amplitude.com/docs/data/source-catalog/tealium) using Tealium iQ or Tealium AudienceStream & Universal Data Hub, you don't need to set up an integration. Tealium loads the Amplitude Analytics SDK onto the site, which integrates directly with the Web Experiment script.
#### Custom integrations
Implement the `IntegrationPlugin` interface and set the `experimentIntegration` window variable to add a custom integration. Place the plugin script before the Web Experiment script tag.
- `getUser(): object`: Return the [experiment user](https://amplitude.com/docs/feature-experiment/data-model#users) object.
- `track(): boolean`: Track the event through a third party. Return `true` if tracking succeeded. Returning `false` causes Amplitude to persist the event and retry at an interval.
- `setup(): Promise<void>`: (Optional) Set up the integration asynchronously. Returns a promise that resolves when the integration can return user information from `getUser()`.
```html
<script>
window.experimentIntegration = {
getUser: () => {
// TODO: Return user
return {
user_id: "user",
device_id: "device",
};
},
track: (e) => {
// TODO: Track event
analytics.track(e.eventType, e.eventProperties);
return true;
},
};
</script>
// TODO: Add the Web Experiment script tag
```
[Contact support](https://amplitude.zendesk.com/hc/en-us/requests/new) for help with a custom integration for your CDP.
## Content management systems
Amplitude Web Experiment supports any content management system (CMS) that supports custom scripts. Amplitude provides plugins for Wordpress and Shopify.
### Wordpress
Amplitude's [Wordpress plugin](https://amplitude.com/docs/data/amplitude-wordpress-plugin) enables Amplitude Analytics, Experiment, and Session Replay.
### Shopify
[Amplitude's Shopify App](https://apps.shopify.com/amplitude) enables Amplitude Analytics, Experiment, and Session Replay on your Shopify site.
{% callout type="warning" heading="Shopify and flickering" %}
The method Shopify uses to load Amplitude's Shopify app causes flickering. To avoid flickering, add the [asynchronous web script with the anti-flicker snippet](#async-script-with-anti-flicker-snippet) to your `theme.liquid` file.
{% /callout %}
## Tag managers
Tag managers, such as Google Tag Manager, load scripts asynchronously, which causes flickering. Tag managers can help you start using the visual editor to create variants while you work on adding the Web Experiment script directly to the page. Amplitude recommends against using tag managers in production.
### Google Tag Manager (GTM)
{% callout type="warning" heading="Causes flicker" %}
Implementing Web Experiment with a tag manager causes flicker. Use a tag manager only when getting started, if adding the script to the site isn't possible.
{% /callout %}
Use a [custom HTML tag](https://support.google.com/tagmanager/answer/6107167) to add the script through GTM.
================================================================================
# Web Experiment actions
URL: https://amplitude.com/docs/web-experiment/actions
================================================================================
# Web Experiment actions
Actions define how variants modify your site. Actions relate to variants rather than a specific page, and apply to specific [Pages](https://amplitude.com/docs/web-experiment/pages) to control where they take effect.
Experiment applies variant actions during evaluation. Evaluation runs on the initial page load and any time state pushes to or pops from the session history. On a history state change, the SDK first reverts all applied element change and custom code actions, then reevaluates and reapplies actions for the updated page.
## Element changes
Element changes modify existing elements on your site. Web Experiment applies these changes by editing the inner text of an element or appending style to the element based on the change you make in the visual editor.
The visual editor supports the following element changes:
- *[Display](https://amplitude.com/docs/web-experiment/set-up-a-web-experiment#display-and-visibility)*: Show or remove the element from the DOM.
- *[Visibility](https://amplitude.com/docs/web-experiment/set-up-a-web-experiment#display-and-visibility)*: Show or hide the element.
- *[Text](https://amplitude.com/docs/web-experiment/set-up-a-web-experiment#text)*: Update an element's inner text, color, and size.
- *[Background](https://amplitude.com/docs/web-experiment/set-up-a-web-experiment#background)*: Update a background image or color.
- *[Move](https://amplitude.com/docs/web-experiment/set-up-a-web-experiment#move)*: Move the position of an element.
## URL redirect
URL redirects load a new URL when a targeted user lands on a targeted page in your experiment. URL redirects happen on the client, and aren't the same as a server redirect with a `3xx` response. Use URL redirect when your variants are different URLs or pages. For example, use it to test landing pages or different versions of a page built in a CMS. URL redirect works with standard A/B tests and [multi-armed bandits](https://amplitude.com/docs/feature-experiment/workflow/multi-armed-bandit-experiments).
URL redirects retain any query parameters on the original page URL. For example, you create a variant to redirect users from `https://example.com` to `https://example.com/get-started`. If a user clicks a link `https://example.com?utm_source=facebook`, Web Experiment redirects that user to `https://example.com/get-started?utm_source=facebook`.
### Set up a URL redirect
Set up URL redirect through the [Visual Editor](https://amplitude.com/docs/web-experiment/set-up-a-web-experiment#the-visual-editor) as a variant action. To add a URL redirect to a treatment variant, follow these steps:
1. [Create a Web Experiment](https://amplitude.com/docs/web-experiment/set-up-a-web-experiment) and open the Visual Editor.
2. Click the Treatment three-dot menu, select **Edit**, then under **Action** select **URL Redirect**.
3. In the URL Redirect panel, add each URL you want to test as a separate variant and click **Apply**.
### Configuration limits
Visual experimentation and Amplitude's low-code implementation apply the following limits when you use URL redirect:
| Setting | Limit | Reason |
|---|---|---|
| Evaluation mode | `local` | Optimizes test performance and minimizes latency impact to end users. |
| Bucketing unit | `User` | Evaluation mode is `local`. |
| Keys | `deviceID` | Evaluation mode is `local`. |
| Audience | `all users` | URL redirect logic uses local evaluation mode. |
| Deployment | Project API key | Simplifies setup requirements. |
{% callout type="note" %}
It's possible for the URL redirect test to have a [Sample Ratio Mismatch (SRM)](https://amplitude.com/docs/feature-experiment/troubleshooting/sample-ratio-mismatch). Redirect tests work by loading the redirected page, ideally as fast as possible. The sequence for this is:
Control flow:
- Load control page HTML.
- Browser parses and loads dependencies (including the experiment script).
- Experiment script initializes, evaluates the user, and logs an impression if the user is in control.
Treatment flow:
- Load control page HTML.
- Browser parses and loads dependencies (including the experiment script).
- Experiment script evaluates the user, assigns the user to treatment, and triggers a redirect.
- Load treatment page HTML.
- Browser parses and loads dependencies (including the experiment script again).
- Experiment script initializes and logs the impression for treatment.
Because the treatment flow involves more steps before logging the impression, users who bounce quickly (for example, after clicking an ad by mistake) are more likely to count in control than in treatment. This imbalance can appear as Sample Ratio Mismatch (SRM).
Researchers report similar effects: if treatment slows performance, more users leave before impressions log, which reduces recorded impressions. Faster performance has the opposite effect, producing more recorded users in treatment than in control.
To resolve SRM, follow these guidelines:
- Reduce latency in evaluation. The longer the delay before logging impressions, the more pronounced the SRM effect.
- Use local evaluation where possible. For example, target only on browser properties instead of slower remote attributes like Country. Local evaluation reduces the chance that users drop off before logging. The following configuration example shows local evaluation in Amplitude Experiment.
Further reading:
- [Causes of SRM](https://www.lukasvermeer.nl/srm/docs/causes/)
- [Pitfalls in Metric Interpretation (KDD 2017)](https://exp-platform.com/Documents/2017-08%20KDDMetricInterpretationPitfalls.pdf)
- [Diagnosing SRM in Online Experiments (KDD 2019)](https://exp-platform.com/Documents/2019_KDDFabijanGupchupFuptaOmhoverVermeerDmitriev.pdf)
{% /callout %}
### SEO best practices for redirects
Client-side redirects in experiments can affect how search engines index and rank your pages. Follow these best practices to minimize SEO impact.
#### Use temporary redirects during tests
Web Experiment uses client-side redirects that simulate a `302` temporary redirect through `window.location.replace`. The `302` signal tells search engines to keep the original URL indexed during the experiment. Don't use `noindex` tags on your control page, because `noindex` removes the page from search results.
After you pick a winner, implement a permanent server-side `301` or `308` redirect to consolidate link equity to the winning URL.
#### Add canonical tags on variant pages
Add a canonical tag on your experiment variant page that points back to the original (control) URL. The canonical tag prevents search engines from indexing the variant as a separate page.
```html
<!-- On the variant/redirect destination page -->
<link rel="canonical" href="https://example.com/original-page" />
```
#### Prefer server-side redirects for SEO-critical pages
For pages where SEO is critical, consider using server-side assignment and redirects at the edge (CDN) or server level. Server-side redirects execute before the page renders, which:
- Ensures search engine crawlers interpret redirects reliably.
- Minimizes page flicker for users.
- Provides proper HTTP status codes to crawlers.
If you must use client-side redirects, make sure the redirect logic runs in the `<head>` to reduce layout shift.
#### Keep tests short and avoid cloaking
Don't show different content or URLs to users compared to what Googlebot sees. Search engines consider this practice cloaking and may penalize your site. End experiments promptly and remove test logic after concluding to avoid SEO drift.
#### Ensure goals cover both URLs
Define conversion goals that include both control and variant URLs. Web Experiment [preserves query parameters](#url-redirect) through redirects, so attribution and session continuity stay intact.
#### Use Search Console if issues arise
If a search engine indexes your experiment variant page unexpectedly, use [Google Search Console's URL removal tool](https://search.google.com/search-console/removals) as a temporary fix while you address the underlying issue.
## Custom code
{% callout type="note" %}
Custom code requires a Growth or Enterprise plan.
{% /callout %}
Web Experiment applies custom code actions as an optional part of the element changes action. Use the custom code action to write JavaScript, CSS, and HTML that adds elements or customizes your site in ways the visual editor doesn't support.
Apply custom code to specific [Pages](https://amplitude.com/docs/web-experiment/pages) using the **Apply to** dropdown. The dropdown lets you run different code depending on which Page is active.
{% callout type="tip" %}
You can use custom code together with the [element changes](#element-changes). For example, an engineer can build a custom code component with placeholder text. A non-technical user can then use the visual editor to edit the placeholder text without touching the custom code.
{% /callout %}
Web Experiment applies custom code to your site in the following order:
1. Adds CSS in a `<style>` tag in the page's `<head>`.
2. Parses HTML into a DOM element.
3. Wraps JavaScript in a function, and adds it to a `<script>` tag in the page's `<head>`.
4. Calls the wrapped JavaScript function and passes parsed HTML and utilities as arguments.
### JavaScript
Web Experiment wraps any custom JavaScript in a function, and calls the function when the variant action applies. The function has two parameters you can use with your custom JavaScript code.
- `html`: The custom HTML code parsed as a DOM element object.
- `utils`: An object that contains utility functions you can use in your custom code.
#### Utilities
Web Experiment provides the following utilities:
- `waitForElement(selector: string): Promise<Element>`: Returns a promise that resolves when `waitForElement` finds an element matching the selector in the DOM. Uses `MutationObserver` to listen for elements.
- `remove: (()=> void) | undefined`: A function that you can set inside the JavaScript you inject. Web Experiment calls the `remove` function on page change, when Amplitude reevaluates experiments and reapplies variants.
The `remove` function is useful for cleaning up changes to the page in single page apps, where the page doesn't fully reload. For example, if you inject an HTML element on a specific page, set the `remove` function to remove that element when the page changes.
### HTML
Web Experiment parses custom HTML as a DOM element, and passes the element to the custom JavaScript code for insertion. The custom HTML can use existing CSS styles and classes, or new CSS that you define.
### CSS
Use custom CSS styles to manipulate existing CSS classes and styles, or add new styles for elements you add with custom HTML. Web Experiment adds custom CSS to a `<style>` tag in the page's `<head>` element.
### Examples
{% callout type="tip" %}
Generative AI like ChatGPT or equivalents can create HTML and CSS for simple elements. ChatGPT generated the initial modal and banner examples that follow, and Amplitude then modified them.
{% /callout %}
#### Insert an element
To insert an element onto your page, follow this pattern:
1. Write the HTML and CSS for the element you want to add to the page.
2. Identify the selector of the parent element you want to insert your new element into. The parent is often the `body`.
3. Paste the following JavaScript code, and update `PARENT_SELECTOR` with the parent element selector from step 2.
```js
utils.waitForElement("PARENT_SELECTOR").then(function (e) {
e.appendChild(html);
utils.remove = function () {
html.remove();
};
});
```
If you want to insert your element into the parent element at a specific position, use `insertBefore()` instead of `appendChild()`.
#### Add a banner
This example adds a discount code banner to the top of the page.
{% code-group %}
```js JS
utils.waitForElement("body").then(function (e) {
e.insertBefore(html, e.firstChild);
utils.remove = function () {
html.remove();
};
});
```
```css CSS
.announcement-banner {
background-color: #fafafa;
color: #333;
padding: 10px;
text-align: center;
font-family: Arial, sans-serif;
border-bottom: solid #e5e5e5;
border-bottom-width: 1px;
}
.announcement-banner p {
margin: 0;
font-size: 16px;
}
```
```html HTML
<div class="announcement-banner">
<p>🎉 Big Sale: Get 25% off on all items! Use code <strong>SAVE25</strong></p>
</div>
```
{% /code-group %}
#### Add a modal
This example adds a modal to the page after a 1 second delay.
{% code-group %}
```js JS
var modal = html;
utils.waitForElement("body").then(function (body) {
// Append the modal element to the body.
body.appendChild(modal);
// Get the close button element
var closeBtn = document.getElementsByClassName("close")[0];
// When the user clicks on the close button (x), close the modal
closeBtn.onclick = function () {
modal.style.display = "none";
};
// When the user clicks anywhere outside of the modal, close it
window.onclick = function (event) {
if (event.target == modal) {
modal.style.display = "none";
}
};
// Show the modal after a 1 second delay.
window.setTimeout(function () {
modal.style.display = "block";
}, 1000);
// Remove the modal on teardown.
utils.remove = function () {
modal.remove();
};
});
```
```css CSS
/* TODO: Style the action button */
.cta-btn {
color: white;
background-color: #000;
border: #000 solid 1px;
}
.cta-btn:hover {
color: black;
background-color: #fff;
border: #000 solid 1px;
}
/*
* Modal Boilerplate
*/
/* Modal container */
.modal {
display: none; /* Hidden by default */
position: fixed;
z-index: 1; /* Stay on top */
left: 0;
top: 0;
width: 100%; /* Full width */
height: 100%; /* Full height */
background-color: rgba(0, 0, 0, 0.5); /* Black background with opacity */
}
/* Modal content box */
.modal-content {
background-color: #fff;
margin: 15% auto; /* Center the modal */
padding: 20px;
border-radius: 4px;
border: 1px solid #888;
width: 40%; /* Width of the modal */
max-width: 800px;
position: relative;
}
/* Close button */
.close {
color: #999;
float: right;
font-size: 28px;
font-weight: bold;
}
.close:hover,
.close:focus {
color: #000;
text-decoration: none;
cursor: pointer;
}
/* Modal header */
.modal-header {
margin: 0;
padding: 0 0 15px 0;
font-size: 24px;
font-weight: bold;
}
/* Modal body */
.modal-body {
margin: 20px 0;
font-size: 16px;
}
/* Call to Action container */
.cta-container {
text-align: right;
}
/* Call to Action button */
.cta-btn-base {
padding: 10px 20px;
font-size: 16px;
cursor: pointer;
bottom: 20px;
right: 20px;
}
```
```html HTML
<div class="modal">
<div class="modal-content">
<span class="close">×</span>
<h2 class="modal-header">
<!-- TODO: Update modal header text -->
Join the mailing list!
</h2>
<p class="modal-body">
<!-- TODO: Update modal body text -->
To get updates on new posts to the blog join the exclusive mailing list
today!
</p>
<div class="cta-container">
<!-- TODO: Update button link -->
<a href="https://example.com">
<button class="cta-btn cta-btn-base">
<!-- TODO: Update CTA button text -->
Subscribe
</button>
</a>
</div>
</div>
</div>
```
{% /code-group %}
================================================================================
# Web Experiment Pages
URL: https://amplitude.com/docs/web-experiment/pages
================================================================================
# Web Experiment Pages
In a Web Experiment, Pages scope variants to specific URLs so you can run tests on targeted pages without affecting unrelated parts of your site.
A Page defines the conditions under which a web experiment applies to your site, and includes:
- A unique name.
- URL targeting conditions.
- A page trigger.
- A Visual Editor URL to help preview the experiment.
## Create a page
When you create a new Web Experiment, specify a page by:
- **Manual URL input**: Enter a specific URL to define the page.
- **Import a saved page**: Select a page from a previous experiment.
After you add the page, continue with experiment setup, or go directly to the Visual Editor.
## Update a page or create another page
You can update or create another page for any Web experiment.
1. Go to _Experiments_ and select the Web experiment you want.
2. Go to _Settings > Pages_ for the Web experiment.
3. Rename the page, update its Visual Editor URL, configure the page trigger, or update the page targeting rules.
4. Select **Select a page** to add another page:
1. Select **Custom** to open the Page details information for the second page.
2. Name the page and enter the Visual Editor URL, Trigger Type, and Triggering Rules.
5. Select **Save Changes**.
### Page targeting rules
- **URL Matches**
- **Description**: Match the page URL, ignore query parameters or hash fragments.
- **Examples**:
- `https://example.com/pricing`
- ✅ https://example.com/pricing#details
- ❌https://example.com/pricing/enterprise
- **URL Matches Exactly**
- **Description**: Match the full page URL exactly.
- **Examples**:
- `https://example.com/pricing?utm_source=facebook`
- ❌https://example.com/pricing
- ❌ https://example.com/pricing?utm_source=tiktok
- **URL Matches Pattern**
- **Description**: Match the full page URL, including wildcards (`*`).
- **Examples**:
- `https://example.com/blog/*`
- ✅ https://example.com/blog/my-first-post
- ✅ https://example.com/blog/my-second-post#get-started
- **URL Contains**
- **Description**: Match the full page URL, where the URL contains a specific substring.
- **Examples**:
- `/blog/my-first`
- ✅ https://example.com/blog/my-first-post
- ❌ https://example.com/blog/my-second-post
- **URL Starts With**
- **Description**: Match the full page URL, where the URL starts with an exact substring.
- **Examples**:
- `https://example.com/blog`
- ✅ https://example.com/blog/my-first-post
- ❌ https://example.com/pricing
- **URL Ends With**
- **Description**: Match the full page URL, where the URL ends with an exact substring.
- **Examples**:
- `/blog/my-first-post`
- ✅ https://example.com/blog/my-first-post
- ❌ https://example.com/blog/my-first-post#get-started
- **URL Matches Regex**
- **Description**: Match the full page URL with a regular expression you define.
- **Examples**:
- [Learn Regex](https://www.regular-expressions.info/quickstart.html)
- [Test Regex](https://regex101.com/)
### Page triggers
{% early-access %}
This feature is in Early Access and may continue to evolve. This documentation may not reflect the latest updates.
{% /early-access %}
Page triggers define when an experiment evaluates a Page's conditions to determine whether the experiment activates on a webpage. Page targeting rules determine where an experiment runs; page triggers determine when variant actions apply.
When you create a new experiment, the default trigger type is **Immediately**. Immediate triggers evaluate the page conditions whenever the URL changes, including initial page load. Configure other trigger types to activate the experiment based on user behavior, page events, or custom conditions.
#### Trigger types
- **Immediately**
- **Description**: Evaluates when the URL or route changes.
- **Parameters**: None
- **On Event Tracked**
- **Description**:
- Evaluates when a specific Amplitude analytics event occurs.
- If you don't load Analytics and Web Experiment together through the unified script tag, call `window.amplitude.add(window.webExperiment.plugin())` to ensure the web experiment client receives tracked event notifications.
- **Parameters**:
- Event name.
- Optional property filters to match specific event property values.
- **Limitation**: Property filters only match properties present in the raw event payload at the time the SDK tracks the event. Properties that Amplitude computes or enriches server-side aren't available in the client-side event object and can't satisfy a filter condition. This includes derived properties, lookup properties, and array-expanded properties (for example, `products.label`). Use only properties your instrumentation explicitly sets when calling the tracking method.
- **When Element Appears**
- **Description**: Evaluates when an element matching a CSS selector appears in the DOM.
- **Parameters**: CSS selector of the element.
- **When Element Becomes Visible**
- **Description**: Evaluates when an element becomes visible in the viewport.
- **Parameters**:
- CSS selector of the element.
- Optional visibility ratio (0-100) that defines how much of the element must be visible.
- **After Time on Page**
- **Description**: Evaluates after the user spends a minimum amount of continuous time with the page in focus.
- **Parameters**: Duration in seconds.
- **When User Exits**
- **Description**: Evaluates when the cursor moves upward toward the top of the viewport.
- **Parameters**: Optional minimum time (in seconds) the user must spend on the page before exit intent can trigger.
- **When Scrolled To**
- **Description**: Evaluates when the user scrolls to a specific element or scroll percentage.
- **Parameters**:
- Element mode: CSS selector and pixel offset from the bottom of the viewport. Positive values trigger before the element enters view, negative values trigger after the element is partially visible.
- Percent mode: Percentage of page scrolled (0-100).
- **When User Interacts**
- **Description**: Evaluates on click, hover, or focus of a specified element.
- **Parameters**:
- CSS selector of the element.
- Interaction type (click, hover, or focus).
- Optional time threshold in milliseconds. For hover and focus, the user must maintain the interaction for this duration before the trigger fires. For click, the trigger fires after this delay.
- **Manual**
- **Description**: Evaluates when a developer calls `window.webExperiment.toggleManualPageObject(name, active)`. Pass the name identifier and `true` to activate the page object, or `false` to deactivate.
- **Parameters**: Name identifier that matches the manual trigger key configured in the page settings.
{% callout type="note" heading="Trigger evaluation" %}
When a trigger fires, the experiment evaluates the page's targeting conditions. If the conditions match, the page becomes active. Triggers don't bypass conditions: the experiment activates only when both the trigger and the targeting rules match.
{% /callout %}
## Manage page scope for variants
Scope each variant to a specific page so the variant's changes apply only where you intend. Page scoping applies to all variant types.
### Visual editor
When you use the Visual Editor to make changes, such as text edits or style updates, those changes associate with the page you select during the preview session. For each change, specify the page or pages it applies to.
Page scoping in the Visual Editor lets you:
- Assign updates or changes to a specific page.
- Avoid applying the same change across all views.
- Maintain better isolation and clarity across your experiment setup.
{% callout type="tip" heading="Validate the page scope" %}
Check the page scope for each change to avoid cross-page conflicts or unintended edits.
{% /callout %}
### Custom code
When you add custom code or URL redirects as variants, explicitly define which page or pages the variant applies to.
Page scoping lets you create a single experiment that includes custom code with different behaviors, depending on the active page.
### URL redirect
Select the page in the URL redirect variant's settings. Scoping the redirect to a specific page or set of pages ensures that Amplitude redirects users only when the specified page is active.
## Technical details
- The experiment evaluates pages after bucketing, so a page's variant affects only users who qualify for the experiment.
- Amplitude deactivates pages that conflict with other pages in your experiment.
## Known limitations
- `On Event Tracked` property filters can only match raw event properties sent by the SDK at tracking time. Server-side properties, including derived properties, lookup properties, and array-expanded properties, aren't available at trigger evaluation time, so you can't use them as filter conditions.
- Pages aren't available in:
- Feature Flags.
- Experiment Templates.
- Management API.
- Experiments that you convert to templates or flags.
- You can't delete or archive a page.
- Amplitude doesn't include pages in universal search or experiment table views.
- Pages don't appear in alerts or notifications.
================================================================================
# Web Experiment targeting
URL: https://amplitude.com/docs/web-experiment/targeting
================================================================================
# Web Experiment targeting
Web Experiments target both pages and audiences. Amplitude evaluates page targeting first, then audience targeting. Both targeting methods evaluate locally in the browser when the page first loads.
Web Experiments use [Pages](https://amplitude.com/docs/web-experiment/pages) to control where experiment variants apply on your website. Pages define when a web experiment applies, including targeting conditions that match specific URLs and visual editor URLs for previewing experiments.
## Audience targeting
By default, a new Web Experiment targets all users. Audience targeting lets you target specific users for your experiment. Users outside the target audience receive the default experience and don't count towards analysis.
If any segment matches, Amplitude buckets that user into a variant based on the rollout and variant distribution. For a segment to match, the user must meet all conditions you set.
### Browser properties (local)
Browser properties are available client-side and don't require network requests, so Amplitude evaluates them with low latency.
| Parameter | Description |
| ------------------------------------ | --------------------------------------------------------------------------------------------------------------------------------------------------------------------------------------------------------------------------------------------------------------------------------------------------------------------------------------------------------------------------- |
| New Users | A new user that Amplitude first sees after a specified date. When the Web Experiment SDK first sees a user, the SDK stores the date in local storage and never updates the date. This rule may not function as intended shortly after the initial script installation, when all users are new. The New Users rule isn't the same as new user queries in charts and cohorts. |
| Returning Users | A returning user that Amplitude first sees before a certain date. The same local considerations apply as with New Users. |
| Referring URL | Matches users who land on your site from a specific referrer. For more information, refer to [document.referrer](https://developer.mozilla.org/en-US/docs/Web/API/Document/referrer) on MDN. |
| Landing Page URL | The SDK sets the landing page URL in session storage when the SDK loads. |
| URL Query Parameters (Not persisted) | The current query parameters on the page at the time of evaluation. Use this rule for UTM parameter targeting. |
| URL Query Parameters (Persisted) | The query parameters that Amplitude stores locally to maintain variant assignments across navigations or reloads. Use this rule when you need consistent UTM-based targeting beyond the initial page visit. |
| Device Category | Target users by their device type. `Desktop`, `Mobile`, or `Tablet`. |
| User Agent | Target based on the user agent. Useful for targeting bots. For example, exclude all users where user agent contains `Googlebot`. |
| Cookies | The cookies in the window at the time of evaluation. |
| Language | The language in the user's browser. |
| Browser | The user's browser: `Safari`, `Chrome`, `Firefox`, `Edge`, `Opera`. |
| Freeform properties | Custom user properties that the [`IntegrationPlugin`](https://amplitude.com/docs/web-experiment/implementation#integrate-with-a-third-party-customer-data-platform) sets. |
### Real-time behavioral targeting (local)
{% early-access %}
Real-time behavioral targeting is in Early Access. Behavior and APIs may change before general availability.
{% /early-access %}
Real-time behavioral targeting lets you target users based on actions they perform during their current and previous sessions. Amplitude evaluates these conditions in real time as users perform Amplitude events, without network requests.
When users become eligible: the moment a behavioral condition becomes true (for example, after the 5th article view), users become eligible and Amplitude buckets them into the experiment.
How it works: the Web Experiment SDK listens to Amplitude events as they fire in the browser, stores behavioral signals in localStorage, and evaluates targeting conditions in real time.
The SDK persists events for real-time behavioral targeting only when the events appear in your targeting conditions and the experiment is on. There's no historical look-back before you turn on the experiment, so the effective evaluation window is whichever is shorter: the time window you set, or how long the experiment has been running.
{% callout type="note" %}
If you don't load Analytics and Web Experiment together through the unified script tag, call `window.amplitude.add(window.webExperiment.plugin())` so the web experiment client receives tracked event notifications.
{% /callout %}
#### Supported conditions
Real-time behavioral targeting supports event-based conditions:
- Event counts: target users who performed an event a specific number of times.
- Time windows: evaluate behavior within the current session or over a specific time period (last X hours or days).
- Property filtering: combine multiple property conditions with AND logic (for example, "where `category = 'electronics'` AND `item_value > 200`").
- Cross-page tracking: behavioral signals persist across page navigations and browser sessions.
#### Example targeting rules
| Use case | Targeting rule |
| ---------------------------- | ----------------------------------------------------------------------------------------------------------- |
| Engaged readers | User performed `page_view` ≥ 5 times this session. |
| Article readers | User performed `page_view` where `page_type = 'article'` ≥ 5 times this session. |
| Frequent visitors | User performed `page_view` ≥ 10 times in last 30 days. |
| Premium electronics shoppers | User performed `add_to_cart` where `category = 'electronics'` AND `item_value > 200` ≥ 1 time this session. |
#### Real-time behavioral targeting vs. cohorts
| Feature | Real-time behavioral targeting | Cohort targeting |
| ------------------------------- | ----------------------------------------------------------------------------- | ----------------------------------------------------------------------------------------------------------------------------------------------------------------------------------------------------- |
| Where it runs | Client-side (browser) | Amplitude servers |
| When users become eligible | Instantly, as the event fires | Approx 1 min or 1 hour depending on type of cohort ([Syncs](https://amplitude.com/docs/data/destinations/syncs), [Cohort Targeting](https://amplitude.com/docs/feature-experiment/cohort-targeting)). |
| Network request needed | No | Yes |
| Can target mid-session behavior | Yes | No |
| Time window | Shorter. Supports current session, or rolling window of last X hours or days. | Longer. Supports specific intervals and rolling window up to last 12 months. |
| Best for | In-session intent signals (cart adds, page views, engagement depth) | Historical behavior, complex queries, long lookback windows |
Use real-time behavioral targeting when:
- You react to what a user does in this session, not only what they did days or weeks ago. For example, you show a discount after someone views three product pages this session.
- You target behavior that isn't in a cohort yet, including anonymous users who aren't synced to a cohort but show intent during the current session.
- You run experiments tied to high-intent moments: cart abandonment, repeat page views, scroll depth, where the targeting condition and the experiment need to resolve in the same session.
- You need eligibility to update the instant the user crosses the threshold, without waiting on cohort refreshes or remote membership checks.
Use cohorts instead when:
- You target stable attributes or longer historical patterns, such as users who purchased three or more times in the last 90 days or users in a curated churn-risk cohort.
- You target behavior from before the experiment started. Real-time behavioral targeting only persists events after you turn on the experiment.
- You need complex server-side queries across historical data beyond a few weeks.
### User properties (remote)
You can perform advanced targeting based on [Amplitude ID resolution](https://amplitude.com/docs/feature-experiment/remote-evaluation#amplitude-id-resolution), [IP geolocation](https://amplitude.com/docs/feature-experiment/remote-evaluation#geolocation), [property canonicalization](https://amplitude.com/docs/feature-experiment/remote-evaluation#canonicalization), [behavioral cohorts](https://amplitude.com/docs/feature-experiment/remote-evaluation#cohort-membership), and historical [user properties](https://amplitude.com/docs/feature-experiment/remote-evaluation#user-properties). Targeting user properties may increase page display latency because Amplitude needs to make network requests.
| Parameter | Description |
| -------------------------- | ------------------------------------------------------------------------------------------------------- |
| Enriched User Properties | Properties that [user enrichment](https://amplitude.com/docs/feature-experiment/remote-evaluation#user-enrichment) resolves. |
| Amplitude User Properties | Amplitude Analytics' historical user data. |
| Experiment User Properties | The variant that other experiments assigned to the user. |
| User Cohorts | A set of [users](https://amplitude.com/docs/feature-experiment/cohort-targeting) that you define in Amplitude. |
#### Page display delay
When active web experiments [target](https://amplitude.com/docs/web-experiment/targeting#page-targeting) a page, Amplitude injects an anti-flicker overlay if at least one experiment targets the page and has "Anti-flicker" on. The overlay is a blank element that covers your page while it loads. Amplitude removes the overlay after it evaluates the remote properties, or after a 1-second timeout.
## Bucketing
Bucketing refers to the variant a user sees, based on the rollout and distribution. Rollout is the percentage of users in the experiment. Distribution defines which variant a user experiences if the user is in the rollout. Web Experiment distributes variants evenly by default. Amplitude recommends this distribution.
Bucketing stays consistent when the user has the same ID. Because most experiments bucket by Device ID, Web Experiment may place users in a different bucket if they visit on a new device, browser, or use private browsing.
Increasing rollout doesn't re-bucket users who're already in the rollout. For example, if your experiment has rolled out to 10% of users, and you increase the rollout to 50%, the original 10% of users don't change variants. If you change the distribution from evenly distributed to `20% -> control, 80% -> treatment`, users who started in the control jump to the treatment.
### Cross-subdomain identity
Experiments created on or after July 13, 2026 bucket users with a cross-subdomain identity, so a user keeps the same variant across subdomains of the same domain (`www.example.com`, `shop.example.com`). Amplitude fixes this at experiment creation; editing or restarting an experiment doesn't change it.
## Mutual exclusion, holdout groups, and dependencies
{% early-access %}
Mutual exclusion groups, holdout groups, and flag dependencies for Web Experiment are in Early Access. Behavior and APIs may change before general availability.
{% /early-access %}
Web experiments support [mutual exclusion groups](https://amplitude.com/docs/feature-experiment/advanced-techniques/mutually-exclusive-experiments), [holdout groups](https://amplitude.com/docs/feature-experiment/advanced-techniques/holdout-groups-exclude-users), and [flag dependencies](https://amplitude.com/docs/feature-experiment/under-the-hood/flag-dependencies).
- **Mutual exclusion**: Add an experiment to a mutual exclusion group to prevent users from seeing it alongside another experiment. Mutual exclusion groups can contain a mix of web and feature experiments.
- **Holdout groups**: Add an experiment to a holdout group to measure long-term impact by withholding a percentage of users. Holdout groups can contain a mix of web and feature experiments.
- **Flag dependencies**: Flag dependencies let you gate one experiment on the result of another — for example, only evaluate experiment B if the user is in the treatment variant of experiment A. Web experiments support flag dependencies, but a web experiment can only depend on other web experiments — not on feature flags or feature experiments.
================================================================================
# Web Experiment performance
URL: https://amplitude.com/docs/web-experiment/performance
================================================================================
# Web Experiment performance
Web Experiment intentionally minimizes its impact on page performance.
## Script size
The Web Experiment script is dynamic and includes all your experiment configurations to avoid multiple synchronous downloads. Script size starts at a base size and scales with each experiment.
| | Uncompressed | Compressed |
| ------------- | ------------ | ---------- |
| Base script | 79KB | 20KB |
| Per-flag size | ~1KB | ~100B |
To avoid constantly increasing script sizes, deactivate or archive experiments when they're complete.
{% callout type="note" heading="Custom code impact on flag size" %}
Custom code increases a flag's code size by the size of the custom code itself.
{% /callout %}
## Caching
Web Experiment uses two caching layers: CDN and browser. The two layers make script delivery to your site more reliable.
### CDN cache
Amplitude caches the Web Experiment script on a CDN. When a user requests the script, the browser loads the script from the CDN if another user loaded it in the same geographic area. The CDN cache has a max age of one minute and serves stale content for up to one hour while the script reloads. If the origin returns an error, the CDN serves a stale response for the maximum time possible.
The cache control response header that configures CDN caching is:
`max-age=60,stale-while-revalidate=3600,stale-if-error=31536000`
### Browser cache
The browser cache serves the Web Experiment script without a network request for 60 seconds, or for the maximum time if the server returns an error. The browser cache serves the script from memory (0ms latency) when a user loads multiple pages on your site, or reloads the same page within a one-minute window.
The cache control response header that configures browser caching is:
`max-age=60,stale-while-revalidate=3600`
## Evaluation
Web Experiment evaluation runs locally using information available synchronously in the browser. Evaluation is CPU bound and usually takes less than 1ms to apply variant actions.
## Ad blockers
Amplitude can't identify users with ad blocking software enabled. Those users don't log assignment events or impressions, and don't experience the experiment.
================================================================================
# Web Experiment event tracking
URL: https://amplitude.com/docs/web-experiment/tracking
================================================================================
# Web Experiment event tracking
Web Experiment uses impression events for analysis and billing. The Web Experiment script tracks impression events through the [integration](https://amplitude.com/docs/web-experiment/implementation#integrate-with-a-third-party-customer-data-platform). Experiment analysis requires impression event tracking.
## Impression events
The impression event is the same as the Feature Experiment [exposure event](https://amplitude.com/docs/feature-experiment/under-the-hood/event-tracking#exposure-events), but has a different event type: `[Experiment] Impression`. Event properties contain the flag key and the variant of the flag or experiment that the user encountered.
When Amplitude ingests an impression event, Amplitude uses the flag key and variant to set or unset user properties on the user associated with the event. Setting user properties is essential for experiment analysis queries on primary and secondary success metrics.
### Impression transformation
Web Experiment sends impression events in one form, and Amplitude transforms them into Amplitude-standard impressions upon ingestion. Amplitude modifies the event type and event properties for consistency with other Amplitude properties. Amplitude sets or unsets experiment user properties for accurate experiment analysis. If you're tracking impressions through a 3rd party customer data platform (CDP), the CDP records the event in its pre-transformation state.
| Property Type | Pre-transformation | Post-transformation |
| -------------- | ------------------ | ----------------------------- |
| Event Type | `$impression` | `[Experiment] Impression` |
| Event Property | `flag_key` | `[Experiment] Flag Key` |
| Event Property | `variant` | `[Experiment] Variant` |
| Event Property | `experiment_key` | `[Experiment] Experiment Key` |
## Estimate monthly impressions
Amplitude tracks one impression event per experiment when Web Experiment applies a variant action to a page. To estimate the number of impressions per month, consider:
1. `M` = Your volume of monthly tracked users (MTU).
2. `E` = The number of experiments you run per month.
3. `P` = The average number of page views per user, per month.
Impressions Estimate = `M * E * P`
This estimate provides an upper bound. Target specific pages and audiences, or roll out to a subset of users to reduce the total number of impressions.
================================================================================
# Post-experiment steps
URL: https://amplitude.com/docs/web-experiment/post-experiment
================================================================================
# Post-experiment steps
Web experiments in Amplitude Experiment help you test hypotheses, validate ideas, and make data-informed product decisions. After you identify a winning variant, Amplitude recommends moving that variant to your production code base instead of keeping the experiment live at 100% traffic allocation.
## When the experiment concludes
When you're ready to end the experiment and select a winner:
1. **Analyze the results and confirm a winner**. Confirm the experiment reached statistical significance and that the winning variant aligns with business goals.
2. **Implement the winner in code**. Work with your engineering team to replicate the winning experience in your production code base. For more information, go to [Benefits to migrating your winning variant](#benefits-to-migrating-your-winning-variant).
3. **Deactivate or archive the experiment in Amplitude**. Disable the experiment to remove unnecessary logic and prevent accidental reactivation or analysis confusion.
4. **Document the outcome**. Capture experiment details like the goal, key learning, decision made, and implementation follow-up in an internal knowledge base.
### Activate a feature flag
If your change needs rollback capability or an incremental rollout, use a feature flag. Feature flags enable ongoing control without the overhead of experiment logic and metadata.
## Benefits to migrating your winning variant
Moving your winning variant to your production code base provides the following benefits:
- **Performance and user experience**: Running web experiments at 100% adds avoidable client-side overhead to your pages. The overhead increases page load execution time and can negatively impact performance, especially at scale. For more information about how Amplitude optimizes for performance, go to [Web Experiment Performance](https://amplitude.com/docs/web-experiment/performance).
- **Technical debt**: Long-running experiments add clutter to dashboards and experiment environments. Leaving experiments active after a decision causes unnecessary configuration overhead and increases the risk of user-facing errors.
- **Platform cost and impression volume**: Each experiment evaluation counts toward your monthly impression volume in Experiment. When you run a test at 100% after it no longer provides learning, the experiment still evaluates on each page load. Over time, these evaluations increase your costs and create budgeting inefficiencies.
================================================================================
# Proxy Web Experiment
URL: https://amplitude.com/docs/web-experiment/proxy
================================================================================
# Proxy Web Experiment
You might prefer not to load third-party experimentation scripts directly from vendor-hosted domains, or you might want to perform client-side experiment evaluation. Common reasons include security policies, privacy controls, and tighter infrastructure ownership.
A proxy-based experimentation architecture lets teams keep full control over script delivery, evaluation, and exposure tracking while using a centralized experimentation platform.
This document outlines common proxy patterns and the implementation details that support them.
## Script delivery proxy
Customers host a lightweight endpoint that proxies requests for the experimentation JavaScript SDK. End users load the script from a customer-owned domain rather than a third-party domain.
This pattern lets you:
- Reduce third-party script exposure.
- Align with internal security or compliance requirements.
### CDN configuration
- **Origin**: `https://cdn.amplitude.com`
- **Path rewrite**: `/script/{API_KEY}.experiment.js → /script/{API_KEY}.experiment.js`
- **Cache TTL**: 1–5 minutes (balances freshness with performance)
- **Cache key**: Full URL including `API_KEY`
**Before (direct to Amplitude):**
```html
<script src="https://cdn.amplitude.com/script/abc123def456.experiment.js"></script>
```
**After (through your proxy):**
```html
<script src="https://experiments.acme.com/script/abc123def456.experiment.js"></script>
```
## Remote evaluation proxy
The Web Experiment script calls a single endpoint for remote evaluation. An experiment requires remote evaluation when its targeting rules reference at least one property that isn't available locally on the client.
This pattern lets you:
- Centralize control over evaluation logic.
- Enrich requests with server-side context.
### Expose your proxy evaluation endpoint
Create and expose an HTTPS endpoint for the Web Experiment SDK to call for remote evaluation:
*Example URLs:*
- **Full path**: `https://experiments.acme.com/sdk/v2/flags?delivery_method=web`
- **Base URL**: `https://experiments.acme.com/`
The SDK uses this base URL for all evaluation requests.
### Configure the Web Experiment script
Configure the Web Experiment script or SDK to call your new endpoint instead of the Amplitude-hosted URLs (`flag.lab.amplitude.com` or `flag.lab.eu.amplitude.com`). Add the following code above the Web Experiment script.
```html
<script>
window.experimentConfig = {
flagsServerUrl: "https://experiments.acme.com/",
};
</script>
```
### Implement proxy logic
For each incoming browser request, the proxy must:
*Accept request*
- **Method:** GET.
- **Query parameters:** `delivery_method=web`.
*Forward to Amplitude*
- **US projects:** `https://flag.lab.amplitude.com/sdk/v2/flags?delivery_method=web`.
- **EU projects:** `https://flag.lab.eu.amplitude.com/sdk/v2/flags?delivery_method=web`.
*Inject headers*
| Header name | Value | Notes |
| -------------- | ------------------------------------- | ----------------------------------------------------------------------------- |
| Authorization | `Api-Key <AMPLITUDE_PROJECT_API_KEY>` | Store and manage only on the server. Never expose to the browser. |
| X-Amp-Exp-User | `<base64-encoded user object>` | Forward from browser as-is. Contains `{"user_id": "...", "device_id": "..."}` |
*Return response*:
Return Amplitude's JSON response unchanged to the browser.
---
#### Example request flow
*Browser to proxy*:
```
GET https://experiments.acme.com/sdk/v2/flags?delivery_method=web
X-Amp-Exp-User: eyJ1c2VyX2lkIjoidXNlciIsImRldmljZV9pZCI6ImRldmljZSJ9
```
*Proxy to Amplitude*:
```
GET https://flag.lab.amplitude.com/sdk/v2/flags?delivery_method=web
Authorization: Api-Key <PROJECT_API_KEY>
X-Amp-Exp-User: eyJ1c2VyX2lkIjoidXNlciIsImRldmljZV9pZCI6ImRldmljZSJ9
```
*Proxy to browser*:
Returns Amplitude's evaluation response.
#### Response format
The endpoint returns a JSON array of experiment flag objects pre-evaluated for the user.
*Flag object schema*:
| Field | Description |
| -------- | ---------------------------------------------------------------------------------------------------------------------------------------- |
| key | Unique flag key that identifies the experiment. |
| segments | Targeting and bucketing rules pre-evaluated with the user's properties. Amplitude includes conditions that are true and removes others. |
| variants | Available variants including key, metadata, and web experiment actions (mutations, custom code, URL redirects). |
| metadata | Experiment metadata: version, deployment status, and re-run indicators. |
---
#### Example response
```json
[
{
"key": "example",
"metadata": {
"deliveryMethod": "web",
"deployed": true,
"evaluationMode": "local",
"experimentKey": "exp-1",
"exposureEvent": "$impression",
"flagType": "experiment",
"flagVersion": 5
},
"segments": [
{
"bucket": {
"allocations": [
{
"distributions": [
{ "range": [0, 21474837], "variant": "control" },
{ "range": [21474836, 42949673], "variant": "treatment" }
],
"range": [0, 100]
}
],
"salt": "G0U0BTSK",
"selector": ["context", "user", "web_exp_id"]
},
"conditions": [
[
{
"op": "is",
"selector": ["context", "user", "device_category"],
"values": ["desktop"]
}
]
],
"metadata": { "segmentName": "Segment 1" },
"variant": "off"
},
{
"metadata": { "segmentName": "All Other Users" },
"variant": "off"
}
],
"variants": {
"control": {
"key": "control",
"payload": [{ "action": "mutate", "data": { "mutations": [] } }],
"value": "control"
},
"off": { "key": "off", "metadata": { "default": true } },
"treatment": {
"key": "treatment",
"payload": [
{
"action": "mutate",
"data": {
"mutations": [
{
"action": "set",
"attribute": "html",
"metadata": {
"scope": ["89e01141-6e35-4bc0-bb66-0e1bc0fd4823"],
"type": "text"
},
"selector": ".md\\:max-w-max:nth-child(1)",
"value": "updated text"
}
]
}
}
],
"value": "treatment"
}
}
}
]
```
---
## Impression (exposure) event forwarding
Customer-controlled backend systems send impression (exposure) events to the experimentation platform rather than the browser sending them directly.
This pattern lets you:
- Unify event pipelines.
- Simplify compliance with data governance policies.
If you already use Amplitude's Analytics SDK, update the tracking endpoint for the browser SDK through `serverUrl`.
If you aren't using Amplitude's Analytics SDK, add the following impression event forwarding script above the Web Experiment script.
```html
<script>
// TODO: Replace this object with your tracker implementation.
const customTracker = {
track: (eventType, eventProperties) => {
// TODO: Send eventType and eventProperties to your analytics tool.
console.log({ eventType, eventProperties });
},
};
window.experimentIntegration = {
getUser: () => {
// TODO: Return user.
return {
user_id: "user",
device_id: "device",
};
},
track: (e) => {
// TODO: Track event
customTracker.track(e.eventType, e.eventProperties);
return true;
},
};
</script>
```
================================================================================
# Feature Experiment
URL: https://amplitude.com/docs/feature-experiment
Updated: 2026-01-08
================================================================================
# Feature Experiment
Test, analyze, and ship product changes with confidence. Amplitude Experiment unites feature flags and experimentation so you can release features safely and measure their impact across web, mobile, and backend.
{% outcomes heading="Explore Experiment" %}
{% outcome icon="ShieldCheck" title="Roll out features without the risk" href="https://amplitude.com/docs/feature-experiment/workflow/feature-flag-rollouts" %}
Release behind a flag, ramp to the audience you choose, and turn it off the moment something looks wrong.
{% /outcome %}
{% outcome icon="FlaskConical" title="Prove which change wins" href="https://amplitude.com/docs/feature-experiment/experiment-quick-start" %}
Run A/B, multivariate, and bandit tests so the data, not the loudest opinion, makes the call.
{% /outcome %}
{% outcome icon="Eye" title="Test the website without an engineer" href="https://amplitude.com/docs/feature-experiment/feature-vs-web-experimentation" %}
Edit pages with a visual editor and ship the winning variant without a code deploy.
{% /outcome %}
{% outcome icon="Code" title="Run experiments anywhere users are" href="https://amplitude.com/docs/sdks/experiment-sdks" %}
Use Experiment SDKs to flag and test features across web, mobile, and backend.
{% /outcome %}
{% outcome icon="Plug" title="Automate your release workflow" href="https://amplitude.com/docs/apis/experiment/experiment-management-api" %}
Manage flags, experiments, and deployments from CI, scripts, or your own tools with the Experiment APIs.
{% /outcome %}
{% outcome icon="Zap" title="See Experiment in action" href="https://app.amplitude.com/experiment/demo/470648/config/69916/activity" %}
Click through a hands-on demo before you instrument your own product.
{% /outcome %}
{% /outcomes %}
## Ship with feature flags
Use flags to control release scope, target audiences, and rollback paths before you measure impact.
- [Create a feature flag or experiment](https://amplitude.com/docs/feature-experiment/workflow/create) to define the change you want to ship.
- [Configure variants](https://amplitude.com/docs/feature-experiment/workflow/configure) to set treatment values, payloads, and rollout behavior.
- [Define the audience](https://amplitude.com/docs/feature-experiment/workflow/define-audience) to target users by properties, cohorts, or segments.
- [Manage rollouts](https://amplitude.com/docs/feature-experiment/workflow/feature-flag-rollouts) to release gradually and reduce launch risk.
## Run trustworthy experiments
Build each experiment around clear goals, clean exposure tracking, and a decision workflow.
- [Define experiment goals](https://amplitude.com/docs/feature-experiment/workflow/define-goals) to choose primary and secondary metrics.
- [Track exposure](https://amplitude.com/docs/feature-experiment/track-exposure) so analysis uses the users who encountered the variant.
- [Estimate experiment duration](https://amplitude.com/docs/feature-experiment/workflow/experiment-estimate-duration) to set expectations before launch.
- [Make a decision](https://amplitude.com/docs/feature-experiment/workflow/make-decision-experiment) to ship, iterate, or stop the experiment.
{% academy-link
title="Getting Started with Amplitude Experiment"
url="https://academy.amplitude.com/path/getting-started-with-amplitude-experiment-learning-path"
description="Earn a badge when you learn the Amplitude Experiment workflow and understand how get set up for experiments that produce trustworthy results."
/%}
================================================================================
# Experiment Quick Start
URL: https://amplitude.com/docs/feature-experiment/experiment-quick-start
================================================================================
# Experiment Quick Start
Experiment is a workflow-driven behavioral experimentation platform that speeds up creating variants of features and websites for testing.
With Experiment, you can modify and configure product experiences for unique audiences through:
- **Product experimentation**: Run experiments and A/B tests to onboard new users, reduce friction for checkout experiences, roll out new features, and more.
- **Progressive feature delivery**: Pre-plan and stage new features for beta testers, a percentage of your users, or specific target audiences.
- **Dynamic in-product experiences**: Deploy and adapt custom experiences at scale.
- **Web experimentation**: Perform A/B testing directly on your website.
Experiment supports experimentation through either Feature Experiment or Web Experiment:
- Feature Experiment runs experiments through [feature flags](https://amplitude.com/docs/feature-experiment/workflow/feature-flag-rollouts). Feature flags are switches that let you modify your product's experience without changing code.
- Web Experiment runs experiments through the [Visual Editor](https://amplitude.com/docs/web-experiment/set-up-a-web-experiment#the-visual-editor). The Visual Editor places a dynamic, customizable layer over your existing website. Through the Visual Editor, you can customize any element of your website without changing the site's underlying code or structure.
For more information about the use cases for each type of experimentation, go to [Feature and Web Experiment use cases](https://amplitude.com/docs/feature-experiment/feature-vs-web-experimentation).
This page splits the quick start into Feature Experiment and Web Experiment. Select the tab for the experiment type you want to set up.
{% callout type="warning" heading="" %}
This quick start guide contains only the basic information needed to implement Experiment. Review the entire set of [Experiment documentation](https://amplitude.com/docs/feature-experiment/overview) to understand the full complexity of the product.
{% /callout %}
{% tabs tabs="Feature Experiment, Web Experiment" %}
{% tab name="Feature Experiment" %}
Experiments and feature flags use the [Amplitude Experiment SDK](https://amplitude.com/docs/sdks/experiment-sdks) or [REST API](https://amplitude.com/docs/apis) to communicate with Amplitude Experiment.
Setting up an experiment is a multi-stage process with these procedures:
1. Install and set up SDKs and deployments.
2. Create feature flags.
3. Select the deployment and create a payload.
4. Create variations and send payloads.
5. Design experiments.
## Before you begin
Before you start using experiments:
- Confirm you have developer write access to the [Experiment SDK](https://amplitude.com/docs/sdks/experiment-sdks).
- Confirm you have access to the Experiment feature.
- Confirm you have developer access to the application where you integrate your feature flags.
## Set up the SDK
Install the Amplitude SDK with the Experiment client. For example:
```bash
npm install @amplitude/analytics-browser @amplitude/experiment-js-client
```
```ts
import * as amplitude from "@amplitude/analytics-browser";
import { Experiment } from "@amplitude/experiment-js-client";
amplitude.init("AMPLITUDE_API_KEY");
const experiment = Experiment.initialize("DEPLOYMENT_API_KEY");
await experiment.start();
```
## Set up a deployment
Experiment uses the same projects as Amplitude Analytics. As a best practice, create one project for each product and each environment. Because [flags](#flags-and-experiments), [experiments](#flags-and-experiments), and [deployments](#deployments) only exist within a single project, you must duplicate these objects across projects within the same product.
In Amplitude Experiment, a deployment serves a group of flags or experiments for use in an application. Each [project](#projects) has a deployment using the project API key as the deployment key, available by default. On creation, Experiment assigns a randomly generated deployment key to each deployment. Experiment uses the deployment key to identify the deployment and authorize requests to the evaluation servers.
{% callout type="note" heading="Client vs. server deployments" %}
Deployments are either client or server deployments. Use client-side deployments to initialize client-side SDKs, and server-side deployments to initialize server-side SDKs or authorize requests to the Evaluation API.
{% /callout %}
Deployments belong to Amplitude Analytics projects, and a project can have multiple deployments. Amplitude recommends that you name deployments after the platform (client-side) or service (server-side) to which Experiment serves variants (for example: `android`, `ios`, `web`). The default project API key deployment is useful for getting started. Use explicit deployments for each platform or service in larger organizations or teams that may share the same Amplitude project across multiple platforms for the same application. Each deployment receives a unique key for use in your application.
##### To create a deployment
1. Go to _Experiments > Deployments_.
2. Select **Create Deployment**.
3. Select the project you want from the dropdown list.
4. Name your deployment.
5. Select whether your deployment is for **Client** or **Server**.
6. Select **Create a Deployment**.
For full details, go to [Configure your experiment](https://amplitude.com/docs/feature-experiment/workflow/configure).
## Create a new flag
A flag lets you enable or disable a function or feature in your product without deploying new code each time. Flags drive both experiments and feature rollouts. Flags work well for launching experiments and ending them after you collect enough data, and for rolling out new features (and rolling them back, if needed).
##### To create a new feature flag
1. Go to _Experiment > Feature Flags_.
2. Select **Create Feature Flag**.
3. In the Create Flag section, select the project you want from the dropdown list, then give your flag a name.
Amplitude Experiment generates the flag key from the name you choose. The flag key is an identifier for the flag used in your codebase.
4. Specify the [evaluation mode](https://amplitude.com/docs/feature-experiment/local-evaluation) for your experiment. Select either **Remote** or **Local**.
5. Specify the **bucketing unit** you want to use for this experiment.
{% callout type="tip" %}
The best bucketing unit is typically the user. In some B2B use cases, you might want to use company ID or city as the bucketing unit. For example, bucketing by company ID ensures all users in a particular company have the same user experience. Confirm the [Stable Unit Treatment Value Assumption](https://blogs.iq.harvard.edu/violations_of_s#:~:text=Methods%20for%20causal%20inference%2C%20in,treatments%20of%20others%20around%20him) holds for whichever unit you choose.
{% /callout %}
6. Select **Create**.
Experiment opens a blank template for your flag.
7. Choose the deployment you want from the Deployment dropdown menu.
8. (_Optional_) Select **Advanced Settings** to modify the [bucketing salt](https://amplitude.com/docs/feature-experiment/implementation#consistent-bucketing) options.
{% callout type="note" heading="" %}
If you change the bucketing salt, users can switch between variants in your experiment. For that reason, Amplitude recommends not changing the bucketing salt unless you know what you’re doing. For more information, go to [How randomization works in Amplitude Experiment](https://amplitude.com/docs/feature-experiment/under-the-hood/experiment-randomization).
{% /callout %}
## Create variations
A variant exists within a flag or an experiment, and represents a variable experience for a user. Variants comprise the A/B changes you want to test. All feature flags must contain at least one variant. You can add as many variants as you want to a flag.
##### To add a variant
1. Go to your _Experiment > Feature Flags_ and select your flag.
2. In the Variants section, select the **Plus** icon to create a variant.
3. Enter the name, value, and description of your variant.
4. Select **Apply**.
{% callout type="note" %}
You can send a payload with your variant. A payload is a JSON-coded set of variables that can remotely change flags and experiments without a manual code change. Because you can send a payload with your control, you don’t need to create a variant for the control itself.
Add JSON content to the Payload field when creating a variant. Payload content resembles:
```json
{
"layout": "cards",
"titlePosition": "above",
"gradient": false,
"showDescription": true,
"cardCount": 3
}
```
{% /callout %}
## Add targeting to the flag
In the Assignment section, define the user segments you want to experience your new feature. Defining a user segment limits your rollout to users in specific geographical locations, certain demographic groups, or who meet certain usage thresholds in your product (for example, power users). For more information on segmenting, go to [Define your audience](https://amplitude.com/docs/feature-experiment/workflow/define-audience).
##### To add targeting
1. Specify the percentage of users who receive the variant.
2. To define a user segment, go to the Rule Based User Segments section and select **Segment 1**. Then follow the same steps you use to build a [user segment](https://amplitude.com/docs/analytics/charts/build-charts-modify-user-segment) in Amplitude Analytics.
## Finalize the flag
After you set up the flag, associate it with a deployment, set up your variants or payloads, and target your users, finalize the feature flag. Finalizing the flag activates the flag and makes it available.
##### To finalize a feature flag
1. Go to your feature flag.
2. Select **Activate flag**.
## Design the experiment
You can create an experiment directly or convert an existing flag to an experiment.
When designing your experiment:
- Set metrics for the experiment.
- Set up any further variations and payloads.
Adding goals (or metrics) lets you track the success rate of your experiment. All experiments should have at least one metric. Tell Amplitude Experiment what you want your primary metric to be, and define any secondary metrics. The primary metric determines whether Amplitude accepts or rejects your hypothesis, and therefore whether your experiment succeeded or failed.
##### To add metrics
1. Open your experiment and go to the Metrics section.
2. Select your recommended metric from the Metric dropdown or create a custom metric.
3. Select the metric type using "should" or "should not":
- "Should": A Success metric states the goal changes by the goal amount and direction.
- "Should not": A Guardrail metric states the goal doesn’t change by the goal amount and direction.
4. Specify whether you expect the metric to increase or decrease.
5. (_Optional_) Set the minimally acceptable goal for the experiment, also known as the [minimum detectable effect](https://amplitude.com/docs/feature-experiment/experiment-theory/experiment-set-mde). The minimum detectable effect is the minimum difference between the control and the variant for the experiment to count as a positive result.
6. To add secondary metrics, select **Add Metric** and repeat this process for each additional metric you want to include.
##### To add more variations and payloads
To create more variations and payloads, repeat the steps in [Create variations](#create-variations) in your flag.
## Start your experiment
After you finish designing your experiment, select **Start Experiment** to begin.
## Code examples
The following code examples show the code for a feature flag and a JSON payload.
{% tabs tabs="Feature flag, Payload" %}
{% tab name="Feature flag" %}
```js
import { useState, useEffect } from 'react';
import { getBlogLayoutFlag } from '../services/featureFlags'; // Adjust to wherever you fetch your Amplitude flag
import type { BlogPost } from '../types';
type LayoutFlag = {
layout: 'cards' | 'list' | 'carousel';
titlePosition: 'above' | 'below' | 'center';
gradient: boolean;
showDescription: boolean;
cardCount: number;
};
export default function BlogPostLayoutClient({ posts }: { posts: BlogPost[] }) {
const [layoutFlag, setLayoutFlag] = useState<LayoutFlag | null>(null);
useEffect(() => {
getBlogLayoutFlag().then((flag) => {
console.log(':magic_wand: Received Flag from Amplitude:', flag);
if (flag) {
setLayoutFlag(flag);
} else {
console.log(':warning: No flag returned, falling back to default layout');
setLayoutFlag({
layout: 'cards',
titlePosition: 'above',
gradient: false,
showDescription: true,
cardCount: 3,
});
}
});
}, []);
if (!layoutFlag) {
// You might render a loader here
return null;
}
// Render your posts according to layoutFlag...
return (
<div>
{/* e.g. layoutFlag.layout === 'cards' ? <CardGrid posts={posts} /> : ... */}
</div>
);
}
```
{% /tab %}
{% tab name="Payload" %}
```js
// services/featureFlags.ts
import { experiment } from '@amplitude/experiment-js'; // adjust import to your SDK
import type { LayoutFlag } from '../types'; // reuse the same LayoutFlag type
export const getBlogLayoutFlag = async (): Promise<LayoutFlag> => {
try {
// In dev, clear any stale flags
if (process.env.NODE_ENV === 'development') {
localStorage.clear();
console.warn('Cleared localStorage in dev mode');
}
// Initialize the experiment SDK
await experiment.start();
// Grab the variant for our blog layout test
const variant = experiment.variant('blog_post_layout');
console.log(':movie_camera: Full Variant Object:', variant);
// Some payloads come in `payload`, some in `value`
const value = variant?.payload ?? variant?.value;
console.log('Cleaned Flag Payload:', value);
// If there's no usable object, fall back to defaults
if (!value || typeof value !== 'object' || Object.keys(value).length === 0) {
console.warn('No valid layout flag found, using fallback layout');
return {
layout: 'carousel',
titlePosition: 'above',
gradient: false,
showDescription: true,
cardCount: 3,
};
}
// Otherwise assume it's Amplitude's LayoutFlag shape
return value as LayoutFlag;
} catch (error) {
console.error('Error fetching blog layout flag:', error);
// On error, also fall back
return {
layout: 'carousel',
titlePosition: 'above',
gradient: false,
showDescription: true,
cardCount: 3,
};
}
};
```
{% /tab %}
{% /tabs %}
{% /tab %}
{% tab name="Web Experiment" %}
Web Experiment requires you to implement the Web Experiment script on your site before you begin.
Paste the script into the `<head>` element of your site, as high as possible to avoid flickering.
The script tracks [impression events](https://amplitude.com/docs/web-experiment/tracking#impressions) with the [Browser SDK](https://amplitude.com/docs/sdks/analytics/browser/browser-sdk-2) already installed on your site, or with a [third-party analytics SDK](#integrate-with-a-third-party-cdp).
## Add the experiment script
Replace `API_KEY` with your project's API key in one of the following synchronous scripts, depending on your region:
{% tabs tabs="US Data Center, EU Data Center" %}
{% tab name="US Data Center" %}
```html
<script src="https://cdn.amplitude.com/script/API_KEY.experiment.js"></script>
```
{% /tab %}
{% tab name="EU Data Center" %}
```html
<script src="https://cdn.eu.amplitude.com/script/API_KEY.experiment.js"></script>
```
{% /tab %}
{% /tabs %}
{% callout type="note" heading="Security headers" %}
Your site may need the following security header adjustments to work with Web Experiment.
{% tabs tabs="Content Security Policy, Cross-Origin-Opener-Policy" %}
{% tab name="Content Security Policy" %}
If your site defines the `script-src` content policy directive, add `*.amplitude.com` and `unsafe-inline` to the policy values. These changes enable loading the Web Experiment script and visual editor on your site.
```text
Content-Security-Policy: script-src *.amplitude.com unsafe-inline;
```
{% /tab %}
{% tab name="Cross-Origin-Opener-Policy" %}
If your site sets the `Cross-Origin-Opener-Policy` header, you can either remove the header or set it to `unsafe-none`. This setting allows the visual editor to load on your site.
```text
Cross-Origin-Opener-Policy: unsafe-none
```
{% /tab %}
{% /tabs %}
{% /callout %}
## Set up a web experiment
1. In Amplitude Experiment, go to _Experiments > Create Experiment > Web Experiment_.
2. In the New Experiment modal, give your experiment a name. Enter the URL of a page this experiment targets. Amplitude must be instrumented on that page, and select the appropriate project from the dropdown. Amplitude uses this URL to create your first [Page](https://amplitude.com/docs/web-experiment/pages).
3. If the script is present on the page you specified, Amplitude Experiment opens the page in the [Visual Editor](#the-visual-editor) as a new variant in your experiment.
You have two options for the treatment variant action: [element changes](https://amplitude.com/docs/web-experiment/actions#element-changes) or [URL redirect](https://amplitude.com/docs/web-experiment/actions#url-redirect).
{% callout type="warning" %}
If the script isn’t present on the page you specify, or if you have an ad blocker or other privacy extension enabled, Amplitude Experiment can’t open the Visual Editor. Amplitude Experiment opens the Site Setup panel and prompts you to [implement](https://amplitude.com/docs/web-experiment/implementation) the script.
{% /callout %}
4. To change text, colors, or other elements of the page’s UI, select _Element Changes_.
5. Select the element you want to change.
6. The editing toolbar opens beside the selected element with quick actions such as editing the element’s content or [moving the element](https://amplitude.com/docs/web-experiment/set-up-a-web-experiment#move).
Selecting the expand icon opens the drawer, which lets you edit CSS style properties. When you’re done, select _Apply_.
7. Repeat this process for each element you want to change for your experiment.
8. If needed, select _+_ to add another variant.
9. When you’re done, select _Continue_.
10. Next, [define your experiment's goals](https://amplitude.com/docs/feature-experiment/workflow/define-goals).
11. In the _Pages_ tab, configure which [Pages](https://amplitude.com/docs/web-experiment/pages) your experiment targets. You can create new Pages or reuse existing saved Pages. If you target only the page you set on creation, you can skip this step. From the _Include pages where_ dropdown, specify how you want Amplitude Experiment to identify these pages.
Use the same pattern to exclude the experiment from the pages you select. Learn more about [managing Pages](https://amplitude.com/docs/web-experiment/pages) for precise experiment targeting.
12. Next, target the users you want to include in this experiment. If you’re familiar with feature experiment targeting, note that Web Experiment [audience targeting](https://amplitude.com/docs/web-experiment/targeting#audience-targeting) works differently.
13. The _Advanced_ tab provides several [additional options](https://amplitude.com/docs/feature-experiment/workflow/finalize-statistical-preferences) for your experiment.
14. When you’re ready, select _Save and Close_ to finish creating your Web Experiment.
{% callout type="tip" heading="Create a new run of an existing experiment" %}
If you have an experiment that you need to re-run, refer to [New Experiment Run](https://amplitude.com/docs/feature-experiment/troubleshooting/new-experiment-run).
{% /callout %}
### Test and preview your web experiment
Before running your web experiment, Amplitude recommends that you test and preview each variant. When you’re ready:
1. Select _Test & Preview_. This action puts your experiment in test instrumentation mode, but doesn’t start your experiment. Only users who open the page with the preview link can view your changes.
2. In the modal, select _Preview_ to open a new tab that applies the changes you made for that variant. Select the chain link icon to copy the URL so you can share it with others.
Test each variant at least one time, preferably more. Test each variant on more than one page if your experiment targets multiple pages.
If your changes aren’t apparent, you may need to wait up to 60 seconds for caches to refresh. If the changes don’t appear correctly after that time, the configuration may have an issue.
{% callout type="warning" heading="Ad blockers" %}
Ad blocking plugins or extensions may prevent you from testing and previewing your experiment.
{% /callout %}
## Add actions
Actions define how variants modify your site. Actions relate to variants rather than a specific page, and apply to specific [Pages](https://amplitude.com/docs/web-experiment/pages) to control exactly where they take effect.
Experiment applies variant actions during evaluation. Evaluation runs on the initial page load and any time state pushes to or pops from the session history. History state changes also cause the SDK to revert all applied element change and custom code actions before reevaluating and reapplying actions with the updated page in mind.
Actions include:
- [Element changes](https://amplitude.com/docs/web-experiment/actions#element-changes)
- [URL redirects](https://amplitude.com/docs/web-experiment/actions#url-redirect)
- [Custom code](https://amplitude.com/docs/web-experiment/actions#custom-code)
For more information about each action, refer to the preceding links.
### Action examples
{% callout type="tip" %}
Generative AI like ChatGPT or equivalents can create HTML and CSS for simple elements. ChatGPT generated the following modal and banner examples, which Amplitude then modified.
{% /callout %}
#### Insert an element
To insert an element onto your page, follow this pattern.
1. Write the HTML and CSS for the element you want to add to the page.
2. Identify the selector of the parent element you want to insert your new element into. The parent element is often the `body`.
3. Paste the following JavaScript code, and update `PARENT_SELECTOR` with the parent element selector from step 2.
```js
utils.waitForElement("PARENT_SELECTOR").then(function (e) {
e.appendChild(html);
utils.remove = function () {
html.remove();
};
});
```
To insert your element into the parent element at a specific position, use `insertBefore()` instead of `appendChild()`.
#### Add a banner
This example adds a discount code banner to the top of the page.
{% tabs tabs="JS, CSS, HTML" %}
{% tab name="JS" %}
```js
utils.waitForElement("body").then(function (e) {
e.insertBefore(html, e.firstChild);
utils.remove = function () {
html.remove();
};
});
```
{% /tab %}
{% tab name="CSS" %}
```css
.announcement-banner {
background-color: #fafafa;
color: #333;
padding: 10px;
text-align: center;
font-family: Arial, sans-serif;
border-bottom: solid #e5e5e5;
border-bottom-width: 1px;
}
.announcement-banner p {
margin: 0;
font-size: 16px;
}
```
{% /tab %}
{% tab name="HTML" %}
```html
<div class="announcement-banner">
<p>🎉 Big Sale: Get 25% off on all items! Use code <strong>SAVE25</strong></p>
</div>
```
{% /tab %}
{% /tabs %}
## Work with pages
In a Web Experiment, Pages control where your experiment variants apply on your site. Pages scope experiments to specific URLs, which lets you run tests on targeted pages without affecting unrelated parts of your site.
A Page defines the conditions under which a web experiment applies to your site, and includes:
- A unique name.
- URL targeting conditions.
- A Visual Editor URL to help preview the experiment.
### Create a page
When you create a new Web Experiment, specify a page by:
- **Manual URL input**: Enter a specific URL to define the page.
- **Import a saved page**: Select a page from a previous experiment.
After you add the page, continue with experiment setup, or go directly to the Visual Editor.
### Update a page or create another
To update a page definition, navigate to the Pages tab of the Experiment Setup flow, or select the pencil icon on the Pages section of the Settings tab. From there, rename the page, update its Visual Editor URL, or update the page targeting rules.
#### Page targeting rules
- **URL Matches**
- **Description**: Match the page URL, ignore query parameters or hash fragments.
- **Examples**:
- `https://example.com/pricing`
- ✅ https://example.com/pricing#details
- ❌https://example.com/pricing/enterprise
- **URL Matches Exactly**
- **Description**: Match the full page URL exactly.
- **Examples**:
- `https://example.com/pricing?utm_source=facebook`
- ❌https://example.com/pricing
- ❌ https://example.com/pricing?utm_source=tiktok
- **URL Matches Pattern**
- **Description**: Match the full page URL, including wildcards (`*`).
- **Examples**:
- `https://example.com/blog/*`
- ✅ https://example.com/blog/my-first-post
- ✅ https://example.com/blog/my-second-post#get-started
- **URL Contains**
- **Description**: Match the full page URL, where the URL contains a specific substring.
- **Examples**:
- `/blog/my-first`
- ✅ https://example.com/blog/my-first-post
- ❌ https://example.com/blog/my-second-post
- **URL Starts With**
- **Description**: Match the full page URL, where the URL starts with an exact substring.
- **Examples**:
- `https://example.com/blog`
- ✅ https://example.com/blog/my-first-post
- ❌ https://example.com/pricing
- **URL Ends With**
- **Description**: Match the full page URL, where the URL ends with an exact substring.
- **Examples**:
- `/blog/my-first-post`
- ✅ https://example.com/blog/my-first-post
- ❌ https://example.com/blog/my-first-post#get-started
- **URL Matches Regex**
- **Description**: Match the full page URL with a regular expression you define.
- **Examples**:
- [Learn Regex](https://www.regular-expressions.info/quickstart.html)
- [Test Regex](https://regex101.com/)
### Manage page scope for variants
In a web experiment, you can scope each variant to a specific page so the variant’s changes apply only where you intend. This rule applies to all variant types.
#### Visual editor
When you use the Visual Editor to make changes, for example text edits or style updates, those changes associate with the page you select during the preview session. For each change, specify the page or pages it applies to.
Page scope lets you:
- Assign updates or changes to a specific page.
- Avoid applying the same change across all views.
- Maintain better isolation and clarity across your experiment setup.
{% callout type="tip" heading="Double-check the page scope" %}
Check the page scope for each change to ensure you don’t introduce cross-page conflicts or unintended edits.
{% /callout %}
#### Custom code
When you add custom code or URL redirects as variants, you can explicitly define which page or pages the variant applies to.
This flexibility lets you create a single experiment that includes custom code with different behaviors, depending on the active page.
## Targeting
Web Experiments target both pages and audiences. Amplitude evaluates page targeting first, and then audience targeting. Both targeting methods evaluate locally in the browser when the page first loads.
Web Experiments use [Pages](https://amplitude.com/docs/web-experiment/pages) to precisely control where experiment variants apply on your website. Pages define the conditions under which a web experiment applies, including targeting conditions to match specific URLs and visual editor URLs for previewing experiments.
### Audience targeting
By default, a new Web Experiment targets all users. Audience targeting lets you target specific users for your experiment. Users who aren’t targeted in the experiment receive the default experience and don’t count toward analysis.
If any segments match, Amplitude buckets that user into a variant based on the configured rollout and variant distribution. For a segment to match, the user must meet all conditions you set. For more details, go to [Web Experiment targeting](https://amplitude.com/docs/web-experiment/targeting).
### Web Experiment performance
Web Experiment intentionally minimizes its impact on page performance.
### Script size
The Web Experiment script is dynamic and includes all your experiment configurations to avoid multiple synchronous downloads. The script size starts with a base size and scales with each experiment.
| | Uncompressed | Compressed |
| ------------- | ------------ | ---------- |
| Base script | 79KB | 20KB |
| Per-flag size | ~1KB | ~100B |
To avoid continually increasing script sizes, deactivate or archive experiments when they’re complete.
{% callout type="note" heading="Custom code impact on flag size" %}
Custom code increases the size of a flag’s code because of the size of the custom code itself.
{% /callout %}
### Caching
Web Experiment uses two caching layers: CDN and browser. These layers help provide more reliable script delivery to your site.
#### CDN cache
Amplitude caches the Web Experiment script on a CDN. When a user requests the script, the user’s browser loads the script from the CDN if another user loaded it in the same geographic area. The CDN cache has a max age of one minute, and serves stale content while the script reloads for up to one hour. The script serves a stale response if the origin returns an error for the maximum amount of time possible.
The cache control response header that configures CDN caching is:
`max-age=60,stale-while-revalidate=3600,stale-if-error=31536000`
#### Browser cache
The browser cache serves the Web Experiment script without making a network request for 60 seconds, or for the maximum amount of time if the server returns an error. The browser cache serves the script from memory (0ms latency) if a user loads multiple pages on your site, or reloads the same page within a one minute window.
The cache control response header that configures browser caching is:
`max-age=60,stale-while-revalidate=3600`
{% /tab %}
{% /tabs %}
================================================================================
# Feature and Web Experiment Use Cases
URL: https://amplitude.com/docs/feature-experiment/feature-vs-web-experimentation
================================================================================
# Feature and Web Experiment Use Cases
You can create experiments using either Feature Experiment or Web Experiment. Select Feature or Web Experiment based on your needs for the experiment and the results you want to generate.
## Feature Experiment use cases
Feature Experiment is most useful for Product experts, Data Engineering and Operations, and Data Analysts. These roles focus on deep knowledge of specific products or data repositories. Their goals are to:
- Launch new products.
- Reduce risk.
- Analyze and report on data.
- Adhere to security and compliance requirements.
- Monitor performance.
- Ship code.
- Run complex models.
Feature experimentation uses feature flags to create the variants you want. Flags are switches that let you modify your product's experience without changing code. Use flags to set up experiments in your product or to stage and roll out new features to your users. Your code uses the [Amplitude Experiment SDK](https://amplitude.com/docs/sdks/experiment-sdks) or [APIs](https://amplitude.com/docs/apis) to communicate with Experiment. Feature flags require knowledge of your code to use them for experimentation. For more information, go to [Feature Flags](https://amplitude.com/docs/feature-experiment/workflow/feature-flag-rollouts).
## Web Experiment use cases
Web Experiment is most useful for digital marketers and growth marketing. These roles focus on strategic changes to the existing functionality and design of your website. Their goals are to:
- Optimize the website or the lifecycle of the product.
- Drive adoption.
- Personalize experiences.
- Test hypotheses.
- Track key product insights (KPIs).
- Upsell or cross-sell products.
Web experimentation uses a visual editor to create variations of your website. With the visual editor, you can select and alter content or element properties. Web Experiment lets less technical users, or users with fewer permissions in your system, create experiments without engineering resources. Web experiments use pages to control where your experiment's variants apply on your website. Pages let you scope experiments to specific URLs without affecting unrelated parts of your site. For more information about creating experiments with the web editor, go to [Setting up a Web Experiment](https://amplitude.com/docs/web-experiment/set-up-a-web-experiment).
For a full description of the functional differences between Feature and Web Experiment, go to [Feature and Web Experiment functional comparison](https://amplitude.com/docs/feature-experiment/feature-and-web-experiment-functional-comparison).
{% callout type="note" heading="" %}
The [Website Conversion Agent](https://amplitude.com/docs/amplitude-ai/website-conversion-agent) can help you identify high-impact pages and generate experiment strategies to increase conversion, whether you use Feature or Web Experiment.
{% /callout %}
================================================================================
# Feature and Web Experiment Functional Comparison
URL: https://amplitude.com/docs/feature-experiment/feature-and-web-experiment-functional-comparison
================================================================================
# Feature and Web Experiment Functional Comparison
The following tables show which Experiment functionality applies to Feature experimentation, Web experimentation, or both. To compare differences and use cases, go to [Feature and Web Experiment use cases](https://amplitude.com/docs/feature-experiment/feature-vs-web-experimentation).
{% accordion title="Planning" %}
| Functionality | Feature | Web |
| --- | --- | --- |
| Client-side or server-side implementation | ✅ | ❌ |
| Local or remote evaluation | ✅ | ✅ |
| **Stats method** | | |
| Sequential | ✅ | ✅ |
| T-test | ✅ | ✅ |
| Thompson Sampling (MAB) | ✅ | ✅ |
| Bayesian | ✅ | ✅ |
| **Reduce chance of error** | | |
| Bonferroni correction | ✅ | ✅ |
| **Group experiments** | | |
| Mutual exclusion | ✅ | ❌ |
| Holdouts | ✅ | ❌ |
| % of audience to rollout | ✅ | ❌ |
| **Exposure event type** | | |
| Exposure event | ✅ | ✅ |
| Custom exposure | ✅ | ❌ |
| **Bucketing salt** | | |
| Bucketing salt | ✅ | ✅ |
{% /accordion %}
{% accordion title="Creating experiments" %}
| Functionality | Feature | Web |
| --- | --- | --- |
| Name | ✅ | ✅ |
| Project | ✅ | ✅ |
| Template | ✅ | ❌ |
| Recommended settings | ✅ | ✅ |
| Link | ✅ | ✅ |
| Tag | ✅ | ✅ |
| Variants | ✅ | ✅ |
| Payload | ✅ | ❌ |
| **When to run** | | |
| When to start | ✅ | ✅ |
| When to end | ✅ | ✅ |
| Traffic estimate, control mean estimator, power duration estimator for each day | ✅ | ✅ |
| OOTB web editor widgets | ❌ | ✅ |
| Project-level user permissions | ✅ | ✅ |
| Notifications through Slack channel, webhook, or Microsoft Teams | ✅ | ✅ |
{% /accordion %}
{% accordion title="Experiment types" %}
| Functionality | Feature | Web |
| --- | --- | --- |
| A/B | ✅ | ✅ |
| Multi-armed bandit | ✅ | ✅ |
{% /accordion %}
{% accordion title="Metrics" %}
| Functionality | Feature | Web |
| --- | --- | --- |
| Primary metric | ✅ | ✅ |
| Secondary metric | ✅ | ✅ |
| Guardrail vs success | ✅ | ✅ |
| Direction | ✅ | ✅ |
| Minimum detectable effect | ✅ | ✅ |
| Winsorization | ✅ | ✅ |
| CUPED | ✅ | ✅ |
| Attribution | ✅ | ✅ |
| Window | ✅ | ✅ |
{% /accordion %}
{% accordion title="Targets" %}
| Functionality | Feature | Web |
| --- | --- | --- |
| User or behavioral cohort | ✅ | ✅ |
| Stratified sampling | ✅ | ✅ |
| Rollout | ✅ | ✅ |
| Sticky bucketing | ✅ | ❌ |
{% /accordion %}
{% accordion title="QA" %}
| Functionality | Feature | Web |
| --- | --- | --- |
| Deployment | ✅ | ✅ |
| Dependencies | ✅ | ❌ |
| Testers | ✅ | ❌ |
{% /accordion %}
{% accordion title="Analysis" %}
| Functionality | Feature | Web |
| --- | --- | --- |
| Assignment and exposure charts | ✅ | ❌ |
| Variant jumping | ✅ | ✅ |
| Anonymous exposures | ✅ | ✅ |
| Exposures without assignments | ✅ | ❌ |
| Rollout options | ✅ | ✅ |
{% /accordion %}
================================================================================
# Key terms
URL: https://amplitude.com/docs/feature-experiment/key-terms
================================================================================
# Key terms
## Glossary of key experimentation terms
| Term | Definition |
| --- | --- |
| Assignment event | Another name for enrollment event. |
| Audience | A group of users targeted for the experiment. Amplitude usually splits this audience evenly into "control" and "variant" groups. |
| Baseline conversion rate | The current rate of your primary success metric before this experiment. |
| Bonferroni correction | A statistical technique that counteracts the multiple comparisons problem (also known as multiplicity or the look-elsewhere effect). |
| Confidence interval | A range of plausible values that contains the parameter of interest. The parameter to estimate is the difference in means between the treatment and control. For example, if the confidence level is 95 and the same experiment runs 100 times, the confidence interval in each run contains the true parameter at least 95 times. |
| Confidence / significance level | The probability of a false positive. For example, at a 95% confidence level, there's a 5% chance of detecting a change to your success metric when no actual change occurred. |
| Enrollment event | The event that converts users or customers into registered participants or members. |
| Exposure event | The event that indicates when a user has seen a change based on an experiment. |
| Guardrail metric | A metric you want to protect from regression while you increase your success metrics. For example, if you drive users to a free trial of your business product, trials of your consumer product can act as a counter metric. If business trials go up, consumer trials go down. Confirm the net effect is positive. |
| CUPED | Controlled-experiment using pre-existing data (CUPED) is an optional statistical technique that reduces variance in experimentation. |
| Hypothesis | An assumption about the methods that can solve or ease the problem statement, and the reasoning behind those methods. |
| p-value | The probability of observing data as extreme as what you saw or more, assuming no difference between treatment and control. |
| Payload | Variables attached to a variant. Use payloads to change flags and experiments remotely without a code change. |
| Primary success metric | The main metric you want to move by running this experiment. Ideally drives both customer and business success. |
| Problem statement | An explanation of the internal business or user problem you're trying to solve. |
| Primary metric | A quantitative measure that evaluates your experiment against your goals. The primary metric determines whether your hypothesis is accepted or rejected and whether your experiment has succeeded or failed. |
| Run time | The duration your experiment takes to run, based on the sample size needed per variant and your traffic levels. |
| Rollout percentage | The percentage or number of targeted users that receive this variant. |
| Sample size | The number of users or amount of traffic you need in each experimental variant to reliably detect statistical significance. |
| Secondary success metric | An additional metric you expect to move with this experiment. |
| Sequential testing | A statistical analysis where the sample size isn't fixed in advance. Sequential testing lets you conduct an A/B test, review your results, and conclude the test without inflating false positives. |
| Statistical power | The probability that you detect a change to your success metric when a change exists to detect. |
| T-test | A statistical analysis that compares means between two populations of data to decide if the difference is statistically significant. |
| Target lift / minimum detectable effect (MDE) | The percentage change you expect to drive on your primary success metric as a result of this experiment. |
| Type 1 error | Incorrectly classifying that a statistically significant difference exists between treatment and control when none exists. |
| Type 2 error | Incorrectly classifying that no difference exists between treatment and control when a difference exists. |
================================================================================
# Set project-level user permissions in Amplitude Experiment
URL: https://amplitude.com/docs/feature-experiment/project-level-permissions
================================================================================
# Set project-level user permissions in Amplitude Experiment
Experiment project-level permissions let Amplitude admins manage access to Experiment separately from [Analytics permissions](https://amplitude.com/docs/admin/account-management/user-roles-permissions). Use project-level permissions when you want to:
- Prevent analytics team members from releasing features through Experiment.
- Prevent product development team members from affecting data taxonomy or key dashboards and charts in Analytics.
- Allow all team members to keep higher permission levels in their primary apps.
{% callout type="note" %}
Project-level user permissions in Experiment are only available to Growth or Enterprise customers.
{% /callout %}
## Set project-level user permissions in Experiment
1. In Experiment, select **Permissions**. The Experiment Permissions page opens to the Joined Users tab.
2. In the Search field, type the name or email of the user. Then select the checkbox next to the user's name. The actions above the table become selectable.
3. Select **Manage Project Access** to search for the project where you want to adjust permissions.
4. From the dropdown that shows the current permission level for the selected user, select the updated access level. Then select **Next**.
5. To confirm the changes, select **Submit**.
## Flag-level access controls
Flag-level access controls let you decide which Experiment users can change specific flags or experiments.
When you turn on flag-level access controls, users in your organization can't save changes to a restricted flag or experiment unless you designate them as an editor for that item.
### Default access for new flags and experiments
Set the default access for new flags and experiments to a restricted list of editors, or to all users in your organization. An organization-wide setting controls this default. Go to _Experiment > Permissions > Organization Settings_ to change the setting.
Only users with the admin role can change this setting.
The default makes new flags and experiments editable by all users in your organization. After you create a new flag or experiment, you can manually restrict access to that item.
If you change the default so that new flags and experiments are viewable instead of editable, only editors can change new flags and experiments. Remove this restriction after you create the flag or experiment.
If you create a flag or experiment through the [Management API](https://amplitude.com/docs/apis/experiment/experiment-management-api), the item defaults to editable regardless of the organization setting.
### Manage access to flags and experiments
To edit the list of approved editors, navigate to _[flag or experiment] > More Actions > Manage Access_. From this page, add individual users, or specify that all users in your organization can edit the flag.
After you grant a user editor permissions to your flag, Amplitude Experiment checks permissions and verifies that the user's role has edit access. For example, if you assign a user the viewer role and later add the user as an editor to your flag, the user can't save changes until you give the user a role with editing privileges.
Users get a notification when you add them as an editor to a flag or experiment. To control your notification settings, go to _Personal settings > Notifications > Updates about my experiments_.
### Bypass access restrictions
Use one of the following methods to change a restricted flag or experiment when no editor users are available:
1. Admin users can edit restricted flags and experiments, even when admins aren't on the list of editors.
2. Use the management API to edit all flags and experiments, regardless of the item's restricted access.
## Permissions matrix
The following tables describe the permissions included with each permission level.
{% callout type="note" heading="Role-based Access Controls (RBAC)" %}
For Enterprise organizations that use Role-based Access Controls (RBAC), refer to the available [Experiment Roles and Permissions](https://amplitude.com/docs/admin/account-management/role-based-access-controls-rbac#rbac-permission-reference).
{% /callout %}
| | Viewer | Member | Manager (Project) | Admin (Org) |
| ----------- | ------ | ---------- | ----------------- | ----------- |
| Deployments | Read | Read/Write | Read/Write | Read/Write |
| Activate | Read | Read/Write | Read/Write | Read/Write |
| Variants | Read | Read/Write | Read/Write | Read/Write |
| Allocation | Read | Read/Write | Read/Write | Read/Write |
| Analysis | Read | Read/Write | Read/Write | Read/Write |
| Metrics | Read | Read/Write | Read/Write | Read/Write |
| **Experiments and Flags** | Viewer | Member | Manager (Project) | Admin (Org) |
| ------------------------- | ------ | ------ | ----------------- | ----------- |
| Read | Y | Y | Y | Y |
| Create | | Y | Y | Y |
| Edit | | Y | Y | Y |
| Delete | | Y | Y | Y |
| **Deployments** | Viewer | Member | Manager (Project) | Admin (Org) |
| --------------- | ------ | ------ | ----------------- | ----------- |
| Read | Y | Y | Y | Y |
| Create | | Y | Y | Y |
| Edit | | Y | Y | Y |
| Delete | | Y | Y | Y |
| **Mutual Exclusion Groups** | Viewer | Member | Manager (Project) | Admin (Org) |
| --------------------------- | ------ | ------ | ----------------- | ----------- |
| Read | Y | Y | Y | Y |
| Create | | Y | Y | Y |
| Edit | | Y | Y | Y |
| Delete | | Y | Y | Y |
| **Users** | Viewer | Member | Manager (Project) | Admin (Org) |
| ------------------------ | ------ | ------ | ----------------- | ----------- |
| Add user to a project | | | Y | Y |
| Edit project role | | | Y | Y |
| Add user to organization | | | | Y |
| Edit organization role | | | | Y |
| **Other** | Viewer | Member | Manager (Project) | Admin (Org) |
| -------------------- | ------ | ------ | ----------------- | ----------- |
| View Project API Key | Y | Y | Y | Y |
================================================================================
# Define your experiment's audience
URL: https://amplitude.com/docs/feature-experiment/workflow/define-audience
================================================================================
# Define your experiment's audience
After you define the events that make up your experiment, set up the audience eligible for the experiment, also known as targeting. You can open eligibility to all users or target specific groups.
{% callout type="note" %}
Users must still trigger the exposure event before they receive the experiment. The targeting section only defines the potential audience.
{% /callout %}
Targeting groups limits experiment exposure to users in specific geographical locations, demographic groups, or users who meet certain usage thresholds in your product, such as power users. Segments are the unique characteristics of your audience you want to target, such as geolocation or device type. All Amplitude user properties and cohorts can define user segments. For any user property in a rule-based segment, Amplitude uses the most recent value the user property received. For more information on segments, go to [Segment Overview](https://amplitude.com/docs/data/destination-catalog/segment).
You can include any number of user segments. If a user belongs to more than one segment in an experiment, Amplitude assigns the user to the first segment they match.
{% callout type="note" %}
Caching expiration differs based on the properties that define user segments. User properties always include the latest values your product sends, and default to the most recent value when Amplitude hasn't received new data. Cohorts sync every hour.
{% /callout %}
Defining your audience also requires that you specify your distribution and rollout:
* **Distribution**: the percentage split between the control and the experiment group. The default distribution is 50%, so half the audience receives the control and half receives the experiment. You can customize the percentage to put more users in one group. Distribution applies to your targeted audience, not your total user base.
* **Rollout**: the percentage of your targeted audience that receives the experiment. At 100%, every user in your targeted audience receives either the control or the treatment. Experiment displays the potential number of users who receive the experiment.
### Set the target audience for your experiment
1. Create a new experiment or open an existing one.
2. In the Targeting section, click the **edit** icon.
3. In the Targeting tab, select the bucketing unit you want.
Bucketing is typically by `User`. You can also bucket by [groups](https://amplitude.com/docs/analytics/account-level-reporting#group-level-reporting-an-overview).
4. Select the users eligible for this experiment.
Targeting defaults to **All Users**. Add a segment to switch to **Targeted Users**. Targeting all users means every user who triggers the exposure event receives your experiment. Targeted users lets you specify segments of users that receive your experiment.
5. Select the bucketing you want to target.
The default is `Amplitude ID`. You can also select options such as:
* Device type.
* Language.
* Region.
* Postal code.
6. To customize the distribution percentage, click **Switch to custom**, then specify the percentages you want.
7. In the All users field, specify the percentage of users that receives the experiment.
8. Click **Save & Close** or **Testers**.
After you specify your audience, specify your testers.
### Testers
Test your experiment to confirm all aspects work and that the implementation succeeds. Go to [Test and Launch Your Experiment](https://amplitude.com/docs/feature-experiment/workflow/experiment-test) for more details about testers.
### Boolean logic in segments
Amplitude applies Boolean `AND` logic to conditions within the same segment. Amplitude evaluates these conditions as `if, else if`. For example, consider two segments:
Segment 1: users in India who access your site through the web.
Segment 2: users on Android devices who access your website through the mobile browser.
With Boolean logic, a user must meet both conditions in a segment to qualify. If a user accesses your website but isn't in India, the user doesn't qualify for Segment 1. If a user accesses your site through an iOS device, the user doesn't qualify for Segment 2.
The `if, else if` evaluation means Amplitude first checks whether a user meets the conditions for Segment 1. If not, Amplitude checks the conditions for Segment 2.
================================================================================
# Configure your experiment's delivery
URL: https://amplitude.com/docs/feature-experiment/workflow/configure-delivery
================================================================================
# Configure your experiment's delivery
After you design your experiment, prepare it for testing and launch. Specify the evaluation mode and bucketing unit (if you haven't already), select the deployments that host this experiment, verify your variants, and identify the team members who participate in QA testing.
Members of your engineering team should oversee this stage of the experiment process.
{% callout type="note" %}
If you're launching a feature flag and not an experiment, skip the experiment design steps. You still need to complete the process in this article.
{% /callout %}
To configure your experiment's delivery, follow these steps:
1. In the Bucketing Options section on the Advanced tab, specify the [evaluation mode](https://amplitude.com/docs/feature-experiment/local-evaluation) for your experiment: *Remote* (Amplitude servers evaluate the experiment) or *Local*.
2. In the advanced settings on the Targeting tab, specify the **bucketing unit** for this experiment.
Set the bucketing unit to *User* in most cases. In some B2B use cases, use company ID or city instead. For example, bucketing by company ID gives all users in a company the same experience. Confirm that the [Stable Unit Treatment Value Assumption](https://blogs.iq.harvard.edu/violations_of_s#:~:text=Methods%20for%20causal%20inference%2C%20in,treatments%20of%20others%20around%20him) holds for the unit you choose.
When you're ready, select **Continue**.
3. On the Delivery tab, select the deployments to use for this experiment or flag. In Amplitude Experiment, a deployment serves a group of flags or experiments for code execution. To learn more about deployments, refer to [configuring your experiment](https://amplitude.com/docs/feature-experiment/workflow/configure). After you select the deployments you need, select **Continue**.
4. Verify your variants. Select **Continue** when you're ready.
5. Add the user, device, or cohort IDs of your QA testers to confirm your implementation works. Add the IDs for each variant. Assign each tester to only one variant, as if Amplitude had bucketed them into your experiment.
When you're done, select **Save and Close**.
================================================================================
# Notifications through Slack, Microsoft Teams, or Webhook
URL: https://amplitude.com/docs/feature-experiment/notifications
================================================================================
# Notifications through Slack, Microsoft Teams, or Webhook
Set up notification alerts for your Web and Feature experiments or for individual feature flags. Amplitude offers two notification delivery paths:
- **Email or Slack direct messages**: Notifications for Experiments (Web and Feature) about to start or end, when Amplitude detects a sample-ratio mismatch (SRM), or when the experiment's recommendation metric reaches statsig.
- **Slack channels, Microsoft Teams channels, webhooks, or email**: Notifications for changes to an active flag configuration that generate a new history version, or when you activate or deactivate flags.
This page covers notification alerts delivered through Slack channels, Microsoft Teams channels, webhooks, and email. Amplitude delivers only alerts created through the Experiment Alerts function this way.
Amplitude delivers all other experiment alerts through email or Slack direct message. For more information on those notification types, go to [Account Settings Notifications](https://amplitude.com/docs/feature-experiment/workflow/experiment-learnings#enable-notifications), [Integrate Slack](https://amplitude.com/docs/analytics/integrate-slack), or [Integrate Microsoft Teams](https://amplitude.com/docs/analytics/integrate-microsoft-teams) to manage your workspace integrations.
If you use Google Chat, send an [email](https://support.google.com/chat/answer/14929313?hl=en) or [webhook](https://docs.cloud.google.com/workflows/docs/notify-google-chat).
To integrate your Amplitude flags and experiments with Sentry, refer to [Sentry's documentation](https://docs.sentry.io/organization/integrations/feature-flag/generic/).
{% callout type="note" heading="" %}
You must have [Member permissions](https://amplitude.com/docs/admin/account-management/user-roles-permissions) to create, edit, or delete notification alerts. You don't need permissions to receive notifications if you're a member of the dedicated Slack channel or webhook. However, you must have Viewer permissions to open the notification for more details. Contact your Admin if you need different permissions.
{% /callout %}
## Connect a Slack workspace to your experiment notifications
1. Go to _Experiment_ and then click _Experiments_.
You can also access alerts by going to _Settings > Personal settings > Experiment_ and clicking **Add alert**, or _Settings > Organization settings > Experiment_ and clicking **Add alert**.
2. Click **Alerts** in the top right.
3. Click **Connect To Slack**.
4. Click **Allow** to confirm that you want to connect Amplitude to Slack.
{% callout type="note" heading="" %}
If a Slack channel ID appears instead of a Slack channel name, confirm that you connected Amplitude to your Slack workspace. If the connection exists, confirm that you're a member of the Slack channel. To request access, contact the person who created the alert (displayed in the **Created** column of the table).
{% /callout %}
## Connect Microsoft Teams to your experiment notifications
To deliver experiment alerts to a Microsoft Teams channel, your organization must connect Amplitude to Microsoft Teams. If the connection doesn't exist, the alert creation modal shows a **Connect to Microsoft Teams** action that starts the connection flow.
For setup steps, go to [Integrate Microsoft Teams with Amplitude](https://amplitude.com/docs/analytics/integrate-microsoft-teams).
## Change alerts
Change alerts notify you when flag or experiment configurations change. Amplitude generates an alert any time a change creates a new history version, or when you activate or deactivate flags.
### Experiment activities that generate alerts
Specify which experiment activities trigger alerts:
- Flags created, updated, or deleted.
- Targeting rule changes (for example, updates to target segments or bucketing settings).
- Variant changes.
- Flag activation or deactivation.
## Set up an alert
After you connect your Slack workspace or Microsoft Teams organization to Amplitude, you can create notifications for your experiments.
To send notifications through webhooks, provide the URL and a valid [signing key](https://docs.knock.app/developer-tools/outbound-webhooks/overview#verifying-the-signature) when you create the alert.
Webhook schema:
```json
{
"flagId": number
"flagName": string (This is the flag key and not the flag name. If you want the flag name, use `flag.name`)
"scope": "exp_deployment" | "project" | "exp_tags"
"scopeParam": number | undefined
"scopeParamName": string | undefined
"action": "created" | "deleted" | "updated"
"modifiedBy": string
"flag": JSON
"oldFlag": JSON
}
```
{% callout type="note" heading="JSON Schemas" %}
View the JSON schema for the `flag` and `oldFlag` parameters in the [Experiment Management API Flag Endpoints](https://amplitude.com/docs/apis/experiment/experiment-management-api-flags#get-details) documentation.
{% /callout %}
### Create an alert
1. From the Amplitude home page, go to the _Experiment_ section and click _Experiments_.
You can also access alerts by going to _Settings > Personal settings > Experiment_ and clicking **Add alert**, or _Settings > Organization settings > Experiment_ and clicking **Add alert**.
2. Click **Alerts** in the top right.
3. Specify the project.
4. Set the scope. Select one of:
- **All In the Project**: Notifications for all experiments and flags in the project.
- **By Deployment**: Notifications for all experiments and flags in the deployment. Specify the deployment by label. For more information, go to [Deployments](https://amplitude.com/docs/feature-experiment/data-model#deployments). Web Experiments and Guides & Surveys experiments use the Project API Key deployment.
- **By Tag**: Notifications only for experiments and flags tagged with specific labels.
5. Choose the delivery channel:
- For Slack, click the dropdown to choose the channel for your alerts.
- For Microsoft Teams, click the dropdown to choose the team and channel for your alerts.
- For a webhook, enter the URL and your signing key.
- For email, enter an email address.
6. Name your alert.
7. Click **Create Alert**.
================================================================================
# Set the MDE for your experiment
URL: https://amplitude.com/docs/feature-experiment/experiment-theory/experiment-set-mde
================================================================================
# Set the MDE for your experiment
Before you run an experiment, set a Minimum Detectable Effect (MDE) to estimate how you measure success. Think of MDE as the minimum change you want to find by running your experiment. No standard calculation exists for the MDE, so setting one requires judgment. In Amplitude Experiment, the default MDE is 2%. Because the MDE links directly to your business needs, be thoughtful during each experiment's [design phase](https://amplitude.com/docs/feature-experiment/workflow/define-goals). When you set the MDE, consider the primary metric and any associated risks.
## MDE and the metric goal type
When you create your experiment, you select between two metric goal types: success or guardrail. The following case study shows how the goal type can change the MDE.
The marketing director of a small arts organization uses Amplitude Experiment to plan updates to a ticketing management system. With no data science team, the director decides which experiments to run and how to run them. The planned updates are:
- Add a "quick checkout" option on event pages to increase conversion from page visits to ticket sales for logged-in users.
- Add a new payment option during checkout for all users.
The goal of the first update is to increase conversion rates, so a success metric fits. The metric tells the marketing director whether the new button sits in the right place and stays visible enough to meet the conversion rate goal. The marketing director's next fiscal quarter goal is to increase ticket sale revenue by 3%. These company goals shape the success metric and set the test direction to *increase* and the MDE to 3%.
The second update meets financial requirements. As a required change to the checkout process, a guardrail metric helps confirm that the new payment method doesn't decrease completed sales. Over the last four fiscal quarters, an average of 1% of users abandoned checkout after starting the process. The guardrail metric direction is *decrease* and the MDE is 1%.
{% callout type="note" %}
If you run a [T-test](https://amplitude.com/docs/feature-experiment/workflow/experiment-estimate-duration), Amplitude's duration estimator can also help set the MDE. Review the recommended MDE that Amplitude provides, or change the MDE until the duration estimate is reasonable.
{% /callout %}
## MDE and the primary metric
In Amplitude, the MDE is relative to the control mean of the primary metric. For example, if the conversion rate for the control group is 10%, an MDE of 2% (0.2) means Amplitude detects a change when the rate moves outside the range 9.8% to 10.2%.
In the ticketing case study, the primary metric of ticket sales may require a different MDE if:
* The hypothesis testing experiment runs during an annual discount on ticket prices.
* The number of available events, which correlates positively to ticket sales, is much smaller than previous fiscal quarters.
* The experiment runs during a global pandemic that prohibits large in-person gatherings.
Consider your business needs and circumstances when you plan an experiment and set the MDE. One goal of any experiment is to cause as little harm as possible.
{% callout type="note" %}
You can also set the MDE when you analyze your experiment results.
{% /callout %}
## MDE and associated risk
Experiments don't produce risk-free results, and running them can take time and require large sample sets. This can mean higher costs and greater potential for adverse effects on users. The MDE has an inverse relationship to sample size: the smaller or more "sensitive" the MDE, the larger the sample size you need to reach statistical significance.
Use these questions to assess risk:
* Are the estimated costs or run time of an experiment worth the expected outcome?
* What are the possible negative side effects for users in the experiment, and is the outcome worth potential losses?
* Do you need an experiment at all, or should you consider other options, such as a feature release?
* What's the smallest percentage change that satisfies you? For example, would you roll out the experiment if you saw a lift of 2%, 3%, or 5%?
* If your experiment produces positive outcomes, such as an increase in annual subscribers from 100 to 105, is that change large enough to present to leadership?
## Common questions
These questions cover Amplitude Experiment's duration estimate. For setup guidance and pre-launch planning, refer to [Estimate the duration of your experiments](https://amplitude.com/docs/feature-experiment/workflow/experiment-estimate-duration).
### How does the duration estimate work?
The experiment duration estimate predicts how long your experiment needs to run to generate statistically significant results. The duration estimate works only with the primary metric and sequential testing, and doesn't support Experiment Results.
Amplitude Experiment uses the means, variances, and exposures of your control and variants to forecast expected behavior and calculate the number of days your experiment takes to reach statistical significance. The prediction improves as more data arrives. If any of these inputs change significantly during the experiment, the accuracy of the prediction is likely to decrease.
### What's the difference between the duration estimate and the duration estimator?
Amplitude calculates the duration estimate using sequential testing while the experiment runs. The duration estimator uses the [T-test](https://amplitude.com/docs/feature-experiment/workflow/experiment-estimate-duration).
### Why isn't the duration estimate showing?
The duration estimate displays when your experiment meets all the following criteria:
- The metric hasn't yet reached statistical significance.
- The end date of the analysis window is in the past.
- The experiment has enough observations.
- The experiment status is rolled out or rolled back.
- None of the following statistical conditions hold:
- The absolute lift is outside the confidence interval.
- The confidence interval flips (lower confidence interval > upper confidence interval). This can happen when the mean for the treatment or control fluctuates while the experiment runs, or when rollout weights or targeting segments change.
- The standard error is very small.
- The variance is negative.
- The conversion rate is greater than 1 or less than 0 (where applicable).
If the estimate doesn't show, one or more of these criteria isn't met.
### Is there a cap for the duration estimate?
Yes, the cap is 40 days. The reasons:
- The duration estimate uses real-time simulations, where latency scales with the number of days simulated.
- Means and standard deviations usually don't change much over time, especially for experiments with longer running times.
- Short-term predictions are easier to make accurately than long-term predictions. (Weather forecasts beyond ten days change frequently as the date approaches for the same reason.)
- Most experiments shouldn't take 40 days to complete.
### How does Amplitude Experiment determine the number of exposures per day?
Amplitude Experiment assumes a constant number of exposures per day. Amplitude calculates this value by dividing the cumulative exposures as of today by the number of days the experiment has run so far.
### What types of errors are there?
The duration estimate is still an estimate. Don't take it as truth. You may encounter:
- Irreducible error: error inherent to the estimation process. You can't correct for it. Each simulation reaches statistical significance at a different time, which is the main reason to run multiple simulations. The time it takes for an experiment to reach statistical significance is itself a random variable. The time depends on the p-value, which depends on the data the experiment collects. Even if you know the control mean, control standard deviation, treatment mean, and treatment standard deviation, and you force a normal distribution and independence on everything, Experiment can't reduce error all the way to zero.
- Incorrect estimates: when Amplitude Experiment generates a duration estimate, Amplitude estimates the control population mean, control population standard deviation, and other quantities from the sample. These estimates are as good as they can be, but they still leave room for error.
- Drift: for example, if today the control mean is 5 and ten days from now it's 15, the control mean shows drift. A common example is seasonality. Drift in any input degrades the estimate, because the model assumes no drift during hypothesis testing.
### What does "Threshold reached" mean?
If your experiment displays "Threshold reached" with "0 days left" in the duration estimator, the confidence interval doesn't contain the MDE (the threshold).
This message isn't necessarily bad when your recommendation metric is a guardrail, because the effect size is smaller than the allowed amount.
The message is a bad sign when your recommendation metric is a success metric, because the effect size is smaller than what you hoped for. End the experiment in this case: even if you reach statistical significance, the lift is smaller than what's practically significant.
### What does "Statistical significance may never reach" mean?
When the duration estimator shows 40 or more days to complete an experiment, Amplitude may assume that the experiment isn't likely to reach statistical significance after running for two weeks. In those cases, Experiment shows this message.
================================================================================
# Set up and run mutually exclusive experiments
URL: https://amplitude.com/docs/feature-experiment/advanced-techniques/mutually-exclusive-experiments
================================================================================
# Set up and run mutually exclusive experiments
When you run several experiments at the same time, you may want to keep users who receive one experiment from seeing a second, related experiment. These experiments might solve the same problem in different ways, and you don't want to confuse users who see both. The [interaction effect](https://dictionary.apa.org/interaction-effect) can also distort your results.
Experiment lets you set two or more experiments as mutually exclusive. Mutually exclusive experiments don't share users: users who receive experiment A don't receive experiment B, and the reverse also holds.
To learn more about the underlying implementation, refer to [flag dependencies](https://amplitude.com/docs/feature-experiment/under-the-hood/flag-dependencies).
## When to use mutually exclusive experiments
Use mutually exclusive experiments in these situations:
* Simultaneous experiments that occur in the same area of your product and share the same goal.
* Simultaneous experiments that occur in the same funnel and share the same goal.
You can also run these experiments one after the other instead of simultaneously.
## Create a mutual exclusion group
Note these guidelines when you use mutual exclusion groups:
* Distribute traffic evenly between your slots. A slot is the percentage of the group that you want to receive an experiment. You can add multiple slots to your group to distribute traffic across the group.
* Don't add a running experiment to a mutual exclusion group. Adding a running experiment can severely compromise data integrity by removing users from the active experiments. Add experiments to a mutual exclusion group before they start running.
* Don't remove a running experiment from a mutual exclusion group. Removing a running experiment can compromise data integrity by exposing users to the other experiments in the group.
* Don't delete a mutual exclusion group with running experiments, for the same reason. Delete the mutual exclusion group after all experiments in the group conclude.
### To create a mutual exclusion group
1. In the Experiment feature, go to *Experiments > MutEx and Holdouts tab*.
2. If your project has no groups, click **Add a new mutual exclusion group** to create a new group. If you already have groups, click **Create Group**, then select **Mutual Exclusion Group**.
3. Enter a name and description for your group, then enter delivery settings such as evaluation mode, bucketing, and key.
4. Create the number of slots you want and assign experiments to each slot. Experiments in different slots are mutually exclusive. You can add a maximum of 20 slots to a mutual exclusion group.
{% callout type="note" %}
After you create the group, you can't change the number of slots it contains or the traffic allocation percentages. This restriction ensures consistent bucketing and a consistent user experience.
{% /callout %}
5. (*Optional*) Specify individuals or cohorts to add to your mutual exclusion group from the Individuals or Cohorts tabs. This step is helpful when you want to test an experiment in a mutual exclusion group to confirm that Amplitude assigns a specific user to a specific experiment. Don't add the same users or cohorts to more than one slot, because the first slot determines inclusion.
6. Set the traffic allocation percentages for each experiment. By default, Amplitude distributes traffic evenly between them, but you can edit these percentages manually.
7. Click **Add Group**.
## Advanced use cases
* To increase traffic allocation to an experiment, change the slot percentage when you create the group. If the group already exists, assign a single experiment to multiple slots within the same group.
* Adding an experiment to multiple mutual exclusion groups further limits the experiment's traffic, because Amplitude evaluates each user for each mutual exclusion group the user belongs to.
For example, consider the following two mutual exclusion groups:
* Mutual exclusion group 1 has experiment A in slot 1 and experiment B in slot 2, where each experiment receives 50% of the traffic.
* Mutual exclusion group 2 has experiment A in slot 1 and experiment C in slot 2, where each experiment receives 50% of the traffic.
In this case, experiment A receives `0.5 * 0.5 = 0.25`, or 25% of the total traffic.
Instead of adding an experiment to multiple mutual exclusion groups, create one group that includes all the relevant experiments. In this example, that group contains experiments A, B, and C.
* Adding an experiment to both a holdout group and a mutual exclusion group further limits the experiment's traffic, because Amplitude evaluates each user for both groups.
For example, consider the following holdout group and mutual exclusion group:
* The holdout group contains experiment A, with a holdout percentage of 5%.
* The mutual exclusion group contains experiment A in slot 1 and experiment B in slot 2, where each experiment receives 50% of the traffic.
In this case, experiment A receives `0.95 * 0.5 = 0.475`, or 47.5% of the total traffic.
To learn more, refer to [working with holdout groups in Amplitude Experiment](https://amplitude.com/docs/feature-experiment/advanced-techniques/holdout-groups-exclude-users).
## Common questions
{% callout type="note" %}
You can only add experiments running with local evaluation to mutual-exclusion groups running with local evaluation.
Mutual exclusion groups can contain a mix of web experiments and feature experiments.
{% /callout %}
### Is it best to create a mutual-exclusion group before launching an experiment?
Yes. Avoid configuration changes that affect targeting after the experiment starts. If you add an active experiment to a mutual-exclusion group, Amplitude Experiment may reassign users.
### How do the slot % allocations affect user targeting?
When you create mutual-exclusion groups, you set an **allocation percentage**: the probability that Amplitude assigns a user to an experiment. For example, an allocation percentage of 25% means users have a 25% chance of joining the experiment. Allocation percentages can total 100% or less. If less than 100%, unused traffic receives the "off" treatment of the experiment.
### When does Amplitude Experiment apply mutual exclusion?
Amplitude Experiment follows a specific order of operations when assigning users to experiments:
`individual user qualification → mutual exclusion → sticky bucketing → target segment`
Because Amplitude Experiment evaluates individual user qualification *before* mutual-exclusion groups, users targeted under **Individual Users** can see multiple experiments even when those experiments share a mutual-exclusion group. The same rule applies to individual inclusions for cohorts: Amplitude Experiment also applies them before mutual-exclusion groups.
### Why does a user see more than one experiment when mutual exclusion is configured?
The same user can see more than one experiment, even when the experiments use mutual exclusion. Possible reasons:
- The order of operations described above (individual user qualification runs before mutual exclusion).
- How [Amplitude tracks unique users](https://amplitude.com/docs/data/sources/instrument-track-unique-users). For example, a user might anonymously use more than one device before logging in. Until Amplitude identifies and merges the user into the existing ID, Amplitude treats the session as a different user available for assignment.
- [Variant jumping](https://amplitude.com/docs/feature-experiment/troubleshooting/variant-jumping), where a user sees two or more variants for a single flag or experiment.
================================================================================
# Holdout groups
URL: https://amplitude.com/docs/feature-experiment/advanced-techniques/holdout-groups-exclude-users
================================================================================
# Holdout groups
Sometimes you need to prevent a percentage of users from viewing an experiment. This matters most when you measure the long-term, combined effects of multiple experiments. Statistical significance in one experiment may not reflect the true, cumulative impact of your experimentation program.
To exclude users from your experiments, create a holdout group. Holdout groups measure the long-term impact of your rolled-out variants and the lift of your experimentation program as a whole. A holdout group retains a set of users from previous experiments and shows them the winning combinations of past results. This group then gives you true measures of success for your previous experiments.
Your holdout groups experience previous experiments. You can set up dependencies that control which experiments the holdout group sees. For more information, go to [Flag dependencies](https://amplitude.com/docs/feature-experiment/under-the-hood/flag-dependencies#holdout-groups).
## Create a holdout group
{% callout type="note" %}
Holdout groups can contain a mix of web experiments and feature experiments.
{% /callout %}
When you use holdout groups, note the following:
* **Set the holdout percentage between 1% and 10%**: Withholding a significant part of your total traffic can extend the time your experiments need to reach a conclusion.
* **Add experiments to a holdout group before they start running**: Adding running experiments to a holdout group can compromise the integrity of your data because Amplitude unassigns users from the active experiments.
* **Don't remove a running experiment from a holdout group**: Removing a running experiment compromises the integrity of your data because Amplitude assigns users to the active experiments.
* **Don't delete a holdout group with running experiments**: To protect your running experiment's data, delete the holdout group after all experiments in the group conclude.
##### To create a holdout group
1. In the Experiment functionality, go to *Experiments > Mutex and Holdouts tab*.
2. To add a new holdout group to your project, click **Add a new holdout group**.
* If you have existing groups, click **Create A New Group**, and then select **Holdout Group**.
3. In the Holdout group settings modal, enter the name, description, and holdout percentage for the group. You can also view and change advanced settings such as the evaluation mode and bucketing key of your group.
{% callout type="note" %}
You can't change the holdout percentage after you create a group. This restriction ensures consistent bucketing and a consistent user experience.
{% /callout %}
4. Click **Add Experiment** to add experiments to your holdout group.
5. (*Optional*) Specify individuals or cohorts to include in or exclude from your holdout group. From either the Individuals or Cohorts tabs, add a user or cohort under *Include in holdout* or *Exclude from holdout*. This option ensures that Amplitude always holds out or never holds out specific users from the holdout group.
Don't add the same users or cohorts to both the *Include a holdout* and *Exclude from holdout* slots. The *Include a holdout* slot determines inclusion.
6. Click **Add Group** to finish the process.
## Manage holdout groups
Manage your holdout groups from the Experiment Groups tab or from within an experiment:
1. In the Mutex and Holdout tab, scroll down the table until you find the group you want to edit.
2. Click the **edit** icon.
3. Make your changes in the Holdout group settings modal and click **Save**.
If you're within an experiment that's part of a holdout group, follow these steps:
1. Click the name of the group you want to edit.
2. Make your changes in the Holdout group settings modal and click **Save**.
## Analyze a holdout group
Analyze your holdout groups using an Experiment Results chart.
##### To create a pre-populated Experiment Results chart
1. Navigate to the Experiments page and click the **Mutex and Holdout** tab.
2. Find the holdout group you want to analyze and click the **Analyze** icon.
3. Click **Open in Chart**.
4. A new Experiment Results chart opens, with the following fields complete:
* Exposure event
* Segments for `Holdout` and `On`
* Statistical method set to [T-test](https://amplitude.com/docs/feature-experiment/experiment-theory/analyze-with-t-test) (*Samples per variant needed* set to 10,000)
* Analysis date range
5. From here, select the primary metric and start analyzing the impact of your holdout group.
## Advanced use cases
### Streamline multiple experiments and holdout groups
Adding an experiment to multiple holdout groups can limit the experiment's traffic. Experiment evaluates each user for each holdout group they belong to.
For example, you have the following two holdout groups:
* **Holdout group 1**: This group contains Experiment A and Experiment B, with a holdout percentage of 5%.
* **Holdout group 2**: The second group contains Experiment A and Experiment C, also with a holdout percentage of 5%.
Because Experiment A is part of both holdout groups (1 and 2), it receives the majority of the total traffic, or `0.95 * 0.95 = 0.9025` (90.25%).
Instead of adding an experiment to multiple holdout groups, create a single group with all the relevant experiments. A single group distributes traffic more evenly across experiments.
In the example above, you create one holdout group that contains all three experiments (A, B, and C).
### Manage experiments with holdout groups and mutual exclusion
Adding an experiment to a holdout group and a mutual exclusion group further limits the amount of traffic to the experiment. Experiment evaluates each user for both the holdout group and the mutual exclusion group.
For example, consider the following holdout group and mutual exclusion group:
* **The holdout group** has a holdout percentage of 5% and contains Experiment A.
* **The mutual exclusion group** directs half the traffic to Experiment A in slot 1, and the other half to Experiment B in slot 2.
In this scenario, Experiment A receives about half of the total traffic, or `0.95 * 0.5 = 0.475` (47.5%).
You can use holdout groups with mutual exclusion, but watch for the potential traffic limits as you plan and roll out your experiments.
For more information, refer to [mutual exclusion groups](https://amplitude.com/docs/feature-experiment/advanced-techniques/mutually-exclusive-experiments).
================================================================================
# Estimate the duration of your experiments
URL: https://amplitude.com/docs/feature-experiment/workflow/experiment-estimate-duration
================================================================================
# Estimate the duration of your experiments
The Duration Estimator helps you determine which experiment ideas are viable before you start building. Use the Duration Estimator to avoid running tests that may never reach statistical significance, and to prioritize experiments that can deliver results in a reasonable timeframe.
{% callout type="note" %}
The Duration Estimator supports T-tests. Sequential testing, Bayesian methods, and multi-armed bandit methods aren't available in this workflow.
{% /callout %}
## Open the duration estimator
In your experiment setup, select **Estimate Duration** to open the Duration Estimator.
When you first open the Duration Estimator, you see an empty state. After you add your traffic event and success metric, the Duration Estimator calculates how long your test needs to run.
## Set up your estimate
### Step 1: Add your traffic event
Select **+ Add Event**, and choose the event that represents traffic where you run your experiment.
For example, if you test your homepage, select `Page Viewed`, and add a filter for your homepage URL.
The Duration Estimator pulls the last 29-30 days of traffic data from Analytics, and shows Users per day in the results panel.
If you don't have the right event, select **Enter Manually** to input your own total daily traffic estimate. Traffic is total traffic, not for each variant.
### Step 2: Add your success metric
Select **+ Add Metric**, and choose the conversion metric you want to improve with this experiment.
A success metric is the visitor action you're trying to change with your experiment. Think about what you want more visitors to do because of your changes.
Common success metrics:
- Conversions: Visitor completes a key action, such as signed up, purchased, enrolled, or subscribed.
- Form completions: Visitor submits a form or completes a flow.
How to choose:
- Ask: `What action do you want more visitors to take?`
- Look for metrics that match that action.
- If you see similar metrics, choose a conversion metric (which Amplitude marks as `Conversion of...`) or a metric with an official blue badge.
{% callout type="tip" %}
Choose a metric your team uses often.
{% /callout %}
For example, if you test your homepage hero banner and want more visitors to enroll in a course, select `Conversion of registration: course enrolled`.
The Duration Estimator calculates your current conversion rate from the last 29-30 days of Analytics data, and shows the rate in the results panel (for example, `78.8% -> 82.8%`).
If you don't see the metric you need:
- Search with the search bar at the top of the dropdown.
- Select **Create Metric** at the bottom to build a new one.
- Select **Enter Manually** to input your own baseline conversion rate.
### Step 3: Set your minimum detectable effect (MDE)
The relative MDE is the smallest improvement you want to detect. The default is 5%, which means you test whether you can improve your baseline by 5%.
For example, if your baseline conversion is 78.8% and you set a 5% MDE, you test whether you can reach 82.8%.
How to think about MDE:
- Big, bold changes (like redesigning a hero banner above the fold): expect a large lift, such as 8%.
- Small, subtle changes (like changing button text below the fold): expect a small lift, such as 2%.
- Smaller MDEs require much longer test durations.
If you don't have historical data, select **Enter Manually** to input your own baseline conversion rate.
## Understand your results
After you add your traffic and success metric, the **Estimated Duration** panel shows:
- Duration: How many days you need to run the test (for example, `~130 days`).
- Users per day: Daily traffic the Duration Estimator pulls from Analytics.
- Lift: Your baseline conversion rate to target conversion rate with your MDE percentage.
- Summary: Plain-language explanation you can share with stakeholders.
If your duration is very long, you see a **Long Duration** warning badge. Use the Duration Scenarios table to explore different scenarios.
## Use the Duration Scenarios table to prioritize
The Duration Scenarios table is the most important part of the Duration Estimator. The table shows how your choices affect test duration, so you can make better decisions about what to test and when.
### How to read the table
Rows (confidence level):
- Low (85%): Less certainty your results are real, but faster results.
- Medium (90%): Balanced approach (default setting).
- High (95%): More certainty your results are real, but takes longer.
- Custom %: Enter your own confidence level.
Columns (lift size/MDE):
- 2%: Small, subtle changes (takes longest to detect).
- 5%: Medium-sized changes (default setting).
- 8%: Large, bold changes (fastest to detect).
- Custom %: Enter your own MDE.
The table highlights your selected combination and shows durations for all other scenarios.
### How to think about confidence level
Your confidence level is the risk you're willing to take with your results. Choose based on what's at stake.
95% confidence: Use when the cost of being wrong is high.
- Revenue-critical tests (checkout flows, pricing, and subscriptions).
- High-impact placements (homepage hero, above-the-fold content, and navigation).
- Sensitive or costly bets (brand-new features, compliance-heavy areas, and high-cost builds).
90% confidence: Use when you want balance between speed and reliability (default).
- Medium-stakes decisions where time matters, but the cost of being wrong is manageable.
- Engagement-focused outcomes (click-throughs, mid-funnel steps).
- Iterative improvements in areas with prior evidence.
85% confidence: Use when you need a directional signal.
- Early validation (MVPs, prototypes you follow up on).
- Low-stakes tests (low-traffic pages, below-the-fold changes).
- Well-understood areas where a topline read is enough.
### How to think about MDE (lift size)
MDE reflects the expected impact of your experiment idea. Ask: `How much lift do I realistically expect this change to drive?`
Large MDE (8%+): Use for bold changes with dramatic impact.
- Prominent new CTAs at the top of the homepage.
- Major redesigns of key flows.
- Revenue-driving promotions.
- Because the effect is big, the test resolves quickly.
Medium MDE (3-5%): Use for meaningful but not dramatic improvements.
- UX enhancements.
- Layout adjustments.
- Copy changes.
- This is the most balanced choice for everyday experimentation.
Small MDE (1-2%): Use for subtle tweaks, or when tiny gains are valuable.
- Microcopy changes.
- Slight color adjustments.
- Incremental funnel optimizations.
- These require the most time and traffic, but can add up in mature, high-volume products.
### Use the Duration Scenarios table for prioritization
#### Scenario 1: Your test takes too long
If your estimate shows `~130 days` at 5% MDE and 90% confidence, review the table:
- At 8% MDE (larger change), duration drops to `~51 days`.
- At 85% confidence (lower certainty), duration drops to `~102 days`.
Decision framework:
- Can you test a bigger, bolder idea to get results faster?
- Are the stakes low enough to justify 85% confidence for a quicker read?
- Or is this a high-stakes test where 90-95% confidence is worth the wait?
#### Scenario 2: Compare multiple test ideas
You have three test ideas in your backlog:
- Homepage hero redesign (expected 8% lift): `~51 days` at 90% confidence.
- CTA button text change (expected 5% lift): `~130 days` at 90% confidence.
- Footer link color change (expected 2% lift): `~632 days` at 90% confidence.
Decision: The hero redesign is viable and can deliver results quickly. The CTA change may be worth running if you lower to 85% confidence (`~102 days`). The footer change takes over a year, so it isn't worth testing now.
#### Scenario 3: Balance your testing portfolio
Use the Duration Scenarios table to create a balanced mix:
- High-impact tests (8% MDE, 90-95% confidence): One to two major tests for each quarter that resolve in two to four weeks.
- Everyday optimizations (3-5% MDE, 90% confidence): Regular tests that deliver steady improvements in three to six weeks.
- Quick validation (5-8% MDE, 85% confidence): Fast directional reads on new ideas before heavier investment.
#### Scenario 4: Low-traffic pages
If you test a low-traffic page and durations are very long across all scenarios, you may need to:
- Test on a higher-traffic page.
- Wait until you accumulate more traffic.
- Test something with a larger expected impact.
The Duration Scenarios table makes these trade-offs visible, so you can prioritize experiments that fit your traffic and timeline constraints.
## Adjust advanced settings (optional)
Select **Advanced Settings** to access additional controls:
- **Confidence level**: Low (85%), medium (90%), or high (95%).
- **Statistical power**: Probability of detecting a true effect (default 80%).
- **Rollout**: Percentage of visitors you expose to the experiment (default 100%).
- **Number of variants**: Total variants including control.
- **Distribution**: How traffic splits between variants (default evenly).
- **Statistical method**: T-test.
Most teams don't need to adjust these settings. The defaults work well for standard A/B tests.
## Tips for reducing test duration
If your estimated duration is longer than your timeline allows, use these options.
### Test a bigger idea (increase MDE)
The biggest factor in test duration is the size of the change you want to detect. Larger changes produce larger lifts and resolve faster.
For example, moving from 5% MDE to 8% MDE can reduce duration from `~130 days` to `~51 days`.
Ask:
- Can you test a more impactful variation instead of a subtle tweak?
- Instead of changing button color, can you redesign the entire CTA section?
- Instead of tweaking microcopy, can you rewrite the entire headline?
Large-impact ideas resolve faster. Small-impact ideas take longer, but can add up in mature, high-volume products.
### Lower your confidence level (when stakes allow)
Dropping from 90% to 85% confidence reduces duration, but increases false-positive risk (calling a winner when there isn't one).
For example, at 85% confidence, the same 5% MDE test takes `~102 days` instead of `~130 days`.
Ask:
- What's the cost of being wrong?
- Is this a low-stakes test (below-the-fold change, well-understood area)?
- Can you validate results with a follow-up test if needed?
Don't lower confidence for:
- Revenue-critical tests.
- High-impact placements.
- Brand-new features, or unknown customer segments.
### Choose a higher-traffic page or event
Low traffic is a common reason tests take too long.
Ask: Can you run this test on a higher-traffic page, or choose a more frequent conversion event?
### Increase rollout percentage
If you only expose 50% of visitors to the experiment, increasing to 100% can reduce duration by about half.
### Reduce number of variants
Testing four variations takes much longer than testing two. Consider multiple sequential tests instead of one large multi-variant test.
### Decide if the test is worth running
Sometimes a test isn't feasible. If the Duration Scenarios table shows hundreds of days across all scenarios, the test probably isn't worth building.
## Common mistakes to avoid
- Defaulting to 95% confidence every time. This makes sense for high-stakes tests, but can slow low-stakes experiments.
- Chasing only small lifts. Looking for 1-2% MDE improvements can require large traffic and long run times.
- Skipping a duration check. Even with the right settings, some experiments can't reach significance with available traffic.
The Duration Estimator helps you make this call before you spend time and resources on a test that may never reach significance.
## Common questions
### Why does my estimate say **Long Duration**
Your test takes a long time to reach statistical significance, often because of low traffic or small MDE. Use the Duration Scenarios table to explore faster alternatives.
### What if I don't have 30 days of historical data
Update the timeframe, or select **Enter Manually** to input your own traffic and conversion estimates. Results are most accurate with at least a few weeks of stable data.
### Can I change the MDE after I see the estimate
Yes. Adjust the MDE percentage in the success metric section, and the estimate updates automatically. Use the MDE control to explore different scenarios before committing to your test design.
### What does `Last 29 days offset by 1` mean
This label shows the data timeframe the Duration Estimator uses for calculations. `Offset by 1` means the calculation excludes today because today's data is incomplete, and looks at the previous 29 complete days.
### Should I always aim for high (95%) confidence
No. Many experiments run at medium (90%) confidence, which balances speed and accuracy. Use high confidence when stakes are high, or when you need maximum certainty before a decision.
### How do I choose a success metric
Start by asking `What action do you want more visitors to take?` Then choose a metric that matches that action. Conversion metrics (which Amplitude marks as `Conversion of...`) are often the best choice.
If you're still unsure, search for metrics related to your goal, or select **Enter Manually** to input your own baseline.
### Where can I learn about live experiment duration estimates
Review [Experiment duration estimates](https://amplitude.com/docs/feature-experiment/experiment-theory/experiment-set-mde#common-questions) to understand the duration estimate that Experiment shows while an experiment runs.
================================================================================
# Create a feature flag
URL: https://amplitude.com/docs/feature-experiment/workflow/feature-flag-rollouts
================================================================================
# Create a feature flag
In Amplitude Experiment, a flag enables or disables a function or feature in your product without redeploying code. Flags drive both experiments and feature rollouts. Use flags to launch experiments and end them after you collect enough data, or to roll out new features and roll them back quickly when needed.
Amplitude offers this feature to users on all plans.
This article explains how to create a flag for a feature rollout. For information on how to use flags in your experiments, refer to [rolling out your experiment to your users](https://amplitude.com/docs/feature-experiment/workflow/experiment-test).
{% callout type="tip" heading="Migrate your flags from Optimizely" %}
Migrate your flags from Optimizely into Amplitude. Contact your Amplitude representative or [Amplitude Support](https://gethelp.amplitude.com) to start the process.
{% /callout %}
## Create a new flag
Before you create a flag, create a deployment and either install the [SDK](https://amplitude.com/docs/sdks/experiment-sdks) or configure the [evaluation REST API](https://amplitude.com/docs/apis/experiment/experiment-evaluation-api). Then follow these steps:
1. Navigate to *Experiment > Feature Flags* in the left sidebar and click **Create A Feature Flag**.
2. In the Create Flag modal, choose the project for this flag from the **Projects** drop-down menu. Enter a name for your flag. Experiment generates the flag key from the name. The flag key identifies the flag in your codebase.
3. Specify the [evaluation mode](https://amplitude.com/docs/feature-experiment/local-evaluation) for your experiment: **Remote** (Amplitude evaluates the flag on Amplitude's servers) or **Local**. Then specify the **bucketing unit** for this experiment.
{% callout type="tip" %}
The best bucketing unit is usually the user. In some B2B use cases, you might use company ID or city as the bucketing unit. For example, bucketing by company ID ensures that all users in a company have the same experience. Confirm the [Stable Unit Treatment Value Assumption](https://blogs.iq.harvard.edu/violations_of_s#:~:text=Methods%20for%20causal%20inference%2C%20in,treatments%20of%20others%20around%20him) holds for whichever unit you choose.
{% /callout %}
4. Click **Create**. Experiment opens a blank template for your flag.
5. Choose the deployment for your experiment from the **Deployment** drop-down menu. For more information about deployments, refer to [configuring Amplitude Experiment](https://amplitude.com/docs/feature-experiment/workflow/configure).
6. Click **Advanced Settings** to change the bucketing salt.
{% callout type="note" heading="" %}
Changing the bucketing salt can cause users to switch between variants in your experiment. Amplitude recommends that you don't change the bucketing salt without guidance. For more information, refer to [How randomization works in Amplitude Experiment](https://amplitude.com/docs/feature-experiment/under-the-hood/experiment-randomization).
{% /callout %}
7. In the Settings section, click the **Add** icon in the Variants section to add a variant. Flags must have at least one variant. A variant is the new feature or product experience you roll out to users. You can add as many variants as you need to a feature flag.
8. Enter a name, value, and description for your variant. Amplitude Experiment generates the variant value from the name. The variant value is a string you use as a flag in your codebase. Click **Apply**.
{% callout type="note" %}
Don't name your variants **OFF**. Amplitude Experiment reserves this name for fallbacks (for example, the user segment not included in your experiments).
{% /callout %}
## Roll out a new feature
After you create the flag, use it to roll out a new feature.
1. In the Assignment panel, define the user segments that receive your new feature and specify the rollout percentage.
Define a user segment to limit your rollout to users in a specific geographic location, users in certain demographic groups, or users who meet certain usage thresholds (for example, power users).
To define a user segment, scroll to the Rule Based User Segments section and click **Segment 1**. Follow the same steps you use to build a user segment in Amplitude Analytics.
All Amplitude user properties and cohorts are available for defining user segments. You can include any number of user segments.
2. Set the **rollout percentage** for this feature. This is the percentage of users in the flag's user segments who receive the new feature. To give everyone in the user segment access, set this value to 100%.
3. Set the percentage for each variant to define how many users receive each one. Percentages must sum to 100%. For example, if you set variant A to 20% and variant B to 80%, four times as many users receive variant B as receive variant A.
4. Set separate rules for users not covered by any segment you created. For example, to limit the rollout to the cohorts you targeted, scroll to the All Other Users section and set the rollout percentage to **zero**.
5. Save your flag and QA it before you set it to **Active**. For more information, refer to [QAing before launching an experiment](https://amplitude.com/docs/feature-experiment/workflow/experiment-test). Your feature is live for the user segments you selected.
================================================================================
# Create a new experiment
URL: https://amplitude.com/docs/feature-experiment/workflow/create
================================================================================
# Create a new experiment
The decisions you make in the [design](https://amplitude.com/docs/feature-experiment/workflow/define-goals) phase define your experiment's success. Define your experiment's purpose and goals before you start to gain useful, actionable insights.
For example, you want to run a hypothesis testing experiment with a direction setting of "increase" and a minimum goal (MDE) of 2%. This setting means you expect the metric to increase by at least 2%. If you change the experiment type to *Do No Harm*, you expect the metric to "not increase by 2%". A good use case for a Do No Harm experiment is launching a service agreement in your app and then testing for a lack of change in user retention.
To create a new experiment, [install an SDK](https://amplitude.com/docs/sdks/experiment-sdks) or call the [evaluation API](https://amplitude.com/docs/apis/experiment/experiment-evaluation-api).
Before you launch, estimate run time and viability with the [Duration Estimator](https://amplitude.com/docs/feature-experiment/workflow/experiment-estimate-duration).
## Create a feature experiment
1. Go to *Create > Experiment*, and select **Feature**.
2. Complete the following fields:
- **Name**: enter the name of the experiment for future reference.
- **Project**: select the project in which this experiment operates.
- **Experiment type**: select from the following:
- **A/B test**: test one or more variants with a goal of improving a metric. Run A/B tests using hypothesis testing or do-no-harm methodologies. For more information, refer to [Define your experiment's goals](https://amplitude.com/docs/feature-experiment/workflow/define-goals).
- **[Multi-armed bandit](https://amplitude.com/docs/feature-experiment/workflow/multi-armed-bandit-experiments)**: Amplitude allocates an increasing amount of traffic to the winning variant, based on the primary metric, until it reaches 100% allocation.
- For web experiments, enter the *Targeted Page URL* where this experiment runs.
3. Optionally, complete the following fields:
- **Key**: keys are unique to experiments and identify which experiments a user participates in. You can edit keys until you run the experiment.
- **Evaluation mode**: select whether the experiment runs locally or on Amplitude's Experiment servers. For more information, refer to [Local evaluation](https://amplitude.com/docs/feature-experiment/local-evaluation) and [Remote evaluation](https://amplitude.com/docs/feature-experiment/remote-evaluation).
- **Bucketing unit**: select the unit Amplitude uses to assign variants, either `User` or `Group`.
4. Select **Create**.
After Amplitude creates the experiment, configure additional aspects of the experiment. Go to [Define your experiment's goals](https://amplitude.com/docs/feature-experiment/workflow/define-goals) for next steps.
================================================================================
# Define your experiment's goals
URL: https://amplitude.com/docs/feature-experiment/workflow/define-goals
================================================================================
# Define your experiment's goals
An experiment can't tell you anything without metrics to track against. Add metrics to your experiment in the Goals section of the experiment design panel.
Define your primary metric and any secondary metrics.
A primary metric determines whether to accept or reject your hypothesis, and whether your experiment succeeded or failed. Choose the right primary metric to evaluate experiment success. If you're new to A/B testing, follow these guidelines to choose a primary metric:
* Identify the single user action that tells you if your [variant](https://amplitude.com/docs/feature-experiment/workflow/add-variants) is successful.
* Measure an event that the change in your variant directly affects.
* Pick an event that fully captures the user behavior you're trying to affect.
Experiment supports multiple metrics for each experiment. Secondary metrics aren't required, but they improve the quality of your analysis and help you evaluate whether to roll out the experiment.
{% callout type="tip" heading="Revenue metrics" %}
A common mistake is defaulting to a revenue metric when your variant changes something unrelated to revenue. If your variant changes how your product page looks and functions, choose a metric on that page as your primary metric instead of a revenue metric that may sit several steps down the funnel.
{% /callout %}
### Set up metrics for your experiment
1. Open an existing experiment or [create an experiment](https://amplitude.com/docs/feature-experiment/workflow/create), then scroll to the Metrics section and select the **edit** icon.
2. Select **Add metric**, then choose the metric you want from the drop-down list. Alternatively, select **Create a custom metric** to define your own.
3. Specify whether the metric **should** or **should not** **Increase** or **Decrease**, and by what percentage.
4. (*Optional*) For primary metrics, set the minimally acceptable goal. This is the smallest relative distance between the control and the variant needed to determine experiment success or failure.
5. To add secondary metrics, select **Add Metric** and repeat the process.
After you add your metrics, set your [variants](https://amplitude.com/docs/feature-experiment/workflow/add-variants).
### Examples of success and guardrail metrics
**Success metrics** measure the primary outcomes you want to improve:
- **Conversion metrics:** Purchase completion rate, sign-up conversion, add-to-cart rate.
- **Engagement metrics:** Daily active users, average session duration, feature adoption rate.
- **Revenue metrics:** Average order value, revenue for each user, subscription upgrades.
- **Retention metrics:** Day 7 retention rate, return user rate.
**Guardrail metrics** monitor important metrics that shouldn't degrade during the experiment:
- **Performance metrics:** Page load time, API response time, app crash rate.
- **Quality metrics:** Error rate, failed transaction rate, support ticket volume.
- **Core engagement:** Usage of key features unrelated to the experiment, overall session count.
- **Business health:** Subscription cancellation rate, refund rate, negative review rate.
For example, when testing a new checkout flow, your success metric might be "Purchase completion rate (Increase)," and your guardrail metrics could include "Checkout page load time (No increase)" and "Payment error rate (No increase)."
### Duration estimator
The duration estimator calculates the time and sample size you need to achieve significant results, based on your metric settings. Amplitude Experiment pre-populates industry defaults from historical data. You can adjust the confidence level, statistical power, minimum detectable effect, standard deviation, and test type.
## Create a custom metric
Create a new metric if no standard metric meets your needs.
### Steps to create a custom metric
1. Select **Create a custom metric**.
2. Name the metric and add a description.
3. Define the metric's type. A metric can be one of the following types:
* Unique conversions
* Event totals
* Formula
* Funnel conversions
* Return on retention
* Sum of property value
* Average of property value.
4. Set the events you want by selecting **Add Event**, then choose your events.
5. Set any key properties you want.
6. Select **Save and Close**.
{% callout type="note" %}
By default, the Retention metric doesn't support [CUPED](https://amplitude.com/docs/feature-experiment/workflow/finalize-statistical-preferences), exposure attribution settings, or calendar day windows. The Retention metric calculates exposure attribution settings using any exposure and the nth day value based on 24-hour window increments, for up to two months.
{% /callout %}
## Define the exposure event
In your experiment, open the Design Experiment panel or the Analysis Settings and choose the **exposure event**. When a user triggers this event, Amplitude Experiment buckets them into the experiment. The Amplitude exposure event is the most accurate and reliable way to track user exposures to your experiment's variants, so use it when possible.
Amplitude sends the `Amplitude exposure` event when your app calls `.variant()`. The event sets the user properties Amplitude Experiment uses for its analyses. When you use the Amplitude exposure event, the event triggers at the correct time.
You can select a custom exposure event instead. Select **Custom Exposure**, then **Select event**. Custom exposure events carry a greater risk of triggering at the wrong time, which can cause a [sample ratio mismatch](https://amplitude.com/docs/feature-experiment/troubleshooting/sample-ratio-mismatch).
For more information, refer to the [exposure events](https://amplitude.com/docs/feature-experiment/under-the-hood/event-tracking#exposure-events) article.
## Use Aggregated Metrics in experiments
In addition to event-based metrics, you can use [Aggregated Metrics (fka Warehouse Metrics)](https://amplitude.com/docs/data/warehouse-metrics) as goals in your experiments. Aggregated Metrics are precomputed metrics imported directly from your data warehouse into Amplitude, which keeps your source of truth consistent with your experimental analysis.
Aggregated Metrics are valuable when your experiment goals involve business metrics that are difficult to calculate from behavioral events alone, such as:
- **Revenue and financial metrics**: Average order value, credits remaining, or subscription revenue that require calculations across multiple data sources.
- **Customer health metrics**: Customer lifetime value (LTV), health scores, or churn risk predictions modeled in your data warehouse.
- **State metrics**: Current subscription tier, activation status, or account-level attributes that track user state rather than discrete events.
When you add metrics to your experiment, Aggregated Metrics appear in the metrics picker with a warehouse icon. Use them as primary or secondary metrics, just like event-based metrics. Amplitude displays when each Aggregated Metric last synced and when the next sync is scheduled, so you can confirm your experiment results reflect the most current data.
For more information about setting up and using Aggregated Metrics, refer to the [Aggregated Metrics (fka Warehouse Metrics) Overview](https://amplitude.com/docs/data/warehouse-metrics).
================================================================================
# Exposure tracking in Amplitude Experiment
URL: https://amplitude.com/docs/feature-experiment/track-exposure
Updated: 2024-08-28
================================================================================
# Exposure tracking in Amplitude Experiment
When running an experiment, track each user's [exposure](https://amplitude.com/docs/feature-experiment/under-the-hood/event-tracking#exposure-events) to your feature flag's variant experience. Without exposure tracking, results aren't reliable.
{% callout type="note" %}
Exposure tracking is optional for feature flags that don't require analysis.
{% /callout %}
## Analytics REST API
In this example, the [Analytics REST API v2.0](https://amplitude.com/docs/apis/analytics/http-v2) sends an [exposure event](https://amplitude.com/docs/feature-experiment/under-the-hood/event-tracking#exposure-events) to Amplitude with `curl`.
{% api-tester type="exposure" / %}
When the request succeeds, a user appears in the Exposures chart in Amplitude Experiment.
The flag is now active in your deployment, and your experiment evaluated a user and served them the variant.
## SDKs
As with fetching variants, you can simplify exposure tracking using a client-side [Experiment SDK](https://amplitude.com/docs/sdks/experiment-sdks) in your app. Client-side Amplitude Experiment SDKs [automatically track exposures](https://amplitude.com/docs/feature-experiment/under-the-hood/event-tracking#automatic-exposure-tracking) through your installed analytics SDK whenever the Experiment SDK accesses a variant from the variant store.
================================================================================
# Add variants to your experiment
URL: https://amplitude.com/docs/feature-experiment/workflow/add-variants
================================================================================
# Add variants to your experiment
Your experiment needs at least one variant. Experiment compares a variant experience with the control experience, which is usually your product's current user experience (UX). Experiment measures the performance of the variant against a known quantity: the performance of your app today.
## Add and manage variants
Experiment creates your initial variant automatically. By default, this variant uses the name `treatment`. You can rename the variant to describe the experiment you're running.
##### To add more variants
1. In the Experiment section, create a new experiment or open an existing one.
2. Click **Add a variant**.
3. Enter a name for your variant and include a value. By default, the value is a hyphenated (slug) version of the variant name.
{% callout type="tip" heading="Use variant value in your code" %}
When you implement the experiment in your codebase, use the value of the variant to reference it. Experiment SDKs return variant values in lower case with no spaces.
{% /callout %}
4. Add a description of the variant. Be specific so other people can understand what your experiment does.
5. Add an optional **payload**. A payload is a JSON object that changes a variant's experience dynamically without requiring more code.
For example, if you're testing a new splash screen on a marketing webpage, early results might suggest different content could improve performance. Instead of editing your codebase, include the changes in a payload, and Experiment applies them automatically.
Paste or type your code into the window.
6. Click **Apply**.
You can add any number of variants to an experiment, but adding too many can [make it harder for your experiment to reach statistical significance](https://amplitude.com/docs/feature-experiment/advanced-techniques/bonferroni-correction). Keep your experiments to the minimum number of variants needed.
You can drag and drop your variants in any order. The variant with the `control` label is always the control variant, regardless of its position in the list.
## Distribute traffic to your variants
Unless you specify otherwise, Experiment splits traffic evenly between your variants. To send more traffic to specific variations, customize your variant distribution. In your experiment, go to *Targeting > Distribution* to change the distribution percentage.
## Stratified sampling and experiment bias
To spread traffic differently for each user segment you've included:
* Segment 1: `Country = USA || 80% treatment, 20% control`.
* Segment 2: `Country = Canada || 50% treatment, 50% control`.
This approach can introduce bias into your experiment results. In general, use uniform allocation ratios across all user segments in an experiment.
Non-uniform allocation ratios often happen inadvertently when users change their rollouts and variants while an experiment runs.
Amplitude Experiment offers stratified sampling (non-uniform allocation ratios) if you need it. Switch the Allow rollout controls per segment toggle to **On**. This option appears only if you've selected [**Targeted Users**](https://amplitude.com/docs/feature-experiment/workflow/define-audience).
This switch appears only for experiments, not for feature flags. Amplitude disables the switch while your experiment is active.
Click **Continue** to move to the rollout phase.
## Rollout percentage
The next step sets the rollout percentage for this experiment. The rollout percentage is the percentage of users in the experiment's user segments who take part in the experiment. Find the rollout percentage in the Rollout section of the experiment design panel.
Enter the percentage of your audience eligible for bucketing into the experiment. If you roll your experiment out to less than 100% of your users, the remaining users see your default product experience and aren't included in any experiment calculations.
Experiment evaluates users in rule-based user segments before users not covered by a user segment. Experiment evaluates individual user or device IDs before both.
Next, [finalize your experiment's statistical settings](https://amplitude.com/docs/feature-experiment/workflow/finalize-statistical-preferences).
================================================================================
# Cohort Targeting
URL: https://amplitude.com/docs/feature-experiment/cohort-targeting
================================================================================
# Cohort Targeting
A cohort is a static or dynamic set of users defined in Amplitude. For experiment use cases, cohorts are useful for advanced audience targeting. Cohorts aren't always the best solution for targeting, so it's important to understand how cohort targeting works with [local](https://amplitude.com/docs/feature-experiment/local-evaluation) or [remote](https://amplitude.com/docs/feature-experiment/remote-evaluation) evaluation.
Experiment cohort targeting only supports targeting user cohorts.
## Remote evaluation
When you target a cohort in a remote evaluation flag, Amplitude syncs the cohort to the Amplitude Experiment destination. For dynamic cohorts, this sync runs hourly by default. Dynamic cohorts targeted in remote evaluation don't update in real time. For example, if you target a cohort of users who performed a `Sign Up` event, Amplitude targets those users within an hour of the event.
Cohorts targeted for remote evaluation can have a propagation delay on the initial sync or after a large change, depending on the size of the difference. For example, the first sync of a 10-million-user cohort takes longer than later syncs.
Remote evaluation supports cohorts up to 10 million users.
**Remote evaluation cohort targeting use cases**
- You're targeting users based on user behavior or properties that aren't available in Experiment targeting segments.
- The targeting delay from cohort sync intervals doesn't interrupt your process.
Don't use remote evaluation cohort targeting if:
- You need to target users in real time.
## Local evaluation
Local evaluation flags and experiments deployed to up-to-date server-side SDKs can also target cohorts. When you target a cohort in a local evaluation flag, Amplitude syncs the cohort to the Experiment Local Evaluation destination. For dynamic cohorts, this sync runs hourly. Dynamic cohorts targeted in local evaluation don't update in real time. For example, if you target a cohort of users who performed a `Sign Up` event, Amplitude targets those users within an hour of the event, not immediately after.
Local evaluation supports cohorts up to 50 million users.
{% callout type="note" heading="Cohorts only support User IDs" %}
Local evaluation cohorts only sync user IDs to the SDKs. To target cohorts in local evaluation flags, include a user ID in the user object passed to the evaluate function.
{% /callout %}
### SDK support
Server-side SDKs can target cohorts when you configure them to do so. Client-side SDKs don't support local evaluation cohort targeting.
On initialization, configure the cohort sync configuration with the project API and secret key to enable local evaluation cohort downloading and targeting.
| SDK | Cohort Targeting | Version |
| --- | :---: | --- |
| [Node.js](https://amplitude.com/docs/sdks/experiment-sdks/experiment-node-js) | ✅ | `1.13.4+` |
| [Ruby](https://amplitude.com/docs/sdks/experiment-sdks/experiment-ruby) | ✅ | `1.5.0+` |
| [JVM](https://amplitude.com/docs/sdks/experiment-sdks/experiment-jvm) | ✅ | `1.4.0+` |
| [Go](https://amplitude.com/docs/sdks/experiment-sdks/experiment-go) | ✅ | `1.7.0+` |
| [Python](https://amplitude.com/docs/sdks/experiment-sdks/experiment-python) | ✅ | `1.4.0+` |
| [PHP](https://amplitude.com/docs/sdks/experiment-sdks/experiment-php) | ❌ | N/A |
{% code-group %}
```js Node.js
const experiment = Experiment.initializeLocal('DEPLOYMENT_KEY', {
// (Recommended) Enable local evaluation cohort targeting.
cohortSyncConfig: {
apiKey: 'API_KEY',
secretKey: 'SECRET_KEY'
}
});
```
```java Java
// (1) Initialize the local evaluation client with a server deployment key.
LocalEvaluationClient experiment = Experiment.initializeLocal("<DEPLOYMENT_KEY>",
// (Recommended) Enable local evaluation cohort targeting.
LocalEvaluationConfig.builder()
.cohortSyncConfig(new CohortSyncConfig("<API_KEY>", "<SECRET_KEY>"))
.build());
```
```go Golang
client := local.Initialize("DEPLOYMENT_KEY", &local.Config{
// (Recommended) Enable local evaluation cohort targeting.
CohortSyncConfig: &local.CohortSyncConfig {
ApiKey: "API_KEY",
SecretKey: "SECRET_KEY"
}
})
```
```python Python
experiment = Experiment.initialize_local("DEPLOYMENT_KEY", LocalEvaluationConfig(
# (Recommended) Enable local evaluation cohort targeting.
cohort_sync_config=CohortSyncConfig(api_key="API_KEY", secret_key="SECRET_KEY")
))
```
```ruby Ruby
experiment = AmplitudeExperiment.initialize_local('DEPLOYMENT_KEY',
# (Recommended) Enable local evaluation cohort targeting.
AmplitudeExperiment::LocalEvaluationConfig.new(
cohort_sync_config: AmplitudeExperiment::CohortSyncConfig.new(
api_key: 'API_KEY',
secret_key: 'SECRET_KEY'
)
)
)
```
{% /code-group %}
## Troubleshooting
Cohort targeting can be challenging to troubleshoot because dynamic cohorts and cohort syncs are asynchronous. If your experiment isn't targeting users who should be in the targeted cohort, try the following:
- For local evaluation, check that the SDK version supports local evaluation cohort targeting, and that you set the cohort sync config on initialization.
- Check that the cohort has the required sync (*Amplitude Experiment* for remote evaluation, *Experiment Local Evaluation* for local evaluation).
- Check that the cohort contains the expected user. If the user is in the current cohort, check the sync history of the cohort. The user may have been added to the cohort in a sync after the evaluation occurred.
- Check that the user info passed to `fetch` or `evaluate` is correct.
================================================================================
# Managing flags and experiments with approvals
URL: https://amplitude.com/docs/feature-experiment/managing-flags-and-experiments-with-approvals
================================================================================
# Managing flags and experiments with approvals
Improve the governance of your experimentation program and reduce the risk of unintended changes. Require approvals for critical changes to experiment configuration.
Experiment Approvals is only available to Growth and Enterprise customers.
## Configure approvals
To turn on approvals, go to *Organization Settings > Experiment > Approvals*.
Only users with manager or admin roles can modify approvals settings.
Add the individual projects that require approvals.
For each project, specify one of the following options:
1. **Peer approvals**: any user with access can respond to pending approval requests.
2. **Specific approvers**: only designated users can respond to pending approval requests.
Admin users can also respond to pending approvals.
## Request and respond to approval requests
### Require approvals to activate flags and experiments
After you enable approvals for a project, Amplitude recommends this approval process:
1. When you start or schedule an experiment, or activate or schedule a feature flag, select one or more approvers to notify.
2. The experiment shows a "Pending Approval" status until an approver approves the request.
3. Approvers review the experiment and either approve or reject the requested changes.
4. Amplitude notifies the original requestor of the response.
While the approval is pending, users can make additional changes to the flag or experiment configuration, enter or exit testing mode, or cancel the request at any time.
After a scheduled flag or experiment receives approval, the flag or experiment goes live and requires approvals for critical changes.
### Require approvals for critical changes to live flags and experiments
When a flag or experiment is active, the following updates also require approval:
| Field | Type of change |
| --- | --- |
| Target segments | Adding and removing segments, modifying conditions or bucketing. |
| Variants | Any changes, including adding, renaming, or removing variants. |
| Variant distribution | Any changes. |
| Exposure event | Any changes. |
| Bucketing salt | Any changes. |
| Sticky bucketing | Enabling or disabling. |
When reviewing these approval requests, users can view the full list of changes in the approval banner.
When an approval is pending, Amplitude locks the flag or experiment. The lock prevents other users with access from making changes until the approval request completes or cancels.
================================================================================
# Stale flag management
URL: https://amplitude.com/docs/feature-experiment/stale-flag-management
================================================================================
# Stale flag management
Stale flag management helps you maintain a clean codebase by identifying feature flags that Amplitude fully rolled out or rolled back for a set period.
## How flags and experiments become stale
A feature flag or experiment becomes stale when it meets one of these conditions:
* **Rolled out**: Amplitude rolled out the flag or experiment to 100% of users for more than 30 days.
* **Rolled back**: The flag or experiment is inactive or set to 0% rollout for more than 30 days.
After a flag or experiment becomes stale, you can remove the flag from your codebase and archive it in Amplitude.
## Viewing stale flags and experiments
### Stale status badge
In the list of your flags or experiments, a status badge appears next to each stale flag. Hover over the stale badge to view when the flag became stale and update the stale date if needed.
### Filtering in the table view
In the Feature Flags or Experiments list, the stale status appears as a secondary status badge next to the primary status. Select **Stale** to filter the table to show only stale flags.
## Working with stale flags
Hover over the Stale badge on a flag to open a pop-up that shows when the flag became stale and its rollout status. From the pop-up, you can archive the flag or unmark the flag as stale.
### Default stale date
By default, Amplitude marks a flag or experiment stale 30 days after the last update. For example, if you set a flag's rollout to 100% on March 1 and make no other updates, Amplitude marks the flag stale on March 31. If you deselect the stale value, Amplitude treats the flag as permanent and doesn't mark the flag stale again.
### Updating stale dates
If you change the rollout after you set a stale date, you can update the stale date. For example:
* On January 3, you roll out a flag to 100% and set the stale date to February 3.
* On January 5, you add a segment with 0% rollout to the flag.
* When you save, Amplitude prompts you to update the stale date.
## Notifications
You can receive notifications when flags or experiments become stale. If you own a flag or experiment, Amplitude sends you a daily message listing any flag or experiment that became stale in the previous 24 hours.
You can receive notifications through:
* Email.
* Slack.
Configure [notification preferences](https://amplitude.com/docs/feature-experiment/notifications) in your organization settings.
## Bulk archiving stale flags and experiments
After a flag or experiment becomes stale, remove it from your list:
1. **Remove the flag from your codebase**: Remove the feature flag code from your application. If you deployed the flag across multiple services or codebases, remove it from each location.
2. **Archive the flag or experiment in Amplitude**: Archive the flag or experiment in Amplitude to remove it from your active flags list.
##### To remove a stale item from Amplitude
1. Select the flag or experiment you want to remove.
2. Click **Archive**.
### Handling multiple variants
If a flag or experiment has multiple variants and one variant has a 100% rollout, keep that variant in your application and remove the others. This step keeps the winning variant active.
## Using Amplitude AI or MCP to manage stale flags
You can use Amplitude AI or Amplitude MCP to highlight stale flags and either update the stale date or archive the flag. In the agent window, ask Amplitude to generate a list of your stale flags. After Amplitude returns the list, continue the conversation to archive or modify your stale flags.
================================================================================
# Experiment templates
URL: https://amplitude.com/docs/feature-experiment/workflow/experiment-templates
================================================================================
# Experiment templates
Experiment templates capture the configuration of an [experiment](https://amplitude.com/docs/feature-experiment/workflow/create). Templates include features like goals, deployments, and audience targeting that you can reuse for future experiments. Templates help when you:
- Run similar experiments across different features or time periods.
- Enforce consistent experiment standards across your team.
- Launch new experiments quickly with proven configurations.
- Test variations of the same feature with different audiences.
## Permissions
To create, edit, or delete experiment templates, you need the Manage Experiments permission. For more information, refer to [User roles and permissions](https://amplitude.com/docs/admin/account-management/user-roles-permissions).
### Template limitations
* Templates are only available on Feature Experiments.
* Templates are project-specific.
* You can't apply templates to pre-existing experiments.
* You can't convert a template back into an active experiment.
* Template changes don't sync to experiments created from that template.
## Creating templates
### Create a template from an experiment
To create a template from an existing feature experiment:
1. Navigate to the experiment you want to save as a template.
2. Click **More options** (three dots) and select **Use as a template**.
3. Enter a template name and optional description.
4. Select which components to include in the template:
- [Deployment rules](https://amplitude.com/docs/feature-experiment/workflow/configure-delivery).
- [Goals and metrics](https://amplitude.com/docs/feature-experiment/workflow/define-goals).
- User targeting rules.
- Evaluation mode and [bucketing](https://amplitude.com/docs/feature-experiment/workflow/create#bucketing-unit) settings.
5. Click **Use as a template**.
The template appears in the Templates library.
### Create a template from the Templates library
1. Navigate to *Experiments > Templates*.
2. Click **Create Template**.
3. Enter a name for the template.
4. Select the project where you want to apply the template. Templates apply to a single project.
5. Optionally, enter a description of the template.
6. Click **Create**.
## Create an experiment from a template
To use a template when creating a new experiment:
1. From the Experiments page, click **Create Experiment > Feature Experiment**. For more information, go to [Create a new experiment](https://amplitude.com/docs/feature-experiment/workflow/create).
2. Enter information about your experiment.
3. In the Apply a template section, select a template from the drop-down menu.
4. Click **Create**.
5. Make any adjustments to the experiment.
6. When ready, click **Start Experiment**.
The new experiment inherits the template configuration but operates independently. Changes to the template don't affect experiments created from it.
## Manage experiment templates
### View all templates
Navigate to *Experiment > Templates* to view your organization's template library. The Templates page shows:
- Template name and description.
- Number of experiments created from this template.
- Last modified date.
- Goals.
- Evaluation mode.
- Number of segments in the template.
- Bucketing unit.
### Edit a template
1. Navigate to *Experiment > Templates*.
2. Click the name of the template you want to edit.
3. Modify the configuration as needed.
4. Click **Save**.
Changes to a template only affect future experiments created from it. Amplitude doesn't update existing experiments created from the template.
### Archive a template
1. Navigate to *Experiment > Templates*.
2. Open the template you want to archive.
3. Click the **three-dot** menu icon and then click **Archive**.
4. Confirm the archive.
Archiving a template doesn't affect any experiments created from the template.
## What templates include
Templates can include the following experiment configurations:
### Experiment settings
- Evaluation mode ([local](https://amplitude.com/docs/feature-experiment/local-evaluation) or [remote](https://amplitude.com/docs/feature-experiment/remote-evaluation)).
- [Bucketing unit](https://amplitude.com/docs/feature-experiment/workflow/create#bucketing-unit) (user or group).
### Goals and metrics
For more information about defining experiment goals, go to [Define your experiment's goals](https://amplitude.com/docs/feature-experiment/workflow/define-goals).
- Primary and secondary metrics.
- Success and guardrail metrics.
- [Minimum detectable effects](https://amplitude.com/docs/feature-experiment/workflow/finalize-statistical-preferences#minimum-detectable-effect).
### Audience targeting
For more information about audience targeting, refer to [Define your experiment's audience](https://amplitude.com/docs/feature-experiment/workflow/define-audience).
- Segment definitions.
- Property-based targeting rules.
- Geographic or demographic filters.
- User ID targeting.
## Best practices
- Name templates descriptively. Use names that clearly indicate the template's purpose, like "Product Page Conversion Test" or "Mobile Onboarding Experiment."
- Add detailed descriptions. Include guidance on when to use the template and any special considerations.
- Review templates regularly. Archive or update templates that are outdated or no longer align with your experimentation standards.
- Start with successful experiments. Create templates from experiments with proven configurations and [clear learnings](https://amplitude.com/docs/feature-experiment/workflow/experiment-learnings).
- Document template variations. If you create multiple similar templates, document the differences between them.
================================================================================
# URL redirect testing
URL: https://amplitude.com/docs/web-experiment/url-redirect-testing
================================================================================
# URL redirect testing
Marketers use A/B testing to compare messaging, calls to action, and landing pages so they can increase conversions and improve user experience. A/B testing often requires developer support, which isn't always available.
Amplitude's URL redirect testing feature lets you design, deploy, and analyze A/B tests that redirect visitors to another URL, without extensive developer involvement. URL redirect testing helps you measure whether a redirect improves conversion or user experience.
{% callout type="note" heading="" %}
The [Website Conversion Agent](https://amplitude.com/docs/amplitude-ai/website-conversion-agent) can analyze your pages, propose conversion optimization strategies, and create draft experiments for you automatically.
{% /callout %}
URL redirect testing works well if you're building different versions of your page or site on a CMS like WordPress. In these cases, your different URLs and their associated pages are the variants that Amplitude Experiment tracks.
You can use URL redirect testing with both standard A/B tests and [multi-armed bandits](https://amplitude.com/docs/feature-experiment/workflow/multi-armed-bandit-experiments).
To use URL redirect testing, you must [implement](https://amplitude.com/docs/web-experiment/implementation) the Web Experiment script on your site. Add the script to the `<head>` section of your site. Install the Amplitude Analytics SDK on your site for event tracking.
## Set up URL redirect testing
To set up a URL redirect test:
1. In Amplitude Experiment, navigate to the Experiments page and click **Create Experiment** and then click **Web**.
2. In the New Experiment modal, name your experiment.
3. Enter the URL of a page this experiment targets and select the appropriate project from the drop-down. Amplitude uses this URL to create your first [Page](https://amplitude.com/docs/web-experiment/pages). You must instrument Web Experiment on this URL for the experiment to work.
If the script is present on the page you specified, Experiment opens the page in the [Visual Editor](https://amplitude.com/docs/web-experiment/set-up-a-web-experiment#the-visual-editor) as a new variant in your experiment.
4. Click the Treatment **three-dot** menu item, select **Edit**, and then under Action select **URL Redirect**.
5. In the URL Redirect panel, add each URL you want to test as a separate variant and click **Apply**.
6. Click **Apply and Exit** to leave the editing view.
7. Configure which [Pages](https://amplitude.com/docs/web-experiment/pages) your experiment should target. You can create new Pages or reuse existing saved Pages.
8. Target the users you want to include in this experiment. Go to [audience targeting](https://amplitude.com/docs/web-experiment/targeting#audience-targeting) for more information. Note that Web Experiment audience targeting works differently than Feature Experimentation.
9. Define your experiment's [Metrics](https://amplitude.com/docs/feature-experiment/workflow/define-goals).
10. Specify any [additional options](https://amplitude.com/docs/feature-experiment/workflow/finalize-statistical-preferences) in the Advanced tab.
11. Click **Save and Close** to finish creating your Web Experiment.
## Preview and test
Before running your web experiment, test and preview each variant.
To test your web experiment:
1. Click **Test & Preview**. This puts your experiment in test instrumentation mode, but it doesn't begin the experiment. Only users who open the page with the preview link experience your changes.
2. In the modal, click **Preview** to open a new tab that applies the changes you made for that variant.
3. Click the chain link icon to copy the URL to share it with others.
Test each variant at least one time, testing on more than one page if your experiment targets multiple pages.
If your changes aren't visible, you may need to wait up to 60 seconds for caches to refresh. If the changes don't appear correctly after that time, check your configuration for possible issues.
{% callout type="warning" heading="Ad blockers" %}
Ad blocking plugins or extensions may prevent you from testing and previewing your experiment.
{% /callout %}
## Redirect impression tracking across domains
When a redirect stays on the same hostname, the Web Experiment script stores the redirect impression in `sessionStorage` and tracks it after the destination page loads. This requires no configuration.
When a redirect targets a different hostname, for example `www.example.com` to `app.example.com` or a different domain entirely, `sessionStorage` doesn't carry over. The script supports two transports for the impression data, which you configure with `redirectConfig` on the `window.experimentConfig` object. Set the config above the Web Experiment script tag:
```html
<script>
window.experimentConfig = {
redirectConfig: {
encodeRedirectInCookie: true,
encodeRedirectInUrl: false,
},
};
</script>
<!-- Web Experiment script tag -->
```
| Option | Default | Behavior |
| ------------------------ | ------- | -------------------------------------------------------------------------------------------------------------------------------------------------------------------------------------------------------------------------------------------------------------------------------------------------------------------------------------------------------------------------- |
| `encodeRedirectInCookie` | `true` | Stores redirect impression data in a cookie scoped to the root domain (`SameSite=Lax`) so the destination page can track the impression. Works across subdomains of the same root domain, for example `www.example.com` to `app.example.com`. The cookie expires after one minute. Cookies don't cross root domains, so this option doesn't cover redirects to a different site. |
| `encodeRedirectInUrl` | `false` | Base64-encodes the redirect impression data and appends it as an `AMP_REDIRECT` query parameter on the destination URL. The script on the destination page tracks the impression and removes the parameter from the URL. Use this option for redirects to a different root domain, or when the browser blocks cookies. |
Both options apply only to redirects that change hostname. If you enable both, the destination page prefers the URL parameter, then falls back to the cookie.
{% callout type="note" heading="Script required on the destination" %}
For cross-domain impression tracking to work, the destination page must run the Web Experiment script for the same project. The impression fires when the destination page loads.
{% /callout %}
{% callout type="warning" heading="Visible query parameter" %}
With `encodeRedirectInUrl` enabled, users briefly notice the `AMP_REDIRECT` parameter in the destination URL before the script removes it. Make sure the destination page tolerates unknown query parameters.
{% /callout %}
## Configuration limits
Visual experimentation and Amplitude's low-code implementation apply the following limits on experiment configuration:
- **Evaluation mode**: Limited to _local_ to optimize test performance and minimize latency impact to end-users.
- **Bucketing Unit**: Limited to _User_ since evaluation mode is limited to _local_.
- **Keys**: Limited to _deviceID_ since evaluation mode is limited to _local_.
- **Audience**: Limited to _all users_, since redirect logic triggers before tracking loads on the site.
- **Deployment**: Limited to the project API key to simplify setup requirements.
## Related resources
For more information about URL redirects in Web Experiment, refer to [Web Experiment actions](https://amplitude.com/docs/web-experiment/actions#url-redirect).
================================================================================
# Test and launch your experiment
URL: https://amplitude.com/docs/feature-experiment/workflow/experiment-test
================================================================================
# Test and launch your experiment
Before any users view your experiment, confirm that the variants look and function as intended. Because Experiment lets you assign specific variants by user ID, device ID, or cohort, you can confirm that Amplitude serves test devices the correct variants when they enter your experiment.
To exclude users from an experiment or flag, add them to the `OFF` variant.
On the Overview page for your experiment, review the Overview, Delivery, Variants, and Targeting sections. Confirm each section matches your plan.
Click **Test Instrumentation** to send the experiment's variants to the testers you designated when you [configured the experiment's audience](https://amplitude.com/docs/feature-experiment/workflow/define-audience).
{% callout type="note" heading="Test Instrumentation and targeting" %}
When you test your instrumentation, Amplitude ignores the target segments you configured in the experiment. Test instrumentation sends variants only to the Testers.
{% /callout %}
## Launch your experiment
When you're satisfied that your experiment works as intended, click **Start Experiment**.
You can set an end date for the experiment or accept the default Experiment analysis range.
{% callout type="note" %}
Clicking **Start Experiment** is the only way to activate your experiment. If you change the start date for the experiment, the experiment doesn't activate automatically on the new date.
{% /callout %}
After your experiment runs, you can [make a decision on your experiment](https://amplitude.com/docs/feature-experiment/workflow/make-decision-experiment) when it reaches statistical significance or its end date.
## Schedule your experiment
To schedule the experiment for a later launch, expand the **Start Experiment** menu and click **Schedule start**. In the modal that appears, set the date and time to begin the experiment.
{% callout type="note" heading="Experiment start and variant delivery" %}
Amplitude exposes users to variants immediately when they arrive at or after the scheduled start time. Users who requested a variant in the hour before the start time may continue to see the pre-start response until their cached response expires, up to one hour later. Unlike a manual flag or experiment update, a scheduled start doesn't trigger CDN cache invalidation, so the existing 60-minute cache TTL applies to those earlier requests. For details, refer to [Cache invalidation](https://amplitude.com/docs/feature-experiment/under-the-hood/performance-and-caching#cache-invalidation).
For example, for an experiment that starts at 2:00 PM, a user who visited at 1:30 PM continues to see the pre-start response until 2:30 PM, when their cached response expires. A user who arrives at 2:00 PM sees a variant right away.
{% /callout %}
## QA after rollout
After rollout, you can track how many users Amplitude exposed to each variant on a daily basis.
Go to _Experiments > your experiment > Activity tab > Diagnostics_ to view how many users Amplitude exposed to each variant.
This view is a useful way to QA the assignment process. If one variant enrolls significantly more or significantly fewer users than expected, the difference may indicate an issue to investigate.
If you spot outliers or anomalies that concern you, click into the chart or information to investigate the potential causes. To learn more about understanding anomalies, refer to this article on [Root Cause Analysis](https://amplitude.com/docs/analytics/root-cause-analysis).
For a deeper validation of your experiment's instrumentation and assignment logic, [run an A/A test](https://amplitude.com/docs/feature-experiment/aa-testing) before launching a full A/B test.
================================================================================
# Make a decision on your experiment
URL: https://amplitude.com/docs/feature-experiment/workflow/make-decision-experiment
================================================================================
# Make a decision on your experiment
After your experiment reaches statistical significance or its end date, decide what to do next. This article covers how to end your experiment and the options available.
## End your experiment
End the experiment when you reach its end date or when it reaches statistical significance. To end it, click **Complete Experiment**.
Then choose one of the following:
* **Roll out** the winning variant.
* **Roll back** everything and return to a pre-experiment state.
* **Continue** the experiment.
You can revisit this decision later.
## What happens when your experiment ends
When you complete your experiment, Amplitude stops collecting new data for analysis. The experiment stays in your experiment list but no longer assigns new users to variants. Historical data and analysis stay available for review.
If you roll out or roll back, Amplitude applies the changes you select. If you continue the experiment, it stays active until the new end date you specify.
### Roll out variants
When you roll out the winning variant to all users, Amplitude:
* Sets the rollout percentage to 100%.
* Changes the distribution weight to 100 for the winning variant and 0 for all other variants.
* Disables [sticky bucketing](https://amplitude.com/docs/feature-experiment/advanced-techniques/sticky-bucketing) (sets it to `false`).
If you roll out to a custom percentage of users, Amplitude doesn't apply these automatic changes. You must apply changes manually after confirming your rollout decision.
You can also roll out to "only the targeted users." This option helps avoid overgeneralizing your experiment's results. For example, you target users in the United States and find a 5% improvement. That result doesn't mean a rollout to all users produces a 5% lift outside the United States. You might experience a 5% lift for U.S. users but a -2% lift for all other users.
### Roll back an experiment
When you roll back your experiment, Amplitude:
* Turns the flag off.
* Sets percentage rollouts to 0%.
### Continue your experiment
To continue running your experiment, enter a new end date to gather more data and click **Start Experiment**.
To restart your experiment with fresh results (for example, after instrumentation issues affected data quality), [create a new experiment run](https://amplitude.com/docs/feature-experiment/troubleshooting/new-experiment-run). A new run excludes previous user data from monitoring and analysis.
## Clean up feature flags
After you decide on your experiment, clean up your feature flags to avoid unnecessary overhead and confusion.
### Deactivate or archive your experiment
After you roll out, roll back, or continue your experiment, deactivate or archive it in Amplitude. Archiving removes unnecessary logic and prevents accidental reactivation or analysis confusion.
To deactivate or archive your experiment:
1. Navigate to your experiment in Amplitude Experiment.
2. Click the menu next to **Complete Experiment** or **Turn off flag**.
3. Select **Archive** to archive the experiment.
Archived experiments stay in your Experiment List with an archived label. You can unarchive them when needed.
### Remove experiment code
When you roll out the winning variant, work with your engineering team to implement the winning experience directly in your production code base. Implementing the variant in code removes the need to keep the experiment active with 100% traffic allocation.
After your engineering team implements the chosen variant in code, remove the experiment logic from your codebase. Removing the logic reduces technical debt and improves performance.
{% callout type="tip" heading="Use feature flags for ongoing control" %}
If your change needs rollback capability or an incremental rollout, use a [feature flag](https://amplitude.com/docs/feature-experiment/workflow/feature-flag-rollouts) instead of keeping the experiment active. Feature flags provide ongoing control without the overhead of experiment logic and metadata.
{% /callout %}
================================================================================
# Run an A/A test
URL: https://amplitude.com/docs/feature-experiment/aa-testing
================================================================================
# Run an A/A test
A/A testing is a quality assurance technique where you run an experiment with two identical variations to validate your experimentation setup. Unlike an [A/B test](https://amplitude.com/docs/feature-experiment/key-terms), an A/A test splits traffic between two groups that get the same experience.
## Why run A/A tests
A/A tests help you verify that your experimentation infrastructure works correctly before you run real experiments. A/A tests are valuable when:
- **Setting up experimentation for the first time.** Validate that your SDK integration, traffic allocation, and metric tracking function properly.
- **Implementing new metrics.** Confirm that new success metrics behave as expected and don't show false positives.
- **Diagnosing unexpected results.** Rule out implementation issues when an A/B test shows surprising outcomes.
- **Testing at scale.** Verify that your randomization works correctly across large traffic volumes.
## Common issues an A/A test detects
A/A tests can reveal several implementation problems:
- **Improper randomization.** Amplitude doesn't evenly distribute users between variants, which creates [sample ratio mismatches](https://amplitude.com/docs/feature-experiment/troubleshooting/sample-ratio-mismatch), or users jump between variants and get different experiences across sessions or page loads. For more on causes and fixes, refer to [Variant jumping](https://amplitude.com/docs/feature-experiment/troubleshooting/variant-jumping).
- **Tracking inconsistencies.** Events fire differently between variants because of timing issues or conditional logic errors.
- **Sample pollution.** Pre-exposure bias occurs when users get content before Amplitude allocates them to a variant.
- **Statistical configuration.** Incorrect significance thresholds or multiple testing without proper correction.
## When to run A/A tests
A/A tests are diagnostic tools, not routine practice. Run them strategically when you need to validate your setup.
### Good reasons to run an A/A test
- **Initial setup.** First time implementing Amplitude Experiment. Verify that everything works correctly.
- **Major infrastructure changes.** After you update your SDK version, change tracking implementation, or migrate to a new platform.
- **Troubleshooting unexpected results.** An A/B test shows surprising outcomes and you suspect technical issues rather than real user behavior differences.
- **New team members.** When you onboard engineers to experimentation, an A/A test provides hands-on validation of the implementation.
### Don't run A/A tests for
- Routine experiments when you've already validated your setup.
- Every new experiment. Running an A/A test for every experiment wastes traffic and delays real insights.
- Validation without a specific concern.
## Run an A/A test in Web Experiment
### Custom code approach
1. Create a new experiment in Web Experiment.
2. Set up two variants (control and treatment) with a 50/50 traffic split.
3. In both variants, apply identical changes:
- **Option 1:** Add a `console.log` statement through custom code: `console.log('A/A test variant');`.
- **Option 2:** Insert an HTML comment that doesn't affect the user experience: ``.
4. Configure your success metrics (the conversion events you want to validate).
5. Run the experiment for at least one full business cycle.
6. Analyze results to confirm no significant differences between variants.
### Visual Editor approach
1. Create a new experiment in Web Experiment.
2. Set up two variants (control and treatment) with a 50/50 traffic split.
3. For each variant, open the Visual Editor:
1. Select the variant to open the Visual Editor on your site.
2. Use the element selector to select any element on the page (for example, a header, button, or div).
3. Select **More**, then find the element selector field in the right panel.
4. Change the selector to an invalid one that doesn't match anything on your page (for example, `#nonexistent-element-aa-test`).
4. Configure your success metrics (the conversion events you want to validate).
5. Run the experiment for at least one full business cycle.
6. Analyze results to confirm no significant differences between variants.
This approach ensures the experiment loads and tracks properly without changing anything visible to users.
## Run an A/A test in Feature Experiment
1. Create a new flag-based experiment with two variants.
2. Ensure both variants return the same feature flag value or configuration.
3. Implement the flag in your code, but keep the experience identical regardless of variant.
4. Track the same conversion events for both groups.
5. Monitor the experiment dashboard for several days to validate proper traffic distribution and metric tracking.
## Interpret your A/A test results
Expect random variation in A/A tests. The key indicator of a healthy A/A test is no statistically significant difference between variants.
### Successful A/A test
No statistically significant difference exists between variants, Amplitude splits traffic evenly, and metrics are comparable. You can proceed with confidence to run real A/B tests.
### Failed A/A test
Any statistically significant result indicates a potential implementation issue that needs investigation. If you see significant differences, check:
- Your traffic allocation percentages in the experiment dashboard.
- Event tracking implementation for conditional logic that might affect variants differently.
- That the experiment fires before any page content that might influence results.
- That Amplitude calculates your metrics consistently across both variants.
## Best practices
- **Run A/A tests during representative traffic periods.** Avoid holidays or unusual traffic patterns that might skew results.
- **Use the same sample size you'd use for real experiments.** Matching sample size validates your statistical power calculations.
- **Test your most important metrics.** Focus on the conversion events that matter most to your business.
- **Document your setup.** A/A tests serve as baseline validation you can reference when you troubleshoot future experiments.
- **Don't over-interpret noise.** Expect random variation. Focus on statistical significance rather than the size of percentage differences between variants.
- **Expect some variant jumping.** A small percentage of users may get different variants across sessions. Variant jumping is normal and shouldn't cause statistically significant differences in a properly configured test.
## When to skip A/A tests
A/A tests are valuable validation tools, but you don't need to run them for every experiment. Skip A/A tests when:
- You have a mature experimentation program with proven infrastructure.
- You're running similar experiments to ones you've validated before.
- Your last A/A test was recent and showed clean results.
- Time-to-insight is critical and you have high confidence in your setup.
If you get unexpected results in your A/B tests or make significant changes to your implementation, an A/A test can quickly rule out technical issues and save debugging time.
================================================================================
# The Experiment Analysis view
URL: https://amplitude.com/docs/feature-experiment/analysis-view
================================================================================
# The Experiment Analysis view
The Experiment Analysis view shows the details of your experiment. Select your experiment and then go to *Activity > Analysis* to view high-level statistical measurements. These measurements help you determine whether your experiment succeeded.
This article describes each column in the Analysis table and how each column relates to your experiment.
## Analysis filters and chart options
You can filter the information in the Analysis view by time, user, or any other available property.
Select **Select property** to filter the analysis view by any available property.
To turn your experiment analysis into a chart, select **Open in Chart**. Amplitude converts the experiment information into the most likely charts and opens them in a new tab. You can then modify the charts.
## Metric name, Control, and status
The Metric name column contains the names of the selected metrics. The top metric is the [recommendation metric](https://amplitude.com/docs/feature-experiment/key-terms). All other metrics are secondary metrics. Hover over a metric's name to read its definition.
The Control column contains information about the control group for your experiment.
The On column contains information about experiment activity while the experiment runs. If the experiment is complete or rolled back, the On column may show other relevant information such as treatment or property.
{% callout type="note" %}
To examine segments of users, use the filter card at the top of the Analysis tab.
{% /callout %}
## Relative performance
Relative performance measures the relative difference between variant performance and control performance. This is also known as the relative lift. To cross-check this value, expand a single metric's section and divide the absolute lift for a variant by the absolute value of the control for that metric.
## Confidence interval
The confidence interval is a range of values that includes the parameter you're trying to measure. In this case, the parameter is the difference in the [means](https://en.wikipedia.org/wiki/Arithmetic_mean) between the variant and the control. The confidence interval isn't a probability. Interpret the confidence interval as follows: if you ran this experiment 100 times with the confidence level set to 95, you can expect the true parameter value to fall within this range at least 95 times.
The confidence interval reveals characteristics of what the experiment has observed so far:
* **Confidence Interval contains 0**: Not enough evidence exists to decide whether a difference exists between control and treatment.
* **Confidence Interval greater than 0**: The interval (upper and lower confidence bounds) is greater than zero. Amplitude Experiment has accumulated enough observations to reach statistical significance, and you can conclude that the variant has a positive effect compared to control. For example, when you look at lift, a variant with a confidence interval greater than zero performs better than the control.
* **Confidence Interval less than 0**: Amplitude Experiment has accumulated enough observations to reach statistical significance, and you can conclude that the variant has a negative effect compared to control. When you look at lift, a variant with a confidence interval less than zero performs worse than the control.
If you have multiple variants, select the one you want to view in the confidence interval chart from the drop-down above the chart.
To access the confidence interval, hover over the control or the experiment metric.
## Significance
Significance is the likelihood that the performance shown for each test variant differs from zero rather than reflecting random fluctuations in the data. The higher this value, the more confident you can be in your results. More formally, significance is *1 - p-value*.
## Absolute value
The specific meaning of the absolute value depends on the metric type. For unique conversions, Experiment expresses values as a percentage that indicates the percentage of users (over the total number of exposed users) who converted for each variant. The numerator [Conversions](https://amplitude.com/docs/get-started/understand-conversion-rate) and denominator [Exposures](https://amplitude.com/docs/feature-experiment/under-the-hood/event-tracking#exposure-events) appear below the percentage.
Otherwise, the value indicates the aggregate (total events, sum of property value, average of property value) for each exposed user. The denominator is the total number of exposures. For example, 10 total events / 4 exposures = on average, an exposed user had 2.5 conversion events.
To access the absolute value, hover over the control or metric name.
## Winsorization statistics
When you enable [winsorization](https://amplitude.com/docs/feature-experiment/advanced-techniques/winsorization-in-experiment) for your experiment, the Analysis view shows additional information about how winsorization affected your data:
- **Number of winsorized users**: The count of users whose values winsorization adjusted.
- **Percentage of winsorized users**: The proportion of total users that winsorization affected.
This information helps you understand the impact of outlier handling on your experiment results. If winsorization affects a high percentage of users, investigate the underlying data distribution or adjust your winsorization settings.
## Common questions
### Why is my graph displaying an error state?
A common mistake is to generate a chart using only one variant. The Experiment Results chart must include two or more variants to display comparison results. If you don't include both the control and at least one variant, your chart doesn't display anything.
### Why is reaching significance taking longer than it should?
When you use a [T-test](https://amplitude.com/docs/feature-experiment/experiment-theory/analyze-with-t-test), you must wait until your experiment reaches the specified sample size before Experiment Results runs the p-value and confidence-interval computations.
With sequential testing, even with a large MDE, reaching statistical significance can take time if your experiment's lift is small. A T-test generally requires fewer samples to detect the same lift.
### How is the Retention metric calculated?
Amplitude uses three parameters to calculate Return On for the Retention metric:
- **The starting event**: the event that occurs *after* the exposure event. The starting event marks the beginning of the retention window.
- **The return event**: the event you want the user to perform after the starting event. The user counts as retained if they trigger the return event.
- **Return on the nth day/week/month**: the number of days, weeks, or months between the user performing the starting event and the return event. Amplitude calculates this parameter in 24-hour increments and doesn't use calendar dates.
For example, suppose a user performs an exposure event, a starting event, and a return event:
- Exposure event: `Page Viewed`
- Starting event: `Sign Up`
- Return event: `Add to cart`
With a return-on **nth day** value of seven, the user counts as retained if `Add to cart` triggers between seven days and seven days plus 24 hours after `Sign Up`.
If the return-on value is an **nth week** value of one (one week, or seven days), the user counts as retained if they perform `Add to cart` any time between days seven (week 1) and 14 (week 2) after `Sign Up`.
For a return-on **nth month** value of one (30 days), the user counts as retained if they perform `Add to cart` any time between days 30 (month 1) and 60 (month 2) after `Sign Up`.
================================================================================
# Dimensional Analysis
URL: https://amplitude.com/docs/feature-experiment/dimensional-analysis
================================================================================
# Dimensional Analysis
To exclude QA users or internal traffic that doesn't represent your customer base and may skew results, use Dimensional Analysis. Amplitude's Dimensional Analysis capabilities let you exclude defined user groups from analysis on a per-experiment basis.
## Define your testers
In Feature Experiment, use the *Inclusions* section to define your test users.
Add users by `User ID` or `Device ID`, or by using a cohort. Amplitude assigns each test user a variant, and that variant determines the experience when the user interacts with the experiment.
## Filter test users
To remove QA users or internal traffic from analysis, filter them out before reviewing results.
Select the *All exposed users* dropdown and choose *Exclude testers*.
If you select multiple targeting segments, analyze each segment individually, because one segment may show a lift that others don't. Select the segment name in the *All Users* dropdown. Selecting a segment also filters test users from your analysis.
Investigating specific user segments can reveal additional insight. Experiments that aren't statistically significant overall can contain a small group of users for which the result is statistically significant. Likewise, for statistically significant results, small user segments can drive the performance of the experiment.
================================================================================
# Advanced metric use cases
URL: https://amplitude.com/docs/feature-experiment/advanced-techniques/advanced-metric-use-cases
================================================================================
# Advanced metric use cases
This article covers advanced use cases you may encounter when analyzing experiment results.
## Case 1: Create a funnel analysis based on your experiment's metrics
Imagine a conversion funnel with five steps, where step three represents the exposure event for your experiment. To reduce noise and increase the likelihood of reaching statistical significance, Amplitude Experiment counts metric events only after the exposure event. If the exposure event is step three of the funnel, and you include the whole funnel as a metric, the funnel conversion count is zero. To measure the actual conversion rate of your funnel, make steps three through five a standalone metric in your experiment.
You may need further analysis of your experiment's conversion rates in a funnel analysis.
To use your experiment's metrics in a [Funnel Analysis chart](https://amplitude.com/docs/analytics/charts/funnel-analysis/funnel-analysis-get-the-most), follow these steps:
1. Add the events for your funnel analysis in the Events module.
2. In the *Measured as* module, choose the **Conversion** time window, then specify the counting method (unique users or totals).
3. Select your analysis unit or group type (for example, **Any Users**) in the Segment By module.
4. Create a user segment for each variant of your experiment.
5. Select **Performed** to add filters with your experiment's flag key and variant. If you restarted your experiment, add an experiment key filter.
6. Set the date range for *any time since* to match the start date of your experiment.
The Funnel Analysis chart results may differ slightly from your experiment results. Funnel analyses and experiments handle users who [variant jump](https://amplitude.com/docs/feature-experiment/troubleshooting/variant-jumping) differently.
For example, a funnel analysis includes all users who meet the filter requirements. The funnel analysis then computes the conversion rate of the funnel based on those filtered users. The funnel analysis may include a user even if the user reached the exposure event after completing the funnel.
### Analyze your experiment data using other Amplitude Analytics metrics
Amplitude Analytics offers metrics that Amplitude Experiment doesn't. Use the steps in the previous section to analyze time to convert or [return on or after retention](https://amplitude.com/docs/analytics/charts/retention-analysis/retention-analysis-build).
Refer to this [Help Center article on funnel analysis FAQs](https://help.amplitude.com/hc/en-us/articles/360054203872) for more details.
## Case 2: Analyze your experiment's results based on a subset of users
Imagine your experiment targets all users, but you want to examine the experiment's effect on a subset of users, such as exposed users in the United States only. Adding a filter on the country property doesn't generate the results you expect.
When you create a metric, Amplitude computes that metric on all exposed users. If you add a filter for users in the United States to the metric event, the numerator includes the filter but the denominator doesn't.
To filter a subset of users in your experiment results, follow these steps:
1. In your experiment, go to *Activity > Analysis > external link icon*.
2. In the Variants Performed By section, select **Filter by** to add a filter for the Country property.
{% callout type="note" %}
This method filters both the numerator and the denominator of the mean values, so you can correctly analyze the target subset of users exposed to your experiment.
{% /callout %}
Avoid analyzing your experiment's results based on just one subset. You may encounter a false positive when looking for true statistically significant results.
When you run a [multiple hypothesis test](https://amplitude.com/docs/feature-experiment/advanced-techniques/bonferroni-correction) in this situation, you run a separate hypothesis test for each segment. You may find a positive lift with one subset and a negative decline with another subset. The decision to roll out or roll back in these situations isn't always clear. One option is to roll out only to the group that shows positive lift.
## Case 3: Threshold metrics
Sometimes, you want to define success as a user doing an event multiple times. For example, your users must make a purchase three (3) consecutive times to count as a conversion. To achieve this, create a funnel counting by uniques with three (3) purchase events.
================================================================================
# Learn from your experiment
URL: https://amplitude.com/docs/feature-experiment/workflow/experiment-learnings
================================================================================
# Learn from your experiment
You've designed your experiment, rolled it out to your users, and given them enough time to interact with your new variants. Now, check if your hypothesis was correct.
The Activity tab tells you at a glance whether your experiment produced statistically significant results and what those results are. Experiment automatically uses the information you provided during the design and rollout phases, which avoids repeated effort. The Activity tab breaks results out by variant and provides a detailed tabular breakdown.
{% callout type="note" heading="Note" %}
Depending on your experiment, some Activity tab cards may not appear.
{% /callout %}
## Filter card
On the Filter card, set criteria that update the analysis on the page. Filter your experiment results with the following:
* Date.
* Segment.
* Property.
### Date filter
The date filter defaults to your experiment's start and end dates. Adjust the range to scope experiment results to those specific dates.
### Segment filter
The segment filter lets you select predefined segments, or create one ad-hoc. Predefined segments include:
* Experiment
* All exposed users. Users who saw a variant.
* Testers. Users added as testers during experiment configuration.
* Exclude testers. Excludes users added as testers during experiment configuration.
* Exclude users who variant jumped. Excludes users who saw more than one variant.
* Exclude testers and variant jumpers. Excludes users added as testers and users who saw more than one variant.
* Amplitude
* New user. Users who triggered at least one new user event during the selected date range.
* Mobile web. Users who triggered events on the web from a mobile device.
* Desktop web. Users who triggered events on the web from a desktop device.
{% callout type="note" heading="Support for segments" %}
The Testers, Exclude Testers, and variant jumpers segments are available on feature experiments that use [Remote evaluation](https://amplitude.com/docs/feature-experiment/remote-evaluation).
The Exclude users who variant jumped segment and exclude testers and variant jumpers segment are available on experiment types other than [multi-armed bandit](https://amplitude.com/docs/feature-experiment/workflow/multi-armed-bandit-experiments).
{% /callout %}
These segments update in real time.
Click the **segment icon** and then click **Create Segment** to open the Segment builder, then define a new segment. Segments you create in one experiment are available across all other experiments and appear in the All Saved Segments category.
### Property filter
Filter your experiment results based on user properties. For example, create a filter that excludes users from a specific country or geographic region, or users that have a specific account type on your platform.
Click **Add filter** to build a property filter.
## Data Quality card
{% callout type="note" heading="Availability" %}
Data Quality is available to organizations with access to Experiment who have recommendations enabled.
{% /callout %}
Amplitude doesn't generate p-values or confidence intervals for experiments using binary metrics (for example, unique conversions) until each variant has 100 users and 25 conversions. Experiments using non-binary metrics need only to reach 100 users per variant.
When you expand a category, or click *Guide*, the Data Quality Guide opens in a side panel where you can address or dismiss issues.
## Summary card
{% callout type="note" heading="Availability" %}
Summary is available to organizations with access to Experiment who have recommendations enabled.
{% /callout %}
The Summary card describes your experiment's hypothesis and tells you if it reached statistical significance.
{% callout type="note" heading="Statistical significance and Amplitude" %}
Amplitude considers an experiment statistically significant (stat sig) when Amplitude can confidently say the results are unlikely to have occurred by random chance. More technically, statistical significance is when Amplitude rejects the null hypothesis. That may sound subjective, but it's grounded in statistics. Statistical significance relies on a variant's p-value, which represents the likelihood that your results occurred by chance. A lower p-value means your results are probably not random, and there's evidence to support your hypothesis. If this value drops below a threshold, Amplitude considers the experiment statistically significant.
{% /callout %}
The Summary card displays a badge labeled *Significant* if the experiment reached statistical significance, and a badge labeled *Not Significant* if it didn't. This card can display several badges at the same time:
* **Inconclusive**: The test was inconclusive for the primary metric.
* **Above Goal** or **Below Goal**: The primary metric's mean was either above or below its goal, depending on the direction of the test (increase = above, decrease = below).
* **Above Control** or **Below Control**: The primary metric's mean was either above or below the control's mean, depending on the direction of the test (increase = above, decrease = below). These badges only apply to stat sig results.
## Analysis card
The top of the Analysis card shows an overview that explains how your experiment performed, broken down by metric and variant. Below the overview, a collection of experiment results charts, which you can analyze by metric, display information about:
* Confidence intervals.
* Cumulative exposure.
* Event totals.
* Mean value over time.
For more information, refer to [Dig deeper into experimentation data with Experiment Results](https://amplitude.com/docs/analytics/charts/experiment-results/experiment-results-dig-deeper#interpret-your-results).
{% callout type="tip" heading="Chart filtering" %}
The Experiment Results chart on the Activity tab responds to the selections you make in the [Filter card](#filter-card).
{% /callout %}
Click **Open in Chart** to open a copy of the Experiment Results in a new chart.
{% callout type="note" %}
If you run an A/B/n test, Amplitude Experiment displays the confidence interval and p-value for the control against each treatment individually. To view the comparison between two non-control treatments, either change the control variant or open the test in Analytics and create a chart using the two treatments you want.
{% /callout %}
If needed, adjust the experiment's confidence level. The default is 95%. You can also [choose between a sequential test and a T-test](https://amplitude.com/docs/feature-experiment/workflow/finalize-statistical-preferences).
{% callout type="note" %}
Lowering your experiment's confidence level makes it more likely that your experiment reaches statistical significance. However, this increases the likelihood of a false positive.
{% /callout %}
### Group by
{% early-access %}
This feature is in Early Access. This feature may continue to evolve. This documentation may not yet reflect the latest updates.
{% /early-access %}
{% callout type="note" %}
Group-bys in Experiment charts may slow query performance. For more information, refer to [Limitations](#limitations).
{% /callout %}
When you run an experiment, you often want to know if the experiment affected different users differently, that is, whether heterogeneous treatment effects exist. One way to find out is to filter for `Platform = iOS`, then `Platform = Android`, then `Platform = Web`. Grouping results by `Platform` achieves the same result with fewer clicks. For more information, refer to [Group-bys: How Amplitude prunes and orders chart results](https://amplitude.com/docs/analytics/charts/group-by).
Group-by settings on the dashboard are temporary. Refreshing the dashboard resets any group-bys you define.
## Diagnostics card
The Diagnostics card provides information about how your experiment is delivering. The Diagnostics card shows charts about:
* Assignment events (cumulative and non-cumulative).
* Exposure events (cumulative and non-cumulative).
* Assignment to exposure conversion.
* [Variant jumping](https://amplitude.com/docs/feature-experiment/troubleshooting/variant-jumping).
* Anonymous exposures (cumulative and non-cumulative).
* [Exposures without Assignments](https://amplitude.com/docs/feature-experiment/troubleshooting/exposures-without-assignments) (cumulative and non-cumulative).
For more control, open any of these charts in the Analysis Chart modality.
## Enable notifications
You can receive notifications about your experiments in a dedicated Slack channel or through a webhook. Go to [Integrate Slack](https://amplitude.com/docs/analytics/integrate-slack) and then [Experiment Notifications](https://amplitude.com/docs/feature-experiment/notifications) to set up these notification alerts.
You can set up a notification for the following events:
* **Experiment about to start:** Amplitude sends this notification when your scheduled experiment is about to start.
* **Experiment end reached:** Amplitude sends this notification when your experiment is complete.
* **SRM detected:** Amplitude sends this notification if it identifies a [sample ratio mismatch](https://amplitude.com/docs/feature-experiment/troubleshooting/sample-ratio-mismatch) issue.
* **Long-running experiments:** Amplitude sends this notification when your long-running experiment is complete.
* **Statsig for the recommendation metric is reached:** Amplitude sends this notification when your experiment's recommendation metric reaches stat sig.
Amplitude Experiment sends a notification to the editors of the experiment.
## Next steps
No experiment is a failure. Even if you didn't get the results you hoped for, you can still learn from the process. Use your results as a starting point for asking questions about the changes you made, the outcomes you saw, what your customers expect from your product, and how you can deliver on those expectations.
In general, the next step is to decide whether to run another experiment that supports your hypothesis to gather more evidence, or to implement the variant that delivered the best results. You can also export your experiment to the Experiment Analysis in Amplitude Analytics for a deeper review, where you can segment users and generate more insights.
================================================================================
# The cumulative exposures graph: Increasing and decreasing slopes
URL: https://amplitude.com/docs/feature-experiment/advanced-techniques/cumulative-exposure-change-slope
================================================================================
# The cumulative exposures graph: Increasing and decreasing slopes
The cumulative exposures graph shows how many users your experiment exposed over time. The x-axis shows the date of each user's first exposure. The y-axis shows a running total of users exposed to the experiment.
Amplitude counts each user one time, unless the user receives more than one experiment variant. Users who receive more than one variant count once for each variant.
{% callout type="note" %}
Refer to the [assignment event and exposure event definitions](https://amplitude.com/docs/feature-experiment/key-terms) for the difference between them.
{% /callout %}
## Interpreting the cumulative exposure graph
This article covers cumulative exposure results with:
- [Increasing slope](#increasing-slope): the lines consistently go up and to the right.
- [Decreasing slope](#decreasing-slope): the lines go up and to the right, but the cumulative exposure slows over time.
Other articles cover cumulative exposure results with:
- [An inflection point or a flattened slope](https://amplitude.com/docs/feature-experiment/advanced-techniques/cumulative-exposure-inflection-points).
- [Divergent lines (similar or different slopes)](https://amplitude.com/docs/feature-experiment/advanced-techniques/cumulative-exposure-divergent-lines).
## Increasing slope
In a standard cumulative exposure graph with an increasing slope, each line represents a single variant. For example, March 20 might be the first day of the experiment, when 158 users trigger the exposure event for the control variant. A day later, a total of 314 users receive the control variant. That number is the sum of exposures on March 20 and March 21.
The slope of each line is the change in the y-axis divided by the change in the x-axis:
```
∆y / ∆x = (cumulative users exposed as of day T1 — cumulative users exposed as of day T0) / (number of days elapsed between T0 and T1) = Number of new users exposed to the experiment, per day, from day T0 to day T1.
```
Additional aspects of this graph:
- The graph is cumulative, so the y-axis doesn't decrease. The slope of the line is the number of new users exposed to your experiment each day. The line may slow or stop growing, but a cumulative exposures graph never peaks and then drops.
- A dotted line at the end marks dates with incomplete data. Refer to [Amplitude's incomplete data guidance](https://help.amplitude.com/hc/en-us/articles/360043977571) for more information.
- The two lines don't track each other exactly. Each line represents a unique variant, and exposures can differ slightly between variants, even when each variant receives the same amount of traffic.
- Both variants follow a steady growth path, which indicates no seasonality. If users were more likely to engage with your product (and therefore more likely to receive an experiment) on weekdays, the chart would show this pattern. On weekends, the y-axis value would increase more slowly.
### Hourly versus daily setting
Changing the x-axis to hourly instead of daily often reveals new patterns in your chart.
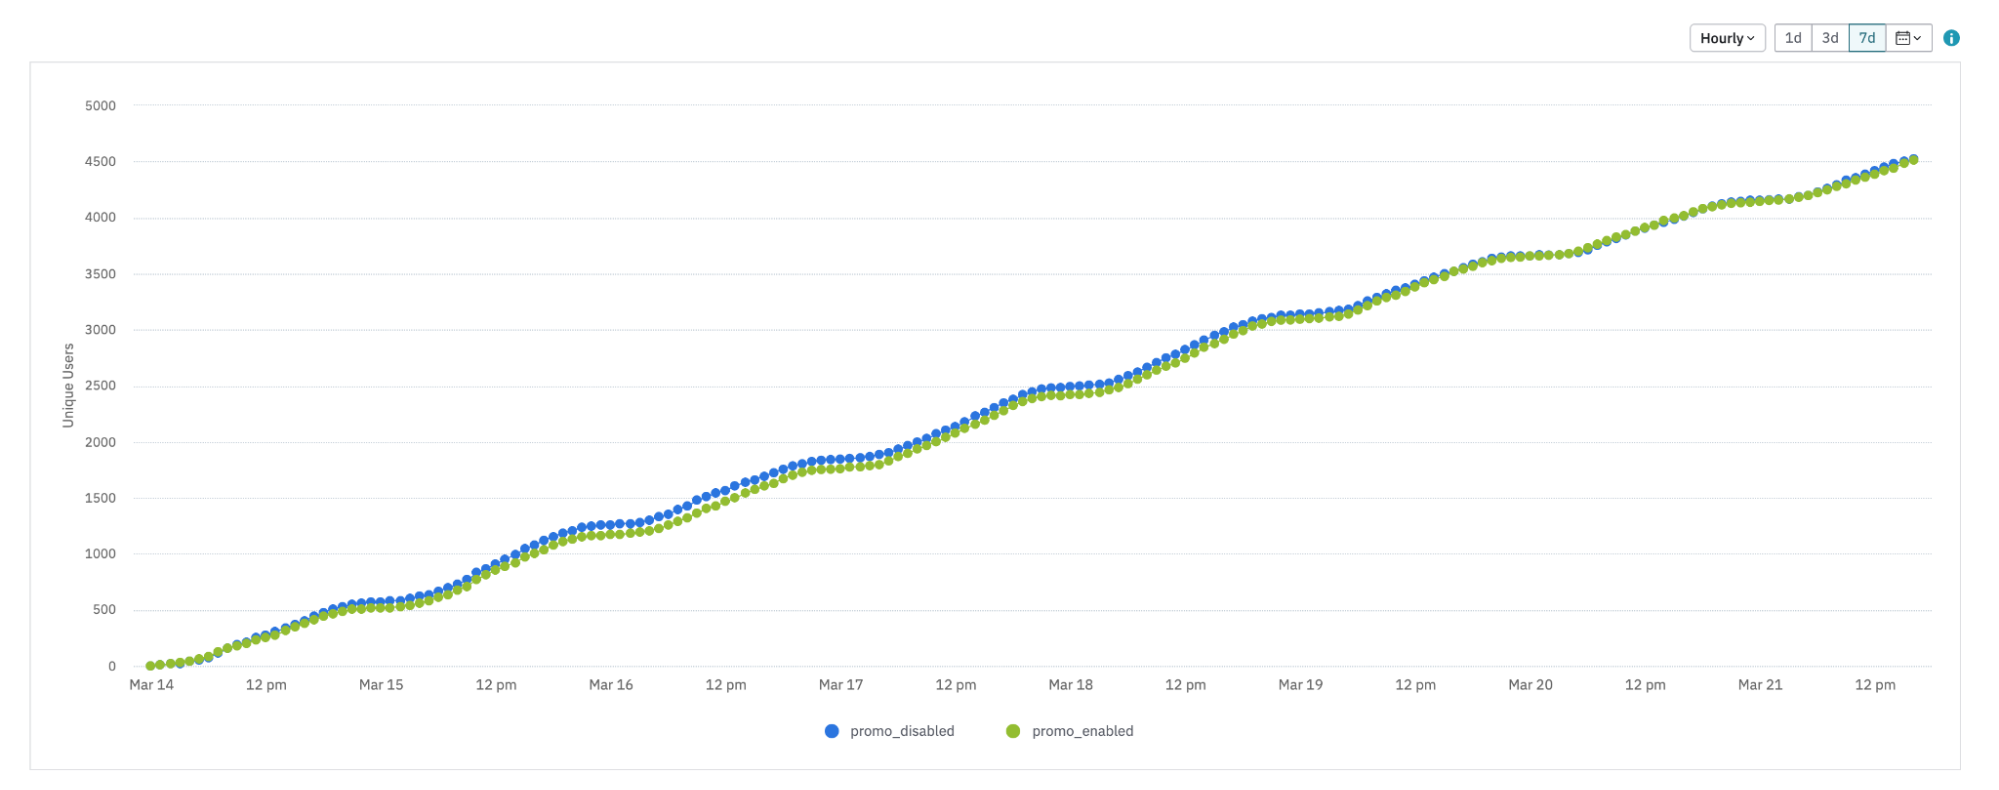
The trend is still linear. Because this is an hourly graph, from 9 PM to about 5 AM, almost no additional users receive the experiment. Users are likely asleep and not using the product during these hours. The daily version of the graph doesn't show this pattern.
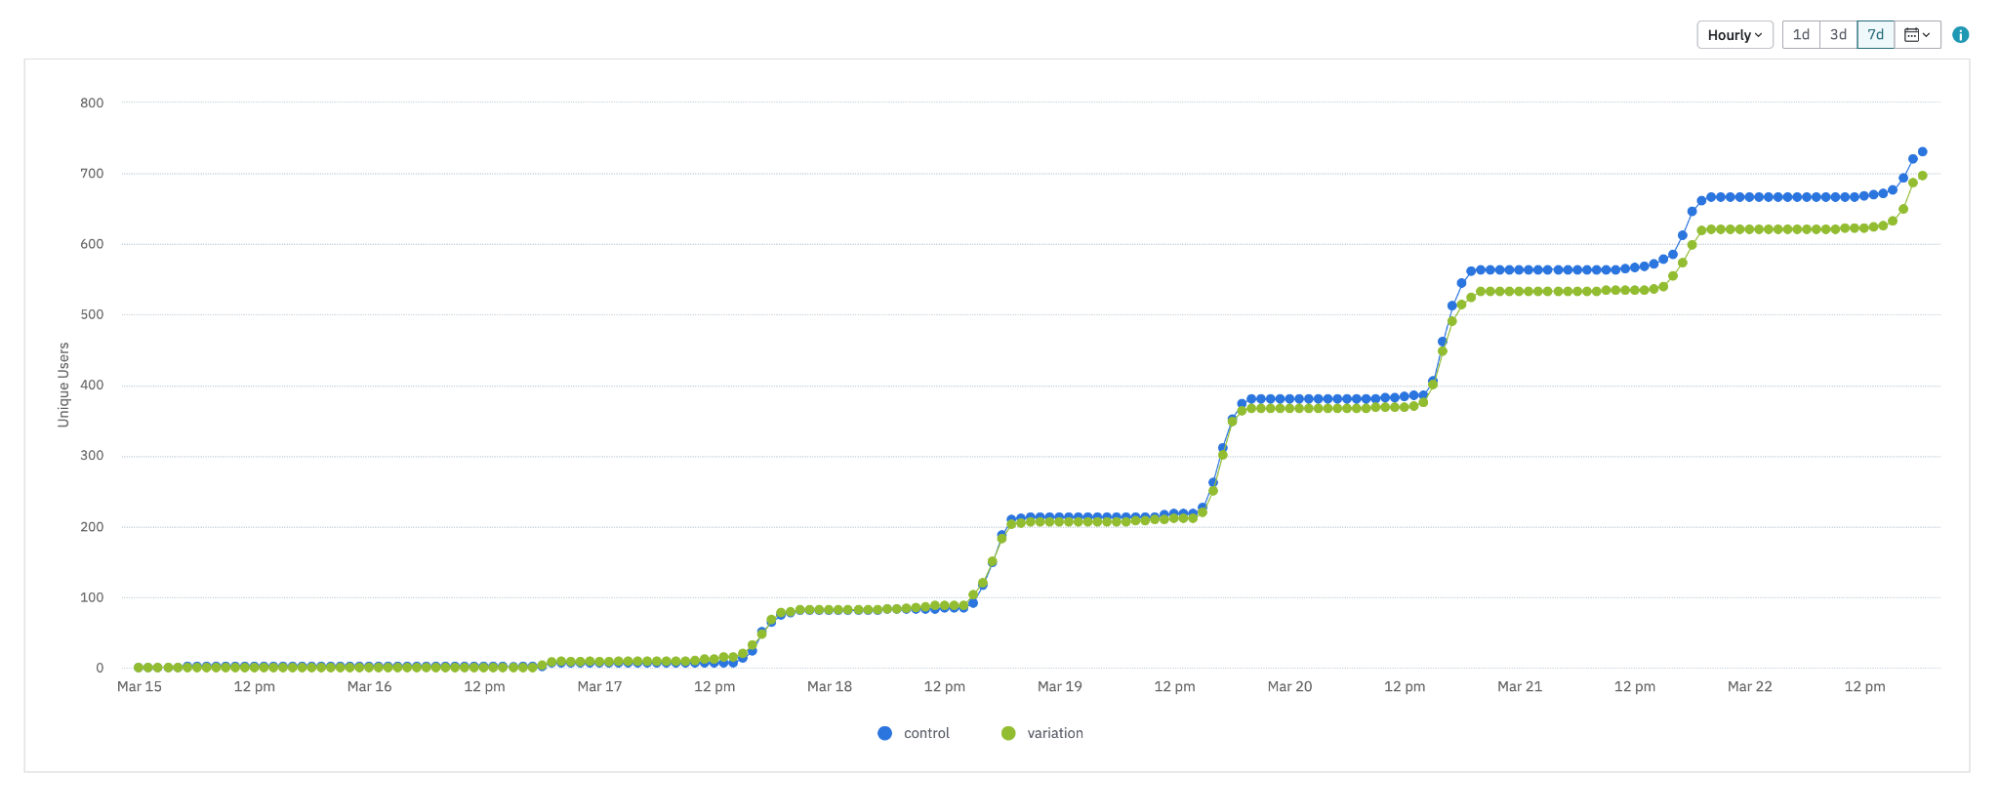
This is a more extreme example. The exposures look like a step function. In this case, users who already received the experiment at least once may be evaluating the feature flag again during these flat time periods.
## Decreasing slope
An experiment's cumulative exposures can start strong, then slow over time.
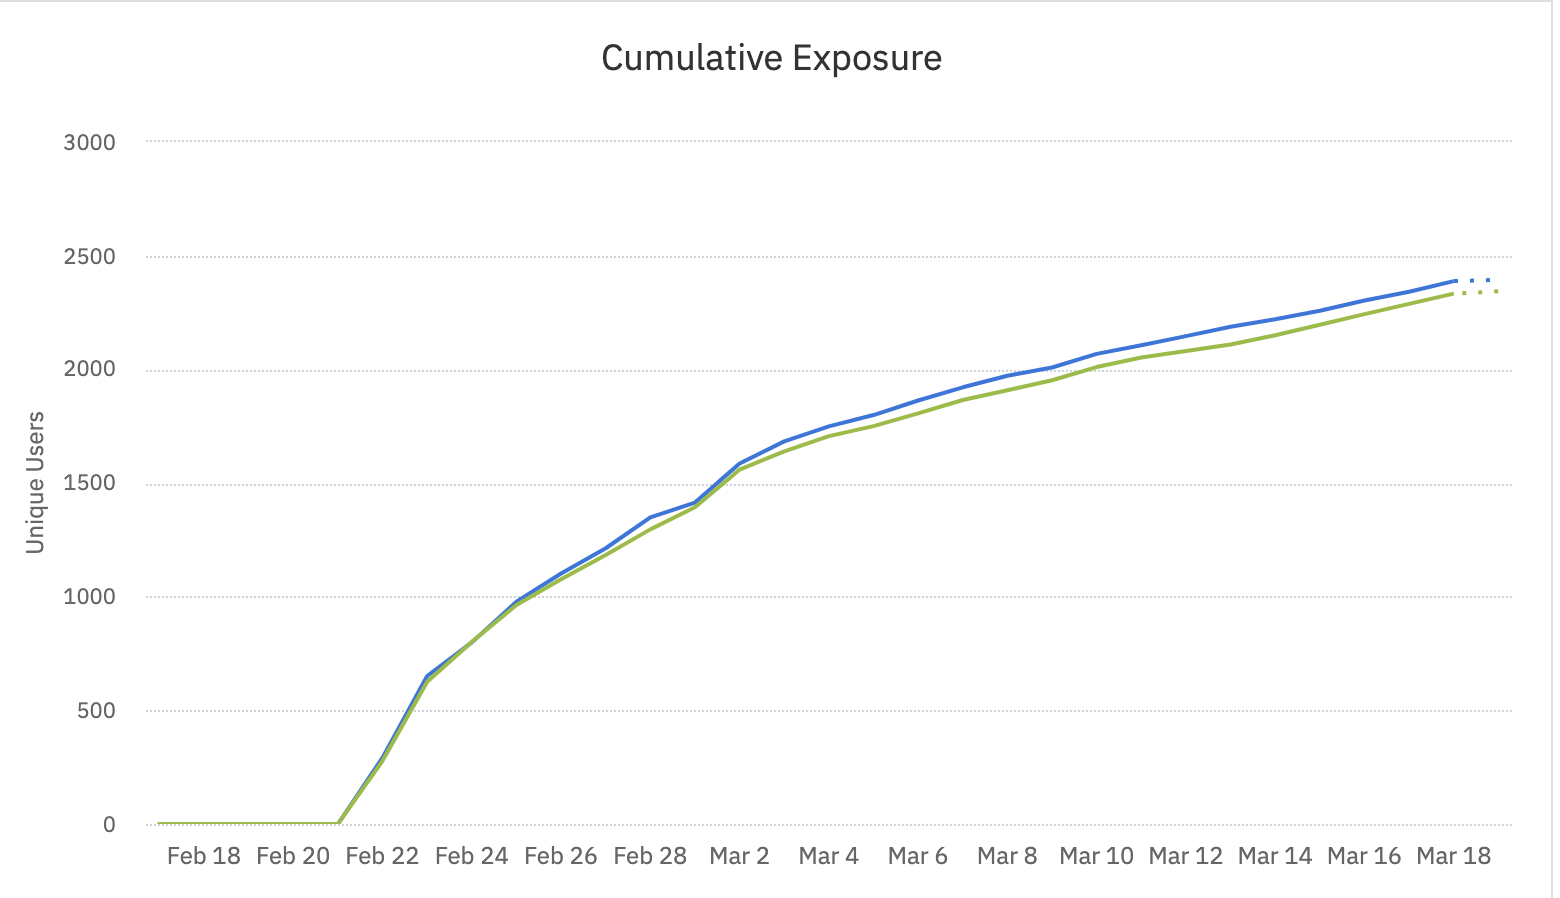
When this experiment launched, about 280 new users received each variant each day. By the end, exposure rates dropped to about 40 new users per variant, per day.
### Static cohorts can limit your experiment
Cumulative exposures can flatten over time when you target a [static cohort](https://amplitude.com/docs/analytics/behavioral-cohorts): a cohort that doesn't grow or shrink on its own.
For example, consider a static cohort with 100 members. On the first day, 40 of those users receive your experiment. Only 60 eligible users remain. Each day, fewer users can enter the experiment, and the slope of your cumulative exposures graph flattens.
If you use a static cohort in an experiment, reconsider how you use the [duration estimator](https://amplitude.com/docs/feature-experiment/workflow/experiment-estimate-duration). Instead of solving for sample size, ask what level of lift you can reasonably detect with this fixed sample size.
When you use a cohort this way, ask whether the cohort represents a larger population that could show a similar lift if more users received the winning variant. Don't assume it does. That assumption is like running an experiment in one country and then assuming the same impact in any other country.
### Other possible causes for decreasing slope
- The dynamic cohort isn't growing quickly enough, or the number of users that interact with your experiment is limited.
- Your [sticky bucketing](https://amplitude.com/docs/feature-experiment/advanced-techniques/sticky-bucketing) configuration: if users enter the cohort and then exit, decide whether they continue to receive the experiment (for consistency) even after they no longer meet the targeting criteria.
- The experiment first reaches a group of users that don't represent users exposed later. Users who used your product for 30 days may interact with the feature you test differently than users active for 100 days. Run your experiment longer than originally planned to study the treatment effect on a steady state of users.
- Users gradually become numb to your experiment and stop responding after repeated exposures.
A flattened cumulative exposures graph doesn't always mean the experiment has limited impact. The specifics of your users' behavior determine the result.
This pattern has serious implications for how long your experiment needs to run. The standard method calculates experiment duration by dividing the estimated sample size by the average traffic per day. That method doesn't apply here. You typically need to run the experiment longer than expected, because the estimate overstates the denominator.
================================================================================
# The cumulative exposures graph: Divergent lines
URL: https://amplitude.com/docs/feature-experiment/advanced-techniques/cumulative-exposure-divergent-lines
================================================================================
# The cumulative exposures graph: Divergent lines
This article compares divergent lines with similar slopes against divergent lines with varying slopes. Divergent lines start from a common point and spread apart over time.
## Divergent lines with similar slopes
Sometimes your cumulative exposure graph shows divergent lines with similar slopes. This happens when your experiment starts before all variants are ready.
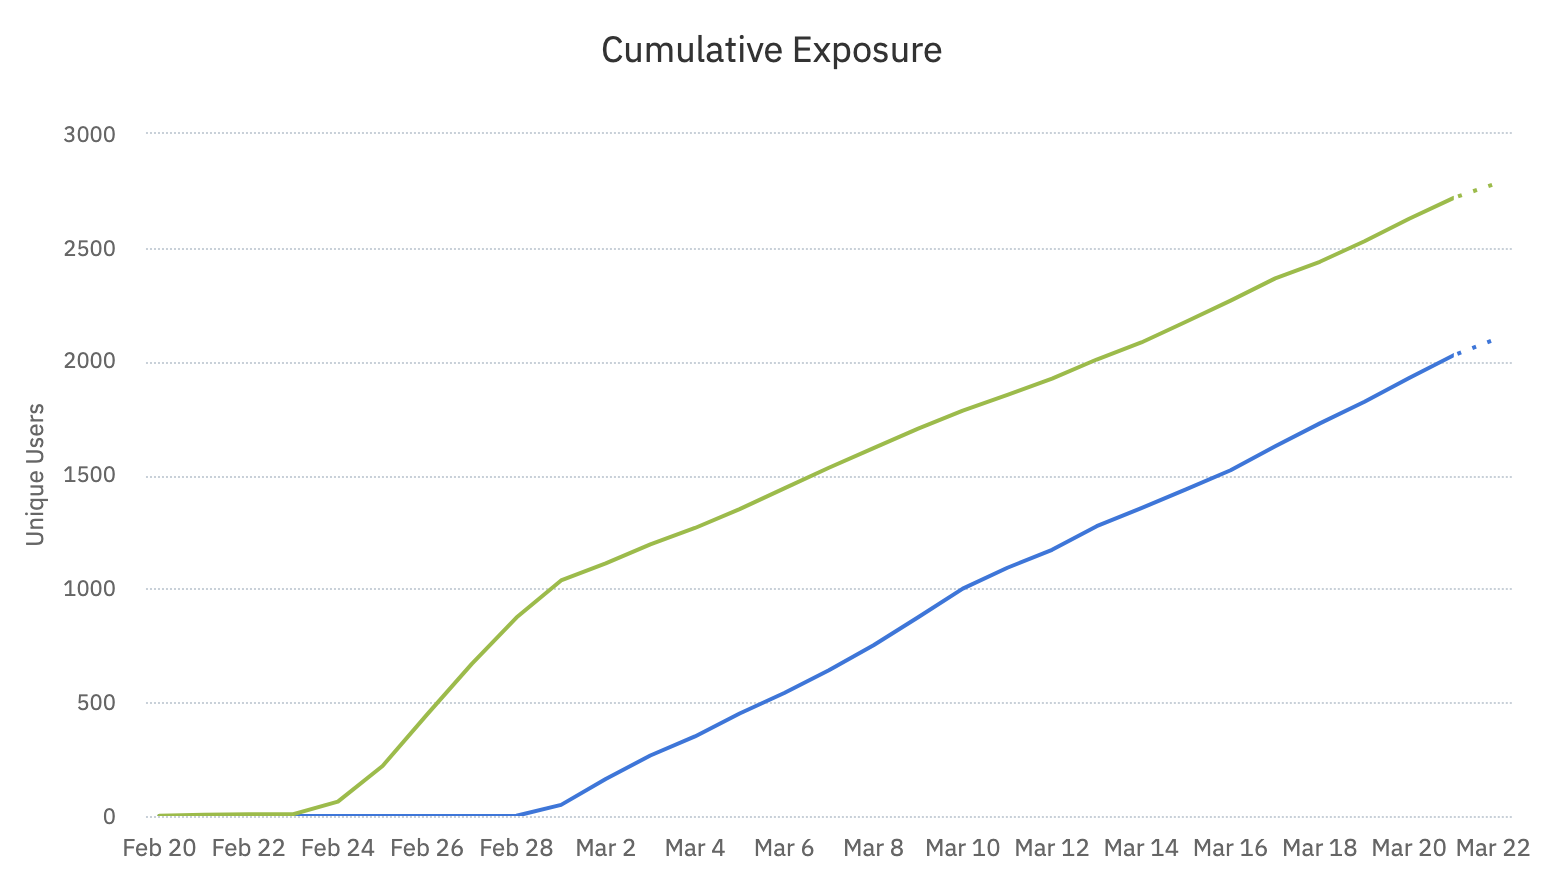
In this example, the two variants began receiving traffic on two separate days, February 23 and February 28, producing a pair of staggered lines on the graph.
Don't begin an experiment until all variants are ready to receive traffic. Adding a new variant after the experiment is underway presents a misleading picture of the results, because the variants weren't subject to the same conditions for the same length of time.
### The novelty effect
Another potential issue is the novelty effect: the newness of a treatment can sway experiment results. In the example above, users exposed to the green variant had more time to adjust to the new experience. Users exposed to the green variant also had more opportunities to trigger the primary metric, especially if it's an unbounded time metric, making the comparison between variants unequal.
A central requirement of experimentation is to ensure the only difference between treatment and control is the feature you're testing. This way, you know any differences you find result from causation, not correlation.
## Divergent lines with different slopes
Your cumulative exposures graph can show divergent lines with different slopes for several reasons. If you're using a custom exposure event, users can receive old, cached variants of your experiment when they keep triggering the exposure event without triggering the assignment event.
For example, Amplitude can assign a user to the control variant without triggering the exposure event. If you later set the traffic allocation for the control variant to 0%, that user can return and trigger the exposure event without triggering a new assignment event. Amplitude counts that user as a control exposure.
This reasoning also applies to experiments with sticky bucketing on.
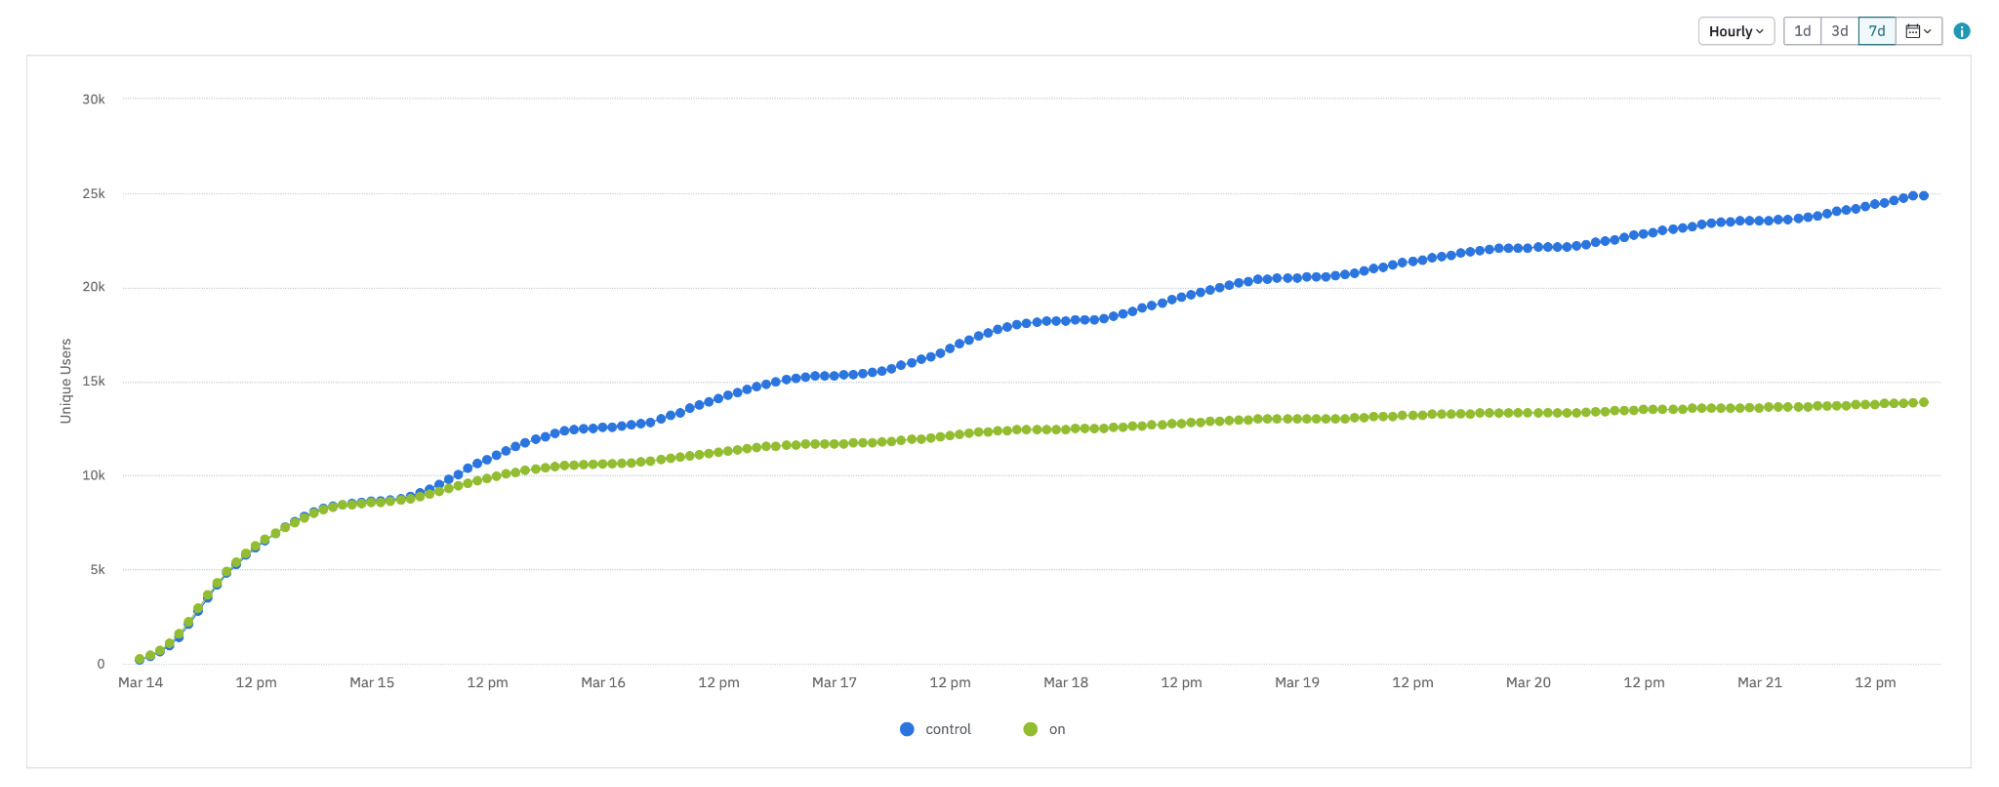
In this example, on March 15, the user rolled out their experiment to 100% for the control variant. Because the experiment uses sticky bucketing, the graph still shows the number of "on" users increasing after the user set the traffic allocation to 0%. This happens because Amplitude allocates variants when the SDK or API requests them, so the variant can stick to the user even if the user never receives it.
### Sticky bucketing and traffic allocation
When you select sticky bucketing and change the traffic allocation, you don't get the target traffic allocation. Instead, you get a weighted average between the two allocations, because users who already have buckets stay in their buckets. You have to wait to get close to the target traffic allocation.
If your experiment has sticky bucketing turned on and you plan to roll out a variant after it ends, delete the appropriate branch in the code and remove the feature flag. If you don't want to make a code deployment, you can also turn off sticky bucketing.
================================================================================
# The cumulative exposures graph: Inflection points and flattened slopes
URL: https://amplitude.com/docs/feature-experiment/advanced-techniques/cumulative-exposure-inflection-points
================================================================================
# The cumulative exposures graph: Inflection points and flattened slopes
## Inflection point
Sometimes, lines have an *inflection point* caused by a sudden increase or decrease in the count of exposures per day.
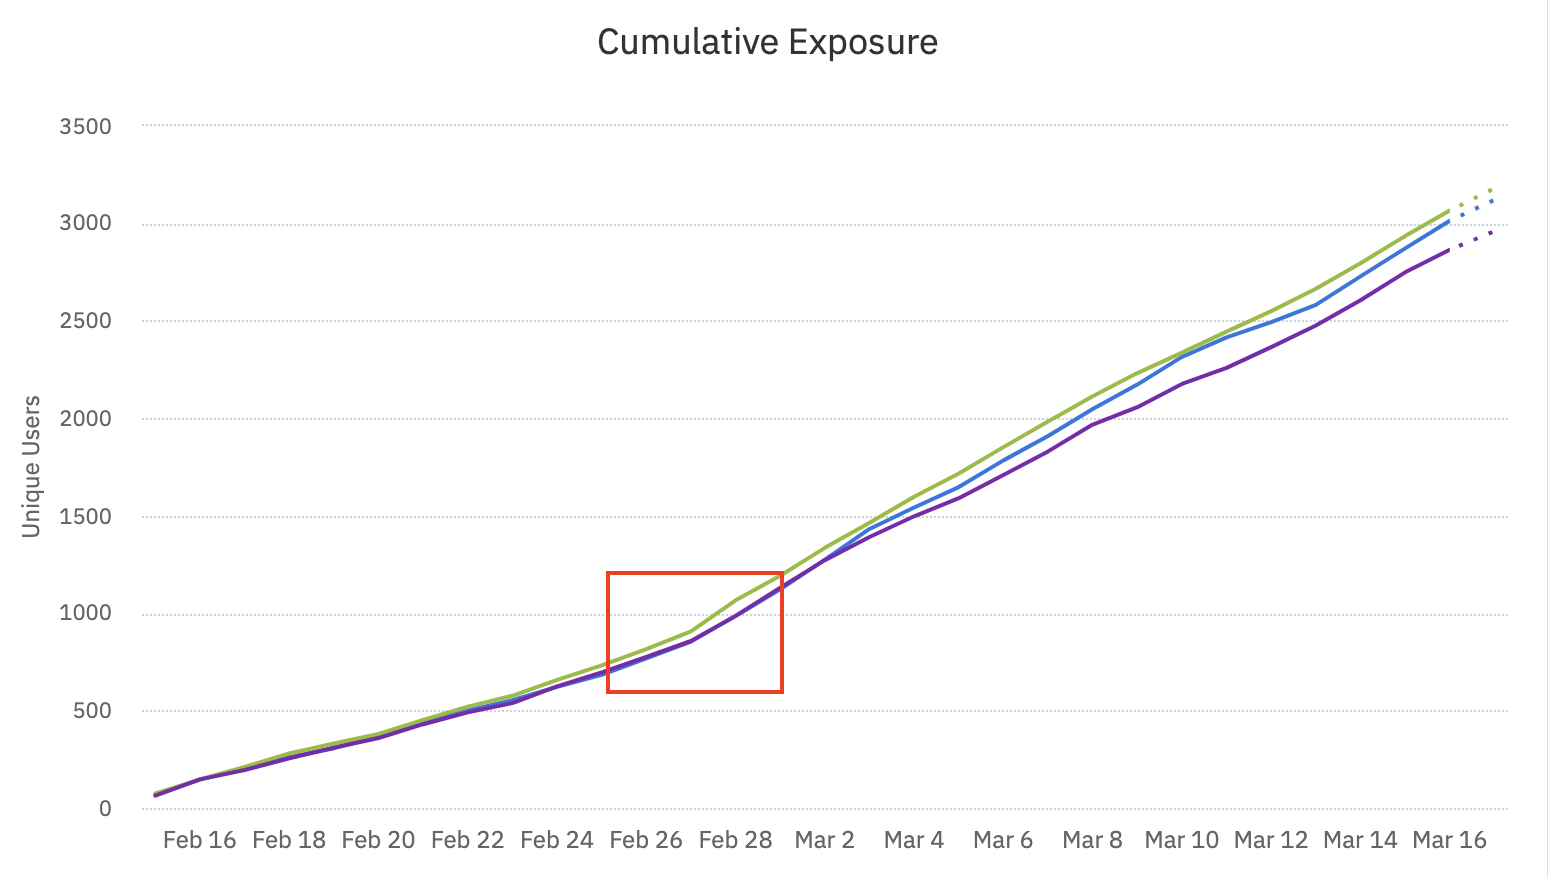
On February 27, the slope of all three lines changed from around 70 users per day per variant to about 100 users per day per variant. The slope can also flatten after an inflection point.
Several reasons explain why this can happen:
* Traffic to your experiment increased.
* Traffic allocations increased for each variant. If you increased traffic to a single variant, then only one line shows this inflection point.
* The targeting criteria changed. For example, you originally targeted users from California, then decided to target users from California and Florida.
* An external event occurred, such as an increase in the advertising budget or the release of a new feature, which drove more users to your experiment.
### Settings changes during a live experiment
Don't change settings for traffic or traffic allocations to variants in the middle of an experiment. Doing so can introduce [Simpson's paradox](https://en.wikipedia.org/wiki/Simpson's_paradox) into your results. If you changed the traffic allocation, restart the experiment by choosing a new start date. Avoid including any users who were already targeted.
{% callout type="note" %}
Read more about [Simpson's paradox in this article](https://www.exp-platform.com/Documents/2009-ExPpitfalls.pdf).
{% /callout %}
Don't change the targeting criteria during an experiment. The sample then doesn't represent what happens if you roll out a variant to 100% of your users. Instead, gradually increase traffic to the entire experiment, or do a gradual feature rollout instead of an experiment.
For example, in the first week of your experiment, you target only Android users, and 100 of them see your experiment. The following week, you change the targeting criteria to include iOS users, and 20 of them see your experiment.
After two weeks, 220 users have seen your experiment, and 9% of them (20/220 = 1/11 = 9%) are iOS users. When you release your experiment to 100% traffic, you discover the true percentage of iOS users is 16.7%. In this case, you underestimate the effect of iOS users. If the experiment shows a positive lift for Android users but a negative lift for iOS users, you may roll out a feature based on what you think is a positive experiment, but the result is negative.
### Consider changing the experiment's end date
After you answer why the slope changed, consider whether to adjust the end date of the experiment. With more traffic, you reach statistical significance faster. With less traffic, statistical significance comes more slowly.
## Flattened slope
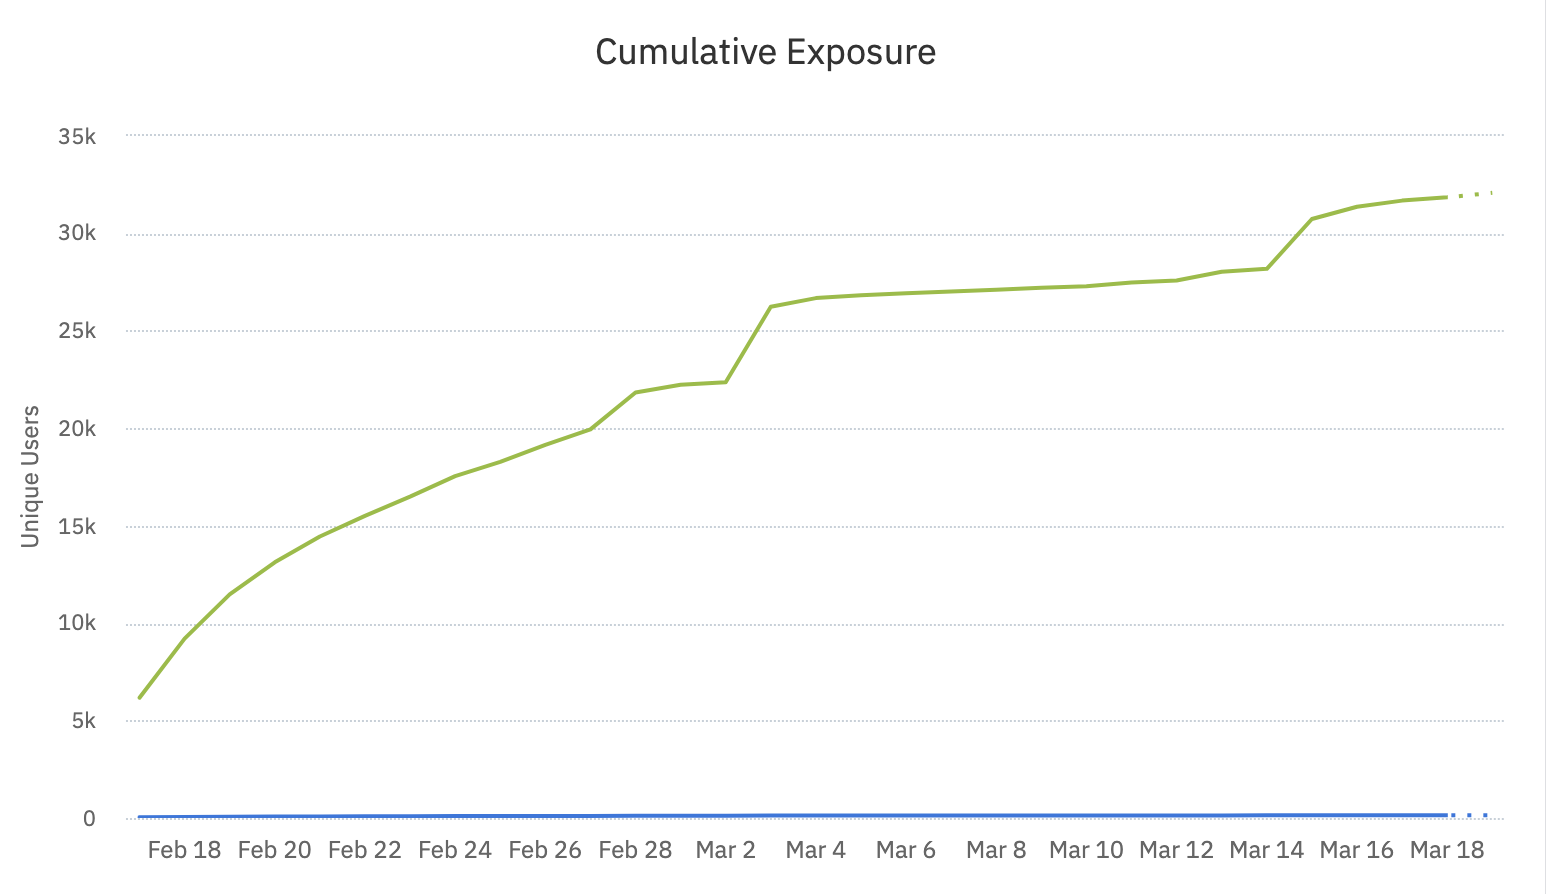
From March 4 to March 11, the graph is fairly flat. Few new users joined the experiment during that period. Potential explanations include:
* You ran out of users to add to the experiment.
* A bug exists in the sending of exposure events.
* Seasonality strongly affects your product's usage.
The following hourly chart shows a strong example of seasonality.
Between March 21 at 7 PM and March 22 at 9 AM (the rightmost section of the graph), few users saw this experiment. Just before that, starting around 5 AM, many users saw the experiment. On the left side of the graph, users trickle in slowly. An online gambling company runs this experiment, so traffic spikes when they run their jackpots.
================================================================================
# Troubleshoot your experiment
URL: https://amplitude.com/docs/feature-experiment/workflow/experiment-troubleshoot
================================================================================
# Troubleshoot your experiment
Unexpected issues sometimes surface when you create and roll out an experiment or flag. This page describes common issues and their workarounds.
This article assumes you know how to set up and run an experiment in Amplitude Experiment. If you need a refresher, review the Help Center articles on [an overview of Amplitude Experiment](https://amplitude.com/docs/feature-experiment/overview) and [configuring your experiment](https://amplitude.com/docs/feature-experiment/workflow/configure) before proceeding.
{% callout type="tip" heading="Use an A/A test to validate your setup" %}
If you suspect a systemic instrumentation or assignment issue, [run an A/A test](https://amplitude.com/docs/feature-experiment/aa-testing) to confirm your experimentation platform works correctly before debugging individual experiments.
{% /callout %}
## Experiment troubleshooting checklist
Use these questions as a quick checklist for experiment discrepancies. If you can answer "yes" to a question, that question is unlikely to be the cause of your issue.
**Do the device ID and user ID align?**
The device ID and user ID you use for experiments and flags must match the device ID and user ID in Amplitude Analytics.
**Is your flag enabled?**
A flag must be enabled in a deployment to appear in that deployment.
**Does your variant use a name other than "off"?**
Don't name a variant "Off." Amplitude reserves this value for users in the "OFF/FALLBACK" bucket.
A fallback is the default variant (usually "control") that Amplitude serves when Experiment can't assign a user to a treatment group.
**Do your assignment event and exposure event point to different events?**
The assignment event and the exposure event can use the same event, but they represent different concepts. Each plays a different role in your experiment:
- The assignment event immediately precedes a user's assignment to a variant.
- The exposure event is the event the user must trigger to receive the variant.
Amplitude assigns users at the beginning of their session, and users might not trigger the exposure event until later in the flow.
Confirm the correct events map to each.
Go to [Feature Assignment Events](https://amplitude.com/docs/feature-experiment/under-the-hood/event-tracking#assignment-events) for more information.
**Are your old properties synced to new ones?**
If you run an experiment on a single platform (for example, iOS), users with a different platform value (for example, Android) might still appear. This happens when users access your product on multiple platforms and their most recent event comes from a platform other than the one your experiment targets. The assignment event fires automatically and doesn't contain non-Experiment properties such as `platform`.
## Other experiment discrepancies
Some experiment issues fall outside your direct control. This section highlights those scenarios.
### Targeting on user properties is delayed
Amplitude Experiment updates cohort targeting each hour. Targeting on properties sent directly to Experiment applies in real time. Targeting on user properties that Amplitude stores can lag by up to one hour because of the [CDN](https://amplitude.com/docs/feature-experiment/under-the-hood/experiment-performance-scaling).
### A user didn't receive their assigned variant
Amplitude Experiment generates data on the server side and stores assignments as user properties. A user might not receive their assigned variant because of timeouts, network errors, or ad blockers.
A user can also receive one variant one day and a different variant the next. Because [bucketing in Amplitude Experiment relies on user ID and device ID](https://amplitude.com/docs/feature-experiment/troubleshooting/variant-jumping), users can land in a second bucket when you rely on device ID alone and the user's device ID changes. This happens when the user opens incognito mode or clears their cache and cookies after their last visit.
### A user doesn't log any events past the assignment event
A user can trigger the assignment event without logging any other active events:
- The user's ad blockers or analytics blockers interfere with analytics application events. Feature Experiment requests come from backend servers and usually pass through, but blockers can affect Web Experiments.
- A user opens the app, which sends a request to Amplitude's backend servers and triggers the assignment event. The user then leaves the app before performing any other actions that trigger an analytics event.
- Amplitude's servers receive assignment requests directly from your backend instead of from the end user. Check if you instrumented experiments in offline campaigns such as group push notifications or marketing emails.
================================================================================
# New Experiment Run
URL: https://amplitude.com/docs/feature-experiment/troubleshooting/new-experiment-run
================================================================================
# New Experiment Run
Create a new run of an existing experiment after you fix instrumentation issues that affected data quality. A new run excludes previous user data from your experiment's monitoring and analysis.
## Create a new run
To create a new run of an existing experiment:
1. Open a running or completed experiment.
2. Open the menu next to **Turn off flag** (for completed experiments) or **Complete experiment** (for running experiments) and select **New run**.
3. Select a new analysis range. Optionally, configure how Amplitude handles users in the new run and what happens to existing feature flags.
## Configuration changes on a new run
Amplitude applies the following changes to your experiment configuration when you create a new run:
| Property | How it changes on a new run |
| --------------------------------- | ------------------------------------------------------------------------------------------------------------- |
| [Experiment key](#experiment-key) | Amplitude assigns a new value. |
| Start date | Amplitude sets the start date to the restart date. |
| End date | (Optional) Amplitude sets the end date to your selected value. |
| Bucketing salt | (Optional) If you select this option, Amplitude randomizes the salt to a new value. |
| Sticky bucketing | If you select the option to re-randomize users and sticky bucketing is on, Amplitude turns sticky bucketing off. |
| Decision | If you rolled out or rolled back your experiment, Amplitude erases the decision. |
## Experiment key
By default, Amplitude delimits your experiment runs by time. You can also differentiate runs with the experiment key property on the default exposure event. The experiment key prevents your new run from including stale evaluated users. After you create the new experiment run, enable the setting under the exposure event control to use the experiment key.
To use the experiment key:
1. Your experiment must use Amplitude's default exposure tracking.
2. Your client SDK version must support experiment restarts.
| SDK | Minimum version |
| ------------ | --------------- |
| JavaScript | v1.10.2 |
| Android | v1.10.0 |
| iOS | v1.11.0 |
| React Native | v1.2.0 |
If you use the [Evaluation API](https://amplitude.com/docs/apis/experiment/experiment-evaluation-api), the response body contains the experiment key of the actively running experiment.
```json
{
"<flag_key>": {
"key": "<variant_value>",
"payload": <variant_payload>,
"experiment_key": "exp-1",
},
// ...
}
```
The experiment key is also available when you fetch variants with Experiment SDKs. For example, the JavaScript SDK [Variant](https://amplitude.com/docs/sdks/experiment-sdks/experiment-javascript#variant) object contains the existing `value` and `payload` properties along with a new `expKey` property.
================================================================================
# Exposures Without Assignments
URL: https://amplitude.com/docs/feature-experiment/troubleshooting/exposures-without-assignments
================================================================================
# Exposures Without Assignments
The Exposures without Assignments chart appears in the Diagnostics card. The chart shows the cumulative number of unique users who triggered an exposure event without a corresponding assignment event each day.
If a large number or percentage of users appear in the chart, interpret your experiment results carefully. Investigate what happens if someone gets exposed to the experiment when they shouldn't:
- Is the experience bad?
- Can the user view the experience?
- What does it mean if a user can view both experiments when they're mutually exclusive?
Exposure without assignment can also affect future experiments, so investigate and fix the issue.
{% callout type="note" heading="" %}
This chart doesn't appear if you selected the assignment event as the exposure event, or if you're using [local evaluation](https://amplitude.com/docs/feature-experiment/local-evaluation).
{% /callout %}
{% callout type="note" heading="" %}
Sometimes Amplitude delays the exposure event and sends it on a different day than the assignment event. For example, Amplitude sends the assignment event today and the exposure event tomorrow. An issue exists if, between the assignment and the exposure events, the user's properties change in a way that affects whether they should be targeted. Otherwise, ignore this warning.
{% /callout %}
## Causes
A significant number of users in the Exposures without Assignments chart can come from a few scenarios:
- Identity mismatch between assignment and exposure.
- The user ID and device ID are incorrect, switched, or [missing](https://amplitude.com/docs/apis/analytics/http-v2#device-ids-and-user-ids-minimum-length) on either assignment or exposure. For example, sending the device ID as the user ID or vice versa.
- Account switching on the same device.
- If a real user has multiple accounts on the same device, and you don't call fetch on login or logout, the value that `variant()` accesses triggers an exposure for the new user without an assignment event. Re-call `fetch()` whenever the user identity changes.
- Exposures for fallback variants.
- If you manually track exposure events, don't track exposure events for fallback or default variant values. For example, if a user doesn't get assigned a variant for an experiment and you show the user the control, don't track an exposure event with the variant value `control` for that user.
## Debugging
To debug exposure without assignment, open the chart in analytics and view user streams. Common problems include:
1. Users who only have assignment or exposure events. This issue likely comes from an identity mismatch between assignment (`fetch()`) and the exposure tracked through analytics.
2. User login followed by exposure events without an assignment event. This issue likely comes from account switching on the same device. Use user lookup with the device ID to determine whether multiple logged-in users share the same device. If a user has multiple accounts on the same device, calls `fetch()`, signs out, signs in to another account, and then calls `variant()`, this pattern occurs. Re-call `fetch()` whenever the user identity changes.
## Problems with your experiment
- Users can get exposed to the experiment when they don't meet the rule-based targeting criteria. This happens because Amplitude checks the rule-based targeting on the `fetch()` call.
- Users can get exposed to both experiments even though the experiments are mutually exclusive.
================================================================================
# Sample Ratio Mismatch
URL: https://amplitude.com/docs/feature-experiment/troubleshooting/sample-ratio-mismatch
================================================================================
# Sample Ratio Mismatch
In Amplitude Experiment, a sample ratio mismatch (SRM) occurs when the observed variant allocation significantly differs from the specified allocation. For example, you allocated 50% of your Experiment traffic to control and 50% to treatment, but you observe a ratio of 55% control to 45% treatment.
An SRM points to biases in the data and can lead to unexpected results when unresolved. Treat the results of any experiment with an SRM as suspect.
Amplitude uses a [sequential version of a chi-squared test](https://arxiv.org/abs/2011.03567) with alpha = .01 to detect an SRM.
This guide describes the causes of an SRM, ordered from most to least common, and how to debug each one. It assumes you use the end-to-end Experiment product, but you can apply many of these steps to experiments set up in Experiment Results.
{% callout type="info" heading="More information" %}
This list doesn't cover every possible cause of an SRM. Go to [SRM Checker](https://www.lukasvermeer.nl/srm/docs/faq/#what-can-we-do-about-sample-ratio-mismatch) for more debugging strategies.
If you still have issues with an SRM after using this guide, contact support.
{% /callout %}
## Amplitude exposure events versus custom exposure events
Amplitude recommends the [Amplitude exposure event](https://amplitude.com/docs/feature-experiment/under-the-hood/event-tracking#exposure-events). On client-side SDKs, Amplitude tracks the exposure event automatically when the variant loads from the cache, not when Amplitude fetches the variants. Local evaluation doesn't produce an assignment event, so you must use a custom exposure event.
If you use a custom exposure event, send it when the user experiences the variant. The custom exposure event can happen before assignment. When this happens, the user property isn't yet set, and Amplitude doesn't count the initial custom exposure event as an exposure in analysis. Amplitude exposure events don't cost extra.
## Variant distribution weights changed during the experiment
As a best practice, don't change a running experiment in a way that causes users to jump between variants. Changes like this can cause an SRM.
For example, changing 50% treatment / 50% control to 60% treatment / 40% control can cause users to jump between variants while the experiment runs. The SRM test assumes that traffic allocation doesn't change while the experiment runs. Go to [Interpret the Cumulative Exposures Graph in Amplitude Experiment](https://amplitude.com/docs/feature-experiment/advanced-techniques/cumulative-exposure-change-slope) for more context about why you shouldn't change traffic allocation mid-experiment.
## Experiment exposures started before analysis window begins
If one variant causes users to return to the product more, that variant can show more users than expected when the exposure window and analysis window don't align.
{% callout type="example" heading="" %}
The experiment ran from January 1 to January 30, and analysis ran from January 15 to January 30. Every two weeks, 100 users enter control and 100 enter treatment. The treatment is so good that all treatment users return to the product every day. The control is so bad that control users never come back.
During the analysis window, you have 100 exposed users in control and 200 exposed users in treatment. The comparison between control and treatment isn't fair.
{% /callout %}
If the analysis window and the traffic window differ, change the analysis window to cover the full traffic window and check whether the SRM remains.
## Variant jumping
[Variant jumping](https://amplitude.com/docs/feature-experiment/troubleshooting/variant-jumping) describes when a user moves from one variant to another, sometimes multiple times. Variant jumping makes it difficult to attribute the metric to a specific variant. Amplitude Experiment's built-in diagnostics include charts that track the percentage of users who jump between variants.
If users jump between variants, check whether the cause is anonymous users (people who log in and out frequently) or changing device IDs. Review this in the [User Stream](https://amplitude.com/docs/analytics/user-data-lookup).
As a best practice, don't change a running experiment in a way that causes users to jump between variants. Changes like this can cause an SRM.
## Significantly more users converted from assignment to exposure for one variant
You can find the assignment-to-exposure funnel chart in the Diagnostics card of an experiment. Enter your conversion rates and sample size into [this calculator](https://www.socscistatistics.com/tests/ztest/default2.aspx) to check whether your metrics are statistically significant at the 95% level. The conversion rates between variants should be similar, within randomness, because the assignment event splits users into two randomly assigned, equal cohorts. Amplitude sends exposure events immediately before the user experiences a variant, so users have the same experience between the assignment and exposure events.
## Variant added or removed in the experiment
Adding or removing a variant while an experiment runs can cause an SRM. As a best practice, don't change a running experiment in a way that causes users to jump between variants.
## Sticky bucketing enabled or disabled during experiment
Enabling or disabling sticky bucketing on a running experiment can cause a mismatch between the variant you expect and the variant a user receives. After you enable sticky bucketing on an experiment, Amplitude always evaluates each user to the same previously bucketed variant, regardless of the current targeting, even if you later disable sticky bucketing.
## Changes that affected a segment of users
Check whether the SRM affects only a certain segment of users. For example, filter by [country, OS version, app version, or platform](https://amplitude.com/docs/get-started/user-property-definitions).
To troubleshoot this kind of problem, find out which specific users the change affected. Ask questions like:
- Did someone push an instrumentation bug to an app version that a subset of users have?
- Did someone push a change that affects only users in a certain country?
## Individual allocation of many users
Check whether you [individually allocated](https://amplitude.com/docs/feature-experiment/implementation#individual-inclusions) a large number of users. Individual allocation isn't random and can skew your ratio, which can cause an SRM.
Adding a few users to the experiment individually is fine, but avoid adding many users.
## First experiment
If an SRM appears in your first experiment, the cause might be an instrumentation bug. If you have multiple SRMs, the SRM is unlikely to result from a false positive, and you should find the root cause.
## Users often logging out
Frequent logouts can appear in the variant jumping chart. Check whether the experiment causes users to log out more often. This pattern is common in financial institutions, where the application logs users out after 15 minutes of inactivity.
1. On logout, the application regenerates the device ID.
2. Amplitude treats the session as a new user.
3. Amplitude buckets the user into a different variant.
4. The user ID later resolves.
This pattern can also relate to anonymous users from sign-up flow experiments.
## Missing exposures
Check whether two users have the same sequence of events but one is missing an exposure event. You might not send the exposure event in some cases, or you might send it when you shouldn't.
## Incorrectly sending exposures for fallback variant
If you don't use the Experiment SDK to track exposures automatically, check whether you incorrectly send exposures for a fallback (default) variant.
Check for cases where the flag defaults to control and Amplitude counts that as an exposure when the flag doesn't return a response in time. When this happens, control has more exposures than treatment.
{% callout type="note" heading="" %}
Client-side SDKs don't send exposure events for fallback variants.
{% /callout %}
================================================================================
# Variant jumping
URL: https://amplitude.com/docs/feature-experiment/troubleshooting/variant-jumping
================================================================================
# Variant jumping
Variant jumping occurs when a user receives two or more variants for a single flag or experiment. Variant jumping above a certain threshold can raise concerns about the trustworthiness of an analysis.
Some types of variant jumping are normal: common and usually explainable. Other types are harder to track down.
## Debug variant jumping
The best way to debug variant jumping is to identify a user who jumped variants and analyze their user timeline. If you use remote evaluation, check the `Assignment` event to identify assignment or exposure discrepancies.
To find a user who jumped variants, follow these steps:
1. Navigate to the diagnostics card of your experiment.
2. Find the variant jumping charts, and click **Open in Chart**.
3. Click the bar for users who jumped variants and click **View User Streams**.
Show only assignment and exposure events in the user timeline for easier analysis.
When you debug a user timeline, note the following:
* Did you introduce any [targeting changes](#targeting-changes) while your flag or experiment was active? Could the timing of the change have affected the variant assigned to this user? Click the version number to check the version history.
* Which bucketing key did the flag or experiment use? Does the value for this property change between assignments or exposures for this user?
* Does the user have missing exposures or assignment events? If so, the missing event might have been sent for a different user.
* Is an assignment missing a user property it should have? If so, double-check the server upload timestamp of the assignment event and compare it to surrounding active events. Events sent from the client can arrive at Amplitude after the assignment event, even if the client order is different.
## Normal variant jumping
Normal variant jumping can occur due to:
* [Targeting changes](#targeting-changes): Someone changed targeting rules while your experiment was running.
* [Anonymous identity merging](#anonymous-identity-merging): Anonymous users, bucketed by Amplitude ID, can receive different variants until Amplitude resolves them through a matching user ID.
### Targeting changes
The following actions can cause a user to jump variants:
* Adding or removing a variant.
* Changing variant distribution weights.
* Targeting dynamic cohorts.
* Changing the bucketing key.
* Updating mutual exclusion.
{% callout type="tip" heading="Avoid variant jumping by enabling sticky bucketing" %}
Enable sticky bucketing before you make targeting changes to prevent variant jumping. Sticky bucketing can cause a [sample ratio mismatch (SRM)](https://amplitude.com/docs/feature-experiment/troubleshooting/sample-ratio-mismatch).
{% /callout %}
### Anonymous identity merging
The way Amplitude handles anonymous users can lead to variant jumping. Amplitude merges anonymous IDs with the correct existing user IDs (if one exists) as soon as Amplitude has enough information to do so. This merging can happen if a user uses your app on different devices without logging in, or if the device ID regenerates upon logout.
[Learn more about Amplitude's identity resolution and merging users.](https://amplitude.com/docs/data/sources/instrument-track-unique-users)
To identify this type of variant jumping, find the assignment event where the user jumped between variants. Then compare the Amplitude ID for both events. If the Amplitude ID differs between the events, anonymous identity merging is the likely cause.
To avoid this type of variant jumping, bucket by user ID if you target only logged-in users who have user IDs. Alternately, bucket by device ID if you target only anonymous users (for example, a sign-up experiment).
### Inclusion list
Imagine you have some user IDs in the inclusion list. You call `fetch()` and pass the user ID into the call. The call returns the control experience, per the inclusion list. The next time you call `fetch()`, you don't pass in the user ID. The user no longer meets the inclusion list criteria, so Amplitude hashes the bucketing key, and the user can receive a different variant instead. The same outcome can happen if you include device IDs.
In the following example, the user has a user ID. The user matches the inclusion list and receives the `signin-up-new_design` experience.
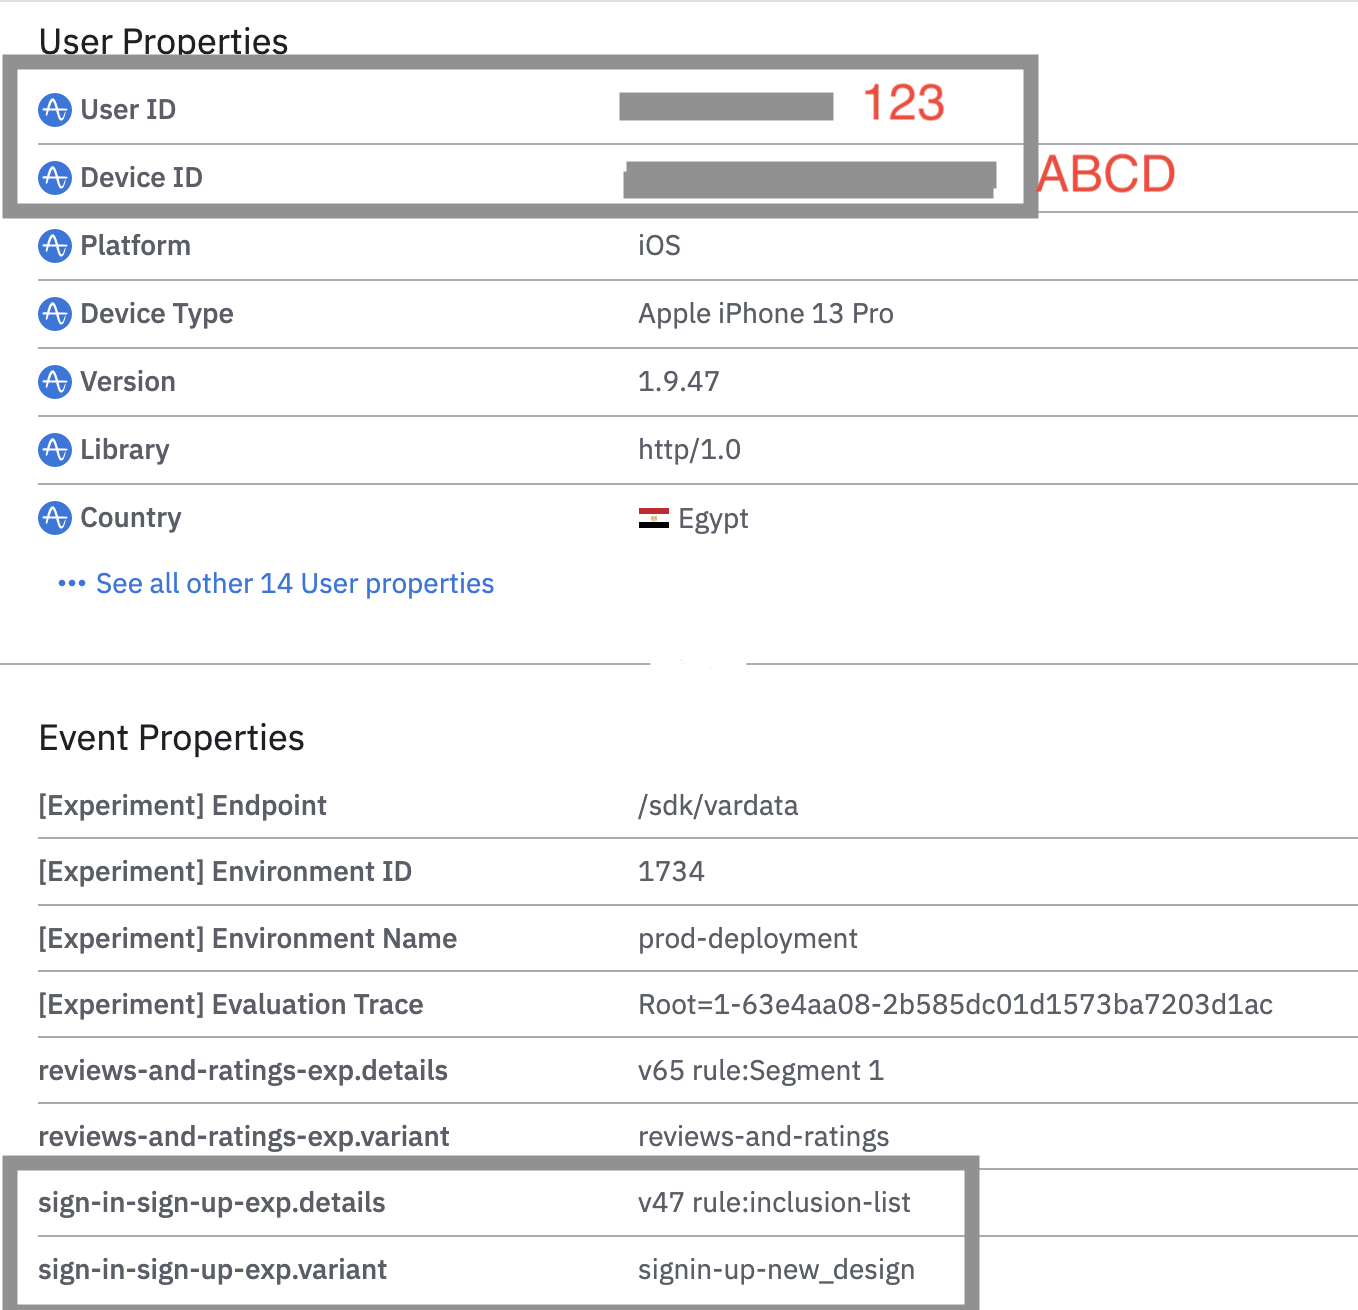
In this example, no user ID exists. The user doesn't match the inclusion list, falls into the "all other users" segment, and receives the `signin-up-original-view` experience instead.
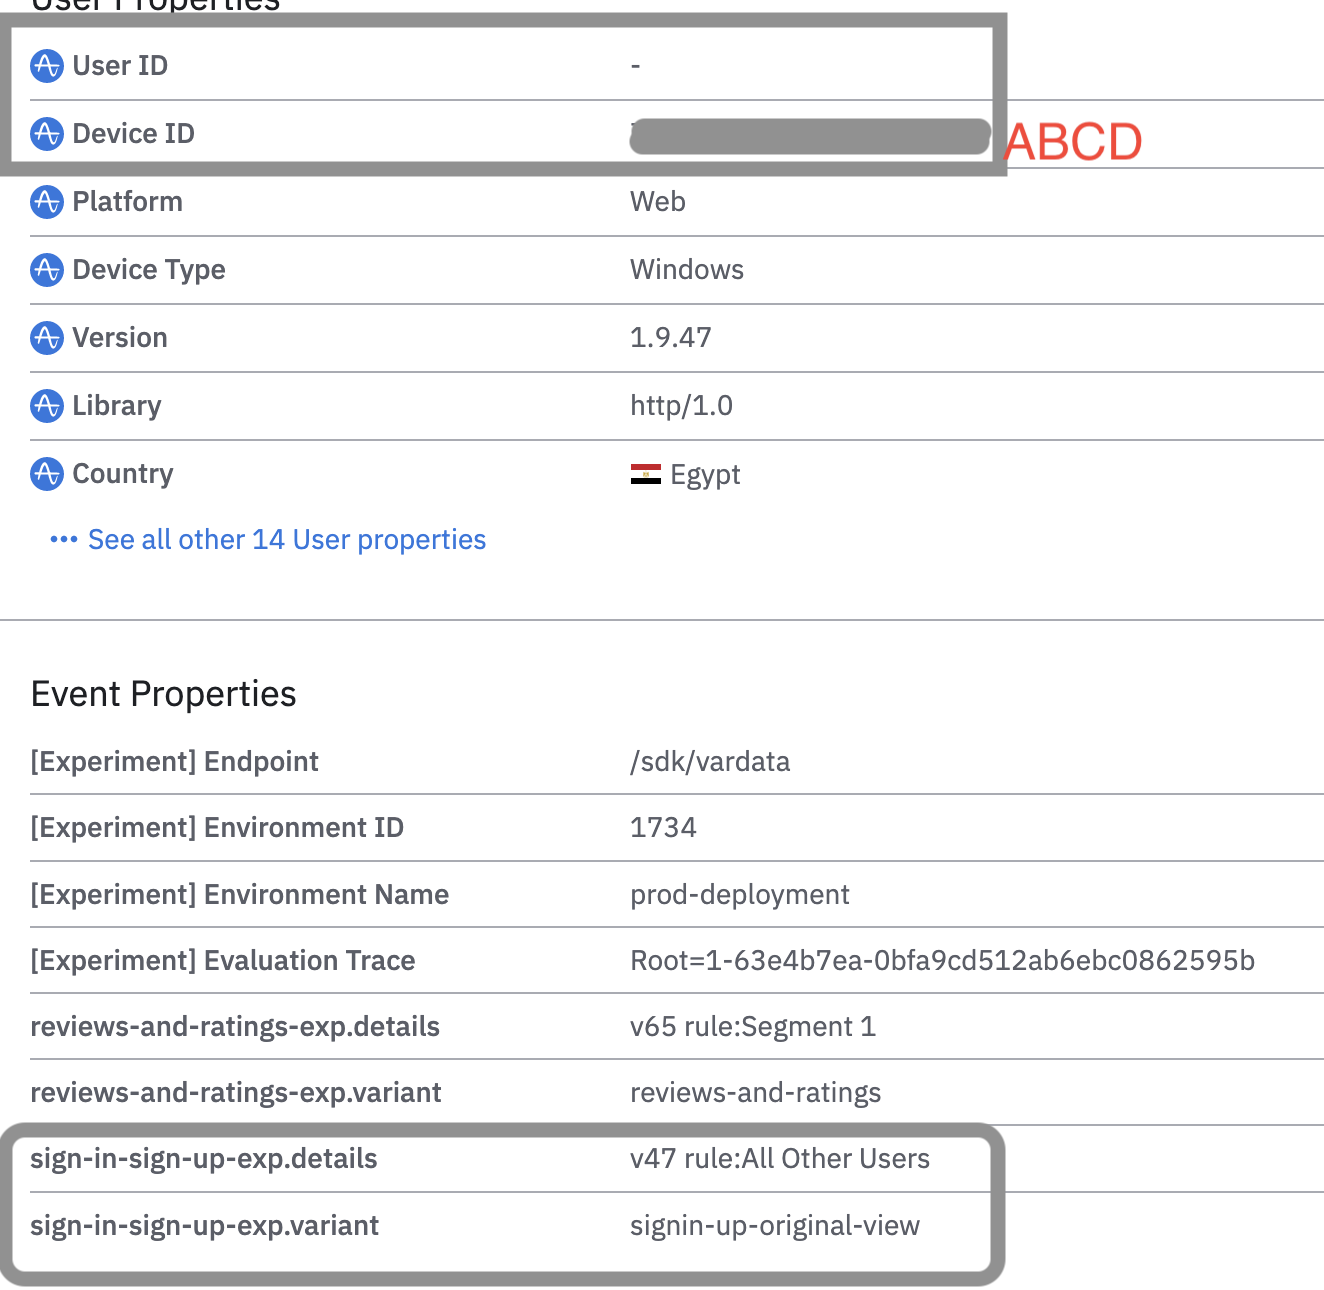
## Abnormal variant jumping
Instances of abnormal variant jumping don't fit any of the [normal explanations](#normal-variant-jumping). Abnormal variant jumping can be difficult to track down. The most frequent cause is identity mismatch: the user identity differs between assignment and exposure tracking. Identity mismatch almost always comes from an implementation inconsistency.
The following examples aren't exhaustive, but they illustrate common identity issues in Amplitude Experiment.
### Multiple logged in accounts on a single device
Consider this timeline for a person with multiple user accounts (U1 and U2), for your app on a single device.
1. Open the app as user U1 and fetch variants. U1 receives `treatment` for `experiment-1`.
2. Expose U1 to `experiment-1` variant `treatment`.
3. Log out of U1 and into U2, fetching variants asynchronously on login.
4. Before the fetch for U2 resolves, U2 sees the exposure to `experiment-1` variant `treatment`.
5. The fetch for U2 resolves. U2 receives `control` for `experiment-1`.
6. Expose U2 to `experiment-1` variant `control`.
In this case, user U2 jumped variants, from `treatment` to `control`, after seeing U1's stored variant. To avoid this case, either wait for the fetch to resolve before you render the user experience, or call the SDK's `clear()` method on logout to clear all stored variants from the SDK. Clearing variants wipes the SDK's variant storage and prevents the user from seeing cached variants. Clearing variants doesn't protect the user from viewing a fallback experience before the fetch request resolves.
If you keep a consistent device ID across logins, you can check for this type of variant jumping. Search for different users that share the same device ID.
### Inconsistent identity input between assignment and exposure
In Amplitude, the user ID and device ID properties identify your user and [resolve their Amplitude ID](https://amplitude.com/docs/data/sources/instrument-track-unique-users). If the device ID or user ID used to fetch and evaluate assignments differs from the device ID and user ID used to track the exposure event, you can see variant jumping, SRMs, and inconsistent or unexpected bucketing behavior.
For example, you might send events through a proxy or CDP that masks IDs before sending to Amplitude. In this case, the identity used to fetch variants differs from the identity included in the exposure events.
Another common cause is a simple implementation error. For example, the following cases have caused variant jumping:
* Additional characters in the ID. Note the extra quotes around the actual identity:
* `15a4f7e9-db4e-4c57-82c7-e57a2995803a`
* `"15a4f7e9-db4e-4c57-82c7-e57a2995803a"`
* Inconsistent capitalization, especially with UUIDs:
* `15a4f7e9-db4e-4c57-82c7-e57a2995803a`
* `15A4F7E9-DB4E-4C57-82C7-E57A2995803A`
## Remove users who variant jumped from experiment analysis
As you analyze results, be careful when you remove data, because removing data can introduce bias. It's better to understand the cause of variant jumping and fix any implementation bugs to prevent recurrence in future experiments. If removing users who jumped variants is the best course of action, use the Filter card on the Experiment Analysis tab. If the `All exposed users` segment is enabled by default, click it and select *Experiment Segments > Exclude users who variant jumped*.
================================================================================
# Debug metric spikes and dips
URL: https://amplitude.com/docs/feature-experiment/troubleshooting/debug-metric-spikes-dips
================================================================================
# Debug metric spikes and dips
When you notice unexpected spikes or dips in experiment metrics, identify what changed and determine if the data is trustworthy. This guide provides systematic approaches to debug these anomalies.
## Check cumulative exposures for traffic changes
Examine the cumulative exposures chart in your experiment dashboard. The chart shows exposure patterns over time and highlights data quality issues.
Orange dots on the cumulative exposures chart mark detected anomalies in exposure traffic. Orange dots can signal:
- Sudden increases or decreases in exposure counts.
- Changes to experiment configuration.
- Instrumentation or tracking issues.
Data quality check failures appear when traffic to the experiment drops significantly. Review these warnings to determine if the spike or dip relates to exposure problems rather than metric changes.
For more details, refer to [Interpret the cumulative exposures graph](https://amplitude.com/docs/feature-experiment/advanced-techniques/cumulative-exposure-inflection-points).
## Review experiment configuration changes
Check if the experiment's percentage rollout or traffic allocation increased during the period when you noticed the metric spike or dip.
To review recent changes:
1. Go to the experiments or flags table on your Amplitude homepage.
2. Sort by *Last Modified* to see which experiments changed recently.
3. Check the experiment's configuration history to identify what changed and when.
Use the [Experiment Management API](https://amplitude.com/docs/apis/experiment/experiment-management-api-version-endpoints) or [Slack Notifications](https://amplitude.com/docs/feature-experiment/notifications) to retrieve versions of flag configurations during a specific time period. Compare configurations to identify changes that might explain the metric spike or dip.
## Check for releases and deployments
Review whether any code releases, app version updates, or feature deployments occurred during the time window of the metric change.
Releases and annotations in your dashboard help identify temporal correlations between deployments and metric changes. If you haven't added annotations yet, add them after you identify the cause to document the incident.
## Segment by platform and version
Metric spikes or dips often affect specific platforms or app versions rather than all users. Group your analysis by these default user properties:
- App version: New app releases can introduce bugs or behavioral changes.
- OS version: Operating system updates can affect app performance.
- Platform: Issues might only affect iOS, Android, or web users.
- Device type: Specific device models or screen sizes might behave differently.
Amplitude SDKs track these properties automatically, making them reliable dimensions for debugging. Refer to [user properties](https://amplitude.com/docs/data/user-properties-and-events#user-properties) for more information.
To analyze by these dimensions:
1. In your experiment results, add a group-by clause for the relevant property.
2. Look for spikes or dips that affect only specific segments.
3. Investigate what's unique about the affected segment.
## Identify and filter outliers
Outlier users or data quality issues cause some metric spikes:
### Bot traffic
Automated bot traffic can skew metrics significantly. Amplitude provides several ways to handle bots:
- Use [bot traffic blocking](https://amplitude.com/docs/data/block-bot-traffic) to filter known bots automatically.
- Configure [block filters and drop filters](https://amplitude.com/docs/data/troubleshooting/instrumentation-issues#block-and-filter-internal-users) to exclude specific traffic patterns.
### Instrumentation issues
Rapid-fire events from a single user can indicate instrumentation bugs:
- Components that re-render frequently might send events on each render.
- Events might need debouncing to prevent duplicate tracking.
- Event handlers might fire multiple times unintentionally.
Use the [frequency chart](https://amplitude.com/docs/feature-experiment/advanced-techniques/winsorization-in-experiment#filtering-out-users) to identify users with unusually high event counts. Investigate these outliers, which can distort your metrics.
To filter outliers from your analysis:
1. Create a frequency distribution of your metric.
2. Identify users with extreme values.
3. Investigate whether these users represent genuine behavior or data quality issues.
4. Apply filters to exclude confirmed outliers from your experiment results.
## Analyze exposure events by flag key
Create an event segmentation chart to identify spikes in exposure events for specific flag keys:
1. Go to *Analytics > Event Segmentation*.
2. Select the `[Experiment] Exposure` event.
3. Group by the `flag_key` property.
4. Sort by *Row Change* to see which flags had the largest exposure changes.
This analysis can reveal if a specific experiment suddenly received more traffic, which might explain metric changes.
## Use Root Cause Analysis
Root Cause Analysis identifies which user segments contributed most to a metric change. You can't filter exclusively by experiment properties, but you can:
1. Go to the metric that showed a spike or dip.
2. Use Root Cause Analysis to identify contributing factors.
3. Look for patterns in user properties, behaviors, or segments.
## Resolve and prevent recurrence
After identifying the cause of a metric spike or dip:
1. Document your findings with annotations in your dashboard.
2. If a bug caused the issue, fix the instrumentation.
3. If bots or outliers caused the issue, configure filters to prevent future occurrences.
4. If a configuration change caused the issue, restart the experiment with stable settings.
5. Review [sample ratio mismatch troubleshooting](https://amplitude.com/docs/feature-experiment/troubleshooting/sample-ratio-mismatch) if the spike or dip correlates with exposure distribution changes.
================================================================================
# Configure your experiment
URL: https://amplitude.com/docs/feature-experiment/workflow/configure
================================================================================
# Configure your experiment
Configuring Feature Experiment is a two-stage process:
- Create a deployment.
- Install the SDK you want to use.
Configuring Experiment isn't the same as [creating an experiment](https://amplitude.com/docs/feature-experiment/workflow/create). Configure Experiment and confirm it's working before you create any experiments. This page covers Feature Experiment. To configure Web Experiment, go to [Implement Web Experiment](https://amplitude.com/docs/web-experiment/implementation).
## Create a deployment
In Experiment, a deployment serves a group of flags or experiments for code execution. After you create a deployment, Experiment generates an access key that routes your flags and experiments.
Deployments live under Amplitude Analytics projects. A project can have multiple deployments, but each deployment attaches to a single project.
To create a deployment, follow these steps:
1. Go to *Experiment > Deployments*, then click **Create Deployment**.
2. Choose the Amplitude Analytics project to associate with the deployment. To create deployments in multiple projects, select all the relevant projects from the drop-down list.
3. Enter a descriptive name for your deployment.
4. Specify its type:
- **Client-side**: These deployments run on a client device, such as a web browser or mobile app. The deployment key for client deployments is publicly viewable and works with client-side SDKs.
- **Server-side**: These deployments run on a server you control, such as a web server or batch processing system. Keep the deployment key for server deployments secret and use it with server-side SDKs. Server-side keys can access the REST API for flag evaluation. If you only need to evaluate flags through the REST API rather than run a full experiment, create a server-side deployment.
5. Click **Create a Deployment**. Experiment creates your deployment and generates keys to copy and use.
### Deployment keys
Each deployment generates a unique key that ensures data integrity. The key associates all data your experiment collects with that deployment, which keeps results and analytics accurate. For more information about keys, go to [Keys and Tokens](https://amplitude.com/docs/apis/keys-and-tokens#keys-overview).
- **Client-side keys**: The deployment key for client deployments is publicly viewable.
- **Server-side keys**: Keep the deployment key for server deployments secret and use it only with server-side SDKs. Server-side keys access the API for flag evaluation.
## Install the SDK
If you don't use the API, install an [Experiment SDK](https://amplitude.com/docs/sdks/experiment-sdks) next. All SDKs send a request to Amplitude Experiment to determine what flag configurations to serve a user. Note the following differences between client-side and server-side SDKs.
{% callout type="warning" heading="" %}
Engineers should install SDKs. Otherwise, you risk issues with your data repositories.
{% /callout %}
**Client-side** SDKs run in the end-user application deployment. Client-side SDKs:
- Assume a single-user deployment.
- Use client-side deployment keys, which are public and visible to end users.
- Fetch variants up front for a given user.
- Store variants locally on the client for offline mode.
**Server-side** SDKs run in a server deployment. Server-side SDKs:
- Assume a multi-user deployment.
- Use server-side deployment keys, which you should keep private.
- Fetch variants on each request.
## The user context
When assigning variants, the evaluation engine applies targeting rules to a user context object, which represents an individual user's identity. In client-side SDKs, the SDK sets this object on initialization and passes it to the server on every variant request. In server-side SDKs, the user may change, and the SDK sets the user on every request.
When targeting individual users to assign variants, Experiment matches on any of the listed user identifiers, such as `user_id` and `device_id`. With rule-based user segments, users match on any predefined property (country, platform, and so on) or on custom properties in the `user_properties` object. Read more about [defining experiment users](https://amplitude.com/docs/feature-experiment/data-model#users).
{% callout type="note" %}
Use the same user identifiers for Amplitude Experiment that you use to send data to Analytics. This way, identities resolve correctly and Analytics associates generated data with the same user.
{% /callout %}
================================================================================
# Event tracking
URL: https://amplitude.com/docs/feature-experiment/under-the-hood/event-tracking
Updated: 2026-04-13
================================================================================
# Event tracking
Experiment's end-to-end platform relies on two events:
* [Assignment events](#assignment-events): convert users into registered participants.
* [Exposure events](#exposure-events): indicate when a user experiences an experiment variant.
These two events, along with an [experiment user property](#experiment-user-properties) for each experiment, power experiment analysis, monitoring, and debugging.
Use the Amplitude-defined exposure or assignment events as your experiment's exposure event so Amplitude sets the correct [experiment user property](#experiment-user-properties) when it ingests the exposure. Amplitude might ingest custom exposure events before setting the experiment user property, so those events don't count in experiment analysis.
* **Assignment**:
* Experiment tracks an assignment event when it assigns a user through remote evaluation (`fetch()`) or server-side local evaluation (`evaluate()`).
* Contains assignment information for one or more flags and experiments.
* Useful for monitoring and debugging, or as an exposure heuristic for server-side experiments.
* **Exposure**:
* Experiment tracks an exposure event when a user encounters a variant. Typically on the client side when code accesses a variant from the SDK (`variant()`).
* Contains exposure information for a single flag or experiment.
* Acts as the exposure event for client-side experiments.
* Sets the experiment user property for the exposed flag or experiment.
{% callout type="note" heading="Event volume billing and property limits" %}
Exposure (`[Experiment] Exposure`) and assignment (`[Experiment] Assignment`) events don't count toward your organization's event volume or Monthly Tracked Users (MTU).
If you use other events in place of `[Experiment] Exposure` or `[Experiment] Assignment`, those events do count toward your event volume and MTU.
{% /callout %}
## Experiment user properties
Experiment uses a user property for each flag and experiment, and exposure events set or unset this property. The user property lets Experiment determine which variant the user is in for experiment analysis. Amplitude supports up to 1500 experiment user properties for each project.
The user property format is `[Experiment] <flag_key>`, and the value is the variant key Experiment assigned or exposed the user to. Use this user property in queries for non-experiment events that occur after Experiment sets the property to segment by flag or experiment variant.
## Assignment events
Amplitude's evaluation servers or SDKs track assignment events through [remote evaluation](https://amplitude.com/docs/feature-experiment/remote-evaluation) or [local evaluation](https://amplitude.com/docs/feature-experiment/local-evaluation) using a server-side SDK configured for [automatic assignment tracking](#automatic-assignment-tracking). Use assignment events as a heuristic exposure event for server-side experiments, to monitor an active flag or experiment, and to debug issues. For server-side experiments where client-side exposure tracking isn't possible, choose the Amplitude Assignment event as the exposure event when you configure your experiment.
You shouldn't need to track assignment events manually.
### Assignment event definition
The assignment event, `[Experiment] Assignment`, contains an event property, `[Experiment] <flag_key>.variant`, for each evaluated flag or experiment. The property value is the assigned variant key, or `off` when Experiment assigns no variant.
The assignment event also contains properties such as `[Experiment] Environment Name` and `[Experiment] <flag_key>.details`, which support internal debugging.
{% callout type="example" heading="Example event JSON" %}
This example shows an assignment event for user `123456789`, evaluated for one flag `my-flag` and one experiment `my-experiment`.
```json
{
"user_id": "123456789",
"event_type": "[Experiment] Assignment",
"event_properties": {
"[Experiment] my-flag.variant": "off",
"[Experiment] my-experiment.variant": "treatment"
}
}
```
{% /callout %}
### Automatic assignment tracking
Experiment supports automatic assignment tracking for [remote evaluation](https://amplitude.com/docs/feature-experiment/remote-evaluation) by default. Remote evaluation requests that miss the CDN cache and contain a valid user or device ID trigger an asynchronous assignment event after evaluation.
For server-side [local evaluation](https://amplitude.com/docs/feature-experiment/local-evaluation), configure the local evaluation SDK on initialization to track assignment events on `evaluate()`. Amplitude deduplicates assignment events from server-side local evaluation SDKs for each user using an `insert_id` that contains the user ID, device ID, a hash of the canonicalized list of assigned flags and variants, and the date stamp.
Expect one assignment per evaluated user, per unique evaluation result, per day.
| SDK | Minimum version |
| --- | --- |
| [Node.js](https://amplitude.com/docs/sdks/experiment-sdks/experiment-node-js) | `1.7.4+` |
| [Ruby](https://amplitude.com/docs/sdks/experiment-sdks/experiment-ruby) | `1.2.2+` |
| [JVM](https://amplitude.com/docs/sdks/experiment-sdks/experiment-jvm) | `1.2.1+` |
| [Go](https://amplitude.com/docs/sdks/experiment-sdks/experiment-go) | `1.2.2+` |
| [Python](https://amplitude.com/docs/sdks/experiment-sdks/experiment-python) | `1.2.3+` |
## Exposure events
An exposure event is a [strictly defined](#exposure-event-definition) analytics event that tells Experiment a user encountered a variant of an [experiment or feature flag](https://amplitude.com/docs/feature-experiment/data-model#flags-and-experiments). Exposure events carry the flag key and the variant the user encountered in the event's properties.
When Amplitude ingests an exposure event, it uses the flag key and variant to set or unset user properties on the associated user. These user properties power experiment analysis queries on primary and secondary success metrics.
### Exposure event definition
You can send the exposure event through any analytics implementation or customer data platform without manipulating user properties.
| Event type | Event property | Requirement | Description |
| --- | --- | --- | --- |
| **`$exposure`** | `flag_key` | Required | The flag or experiment key the user encounters. |
| | `variant` | Optional | The variant of the flag or experiment the user encounters. If `null` or missing, Amplitude unsets the user property for the flag or experiment, and the user is no longer part of the experiment. |
| | `experiment_key` | Optional | The key of the experiment the user encounters. The experiment key differentiates between two [runs of an experiment on the same flag key](https://amplitude.com/docs/feature-experiment/troubleshooting/new-experiment-run). |
{% callout type="example" heading="Example event JSON" %}
This example shows an exposure event for user `123456789`, who encountered the `treatment` variant of the experiment `my-experiment`.
```json
{
"user_id": "123456789",
"event_type": "$exposure",
"event_properties": {
"flag_key": "my-experiment",
"variant": "treatment"
}
}
```
{% /callout %}
#### Exposure transformation
When Amplitude ingests an `$exposure` event, Amplitude transforms it. Amplitude renames the event type and event properties for consistency with other Amplitude properties, then sets or unsets [experiment user properties](#experiment-user-properties) for accurate experiment analysis.
| Property type | Pre-transformation | Post-transformation |
| --- | --- | --- |
| Event type | `$exposure` | `[Experiment] Exposure` |
| Event property | `flag_key` | `[Experiment] Flag Key` |
| Event property | `variant` | `[Experiment] Variant` |
| Event property | `experiment_key` | `[Experiment] Experiment Key` |
### Automatic exposure tracking
Client-side Experiment SDKs support automatic exposure tracking through an exposure tracking provider implementation. Without an integration or custom implementation, Experiment doesn't track exposure events automatically.
| SDK integrations | Minimum version |
| --- | --- |
| [JavaScript SDK](https://amplitude.com/docs/sdks/experiment-sdks/experiment-javascript#integrations) | `1.4.1+` |
| [Android SDK](https://amplitude.com/docs/sdks/experiment-sdks/experiment-android#integrations) | `1.5.1+` |
| [iOS SDK](https://amplitude.com/docs/sdks/experiment-sdks/experiment-ios#integrations) | `1.6.0+` |
| [React Native](https://amplitude.com/docs/sdks/experiment-sdks/experiment-react-native#integrations) | `0.6.0+` |
### Exposure tracking example
{% api-tester type="exposure-tracking" / %}
### Proxy exposure events
A proxy exposure event is a normal analytics event you select to model traffic and baseline conversion before an experiment runs. Proxy exposure events power the duration estimator and related calculations. Proxy exposure events aren't the same as the actual exposure or assignment events Amplitude uses during analysis after an experiment goes live.
Choose a proxy exposure event that best represents when a user might encounter your experiment experience. Amplitude uses historical traffic to estimate experiment duration and set baselines when the flag is inactive. The [duration estimator](https://amplitude.com/docs/feature-experiment/workflow/experiment-estimate-duration) relies on the proxy exposure event's recent traffic. Amplitude computes the "control mean" baseline from users who completed the proxy exposure event during the seven days before the experiment starts.
The activity log records proxy exposure changes, so configuration changes appear in the flag history.
Amplitude stores proxy exposure events in analysis parameters as a single `ExposureEvent`-shaped object, distinct from the array of actual exposure events.
{% callout type="tip" heading="Proxy events with Experiment SDK" %}
If you use Experiment SDKs and call `.variant()` or configure the ExposureTrackingProvider, Amplitude can automatically track exposure events. Alternatively, call `exposure()` to explicitly log exposures using the cached variant. Calling `exposure()` doesn't automatically create or set the proxy exposure. You must select a normal analytics event as your proxy.
{% /callout %}
================================================================================
# Experiment Evaluation
URL: https://amplitude.com/docs/feature-experiment/implementation
================================================================================
# Experiment Evaluation
Evaluation determines which [variant](https://amplitude.com/docs/feature-experiment/data-model#variants), if any, a user receives given a flag configuration. Evaluation takes a [user](https://amplitude.com/docs/feature-experiment/data-model#users) and a [flag](https://amplitude.com/docs/feature-experiment/data-model#flags-and-experiments) configuration as inputs and outputs a variant.

## Pre-targeting
Pre-targeting steps can determine the evaluated variant before targeting segments run.
### Activation
A flag is either active or inactive. Inactive flags never return a variant from evaluation.
{% callout type="note" heading="Best practice" %}
For on/off flags, Amplitude recommends setting the [all users segment](#all-users-segment) allocation to 100% or 0% rather than using the Activate/Deactivate flag button to control traffic. Use the Activate/Deactivate button to remove flags after a feature fully launches, or after you remove the flag's instrumentation.
{% /callout %}
### Flag dependencies
A flag can define a [dependency](https://amplitude.com/docs/feature-experiment/under-the-hood/flag-dependencies) on another flag's evaluation. If the dependency isn't met, no variant returns. Otherwise, evaluation continues. Flag dependencies implement [mutual exclusion groups](https://amplitude.com/docs/feature-experiment/under-the-hood/flag-dependencies#mutual-exclusion-groups) and [holdout groups](https://amplitude.com/docs/feature-experiment/under-the-hood/flag-dependencies#holdout-groups).
{% callout type="example" heading="" %}
For example, Flag-2 can define a dependency on Flag-1 evaluating to the variant `on`.
* Flag-1 (50% `on`).
* Flag-2 (50% `control`, 50% `treatment`).
* Depends on Flag-1=`on`.
The dependency ensures Amplitude always evaluates Flag-1 before Flag-2. If Flag-1 evaluates to `on`, Amplitude fully evaluates Flag-2. If Flag-1 doesn't evaluate to a variant, or evaluates to a variant other than `on`, Flag-2 fails the dependency check and Amplitude assigns no variant. This prevents edge cases where the dependency checks get skipped or return undefined results. The dependency also keeps exposure events and audit trails consistent.
In this example, Amplitude assigns a Flag-2 variant to 50% of evaluated users.
{% /callout %}
### Individual inclusions
Inclusions force-bucket specific users (identified by user ID or device ID) into a variant. Inclusions primarily support development.
For example, if you're developing a new multivariate feature and want to test each variant in your application, add your user or device ID to the **Inclusions** section of your experiment and refresh the application.
### Sticky bucketing
{% callout type="warning" heading="" %}
Use sticky bucketing with care. Even with sticky bucketing disabled, [consistent bucketing](#consistent-bucketing) places users in the same variant when the user and targeting rules don't change. Changing targeting rules on an active flag with sticky bucketing enabled can cause a [sample ratio mismatch (SRM)](https://amplitude.com/docs/feature-experiment/troubleshooting/sample-ratio-mismatch), which can skew experiment results.
{% /callout %}
When you enable sticky bucketing, Amplitude always evaluates a user to the same previously bucketed variant, regardless of current targeting. Sticky bucketing doesn't apply if Amplitude hasn't yet bucketed the user into a variant.
Go to [Sticky Bucketing](https://amplitude.com/docs/feature-experiment/advanced-techniques/sticky-bucketing) for more information.
## Targeting segments
{% callout type="warning" heading="" %}
Adding a target segment without defining any rules (where clauses) captures all users, even though the estimates show 0 users.
{% /callout %}
A [flag or experiment](https://amplitude.com/docs/feature-experiment/data-model#flags-and-experiments) can have `0-n` targeting segments. Amplitude evaluates targeting segments from top to bottom. If a user matches the segment targeting rule, [consistent bucketing](#consistent-bucketing) determines which variant, if any, the user receives, based on the configured allocation percentage and variant distribution weights.
## All users segment
The all users segment captures all users who don't match a [targeting segment](#targeting-segments) (if any). [Consistent bucketing](#consistent-bucketing) assigns users to a variant (or no variant) based on the configured allocation percentage and variant distribution weights.
## Consistent bucketing
Amplitude Experiment's bucketing is consistent based on the user, bucketing key, bucketing salt, allocation percentage, and variant weights. Given the same inputs, the output remains constant.
| Input | Description |
| --- | --- |
| Bucketing Key | The key that determines which user property value to use as the bucketing value. Amplitude uses the bucketing value as input to the [hashing](#hashing) function. By default, the bucketing key buckets by User ID. |
| Bucketing Salt | A string concatenated to the bucketing value before [hashing](#hashing). Amplitude randomly generates the bucketing salt when you create the flag or experiment, and uses it indefinitely unless you update it. |
| Allocation | The percentage of users in the segment who should receive a variant. Used in the [allocation bucketing](#allocation-bucketing) step. |
| Variant Weights | A weight for each variant. Applied only to the percentage included by the allocation percentage. Used in the [variant bucketing](#variant-bucketing) step. |
The bucketing logic splits into two steps. [Allocation bucketing](#allocation-bucketing) determines whether the user receives a variant based on the allocation percentage. [Variant bucketing](#variant-bucketing) runs only if allocation bucketing assigned the user. Both steps use the same consistent hash function in slightly different ways.
The bucketing salt makes experiment allocation statistically independent. Without the salt, any user Amplitude allocates to the treatment would get the treatment in every experiment.
Update the bucketing salt in two cases:
1. To re-randomize users because of a bug or other issue in your experiment. Update the salt to a new random string.
2. To make the evaluation of two experiments match. Update the salt to the same value in both projects.
### Hashing
Amplitude Experiment's consistent bucketing uses the [`murmur3`](https://en.wikipedia.org/wiki/MurmurHash) consistent hashing algorithm on the value of the bucketing key for the given segment. If the bucketing salt or the bucketing value changes, the hash output changes and the user may [variant jump](https://amplitude.com/docs/feature-experiment/troubleshooting/variant-jumping).
```text
murmur3_x86_32("bucketing_salt/bucketing_value")
```
### Allocation bucketing
A user is allocated when the [hash](#hashing) value modulo 100 is less than the allocation configured in the segment.
```text
murmur3_x86_32("bucketing_salt/bucketing_value") % 100
```
### Variant bucketing
After allocation, variant bucketing determines which variant the user receives. Amplitude associates variants with values between 0 and 42949672, based on their weights.
```text
floor(murmur3_x86_32("bucketing_salt/bucketing_value") / 100)
```
For example, if variant `A` has weight 1 and variant `B` has weight 1, Amplitude associates variant `A` with values in the interval `[0, 21474835]` and variant `B` with values in the interval `[21474836, 42949672]`.
================================================================================
# Local evaluation
URL: https://amplitude.com/docs/feature-experiment/local-evaluation
================================================================================
# Local evaluation
Local evaluation runs [evaluation logic](https://amplitude.com/docs/feature-experiment/implementation) in the SDK. This approach avoids the network request that remote evaluation makes for each user. Amplitude engineers [sub-millisecond evaluation](https://amplitude.com/docs/feature-experiment/under-the-hood/performance-and-caching) for latency-sensitive systems that need to perform at scale.
## Targeting capabilities
Local evaluation happens outside of Amplitude, so it doesn't support advanced targeting and identity resolution from Amplitude Analytics. Local evaluation does support consistent bucketing with target segments, which is often enough.
{% callout type="warning" heading="Client-side local evaluation" %}
Client-side local evaluation includes all targeting data in the flag configuration that loads on the client. For example, if you target a specific user by their email, all clients can see that email, regardless of user.
{% /callout %}
| Feature | Remote evaluation | Local evaluation |
| --- | --- | --- |
| [Consistent bucketing](https://amplitude.com/docs/feature-experiment/implementation#consistent-bucketing) | ✅ | ✅ |
| [Individual inclusions](https://amplitude.com/docs/feature-experiment/implementation#individual-inclusions) | ✅ | ✅ |
| [Targeting segments](https://amplitude.com/docs/feature-experiment/implementation#targeting-segments) | ✅ | ✅ |
| [Amplitude ID resolution](https://amplitude.com/docs/feature-experiment/remote-evaluation#amplitude-id-resolution) | ✅ | ❌ |
| [User enrichment](https://amplitude.com/docs/feature-experiment/remote-evaluation#user-enrichment) | ✅ | ❌ |
| [Sticky bucketing](https://amplitude.com/docs/feature-experiment/implementation#sticky-bucketing) | ✅ | ❌ |
### Cohort targeting
Server-side SDKs can target cohorts when you configure them to do so. Local evaluation cohorts can target only User IDs.
| SDK | Cohort targeting | Version |
| --- | :---: | --- |
| [Node.js](https://amplitude.com/docs/sdks/experiment-sdks/experiment-node-js) | ✅ | `1.10.0+` |
| [Ruby](https://amplitude.com/docs/sdks/experiment-sdks/experiment-ruby) | ✅ | `1.5.0+` |
| [JVM](https://amplitude.com/docs/sdks/experiment-sdks/experiment-jvm) | ✅ | `1.4.0+` |
| [Go](https://amplitude.com/docs/sdks/experiment-sdks/experiment-go) | ✅ | `1.6.0+` |
| [Python](https://amplitude.com/docs/sdks/experiment-sdks/experiment-python) | ✅ | `1.4.0+` |
| [PHP](https://amplitude.com/docs/sdks/experiment-sdks/experiment-php) | ❌ | N/A |
## Implementation
Local evaluation is [evaluation](https://amplitude.com/docs/feature-experiment/implementation). It's a function that takes a [user](https://amplitude.com/docs/feature-experiment/data-model#users) and a [flag](https://amplitude.com/docs/feature-experiment/data-model#flags-and-experiments) as input and outputs a [variant](https://amplitude.com/docs/feature-experiment/data-model#variants).

On startup, the SDK loads flag configuration updates from the server and stores them in memory for access before each evaluation. After startup, the SDK polls the server for flag configuration updates.
{% callout type="tip" heading="Edge evaluation" %}
The local evaluation Node.js SDK can run in edge workers or functions that support JavaScript and a distributed store. Contact your representative or email [experiment@amplitude.com](mailto:experiment@amplitude.com) to learn more.
{% /callout %}
### Exposure and assignment tracking
Local evaluation tracks assignment differently than [remote evaluation](https://amplitude.com/docs/feature-experiment/remote-evaluation), which automatically tracks exposure events. With local evaluation:
- Client-side SDKs automatically track an [exposure event](https://amplitude.com/docs/feature-experiment/under-the-hood/event-tracking#exposure-events) when your code accesses a variant from a client-side [Experiment SDK](https://amplitude.com/docs/sdks/experiment-sdks).
- Server-side SDKs track an [assignment event](https://amplitude.com/docs/feature-experiment/under-the-hood/event-tracking#automatic-assignment-tracking) when the SDK evaluates a user, if you configure the SDK to do so. Server-side SDKs don't track exposure automatically, so you must track exposure separately if you need it.
For server-side local evaluation experiments, use the assignment event as the exposure event in your experiment analysis.
### Performance
The following results reflect a single flag evaluation. Amplitude collected them over 10 executions of 10,000 evaluation iterations. Each iteration used randomized user inputs against 1 flag configuration, selected at random from 3 possible configurations.
| SDK | Average | Median | Cold start |
| --- | --- | --- | --- |
| [Node.js](https://amplitude.com/docs/sdks/experiment-sdks/experiment-node-js) | 0.025ms | 0.018ms | 3ms |
| [Go](https://amplitude.com/docs/sdks/experiment-sdks/experiment-go) | 0.098ms | 0.071ms | 0.7ms |
| [JVM](https://amplitude.com/docs/sdks/experiment-sdks/experiment-jvm) | 0.007ms | 0.005ms | 6ms |
================================================================================
# Remote evaluation
URL: https://amplitude.com/docs/feature-experiment/remote-evaluation
================================================================================
# Remote evaluation
Remote evaluation sends a request to Amplitude Experiment's evaluation servers to fetch variants for a [user](https://amplitude.com/docs/feature-experiment/data-model#users). Remote evaluation is the default way to evaluate users in client-side apps, and also works from a server-side environment.
*Client-side*

*Server-side*

## Targeting capabilities
Remote evaluation targeting and identity resolution both use Amplitude Analytics' historical user data. Remote evaluation enables advanced features such as [Amplitude ID resolution](#amplitude-id-resolution), [IP geolocation](#geolocation), [property canonicalization](#canonicalization), [targeting behavioral cohorts](#cohort-membership), and historical [user properties](#user-properties).
| Feature | Remote Evaluation | [Local Evaluation](https://amplitude.com/docs/feature-experiment/local-evaluation) |
| --- | --- | --- |
| [Consistent bucketing](https://amplitude.com/docs/feature-experiment/implementation#consistent-bucketing) | ✅ | ✅ |
| [Individual inclusions](https://amplitude.com/docs/feature-experiment/implementation#individual-inclusions) | ✅ | ✅ |
| [Targeting segments](https://amplitude.com/docs/feature-experiment/implementation#targeting-segments) | ✅ | ✅ |
| [Amplitude ID resolution](#amplitude-id-resolution) | ✅ | ❌ |
| [User enrichment](#user-enrichment) | ✅ | ❌ |
| [Transformed properties](#transformed-properties) | ✅ | ❌ |
| [Sticky bucketing](https://amplitude.com/docs/feature-experiment/implementation#sticky-bucketing) | ✅ | ❌ |
## Implementation
Remote evaluation resolves the user within Amplitude and appends additional information to the user before passing the enriched user to the [evaluation implementation](https://amplitude.com/docs/feature-experiment/implementation).

### Amplitude ID resolution
Amplitude ID resolution happens before additional [user enrichment](#user-enrichment), and Experiment requires it when [bucketing](https://amplitude.com/docs/feature-experiment/implementation#consistent-bucketing) by Amplitude ID.
[Learn more about Amplitude's advanced identity resolution.](https://amplitude.com/docs/data/sources/instrument-track-unique-users)
### User enrichment
#### Geolocation
If you use location-based targeting in your flags, remote evaluation resolves location from the client's IP and uses a canonical `Country` user property to keep targeting consistent.
Remote evaluation resolves the following fields with IP geolocation:
* Country
* City
* Region
* DMA
#### Canonicalization
Remote evaluation canonicalizes inputs so you can segment users by platform, OS, language, or country even when devices report slightly different values. Canonicalization transforms known device, language, and country inputs into canonical values that stay consistent across clients.
Remote evaluation canonicalizes the following fields:
* Platform
* Device Family
* Device Type
* Language
* Country
#### User properties
{% callout type="warning" heading="Race conditions" %}
Targeting a recently set user property can cause a race between Amplitude Analytics applying the user property and Experiment accessing it. To avoid this race, set the user property explicitly in the remote fetch request.
When you pass user properties to the remote fetch request, those user properties don't update on associated analytics events.
{% /callout %}
The [resolved Amplitude ID](#amplitude-id-resolution) accesses the user's current user properties from historical analytics data. Amplitude merges these properties with any user properties sent explicitly in the fetch request, then passes the merged set to [evaluation](https://amplitude.com/docs/feature-experiment/implementation).
{% callout type="info" heading="User property merge priority" %}
Amplitude prioritizes user properties sent explicitly in a remote fetch request over user properties accessed from analytics.
{% /callout %}
#### First Seen
Remote evaluation enriches users with a built-in `First Seen` user property from the Amplitude ID table. The value is the timestamp when Amplitude first saw the user, in epoch milliseconds UTC.
Use `First Seen` to target new users without creating or syncing behavioral cohorts. Compare the property against a timestamp to define windows such as users who joined in the last 7 or 30 days.
{% callout type="warning" heading="First-session timing" %}
During a user's first session, `First Seen` may not be available yet for targeting. Avoid relying on `First Seen` for flags or experiments that must evaluate on the very first page load or event in a new user's session.
{% /callout %}
#### Cohort membership
Remote evaluation gets the user's cohort membership from analytics, which enables cohort targeting in [targeting segments](https://amplitude.com/docs/feature-experiment/implementation#targeting-segments).
{% callout type="warning" heading="Hourly cohort sync" %}
Dynamic cohorts sync hourly. Use cohort targeting only when bucketing isn't time-sensitive. For time-sensitive targeting, pass user properties explicitly to the remote fetch request.
{% /callout %}
#### Transformed properties
Remote evaluation applies your project's [transformation configuration](https://amplitude.com/docs/data/transformations) to user properties before evaluating targeting rules. Amplitude fetches the transformation config, applies the configured merge and rename rules, then evaluates targeting against the transformed values. The transformed values match what Analytics uses in charts and cohorts.
The Target Segment property picker surfaces transformed user properties alongside standard user properties. You can build targeting rules on the same canonical values your analytics already use.
{% callout type="note" heading="Consistency with Analytics" %}
Targeting on transformed properties ensures your experiment and feature flag segments match the same population in Analytics charts and cohorts, because both use the same transformation rules.
{% /callout %}
================================================================================
# Sticky bucketing
URL: https://amplitude.com/docs/feature-experiment/advanced-techniques/sticky-bucketing
================================================================================
# Sticky bucketing
Sticky bucketing checks whether a user already experienced a variant of your experiment. If so, Experiment assigns the current value of the user property (the last variant the user saw) to the user. Sticky bucketing keeps users in their original variants unless you change the parameters of the experiment.
Sticky bucketing often defends against [variant jumping](https://amplitude.com/docs/feature-experiment/troubleshooting/variant-jumping), which occurs when a user experiences two or more variants for a single flag or experiment. Enabling sticky bucketing doesn't guarantee that users never experience variant jumping. Variant jumping can occur if your experiment includes both a logged-out and a logged-in experience, because a user can have different logged-in and logged-out Amplitude IDs.
{% callout type="note" %}
Sticky bucketing is only available for Feature experiments and flags, not Web experiments.
{% /callout %}
{% callout type="note" %}
Amplitude Experiment uses [consistent bucketing](https://amplitude.com/docs/feature-experiment/implementation#consistent-bucketing) and a [deterministic hashing algorithm](https://amplitude.com/docs/feature-experiment/implementation#hashing), which keeps users in their original variants as long as you don't change anything.
{% /callout %}
## How sticky bucketing works
To turn sticky bucketing on or off, open your experiment, click the **pencil** icon, and go to *Advanced (Optional) > Bucketing Options*.
When you enable sticky bucketing, Experiment checks whether a user already has a value for the user property associated with the experiment. If so, Experiment assigns the user the current value of the user property (the last variant the user saw). Otherwise, Experiment re-evaluates the user.
{% callout type="note" %}
If two or more experiment assignments occur within a few seconds of each other, Amplitude Experiment may not have time to apply sticky bucketing.
{% /callout %}
Amplitude doesn't sticky bucket users to the Off variant. For more about evaluation and exposure, refer to the [evaluation flow chart](https://amplitude.com/docs/feature-experiment/advanced-techniques/cumulative-exposure-change-slope) and [local evaluation targeting capabilities](https://amplitude.com/docs/feature-experiment/local-evaluation#targeting-capabilities).
## When to use sticky bucketing, and when not to
This section provides examples of when to enable sticky bucketing versus when not to. This list isn't exhaustive. In some cases, results stay the same whether sticky bucketing is on or off. An example is an experiment that targets everyone who views your home page, where you don't change any experiment controls while the experiment runs.
{% callout type="note" %}
If you target a dynamic cohort, users can flow in and out of the cohort. Users can experience "treatment" and then "off" if you don't enable sticky bucketing.
{% /callout %}
### When to enable sticky bucketing
* You want to **give the user a consistent experience**, even if the user property you target changes. For example, if you run an experiment only in the United States, sticky bucketing ensures users keep the same variant if they travel outside the country.
* You want to **decrease the percentage rollout** of an experiment where the treatment group isn't performing well, but you don't want to move users from treatment or control to the group that never saw either variant (the 'Off' variant). Sticky bucketing keeps users in their assigned groups even after you change the percentage rollout. Increasing or decreasing percentage rollout doesn't cause users to move between treatment and control.
* You want to **target users for a specified duration** (for example, two weeks) and then stop targeting new users, while maintaining the original assignments for any users Amplitude already bucketed. You might do this to study the long-term effects of a particular treatment on user behavior, or if you aren't sure about the quality of one or more of the experiment's treatments. Enable sticky bucketing at the beginning of the experiment, with a 50/50 split. After the duration passes, change the rollout percentage to zero.
* You want to sunset a failed experiment, but ensure users already bucketed into an experience still get that experience. Enable sticky bucketing and set the rollout percentages to zero.
### When not to enable sticky bucketing
* You want the **user's experience to change** as the targeted user property changes. To continue the previous example, if you run an experiment in the United States, you may not want users to have the same experience when they travel abroad.
* Your experiment drives free users to become paid users and relies on earning rewards. After these users convert, you no longer need to offer a reward. If you enable sticky bucketing here, those users keep the free experience even after upgrading to paid.
* You want to enforce a "cool down" period between giving discounts. To limit discounts to one every seven days per user, add a seven-day filter to the targeting criteria. If a user received a discount within that period, the flag evaluates to `off`. This filter prevents the user from collecting another discount before you want them to.
* You're rolling out or rolling back a variant. When you enable sticky bucketing and change the traffic allocation, you get a weighted average between the old and new allocation, because users already bucketed stay in their bucket. Your experiment takes some time to reach the allocations you want.
## Verify if sticky bucketing was enabled for a specific user
Follow these steps to determine whether sticky bucketing applied to a user:
1. Check the Experiment Assignment events in the user's [event stream](https://amplitude.com/docs/analytics/user-data-lookup). This check works only if you haven't blocked the [Experiment Assignment events in Data](https://amplitude.com/docs/data/remove-invalid-data).
2. Find the event property with `.details` that corresponds to the experiment flag key of interest. This property shows the version of the evaluated flag and which targeting rule applies to the user. The property also helps with debugging assignment issues.
| Event property | Value |
| ------------------------------- | ---------------------- |
| `[Experiment] Endpoint` | `/sdk/vardata` |
| `[Experiment] Environment ID` | `506` |
| `[Experiment] Environment Name` | `ios` |
| `lp-app-downloads.details` | `v21 rule:non-iOS users` |
| `lp-app-downloads.variant` | `off` |
For example, the properties above show that Amplitude assigns the user to `off` for the `lp-app-downloads` flag because the device family isn't iOS. The properties also show that this is the 21st version of the flag, the applied rule is `non-iOS users`, and the user fails the first rule-based targeting filter, so Amplitude applies the second one instead.
| Event property | Value |
| ----------------------------- | ------------------------ |
| `signup-ux-updates.details` | `v14 rule:sticky-bucketing` |
| `signup-ux-updates.variant` | `phone-number-removed` |
In this example, sticky bucketing is on and Amplitude bucketed the user to the 14th version of the `signup-ux-updates` flag, where the experiment served the `phone-number-removed` variant. The flag version helps with debugging when the flag changes. Experiment shows the assignment event for all active flags in that project, but shows the exposure event on a per-flag basis. If you don't find an event property that corresponds to the flag you want, check the `[Experiment] Environment Name` field and confirm it matches the deployment your flag belongs to.
================================================================================
# Contentful
URL: https://amplitude.com/docs/feature-experiment/contentful
================================================================================
# Contentful
The Contentful plugin for Amplitude Experiment lets you create content variations in Contentful, use Experiment to control which variant each user sees, and track the performance of those variants.
## Features
- Run A/B tests in Amplitude Experiment and author content in Contentful.
- Read properties from Amplitude Experiment (refreshed every 5 seconds) and build content around those properties.
## Requirements
To use the plugin, ensure you have the following:
- Access to an Amplitude plan with Amplitude Experiment enabled.
- Your Amplitude Org URL value. This value appears in the URL you use to access Amplitude: `https://app.amplitude.com/experiment/<ORG_URL>/dashboard`.
- A Management API key, which you can find in the Experiment side bar.
## Installation and use
Complete the following steps in Contentful and Amplitude to add and activate the Contentful plugin for Amplitude Experiment.
##### Install the plugin
1. Install the [plugin](https://www.contentful.com/marketplace/app/amplitude-experiment/) from the Contentful marketplace.
2. In the plugin configuration, enter the data center, Org URL, and Management API key you created in Experiment.
3. Click **Install to selected environments**.
4. Click **Save** to complete the plugin setup.
After you enable the plugin, a `Variant Container` content model appears on the Content Model tab.
### Add a variant container to a content model
The variant container in Contentful works with Amplitude Experiment to decide which variant of the experiment each user sees.
For best results, Amplitude recommends using a **Reference** content type to hold experiments.
##### To add a variant container
1. Open the content model of the page to which you want to add the variant container.
2. Click **Add field**. Select a **Reference** field.
3. Provide a name for the field. For best results, enter a name that matches the purpose of the field. For example, `Hero Banner` or `Demo CTA`.
4. Select **One reference** as the Type.
5. Click **Add and configure**.
6. On the Name and field ID tab of the field configuration, select **Accept only specified entry type**, and then select **Variant container**. This setting keeps the Contentful API response consistent when Contentful serves page content.
7. Click **Confirm** to create the field, then click **Save** to update the content model.
### Add content to your experiment
After you configure the variant container and reference field, open the page where you want to add an experiment.
##### To add content to your experiment
1. In the Content editor, select the page.
2. Find the field you created in the previous step and click the associated **Add content** selector.
3. Select **Variant Container** as the content to add.
4. In the field configuration, enter the **Flag Key** of the experiment. The Flag Key field shows matching keys as you type.
5. After you select the Flag Key, any variants associated with that key appear in the **Variants** section.
6. For each variant, select either **Link an existing entry** or **Create new content type** to populate the variant.
7. Click **Publish** to publish the variant container.
8. Click **Publish** to publish the updated page with the experiment enabled.
### Integrate with your front end
Contentful returns JSON when a user requests the page:
```json
{
"__typename": "PageLanding",
"sys": {
"id": "2cayfg7wVF5WezADCHgSgL",
"spaceId": "4y4crvvoco9a"
},
"internalName": "Homepage",
"heroBanner": {
"__typename": "VariationContainer",
"experiment": {
"id": "183980",
"key": "contentful-hero-banner",
"name": "contentful-hero-banner",
"tags": [],
"state": "running",
"deleted": false,
"enabled": true,
"endDate": null,
"decision": null,
"variants": [
{
"key": "control"
},
{
"key": "treatment"
}
],
"projectId": "289220",
"startDate": "2024-02-22",
"deployments": ["14"],
"description": "",
"bucketingKey": "amplitude_id",
"bucketingSalt": "28fWNw1M",
"bucketingUnit": "User",
"decisionReason": null,
"evaluationMode": "remote",
"experimentType": "hypothesis-testing",
"rolloutWeights": {
"control": 1,
"treatment": 1
},
"targetSegments": [],
"stickyBucketing": false,
"rolledOutVariant": null,
"rolloutPercentage": 0
},
"experimentId": "contentful-hero-banner",
"meta": {
"control": "6rmYK8YKYtTkKcFRY9Pf2w",
"treatment": "kwDjI2f2vKE2GvQoeqq1d"
},
"variationsCollection": {
"items": [
{
"__typename": "Hero",
"sys": {
"id": "6rmYK8YKYtTkKcFRY9Pf2w",
"spaceId": "4y4crvvoco9a"
},
"preHeadline": "Organic Products",
"headline": "100% Fresh Food",
"cta": "Shop Now",
"description": "Whatever you want from your local stores, brought right to your door. \t\t\t\t\t\t\t",
"image": {
"__typename": "Asset",
"sys": {
"id": "6PkraSxWWd96AU6FTYVssd"
},
"title": "Fresh food",
"description": "",
"width": 2560,
"height": 960,
"url": "https://images.ctfassets.net/4y4crvvoco9a/6PkraSxWWd96AU6FTYVssd/69b8d7f7cabb9f578097d50f2bf8aa70/Hero-3-1-scaled.jpg",
"contentType": "image/jpeg"
}
},
{
"__typename": "Hero",
"sys": {
"id": "kwDjI2f2vKE2GvQoeqq1d",
"spaceId": "4y4crvvoco9a"
},
"preHeadline": "Exclusive Offer",
"headline": "Loyalty Program",
"cta": "Get Free Shipping",
"description": "We missed you! Finish your order today and get free shipping when you join our loyalty program.",
"image": {
"__typename": "Asset",
"sys": {
"id": "6WFOK0460CwrW7aChl1QjM"
},
"title": "Loyalty Green",
"description": "",
"width": 1920,
"height": 720,
"url": "https://images.ctfassets.net/4y4crvvoco9a/6WFOK0460CwrW7aChl1QjM/e52fb2129b848203f6006ff9881309d9/Hero-_-loyalty-green.jpg",
"contentType": "image/jpeg"
}
}
]
}
}
}
```
The `experiment` object contains useful metadata about the experiment. To render the front end and include the experiment, use the `meta` and `variationsCollection` objects. Amplitude Experiment delivers the variant identifier and matches it to an option in the `meta` object. After you set the variant, you can:
- Iterate through items in the `variationsCollection` object to show the variation with the matching ID.
- Make a direct call to Contentful with the variant ID to avoid searching the array.
For more information, review the following React and TypeScript example:
```typescript
import React, { useEffect, useState } from "react";
import { Experiment } from "@amplitude/experiment-js-client";
import sdk from "contentful-sdk";
// --- Types (adjust to your schema) ---
type Hero = {
__typename: "Hero";
sys: { id: string };
// ...other fields you render
};
type HeroBanner = {
experimentId?: string; // key you use in Amplitude Experiment
meta?: Record<string, string>; // maps variant key -> variation id
variationsCollection?: { items: Array<Hero | null | undefined> };
};
// --- Experiment init ---
const CLIENT_KEY =
process.env.NEXT_PUBLIC_AMPLITUDE_EXPERIMENT_CLIENT_KEY ?? "";
export const experiment = Experiment.initialize(CLIENT_KEY, {
// Only enable verbose logging in dev if you like:
debug: process.env.NODE_ENV !== "production",
});
// --- Component hook snippet ---
export function useHeroVariant(userId: string | undefined) {
const [hero, setHero] = useState<Hero | null>(null);
useEffect(() => {
// Skip until we have a user id
if (!userId) return;
let isMounted = true;
(async () => {
try {
// 1) Fetch variants for this user
await experiment.fetch({ user_id: userId });
// 2) Load the banner/experiment mapping from Contentful
const heroBanner = await sdk.getEntry<HeroBanner>("ENTRY_ID_HERE");
if (!heroBanner) return;
// 3) Resolve the variant key from the experiment
const experimentKey = heroBanner.experimentId ?? "control";
const { value: variantKey } = experiment.variant(experimentKey);
if (!variantKey) return;
// 4) Map the variant key -> variation id through Contentful metadata
const variationId = heroBanner.meta?.[variantKey];
if (!variationId) return;
// 5) Find the matching Hero item
const match =
heroBanner.variationsCollection?.items.find(
(item): item is Hero =>
!!item &&
item.__typename === "Hero" &&
item.sys?.id === variationId,
) ?? null;
if (isMounted) setHero(match);
} catch (err) {
// Consider forwarding to your logger
console.error("Failed to resolve hero variant", err);
if (isMounted) setHero(null);
}
})();
return () => {
isMounted = false;
};
}, [userId]); // Note: don't include heroBanner (it's local) or setHero
return hero;
}
```
Account for cases where users receive `off` as the value that `experiment.variant()` returns.
================================================================================
# Data model
URL: https://amplitude.com/docs/feature-experiment/data-model
================================================================================
# Data model
In Amplitude, your organization is the top-most hierarchical level. Within an organization, Experiment follows the project structure that Amplitude Analytics defines. Associate all Experiment data with an Analytics project.
An Amplitude project contains [flags](#flags-and-experiments), [experiments](#flags-and-experiments), and [deployments](#deployments).

## Projects
Experiment uses the same projects as Amplitude Analytics. As a best practice, create a project for each product and for each environment. Because [flags](#flags-and-experiments), [experiments](#flags-and-experiments), and [deployments](#deployments) only exist within a single project, duplicate these objects across projects for the same product.
{% callout type="tip" heading="Copy a flag to another project" %}
When developing a new feature with an experiment, create the experiment in the dev environment project to develop and test the implementation. Then, copy the experiment into the prod project to run the experiment in prod.
{% /callout %}
A deployment serves a group of flags or experiments for use in an application. Each [project](#projects) has a deployment that uses the project API key as the deployment key, available by default. Amplitude randomly generates deployment keys. On creation, Amplitude assigns each experiment deployment an associated deployment key. Experiment uses the deployment key to identify the deployment and authorize requests to the evaluation servers.
{% callout type="note" heading="Client and server deployments" %}
Deployments are either client or server deployments. Use client-side deployments to initialize client-side SDKs and server-side deployments to initialize server-side SDKs or authorize requests to the Evaluation API.
{% /callout %}
## Deployments
Deployments belong to Analytics projects, and a project can have multiple deployments. Name deployments after the platform (client-side) or service (server-side) to which Experiment serves variants (for example: `android`, `ios`, `web`). The default project API key deployment is useful for getting started. However, explicit deployments for each platform or service work better for larger organizations or teams that share the same Amplitude project across multiple platforms for the same application.
Add deployments to [Flags and Experiments](https://amplitude.com/docs/feature-experiment/workflow/feature-flag-rollouts#create-a-new-flag) in the same project. When Experiment's evaluation servers receive a request to fetch variants for a user, Experiment uses the deployment key to look up all associated flags and experiments for evaluation.
## Flags and experiments
Experiment uses feature flags and experiments to serve a variable experience to a user. The flag key identifies flags and experiments. Flags and experiments associate with `0-n` [deployments](#deployments) and contain `1-k` [variants](#variants). The evaluation mode (local or remote) determines whether the flag or experiment supports [local evaluation](https://amplitude.com/docs/feature-experiment/local-evaluation), and local mode can limit the flag's targeting capabilities.
Feature flags and experiments share the same underlying data model, and you can migrate from one to the other retroactively. The most visible difference appears in the product interface: experiments guide you through an experiment lifecycle and let you define success metrics and perform analysis. Flags contain more basic functionality, and don't include special planning and analysis sections.
### Flags
Use flags for standard feature flagging without user analysis. New flags come with a default variant, `on`.
{% callout type="example" heading="Flag use cases" %}
- Rolling out a feature to a subset of users (for example, beta customers).
- Different experience for a behavioral cohort (for example, power users).
{% /callout %}
### Experiments
Use experiments for feature experimentation on users. New experiments come with two default variants, `control` and `treatment`.
{% callout type="example" heading="Experiment use cases" %}
- Run an A/B test for a new feature in your application.
- Experiment on multiple recommendation algorithms on your server.
{% /callout %}
## Variants
A variant is the part of the experiment that you change for the customer. For example, if you experiment with the text on a call to action (CTA) button, each version of the text is a variant. Variants can exist within a flag or an experiment. A single variant can associate with a single flag, or multiple variants can associate with a larger experiment. An experiment requires variants so that you can test the experiment's hypothesis.
{% callout type="note" heading="SDK use" %}
Only the `value` and `payload` are available when accessing a variant from an SDK or the [Evaluation API](https://amplitude.com/docs/apis/experiment/experiment-evaluation-api).
{% /callout %}
| Property | Requirement | Description |
| ---------------------------------------- | ------------ | ------------------------------------------------------------------------------------------------------------------------------------------------------------------------------------------------------------------------------------------------------------------------------ |
| `value` | Required | A string that identifies the variant in the instrumentation. Amplitude checks the value string for equality when an SDK or [Evaluation API](https://amplitude.com/docs/apis/experiment/experiment-evaluation-api) accesses the variant. Format must be lowercase, kebab-case, or snake_case. |
| `payload` | Optional | Dynamic JSON payload for sending arbitrary data with the variant. For example, you can send a hex code to change the color of a component in your application. |
| `name` | Optional | Name for the variant. The name is like `value`, but doesn't have formatting limitations, and you can change it without breaking the instrumentation in your code base. |
| `description` | Optional | A more detailed description of the variant. Use the description to explain what the user experiences when viewing the variable experience in more detail. |
## Users
Experiment users map to a user within Amplitude Analytics. Alongside flag configurations, users are an input to [evaluation](https://amplitude.com/docs/feature-experiment/implementation). Flag and experiment targeting rules access user properties.
Pass users to evaluation through `fetch` requests for [remote evaluation](https://amplitude.com/docs/feature-experiment/remote-evaluation), or directly to the `evaluate` function for [local evaluation](https://amplitude.com/docs/feature-experiment/local-evaluation).
{% callout type="warning" heading="" %}
Include either a user ID or device ID in the user object for evaluation to succeed.
For example, remote evaluation returns a 400 error if both the User ID and Device ID are null, empty, or missing.
{% /callout %}
| Property | Type | Description |
| -------------------------------------------- | -------- | ----------------------------------------------------------------------------------------------------------------------------------------------------------------------------------------------------------------------------------------------------------------------------------------------------------------------------------------------------------------------------- |
| `user_id` | `string` | The [User ID](https://amplitude.com/docs/get-started/identify-users) is the primary identifier for the user. This value is typically the user's ID within your system. Experiment uses the User ID when resolving the Amplitude ID on enrichment before [remote evaluation](https://amplitude.com/docs/feature-experiment/remote-evaluation), where the Amplitude ID is the default bucketing key. |
| `device_id` | `string` | The Device ID is the secondary identifier for the user. An analytics SDK usually generates the Device ID randomly on the client side, or sets it in a cookie on the server side. Experiment also uses the Device ID when resolving the Amplitude ID on enrichment before [remote evaluation](https://amplitude.com/docs/feature-experiment/remote-evaluation), where the Amplitude ID is the default bucketing key. |
| `user_properties` | `object` | Optional object of custom properties used when evaluating the user during local or remote evaluation. |
| `groups` | `object` | Beta. Optional object that lists groups associated with this user. Format is an object where the key is the group type, and the value is an array of group value strings (for example, `{"org name":["Amplitude"]}`). |
| `group_properties` | `object` | Beta. Optional object that lists group properties associated with this user. Format is a nested object where the key is the group type, and the value is an object where the key is the group value, and the value is an object of properties (for example, `{"org name":{"Amplitude":{"plan":"enterprise"}}}`). |
{% early-access %}
This feature is in Early Access. This feature may continue to evolve. This documentation may not yet reflect the latest updates.
{% /early-access %}
{% callout type="note" %}
If your organization has purchased the [Accounts add-on](https://amplitude.com/docs/analytics/account-level-reporting), you can perform bucketing and analysis on groups rather than users. Contact your representative to gain access.
Include groups with the user when sent with the fetch request (recommended). Or, identify groups with the user through a group identify call from the [Group Identify API](https://amplitude.com/docs/apis/analytics/group-identify) or with [`setGroup()` from an analytics SDK](https://amplitude.com/docs/sdks/analytics/browser/browser-sdk-2#user-groups).
All Experiment SDKs support groups. The following table lists minimum versions:
| SDK | Minimum version |
| ------------------------------------------------------------------ | --------------- |
| [Android](https://amplitude.com/docs/sdks/experiment-sdks/experiment-android) | 1.9.0 |
| [iOS](https://amplitude.com/docs/sdks/experiment-sdks/experiment-ios) | 1.10.0 |
| [React Native](https://amplitude.com/docs/sdks/experiment-sdks/experiment-react-native) | 1.1.0 |
| [JavaScript](https://amplitude.com/docs/sdks/experiment-sdks/experiment-javascript) | 1.5.6 |
| [Ruby](https://amplitude.com/docs/sdks/experiment-sdks/experiment-ruby) | 1.4.0 |
| [Go](https://amplitude.com/docs/sdks/experiment-sdks/experiment-go) | 1.7.0 |
| [Python](https://amplitude.com/docs/sdks/experiment-sdks/experiment-python) | 1.3.0 |
| [JVM](https://amplitude.com/docs/sdks/experiment-sdks/experiment-jvm) | 1.3.0 |
| [Node](https://amplitude.com/docs/sdks/experiment-sdks/experiment-node-js) | 1.5.0 |
| [PHP](https://amplitude.com/docs/sdks/experiment-sdks/experiment-php) | 1.0.0 |
{% /callout %}
### Full user definition
{% accordion title="Full user definition" %}
```json
{
"user_id": string,
"device_id": string,
"country": string,
"region": string,
"city": string,
"dma": string,
"language": string,
"platform": string,
"version": string,
"os": string,
"device_manufacturer": string,
"device_brand": string,
"device_model": string,
"carrier": string,
"library": string,
"user_properties": object,
"groups": object,
"group_properties": object
}
```
{% /accordion %}
================================================================================
# Performance and caching
URL: https://amplitude.com/docs/feature-experiment/under-the-hood/performance-and-caching
================================================================================
# Performance and caching
Amplitude Experiment [evaluation](https://amplitude.com/docs/feature-experiment/implementation) supports two modes, [local](https://amplitude.com/docs/feature-experiment/local-evaluation) and [remote](https://amplitude.com/docs/feature-experiment/remote-evaluation). Each mode has different performance characteristics and tradeoffs.
## Performance
Evaluation performance depends on the type of evaluation you use, and on where the request originates.
Amplitude hosts data centers in the US (`us-west-2`) and EU (`eu-central-1`). Requests to a data center geographically distant from the data center that hosts your Amplitude data experience higher latency.
### Remote evaluation
[Remote evaluation](https://amplitude.com/docs/feature-experiment/remote-evaluation) uses [Fastly](https://fastly.com) to [cache](#cdn-caching) evaluation results for a user. Cache hits serve variants from the edge, which improves performance.
The following results come from synthetic remote evaluation test requests to Amplitude's US data center, collected over the last six months. Latency includes Domain Name System (DNS) resolution, transport layer security (TLS) connection, and the remote evaluation request response round trip.
{% tabs tabs="Global, North America, South America, Europe, Asia" %}
{% tab name="Global" %}
| Cache | Average |
| --- | --- |
| HIT | 35.9ms |
| MISS | 194.21ms |
{% /tab %}
{% tab name="North America" %}
| Cache | Average |
| --- | --- |
| HIT | 48.21ms |
| MISS | 100.56ms |
{% /tab %}
{% tab name="South America" %}
| Cache | Average |
| --- | --- |
| HIT | 18.18ms |
| MISS | 262.62ms |
{% /tab %}
{% tab name="Europe" %}
| Cache | Average |
| --- | --- |
| HIT | 31.96ms |
| MISS | 214.3ms |
{% /tab %}
{% tab name="Asia" %}
| Cache | Average |
| --- | --- |
| HIT | 28.84ms |
| MISS | 239.09ms |
{% /tab %}
{% /tabs %}
### Local evaluation
[Local evaluation](https://amplitude.com/docs/feature-experiment/local-evaluation) pre-fetches flag configurations and uses them to evaluate all users. This avoids a network request and speeds up evaluation compared to remote evaluation.
The following results measure a single flag evaluation, collected over 10 executions of 10,000 iterations with randomized user inputs evaluated against one flag configuration. Amplitude selected these results at random from three possible flag configurations.
| SDK | Average | Median | Cold Start |
| --- | --- | --- | --- |
| [Node.js](https://amplitude.com/docs/sdks/experiment-sdks/experiment-node-js) | 0.025ms | 0.018ms | 3ms |
| [Go](https://amplitude.com/docs/sdks/experiment-sdks/experiment-go) | 0.098ms | 0.071ms | 0.7ms |
| [JVM](https://amplitude.com/docs/sdks/experiment-sdks/experiment-jvm) | 0.007ms | 0.005ms | 6ms |
## CDN caching
{% callout type="note" heading="Content delivery network" %}
- A content delivery network (CDN) is a geographically distributed group of servers that work together to deliver internet content quickly.
- The CDN caches variant responses for [remote evaluation](https://amplitude.com/docs/feature-experiment/remote-evaluation) and flag configurations for [local evaluation](https://amplitude.com/docs/feature-experiment/local-evaluation).
{% /callout %}
After Experiment computes and retrieves a response for a request, Experiment caches that request for reuse to make future requests faster. Experiment uses a CDN to cache the experiments and feature flags for a user, which provides low-latency access on subsequent requests.
### Cache time-to-live (TTL)
Experiment caches requests to the server on the CDN. The cache uses a time-to-live (TTL) policy and expires after 60 minutes regardless of whether the key is accessed within that window. The 60-minute cache window starts from the first page load.
### Cache key
The CDN caches the exact request received, including user information. Any change in user info misses the CDN cache unless Experiment cached that exact same request before.
### Cache invalidation
To prevent stale results when underlying flags change, Experiment invalidates (deletes) cached results for an entire deployment when you update any flag or experiment associated with that deployment. The SDKs retrieve results for all experiments and feature flags for a given deployment for a user, so Experiment invalidates all results for a deployment whenever a single flag changes. Experiment also invalidates all cached requests for a deployment when you add or remove the deployment from a flag.
A [scheduled start](https://amplitude.com/docs/feature-experiment/workflow/experiment-test#schedule-your-experiment) is an exception: reaching the scheduled start time doesn't invalidate the cache. Requests made in the hour before the start time keep their cached pre-start response until the 60-minute TTL expires, while requests made at or after the start time receive a variant right away.
### Dynamic targeting cache considerations
Experiment lets you target feature flags and experiments based on dynamic properties, such as user properties and behavioral cohorts synced from Analytics. These properties aren't included in the fetch request, so you may receive cached experiment results for up to one hour (the TTL) until the cache misses and Experiment re-evaluates the user with the most recent dynamic properties.
#### Amplitude user properties
Experiment's remote evaluation servers can target based on user properties that Amplitude previously identified for the user. The CDN caches responses based only on user properties passed explicitly in the request, so the caller may receive stale results for up to one hour, even after Analytics updates the user properties to values that would assign the user to a different variant.
#### Behavioral cohorts
You may want to use behavioral cohorts defined in Amplitude Analytics in your flag and experiment targeting. Experiment computes cohorts hourly and the CDN cache TTL is also hourly, so targeting a user to a variant may take up to two hours.
{% callout type="tip" %}
Amplitude Experiment recommends dynamic cohort targeting only for flags and experiments where inclusion in a variant isn't time sensitive.
{% /callout %}
================================================================================
# Proxy requests to Experiment with AWS Cloudfront
URL: https://amplitude.com/docs/feature-experiment/advanced-techniques/proxy-requests-to-experiment-with-aws-cloudfront
================================================================================
# Proxy requests to Experiment with AWS Cloudfront
Set up a reverse proxy to circumvent domain blocking in particular regions or by certain extensions and DNS servers. Because experiment APIs are latency sensitive, Amplitude recommends an edge-hosted solution to minimize round-trip time from the proxy to Amplitude.
## Create a distribution
Follow these steps to create a new CloudFront distribution that proxies requests to Amplitude Experiment's evaluation servers. Leave any configuration field not mentioned in the steps at its default value.
1. In AWS, go to CloudFront and select **Create distribution**.
2. In the **Origin domain** field, enter `api.lab.amplitude.com` for the US data center or `api.lab.eu.amplitude.com` for the EU data center.
3. In the **Default cache behavior** section, select `GET, HEAD, OPTIONS, PUT, POST, PATCH, DELETE` for **Allowed HTTP methods** and `OPTIONS` for **Cache HTTP methods**. The **Cache HTTP methods** field appears after you select an **Allowed HTTP methods** value.
4. In the **Cache key and origin requests** section, select the `CachingDisabled` cache policy, the `AllViewExceptHostHeader` origin request policy, and the `CORS-with-preflight-and-SecurityHeadersPolicy` response headers policy. These selections require that you choose **Cache policy and origin request policy (recommended)** rather than **Legacy cache settings**.
5. In the **Web Application Firewall (WAF)** section, select **Do not enable security protections**.
6. Select **Create distribution**.
## Test the distribution
Test the new distribution with a `curl` request. To find the distribution domain name, select the new distribution from the list in CloudFront and copy the subdomain. Replace `SUBDOMAIN` in the following command with that subdomain. Replace `APIKEY` with your deployment or project API key to authorize the request.
Successful requests return a `200` response.
```bash
curl -i 'https://SUBDOMAIN.cloudfront.net/v1/vardata' -H 'Authorization: Api-Key APIKEY'
```
================================================================================
# Server-side rendering
URL: https://amplitude.com/docs/feature-experiment/advanced-techniques/server-side-rendering
================================================================================
# Server-side rendering
Use the JavaScript Server SDK and JavaScript Client SDK together to create a server-side rendered experience.
{% callout type="example" heading="" %}
For a complete example, go to the [experiment-node-server demo app](https://github.com/amplitude/experiment-node-server/tree/main/packages/ssr-demo) on GitHub.
{% /callout %}
## Installation
Install both the JavaScript Server SDK and JavaScript Client SDK.
{% code-group %}
```bash npm
npm install --save @amplitude/experiment-js-client @amplitude/experiment-node-server
```
```bash yarn
yarn add @amplitude/skylab-js-client @amplitude/skylab-js-server
```
{% /code-group %}
## Initialize the Server SDK
On server startup, initialize the Server SDK. To distinguish it from the Client SDK `Experiment` object, this example aliases the Server SDK `Experiment` object as `ExperimentServer`.
```js
let ExperimentServer;
if (typeof window === 'undefined') {
console.debug('Initializing Server Experiment');
ExperimentServer = require('@amplitude/experiment-node-server').Experiment.initialize(
'server-IAxMYws9vVQESrrK88aTcToyqMxiiJoR',
{ debug: true },
);
}
export { ExperimentServer };
```
## Fetch variants on request
On each request, fetch variants using the server-side SDK. The result is a plain JavaScript object that maps feature keys to variant values. Store the result where your rendering code can access it in both server-side and client-side contexts.
```js
const allFlags = await experimentServer.fetchV2({
id: 'userId',
});
// store the result where the rendering code can access it
global.appProps = { flags: allFlags };
```
## Initialize the Client SDK on render
At the start of your server-side render, initialize the Client SDK with the fetched variants. Instantiate an `ExperimentClient` that the render scope can access (for example, through a React ContextProvider). In the server-side context, create a new `ExperimentClient` every time. In the client-side context, create a new `ExperimentClient` only if one doesn't already exist.
```js
import { ExperimentClient } from '@amplitude/experiment-js-client';
let experimentClient;
const render = (appProps) => {
const isServerSide = typeof window === 'undefined';
if (isServerSide) {
console.debug('Initializing Client Experiment');
// on the server, create a new ExperimentClient every time
experimentClient = new ExperimentClient(
'client-IAxMYws9vVQESrrK88aTcToyqMxiiJoR',
{
initialVariants: appProps['features'],
},
);
} else if (!experiment) {
// in the client, only create the ExperimentClient once
experimentClient = Experiment.initialize(
'client-IAxMYws9vVQESrrK88aTcToyqMxiiJoR',
{
initialVariants: appProps['features'],
},
);
}
}
// use a provider or store the ExperimentClient so the render scope can access it
```
## Get variants on render
After you initialize the Client SDK, fetch the flag status in any component.
```js
// experimentClient should be the same ExperimentClient instance from the previous step
experimentClient.variant('flag-key');
```
================================================================================
# Bonferroni Correction
URL: https://amplitude.com/docs/feature-experiment/advanced-techniques/bonferroni-correction
================================================================================
# Bonferroni Correction
In an experiment, think of each variant or metric you include as its own hypothesis. For example, when you add a new variant, you propose the hypothesis that the changes in that variant produce a detectable impact on the experiment's results.
The simplest experiments have only a single hypothesis. Single-hypothesis tests can yield valuable insights. However, including more than one metric or variant, or multiple hypotheses, is often more efficient or enlightening.
Multiple hypothesis testing can introduce errors into your calculations of statistical significance through the [multiple comparisons problem](https://en.wikipedia.org/wiki/Multiple_comparisons_problem). The probability of making an error increases with the number of hypothesis tests you run.
## Problems with multiple hypotheses testing
For example, imagine you run an experiment on the color of your site's "Buy now" button. The default setting for the site is blue, which makes blue the control. You also want to test green (variant #1) and purple (variant #2). If your false positive rate is 0.05 (5%) for each individual hypothesis test, the probability of finding a statistically significant result when the null hypothesis is true is:
`1 - 0.95^2 = 0.0975`
This calculation assumes the tests are independent.
If you run enough tests, you eventually get a statistically significant result no matter what. With a 0.05 false positive rate, expect one out of every 20 hypothesis tests to show statistical significance by random chance alone.
Multiple hypothesis correction asks: is this statistically significant result due to chance, or is it genuine?
## False positives
A false positive rate is the ratio between:
* the number of negative events falsely described as positive, and
* the total number of actual negative events.
Every experiment carries the risk of a false positive result. A false positive occurs when an experiment reports a conclusive result in either direction, when no real difference exists between variations.
The risk of a false positive result increases with each metric or variant you add to your experiment. This risk increases even though the false positive rate stays the same for each individual metric or variant.
Statistical tools compensate and correct for the multiple comparisons problem. Amplitude uses the Bonferroni correction.
{% callout type="note" %}
Amplitude enables the Bonferroni correction by default. You can manually toggle it off in your [statistical settings](https://amplitude.com/docs/feature-experiment/workflow/finalize-statistical-preferences).
{% /callout %}
## Bonferroni correction
The Bonferroni correction is the simplest statistical method for counteracting the multiple comparisons problem. It's also one of the more conservative methods, and carries a greater risk of false negatives than other techniques. For example, the Bonferroni correction doesn't consider the distribution of [p-values](https://en.wikipedia.org/wiki/P-value) across all comparisons, which could be uniform if the null hypothesis is true for all hypotheses.
The Bonferroni correction controls for [family-wise error rate](https://en.wikipedia.org/wiki/Family-wise_error_rate) and applies to the confidence interval. In the button color example above, dividing 0.1 by 2 equals 0.05, which is the target value. The family-wise error rate stays controlled.
{% callout type="note" heading="" %}
The proof follows from [Boole's inequality](https://en.wikipedia.org/wiki/Boole%27s_inequality).
{% /callout %}
Mathematically, the Bonferroni correction divides the false positive rate by the number of hypothesis tests you run. This is the same as multiplying the p-value by the number of hypothesis tests.
Amplitude Experiment performs Bonferroni corrections on both the number of treatments and the number of primary and secondary metrics:
* Bonferroni applies to the primary metric when more than one treatment exists.
* Bonferroni applies to the secondary metric when multiple secondary metrics or multiple treatments exist.
In either case, Amplitude places an info icon in the significance column when you apply Bonferroni correction. The tooltip shows the corrected and uncorrected p-value.
================================================================================
# JSON payloads
URL: https://amplitude.com/docs/feature-experiment/json-payloads
================================================================================
# JSON payloads
JSON payloads attach dynamic configuration data to experiment variants. Use payloads to change your application's behavior or appearance remotely, without redeploying code.
Strongly typed payloads let you define a schema so Amplitude validates each payload before it reaches your application.
## How JSON payloads work
When you create a variant, you can attach a JSON payload that contains any variables you want to pass to your application.
When your application evaluates an experiment:
- The Experiment SDK fetches the variant for the user.
- The SDK returns the variant along with its payload.
- Your application reads the payload and configures the experience dynamically.
This pattern works for simple flags and for complex experiments where the payload defines layouts, feature options, copy, or configuration values.
### Workflow overview
A typical workflow follows these steps:
1. **Create a variant with a payload**: Add a JSON object to a variant that defines the configuration for that experience.
2. **Activate the flag or experiment**: Deploy the configuration to your users.
3. **Evaluate in your application**: Use an Experiment SDK (web, mobile, or backend) to fetch the variant for each user.
4. **Use the payload**: Read `variant.payload` and apply the configuration to your UI or business logic.
## Create variants with payloads
Add JSON payloads to variants through the Amplitude UI or programmatically through the Management API.
### Through the UI
To add a payload when creating or editing a variant:
1. Navigate to *Experiment > Feature Flags* or *Experiments*.
2. Select the flag or experiment you want to configure.
3. In the **Variants** section, create or edit a variant.
4. Enter the variant name, value, and description.
5. In the **Payload** field, add your JSON configuration.
6. Select **Apply**, then save your changes.
{% callout type="example" heading="Example payload – config for a blog layout" %}
```json
{
"layout": "cards",
"titlePosition": "above",
"gradient": false,
"showDescription": true,
"cardCount": 3
}
```
{% /callout %}
For more details on creating variants in the UI, go to [Create variations](https://amplitude.com/docs/feature-experiment/experiment-quick-start#creating-variations).
### Through the Management API
Create variants with payloads using the Experiment Management API. Include the `payload` field in your request body.
{% callout type="example" heading="API request example" %}
```bash
curl --request POST \
--url 'https://experiment.amplitude.com/api/1/flags/{id}/variants' \
--header 'Authorization: Bearer <management-api-key>' \
--header 'Content-Type: application/json' \
--data '{
"key": "cards-layout",
"name": "Cards Layout",
"description": "Blog posts displayed in card format",
"payload": {
"layout": "cards",
"titlePosition": "above",
"gradient": false,
"showDescription": true,
"cardCount": 3
},
"rolloutWeight": 1
}'
```
{% /callout %}
Refer to the full API docs for:
- [Create variant for flags](https://amplitude.com/docs/apis/experiment/experiment-management-api-flags#create-variant).
- [Create variant for experiments](https://amplitude.com/docs/apis/experiment/experiment-management-api-experiments#create-variant).
## Access payloads in your application
After you create variants with payloads, your application must:
1. Initialize the Experiment SDK.
2. Fetch the variants for the user.
3. Access `variant.payload`.
4. Apply the configuration with sensible defaults.
The exact syntax varies by SDK, but the pattern stays consistent.
### JavaScript / TypeScript (browser)
```javascript
import { Experiment } from '@amplitude/experiment-js-client';
// Initialize the Experiment client
const experiment = Experiment.initialize('<DEPLOYMENT_KEY>', {
// Optional configuration
});
// Fetch variants for the current user
await experiment.fetch({
user_id: 'user123',
device_id: 'device456',
});
// Get the variant for a specific flag
const variant = experiment.variant('blog-layout-flag');
// Access the payload with defaults
if (variant && variant.payload) {
const layout = variant.payload.layout || 'list';
const titlePosition = variant.payload.titlePosition || 'below';
const showDescription = variant.payload.showDescription !== false;
const cardCount = variant.payload.cardCount || 5;
configureBlogLayout({
layout,
titlePosition,
showDescription,
cardCount,
});
}
```
### React example
```javascript
import { useEffect, useState } from 'react';
import { Experiment } from '@amplitude/experiment-js-client';
function BlogComponent() {
const [layoutConfig, setLayoutConfig] = useState({
layout: 'list', // defaults
titlePosition: 'below',
showDescription: true,
cardCount: 5,
});
useEffect(() => {
async function fetchExperiment() {
const experiment = Experiment.initialize('<DEPLOYMENT_KEY>');
await experiment.fetch({ user_id: 'user123' });
const variant = experiment.variant('blog-layout-flag');
if (variant && variant.payload) {
setLayoutConfig({
layout: variant.payload.layout || 'list',
titlePosition: variant.payload.titlePosition || 'below',
showDescription: variant.payload.showDescription !== false,
cardCount: variant.payload.cardCount || 5,
});
}
}
fetchExperiment();
}, []);
return (
<BlogLayout
layout={layoutConfig.layout}
titlePosition={layoutConfig.titlePosition}
showDescription={layoutConfig.showDescription}
cardCount={layoutConfig.cardCount}
/>
);
}
```
### Server-side example (Node.js)
```javascript
import { Experiment } from '@amplitude/experiment-node-server';
const experiment = Experiment.initialize('<DEPLOYMENT_KEY>');
async function getExperimentConfig(userId: string) {
const user = { user_id: userId };
const variants = await experiment.fetch(user);
const variant = variants['blog-layout-flag'];
if (variant && variant.payload) {
return {
layout: variant.payload.layout || 'list',
titlePosition: variant.payload.titlePosition || 'below',
showDescription: variant.payload.showDescription !== false,
cardCount: variant.payload.cardCount || 5,
};
}
// Fallback config
return {
layout: 'list',
titlePosition: 'below',
showDescription: true,
cardCount: 5,
};
}
// Example usage in a route
app.get('/api/blog-config', async (req, res) => {
const config = await getExperimentConfig(req.user.id);
res.json(config);
});
```
## Strongly typed JSON payloads (advanced)
JSON payloads are flexible by default: attach any valid JSON to a variant and read it from `variant.payload`. For more control, define the expected type for variant payloads so Amplitude validates each payload before it reaches your application.
Strongly typed payloads let you:
- Set the expected type once per flag or experiment.
- Validate each variant payload against that type in Amplitude.
- Catch configuration issues, such as wrong types or missing required fields, before they reach production.
{% callout type="note" heading="JSON payload model" %}
Strongly typed payloads build on the JSON payload model and SDKs this page covers. How you access `variant.payload` in code doesn't change. You gain stronger guarantees about the payload's shape.
{% /callout %}
### Strongly typed payload use cases
Strong typing is useful when:
- Multiple teams depend on the same configuration, such as product, engineering, and solutions.
- Payloads are complex, with nested objects, arrays, and multiple keys.
- You use flags as remote config or as layers that many experiments share.
- You want to reduce runtime errors and make configuration safer.
### Define the expected type for variant payloads
In the UI, select **Set payload type** to choose a payload type for the flag or experiment. The type applies to all variants.
**Payload type options:**
- **None**: No type enforcement. Use any valid JSON as a payload.
- **String**: `variant.payload` is a string.
- **Number**: `variant.payload` is a number.
- **Object**: `variant.payload` is an object with no fixed keys or types.
- **Array**: `variant.payload` is an array.
- **Custom Schema**: Define an object shape with specific keys and types. Choose the type of each field, such as string, number, boolean, or array, and mark any field as required. Amplitude represents the shape as a JSON schema and validates every variant payload against it.
If a variant payload doesn't match the type you select:
- The UI shows an error on the variant and indicates the problem, such as a missing required field or an incorrect type.
- You can't save the change until the payload is valid.
- Amplitude prevents you from deploying broken configuration.
Type enforcement complements validation in your application code instead of replacing it:
- Amplitude enforces the payload type when you edit payloads.
- Your application can validate or narrow types at runtime if needed.
### Example: Custom Schema
Suppose you want a payload with `headerText` required:
```json
{
"buttonColor": "#4A90D9",
"headerText": "Welcome back!",
"maxRetries": 3,
"features": ["dark_mode", "analytics"],
"showBanner": true
}
```
When you choose **Custom Schema** and define these keys and types, Amplitude uses a JSON schema equivalent to:
```json
{
"$schema": "http://json-schema.org/draft-07/schema#",
"type": "object",
"properties": {
"buttonColor": {
"type": "string"
},
"headerText": {
"type": "string"
},
"maxRetries": {
"type": "integer"
},
"features": {
"type": "array",
"items": {
"type": "string"
}
},
"showBanner": {
"type": "boolean"
}
},
"required": [
"features",
"buttonColor",
"headerText",
"maxRetries",
"showBanner"
]
}
```
Mark any field as required in the Custom Schema. Payloads that omit a required field or use the wrong type for a key fail validation and block saving until you fix them.
### Using strongly typed payloads in your code
When you enable strong typing, the SDK interaction stays the same: read payloads from `variant.payload` and apply your own types in code.
In TypeScript, you can define a matching type:
```typescript
type BlogLayoutPayload = {
layout: 'list' | 'cards' | 'grid';
titlePosition: 'above' | 'below';
gradient?: boolean;
showDescription: boolean;
cardCount: number;
};
```
Then cast and use:
```typescript
const variant = experiment.variant('blog-layout-flag');
if (variant && variant.payload) {
const payload = variant.payload as BlogLayoutPayload;
configureBlogLayout({
layout: payload.layout,
titlePosition: payload.titlePosition,
showDescription: payload.showDescription,
cardCount: payload.cardCount,
});
}
```
The JSON schema in Amplitude enforces this contract when you create or edit payloads. Your application enforces the same contract through types or runtime checks.
## Best practices
Follow these best practices to keep your payloads robust and maintainable.
### 1. Always provide default values
Provide sensible defaults when accessing payload properties. Defaults ensure your application behaves correctly when:
- The user doesn't receive a variant.
- The payload is missing expected properties.
- You turn off the experiment.
Examples:
```javascript
const layout = variant?.payload?.layout || 'list';
const cardCount = variant?.payload?.cardCount || 5;
const showDescription = variant?.payload?.showDescription !== false;
```
### 2. Validate payload structure
Even with strongly typed payloads, validate payloads in your application:
```javascript
function validateLayoutPayload(payload: any): boolean {
const validLayouts = ['list', 'cards', 'grid'];
if (!validLayouts.includes(payload.layout)) {
console.error('Invalid layout in payload:', payload.layout);
return false;
}
if (typeof payload.cardCount !== 'number' || payload.cardCount < 1) {
console.error('Invalid cardCount in payload:', payload.cardCount);
return false;
}
return true;
}
const variant = experiment.variant('blog-layout-flag');
if (variant?.payload && validateLayoutPayload(variant.payload)) {
applyLayoutConfig(variant.payload);
}
```
When using a JSON schema in Amplitude, keep your application-side validation aligned with that schema.
### 3. Keep payloads simple
Keep payload structures focused on configuration:
- Avoid large payloads. Aim for less than 10 KB.
- Avoid deeply nested or highly coupled structures.
- Avoid sensitive data. Payloads are visible in network traffic and logs.
### 4. Document your payload schema
Document the expected structure of your payloads, especially when multiple teams touch the same flag or experiment.
Example JSDoc-style documentation:
```javascript
/**
* Blog Layout Flag Payload Schema
* @typedef {Object} BlogLayoutPayload
* @property {('list'|'cards'|'grid')} layout - The layout style
* @property {('above'|'below')} titlePosition - Title position relative to content
* @property {boolean} gradient - Whether to show gradient backgrounds
* @property {boolean} showDescription- Whether to show post descriptions
* @property {number} cardCount - Number of cards to display (1-10)
*/
```
If you're using strongly typed payloads in Amplitude, keep your JSON schema and code documentation or types in sync. Everyone then shares the same contract.
## Common use cases
JSON payloads, with or without strong typing, support a wide range of use cases.
### Remote configuration
Use payloads to remotely configure features without deploying code:
```json
{
"apiEndpoint": "https://api.v2.example.com",
"timeout": 5000,
"retries": 3,
"enableCache": true
}
```
### UI customization
Configure UI elements like colors, layouts, and text:
```json
{
"primaryColor": "#007AFF",
"buttonText": "Get Started",
"showBanner": true,
"bannerMessage": "Limited time offer!"
}
```
### Feature rollout levels
Gradually expose functionality through configuration flags:
```json
{
"enableAdvancedSearch": true,
"enableFilters": true,
"maxResults": 50,
"showRecommendations": true
}
```
### Content variations
Test different content approaches:
```json
{
"headline": "Transform Your Workflow",
"subheadline": "Get started in minutes, not hours",
"ctaText": "Start Free Trial",
"showTestimonials": true
}
```
## Payload availability
When you access a variant from the SDK or Evaluation API, you can use the `value` and `payload` properties:
- `value`: the variant's value, such as "on", "off", "control", or "treatment".
- `payload`: the JSON configuration you attach.
The Management API and Amplitude UI provide other variant properties like `name` and `description`.
For more information about the variant data model, go to [Variants](https://amplitude.com/docs/feature-experiment/data-model#variants).
================================================================================
# Finalize your experiment's advanced settings
URL: https://amplitude.com/docs/feature-experiment/workflow/finalize-statistical-preferences
================================================================================
# Finalize your experiment's advanced settings
The final step in creating your experiment is to specify advanced settings. These settings include:
* **Exposure settings**: Settings for the exposure event that triggers before your audience receives your experiment.
* **Stats Preferences**: Statistical settings for experiment analysis.
* **Bucketing options**: Settings for bucketing and targeting your audience.
##### To set advanced settings
1. In your experiment, scroll down to the Advanced section and click the **edit** icon.
2. Set your preferences using the definitions below.
3. Click **Save and Close**.
After you save your settings, [test your experiment](https://amplitude.com/docs/feature-experiment/workflow/experiment-test).
## Exposure settings
Exposure settings are the configuration rules that define when and how Amplitude marks a user as exposed to an experiment or feature. These settings determine the logic that triggers an exposure event: whether a user counts as exposed the first time they qualify for an experiment, the first time they interact with a feature, or under custom criteria.
In your Experiment Design options, click **Advanced** and then click **Exposure Settings** to specify the settings you want. You can modify any of the following:
### Exposure event
An exposure event is the moment when a user becomes eligible for an experiment variant or feature. Amplitude shows users the experiment variant regardless of whether they interact with it. This event serves as the anchor point for experiment analysis and ensures that Amplitude attributes downstream behaviors and outcomes to the correct variant. By logging exposure events, Experiment prevents biases such as double counting or misattribution. Exposure events also establish a consistent link between user actions and the experiment they were exposed to.
You can specify:
* **Exposure Event**: Choose which exposure event triggers the experiment. The default is the Amplitude Exposure event. Amplitude recommends leaving this setting as is, but you can specify a custom exposure event.
* **Proxy Exposure Event**: For Feature Experiments, a proxy exposure event is a placeholder used to estimate the duration of the experiment based on historical data of that event. The default is Any Active Event. You can specify any recorded event as the proxy.
* **Custom Exposure Settings**: Choose whether to further customize your exposure settings with:
* **Attribution**: Choose whether the exposure event activates only on the first instance of the user triggering it, or at any instance.
* **Window**: Choose whether the experiment triggers within a specific time period of the event.
## Stats Preferences
Statistical preferences are the configurable settings that determine how Amplitude analyzes and displays experiment results. These preferences let teams choose parameters such as:
* [*CUPED*](#cuped) toggled off
* [*Bonferroni Correction*](#bonferroni-correction) toggled on
* [*Custom Exposure Settings*](#custom-exposure-settings) toggled off
* [*Test Type*](#test-type) set to Sequential
* [*Confidence Level*](#confidence-level) set to 95%
You can modify the Stats Preferences at any step of an experiment. They're most useful for the final analysis after the experiment ends.
{% callout type="note" %}
This article continues directly from the [Help Center article on learning from your experiment](https://amplitude.com/docs/feature-experiment/workflow/experiment-learnings). If you haven't read that article, do so before continuing here.
{% /callout %}
### CUPED
Controlled-experiment using pre-existing data, also known as CUPED, is an optional statistical technique that reduces variance in Amplitude Experiment. When you toggle CUPED on, Amplitude Experiment accounts for possible varying treatment effects across user segments. CUPED isn't the best choice for every experiment. For example, avoid CUPED when targeting only new users.
The random bucketing process can deliver unbalanced groups of users to each variant. This unbalance is pre-exposure bias, and CUPED addresses it. Without CUPED, pre-exposure bias persists in your experiment. This is why you may notice differences in the mean-per-variant when running the same experiment with and without CUPED.
For a more technical explanation, refer to this [detailed blog post](https://bytepawn.com/reducing-variance-in-ab-testing-with-cuped.html).
For more on how CUPED affects experiment results, refer to this [blog](https://amplitude.com/blog/amplitude-experiment-cuped).
### Bonferroni Correction
Amplitude Experiment uses the Bonferroni correction to address potential problems with [multiple hypothesis testing](https://amplitude.com/docs/feature-experiment/advanced-techniques/bonferroni-correction). Although a trusted statistical method, you may not want to use it in every case. One example is when you want to compare results with those generated by an internal system that doesn't support the Bonferroni method. In this case, and if you accept higher false positive rates, toggle the **Bonferroni Correction** off.
### Statistical Method
Select which statistical method you want to use:
* **Sequential testing**: A statistical method that analyzes results continuously as data comes in, instead of only at a fixed sample size. This approach lets teams review experiment results continuously without inflating false positive risk. Because the method corrects for repeated looks at the data, it's useful for making faster decisions when effects are strong. It requires careful setup to avoid bias. Refer to [Sequential Testing](https://amplitude.com/docs/feature-experiment/under-the-hood/experiment-sequential-testing) for more information.
* **T-Testing**: A traditional statistical test that compares the means of two groups, such as the control and treatment groups, to determine if differences are statistically significant. It assumes normally distributed data and fixed sample sizes. A t-test is simple and widely understood, but it's less flexible if you want to check results continuously or handle more complex outcome distributions. Refer to [T-testing](https://amplitude.com/docs/feature-experiment/experiment-theory/analyze-with-t-test) for more information.
* **Bayesian**: A statistical method that compares groups by calculating the probability that one variant outperforms another. Unlike traditional methods that rely on p-values and fixed hypothesis testing, Bayesian statistics provides direct probability estimates that align with how teams make decisions. Bayesian methods excel when you want continuous insight into experiment performance. They're valuable when you need to incorporate prior knowledge, make decisions with smaller sample sizes, or require probability statements that directly answer business questions like "How likely is this variant to succeed?" Refer to [Bayesian Statistics](https://amplitude.com/docs/feature-experiment/experiment-theory/bayesian-statistics) for more information.
* **Thompson Sampling**: A [Bayesian](https://www.andrew.cmu.edu/course/18-847F/lectures/18687Nov182019.pdf) bandit approach that dynamically allocates more traffic to variants that appear to perform better. Instead of waiting until an experiment ends, Thompson Sampling balances exploration and exploitation in real time. This approach improves user experience by gradually sending more users to promising variants. It doesn't provide a classic p-value, but relies on posterior probabilities, making it a useful choice when you need adaptive decision-making.
### Confidence Level
The confidence level measures how confident Experiment is that it generates the same results for the experiment across repeated rollouts. The default confidence level of 95% means that 5% of the time, you might interpret the results as statistically significant when they're not. Lowering your experiment's confidence level makes it more likely that your experiment reaches statistical significance, but the likelihood of a false positive goes up. Don't go below 80%, because the experiment's results may no longer be reliable.
## Bucketing options
Specify how bucketing works in your experiment. You can specify:
* **Evaluation Mode**: Select whether Amplitude evaluates the experiment remotely on Amplitude servers or locally on your own machine. By default, Amplitude evaluates experiments remotely. Refer to [Performance and Caching](https://amplitude.com/docs/feature-experiment/under-the-hood/performance-and-caching) for more information.
* **Sticky Bucketing**: Specify whether to serve users the same variant after allocation, even if the rollout or targeting criteria change. When sticky bucketing is on, Amplitude doesn't re-bucket users when the targeting criteria change. The default is off. Refer to [Sticky Bucketing](https://amplitude.com/docs/feature-experiment/advanced-techniques/sticky-bucketing#how-sticky-bucketing-works) for more information.
* **Bucketing Salt**: A string value used as part of the hashing process. The bucketing salt assigns users deterministically into experiment variants. By combining the bucketing salt with identifiers such as the user ID and experiment key, Experiment generates a random-looking but repeatable hash that places each user into the same variant across sessions. Changing the bucketing salt reshuffles assignments and re-randomizes users for that experiment.
================================================================================
# Flag Prerequisites
URL: https://amplitude.com/docs/feature-experiment/advanced-techniques/flag-prerequisites
================================================================================
# Flag Prerequisites
When you run new experiments or roll out new feature flags, some features only apply to users if another feature is also enabled. Evaluate those dependencies first, then use the results in the evaluation of your flag or experiment.
Experiment lets you create dependencies for your flags and experiments on prerequisite flags or experiments.
## Configure flag prerequisites
Configure flag prerequisites in the Dependencies card for the feature flag. Go to *Experiment > Feature Flags > your feature flag* and scroll to the Dependencies card.
This card summarizes all dependencies for that feature flag, including its prerequisite flags, experiments, mutual exclusions, and holdout groups. The card also lists the flags and experiments that depend on it.
1. To configure new prerequisites, select the **edit** icon.
2. Select **Add Dependency** to add a new prerequisite flag or experiment.
3. Select **Select a flag or experiment**, then select the item you want.
{% callout type="note" %}
A flag or experiment qualifies as a prerequisite if:
- It's in the same project.
- It has a compatible evaluation mode. Local evaluation mode flags and experiments can only have local evaluation mode prerequisites. Remote evaluation mode flags and experiments can have both remote and local prerequisites.
You can't add a prerequisite that creates a circular dependency loop.
{% /callout %}
4. Select the variants the flag depends on. A special variant, `Off`, represents users that the prerequisite flag or experiment excludes.
5. Select **Save**.
## Workflow considerations
Before you activate a flag or start an experiment, confirm that prerequisite flags are active and that your variant assignment works as expected. You can't start the experiment until its prerequisite flags and experiments are active.
For flags and experiments with dependents, Amplitude blocks the following actions:
- Deleting a variant or changing a variant key if another flag or experiment depends on it.
- Archiving that flag or experiment.
## How evaluation works with prerequisite flags
This example shows how evaluation works when prerequisite flags exist.
For example, you want your new feature flag (Flag-B) to roll out only to users who first saw a different feature (Flag-A). In Flag-B, you add a dependency on the `On` variant of Flag-A and activate both flags.
When Amplitude evaluates users for Flag-B:
1. Amplitude checks if the user is in Flag-B's cohort.
- If the user belongs to the cohort, Amplitude serves the configured variant.
2. Amplitude then evaluates the user for dependencies, in this case Flag-A.
- If the user doesn't receive the `On` variant for Flag-A, Amplitude excludes them from Flag-B.
3. Amplitude then evaluates the user for Flag-B.
Targeting for Flag-B determines which variant (if any) the user receives. The flag dependency on Flag-A has no effect at this point.
## Prerequisites compared to user property targeting
You can achieve similar outcomes using either flag prerequisites or targeting rules based on `[Experiment]` user properties. The two approaches differ in important ways.
### Use `[Experiment]` user properties in targeting
When Amplitude assigns a user to a flag or experiment variant, Amplitude sets a user property in the format `[Experiment] <flag_key>` with the variant key as the value. You can reference this user property in another flag's targeting rules to target users based on their previous assignments.
Example: Target users where `[Experiment] Flag-A` equals `on`.
Limitations:
- Timing issues: Amplitude sets the `[Experiment]` user property when it ingests the assignment or exposure event. If you evaluate a dependent flag before the property syncs, the user may not match the targeting rule.
- No formal dependency tracking: The UI doesn't show the relationship between flags. You must manually track which flags depend on others.
- Potential inconsistency: Race conditions between property sync and flag evaluation can give users inconsistent experiences.
### Use flag prerequisites
Flag prerequisites formally define dependencies between flags. When you add Flag-A as a prerequisite for Flag-B, Amplitude evaluates Flag-A first and uses the result to determine Flag-B eligibility.
Advantages:
- Evaluated together: Amplitude evaluates prerequisites in sequence during a single evaluation call, which eliminates timing issues.
- Visible dependencies: The Dependencies card shows all relationships, making complex flag hierarchies easier to manage.
- Consistent bucketing: Users get consistent experiences because prerequisite evaluation happens atomically.
- Protected changes: Amplitude prevents you from archiving prerequisite flags or changing variant keys that other flags depend on.
### When to use each approach
| Use case | Recommended approach |
|----------|---------------------|
| Assign users to Flag-A before they see Flag-B | Flag prerequisites |
| Build release groups with sub-features | Flag prerequisites |
| Chain mutually exclusive experiments | Flag prerequisites |
| Target users exposed to a flag days or weeks ago | User property targeting |
| Analyze experiment results by previous flag exposure | User property targeting |
| Run ad-hoc segmentation for debugging | User property targeting |
## Common use cases
Flag prerequisites support many use cases. Common examples include:
### Release groups
Use flag prerequisites to build a primary feature with multiple sub-features. Sub-features require the primary feature to be `On` unless the cohort in a sub-feature individually includes the user. Amplitude applies the targeting and bucketing from the primary feature to every sub-feature that lists the primary feature as a prerequisite. Otherwise, the users receiving the primary feature and the sub-features wouldn't match.
Common use cases for release groups:
- Active development of large feature releases across many developers and teams.
- Provisioning users to primary SKUs with add-ons.
- Simplifying feature flag logic in code.

This example contains a `primary-feature` flag and `sub-feature` flags that list the primary feature as a prerequisite.
The `primary-feature` flag targets all users where the user property `premium` is `true` with 100% allocation. Sub-features only evaluate if the user has the required user property and meets the sub-feature's criteria. The exception is when the sub-feature individually includes the user, which typically occurs during a testing phase.
- The `sub-feature-1` flag adds targeting criteria for users where the user property `beta` is `true`. To receive `sub-feature-1`, a user must have both `premium` and `beta` user properties equal to `true`.
- The `sub-feature-2` flag allocates 100% of users. Amplitude assigns every user with `premium` equal to `true` to this feature.
- The `sub-feature-3` flag allocates 0% of users. Amplitude allocates no users to `sub-feature-3`, even if `premium` is `true`.
### Chained mutual exclusion groups
Use flag prerequisites to build complex hierarchies of mutually exclusive experiments that start at different times. Dependent experiments list a prerequisite on an existing active experiment evaluating to `off`. This rule targets all users that the existing experiment didn't allocate. Continue this chain to add more mutually exclusive experiments when the previous experiment doesn't allocate all users.

In this example, `experiment-1` runs now, and `experiment-2`, which is mutually exclusive to `experiment-1`, runs at a later time.
- The `experiment-1` experiment allocates 20% of users 50/50 control/treatment.
- The `experiment-2` experiment lists `experiment-1` as a prerequisite and allocates 100% of users 50/50 control/treatment.
Experiment assigns 20% of users to `experiment-1` and the remaining 80% to `experiment-2`. Experiment doesn't assign any user to variants for both `experiment-1` and `experiment-2`.
================================================================================
# Flag Dependencies
URL: https://amplitude.com/docs/feature-experiment/under-the-hood/flag-dependencies
================================================================================
# Flag Dependencies
Flag dependencies define relationships between flags to enforce evaluation order. Amplitude passes the result of each flag's evaluation to all subsequent evaluations to decide whether dependent flags [evaluate](https://amplitude.com/docs/feature-experiment/implementation#flag-dependencies) based on the result of the dependency.
Flag dependencies help implement:
- [Flag prerequisites](https://amplitude.com/docs/feature-experiment/advanced-techniques/flag-prerequisites).
- [Mutual exclusion groups](https://amplitude.com/docs/feature-experiment/advanced-techniques/mutually-exclusive-experiments).
- [Holdout groups](https://amplitude.com/docs/feature-experiment/advanced-techniques/holdout-groups-exclude-users).
## Flag prerequisites

*Available for flags and experiments.*
Flag prerequisites is a generic implementation of flag dependencies that lets any flag or experiment depend on any other flag or experiment. Web experiments can only depend on other web experiments. They don't support dependencies on feature flags or feature experiments. Prerequisite evaluation can check specific variants or target users that the prerequisite flag or experiment didn't include.
Use flag prerequisites to:
- Actively develop large feature releases with many developers and teams.
- Build provisioning for users to primary SKUs with add-ons.
- Simplify complex feature flag logic in code.
- Build complex hierarchies of mutually exclusive experiments that start at different times.
For more information, go to [Flag Prerequisites](https://amplitude.com/docs/feature-experiment/advanced-techniques/flag-prerequisites).
## Mutual exclusion groups

*Available for experiments only.*
A mutual exclusion group ensures that your users only join a single experiment. In Experiment, a mutual exclusion group defines multiple slots, each with a percentage of traffic allocated to that slot. The mutual exclusion group is a flag with a variant for each slot. Experiments in the group add a dependency on one or more variants of the mutual exclusion group flag.
Amplitude doesn't return the variant result of a mutual exclusion group's evaluation and doesn't assign it as a user property.
For more information, go to [Set up and run mutually exclusive experiments](https://amplitude.com/docs/feature-experiment/advanced-techniques/mutually-exclusive-experiments).
## Holdout groups

*Available for experiments only.*
A holdout group withholds a percentage of traffic from a group of experiments to measure the long-term and combined impact of multiple experiments. Experiment implements a holdout group with a flag that has two variants: `holdout` and `on`. Amplitude allocates the holdout percentage defined at group creation to the `holdout` variant. Experiments in the group depend on the holdout group's `on` variant.
Amplitude doesn't return the variant result of a holdout group's evaluation, but assigns it as a user property to enable holdout analysis.
For more information, go to [Holdout Groups](https://amplitude.com/docs/feature-experiment/advanced-techniques/holdout-groups-exclude-users).
## Local evaluation SDK support
Amplitude [SDKs](https://amplitude.com/docs/sdks) support flag dependencies (mutual exclusion and holdout groups) starting at the versions listed below.
{% callout type="warning" heading="Older local evaluation SDK versions" %}
Earlier local evaluation SDK versions don't consider mutual exclusion or holdout groups. Two experiments in a mutual exclusion group that an old local evaluation SDK version evaluates aren't mutually exclusive.
{% /callout %}
| SDK | Local evaluation flag dependencies support |
| --- | --- |
| [Node.js](https://amplitude.com/docs/sdks/experiment-sdks/experiment-node-js) | `1.4.0+` |
| [Ruby](https://amplitude.com/docs/sdks/experiment-sdks/experiment-ruby) | `1.1.0+` |
| [JVM](https://amplitude.com/docs/sdks/experiment-sdks/experiment-jvm) | `1.1.0+` |
| [Go](https://amplitude.com/docs/sdks/experiment-sdks/experiment-go) | `1.1.0+` |
| [Python](https://amplitude.com/docs/sdks/experiment-sdks/experiment-python) | `1.1.0+` |
| [PHP](https://amplitude.com/docs/sdks/experiment-sdks/experiment-php) | `1.0.0+` |
================================================================================
# Sequential testing for statistical inference
URL: https://amplitude.com/docs/feature-experiment/under-the-hood/experiment-sequential-testing
================================================================================
# Sequential testing for statistical inference
Experiment uses a sequential testing method of statistical inference. With sequential testing, results stay valid whenever you view them. You can end an experiment early based on observations made to that point. The number of observations you need to make an informed decision is, on average, much lower than the number you need with [T-tests](https://amplitude.com/docs/feature-experiment/experiment-theory/analyze-with-t-test) or similar procedures. You can experiment rapidly, incorporate what you learn into your product, and accelerate the pace of your experimentation program.
Sequential testing has several advantages over T-tests. Primarily, you don't need to know the number of observations necessary to achieve significance before you start the experiment. You can use both sequential testing and T-tests for binary metrics and continuous metrics. If you have concerns about long-tailed distributions affecting the Central Limit Theorem assumption, refer to this article about [outliers](https://amplitude.com/docs/feature-experiment/advanced-techniques/winsorization-in-experiment).
Given enough time, the statistical power of the sequential testing method is 1. If there is an effect size to detect, this approach can detect it.
This article explains the basics of sequential testing, how it fits into Amplitude Experiment, and how to make it work for you.
## Hypothesis testing in Amplitude Experiment
When you run an A/B test, Experiment conducts a hypothesis test using a randomized control trial. In this trial, Amplitude randomly assigns users to either a treatment variant or the control. The control represents your product in its current state. Each treatment includes a set of potential changes to your current baseline product. With a predetermined metric, Experiment compares the performance of these two populations using a test statistic.
In a hypothesis test, you look for performance differences between the control and your treatment variants. Amplitude Experiment tests the null hypothesis
$$
H_0:\ \delta = 0
$$
where
$$
\delta = \mu_{\text{treatment}} - \mu_{\text{control}}
$$
states there's no difference between the treatment's mean and the control's mean.
For example, you want to measure the conversion rate of a treatment variant. The null hypothesis posits that the conversion rates of your treatment variants and your control are the same.
The alternative hypothesis states that there is a difference between the treatment and control. Experiment's statistical model uses sequential testing to look for any difference between treatments and control.
There are many different sequential testing options. Amplitude Experiment uses a family of sequential tests called mixture sequential probability ratio test (mSPRT). The weight function, H, is the mixing distribution. The following mixture of likelihood ratios against the null hypothesis is such that.
## Common questions
{% accordion title="Why hasn't the p-value or confidence interval changed, even though the number of exposures is greater than 0?" %}
For uniques, Amplitude Experiment doesn't compute p-values and confidence intervals until there are at least 25 conversions and 100 exposures each for both the treatment and control.
For average totals and sum of property, Experiment waits until there are at least 100 exposures each for the treatment and control.
{% /accordion %}
{% accordion title="Why don't I see any confidence interval on the Confidence Interval Over Time chart?" %}
The thresholds haven't yet been reached.
For uniques, Experiment waits until there are at least 25 conversions and 100 exposures each for the treatment and control. After those thresholds, Experiment starts computing the p-values and confidence intervals.
For average totals and sum of property, Experiment waits until there are at least 100 exposures each for the treatment and control.
{% /accordion %}
{% accordion title="What are we estimating when we choose Uniques?" %}
Uniques measures whether your visitors fired a specific event. The result is the proportion of the population that has taken this action. Uniques is a comparison of proportions, or the conversion rates between treatment and control.
{% /accordion %}
{% accordion title="What are we estimating when we choose Average Totals?" %}
Average Totals counts the average number of times a visitor has fired an event. For each visitor, Experiment counts the number of times they took the action you're interested in, then averages that across the sample within both the control and treatment. The result is a comparison of the average totals between the treatment and control.
{% /accordion %}
{% accordion title="What are we estimating when we choose Average Sum of Property?" %}
Average Sum of Property sums the values of an event per user on a specific property. For example, if you want the total cart value of a user across all times, pick the event "add to cart" with the property "cart value." The result of this specific example is a comparison of the average cart value between treatment and control.
{% /accordion %}
{% accordion title="What is absolute lift?" %}
Absolute lift is the absolute difference between treatment and control.
{% /accordion %}
{% accordion title="What is relative lift?" %}
Relative lift is the absolute lift scaled by the mean of the control. Some people find this value useful to determine the relative change a treatment has with respect to the baseline.
{% /accordion %}
{% accordion title="Why does absolute lift exit the confidence interval?" %}
Occasionally, the absolute lift exits the confidence interval, which can cause confidence bounds to flip. This happens when the parameter you're estimating (for example, absolute lift) changes over time and the allocation for your treatment and control has changed. The underlying assumption in Experiment's statistical model is that the absolute lift and variant allocation don't change over time.
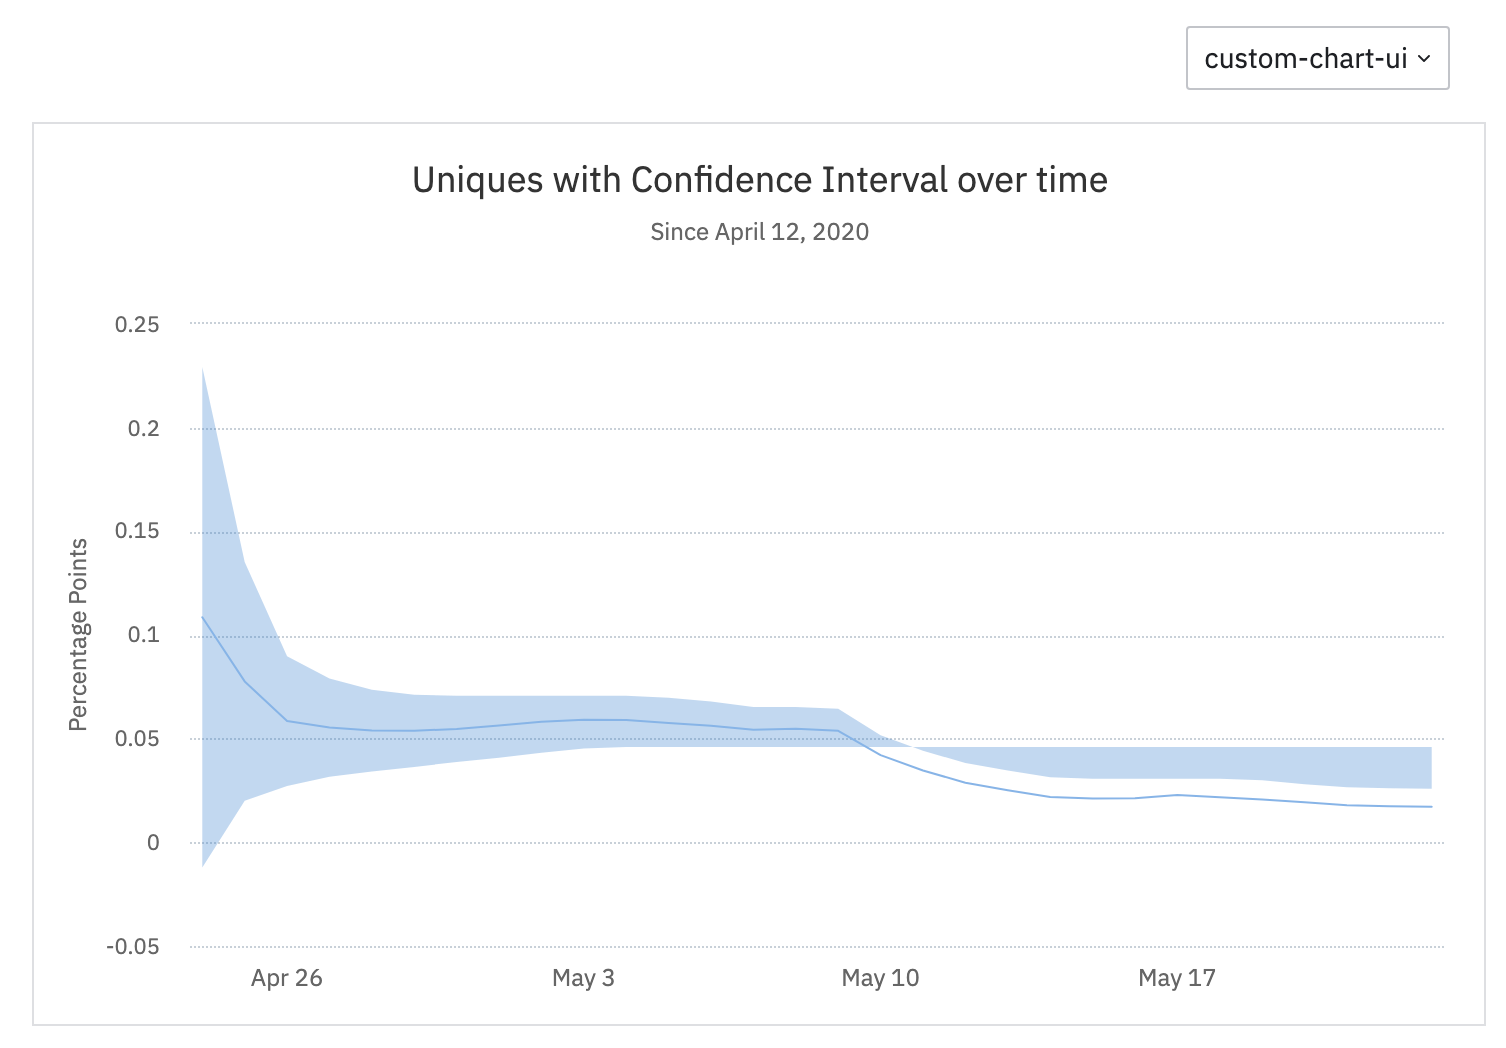
Experiment's approach incorporates symmetric time variation, which occurs when both the treatment and control maintain their absolute difference over time and their means vary in sync.
One option is to choose a different starting date (or date range) where the absolute lift is more stable and the allocation is static.
This pattern may also occur when there is a novelty effect or a drift in lift over time. Sequential testing allows for a flexible sample size. When there is a large time delay between exposure and conversion for your test metrics, don't stop the test before considering the impact of exposed users who haven't yet had time to convert. To address this:
- Compare the average time to convert for each variant using a funnel chart.
- Adjust the date range when analyzing the experiment results to include users who were exposed but converted after you stopped the test.
{% /accordion %}
{% accordion title="How does sequential testing compare to a T-test?" %}
Sequential testing lets you look at the results whenever you like. However, fixed-horizon tests such as T-tests can give you inflated false positives if you review results while your experiment is running.
The following visualization shows p-values over time in a simulation of 100 A/A tests for a particular configuration (alpha=0.05, beta=0.2). As Experiment ran a T-test on incoming data, results were reviewed at regular intervals. When the p-value falls below alpha, the test stops and you conclude that it has reached statistical significance.
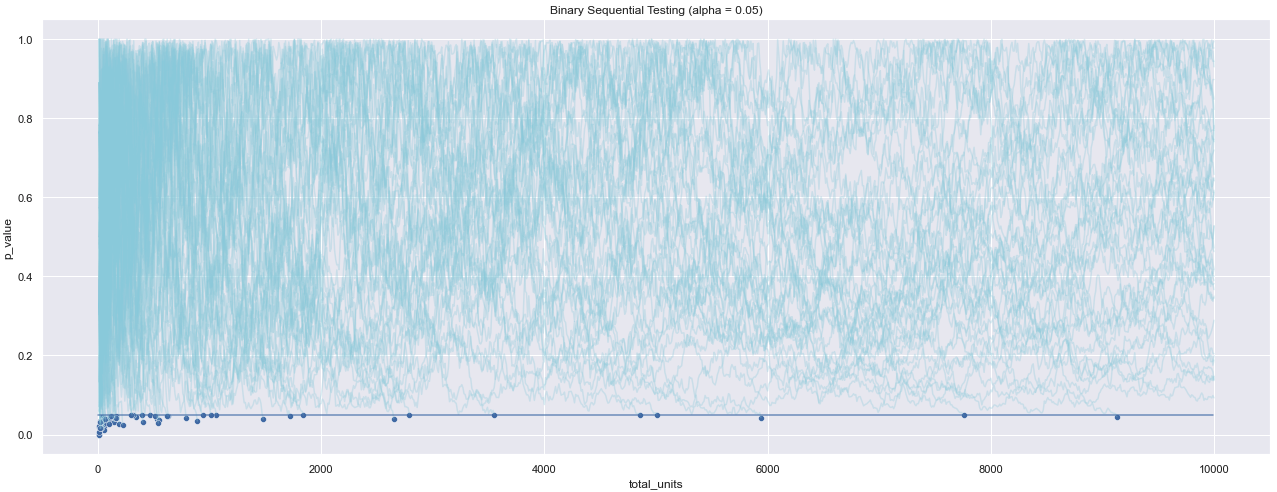
In this example, the p-values fluctuate, even before the end of the test when it reaches 10,000 visitors. By reviewing results early, you inflate the number of false positives. The following table summarizes the number of rejections recorded for different configurations of the experiment when a T-test runs.
| | alpha | beta | baseline | delta_true | num_reject |
| --- | ----- | ---- | -------- | ---------- | ---------- |
| 0 | 0.05 | 0.2 | 0.01 | 0.0 | 0 |
| 1 | 0.05 | 0.2 | 0.05 | 0.0 | 0 |
| 2 | 0.05 | 0.2 | 0.10 | 0.0 | 1 |
| 3 | 0.05 | 0.2 | 0.20 | 0.0 | 0 |
In the table, the baseline is the conversion rate of the control variant, and delta_true is the absolute difference between the treatment and the control. Because this is an A/A test, there is no difference. With alpha set to 0.05, the number of rejections far exceeds the threshold set for Type 1 error. If you peek at the results, num_reject should never be higher than 5.
Compare that to a sequential testing approach. In this example, there are again 100 A/A tests, and alpha is set to 0.05. Peeking at your results on a regular interval and the p-value goes below alpha. You can conclude that the test has reached statistical significance. As a result of using this statistical method, the number of false positives stays below this threshold.
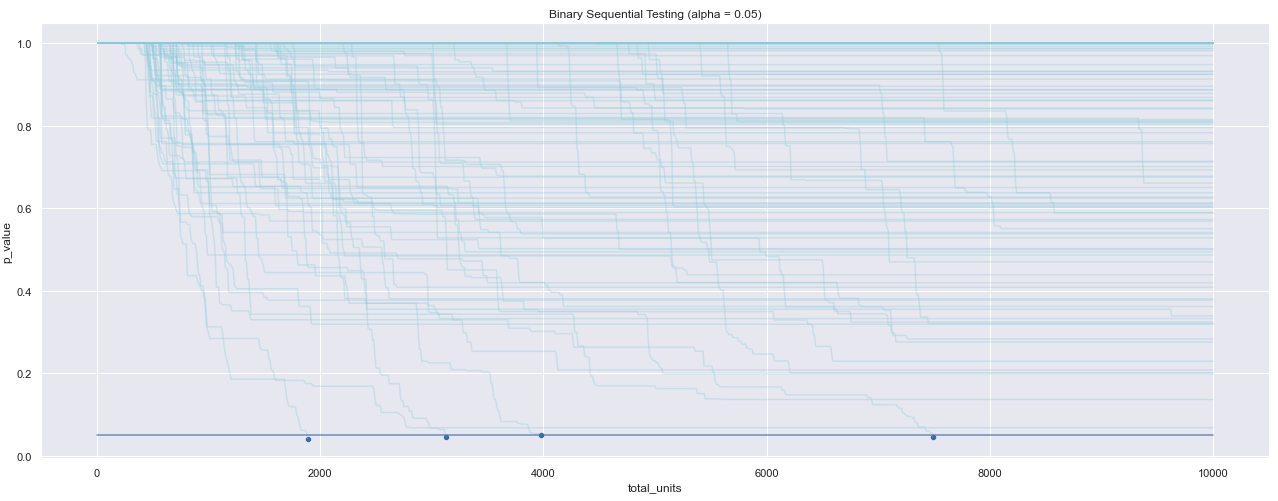
With always-valid results, you can end your test any time the p-value goes below the threshold. From 100 trials where alpha = 0.05, the number that fall below that threshold is 4, so Type 1 errors stay controlled.
The following table summarizes the number of rejections for different configurations of the experiment when you run a sequential test with mSPRT:
| | alpha | beta | baseline | delta_true | num_reject |
| --- | ----- | ---- | -------- | ---------- | ---------- |
| 0 | 0.05 | 0.2 | 0.01 | 0.0 | 0 |
| 1 | 0.05 | 0.2 | 0.05 | 0.0 | 0 |
| 2 | 0.05 | 0.2 | 0.10 | 0.0 | 1 |
| 3 | 0.05 | 0.2 | 0.20 | 0.0 | 0 |
Using the same basic configurations as before, the number of rejections (out of 100 trials) stays within the predetermined threshold of alpha = 0.05. With alpha set to 0.05, only 5% of the experiments yield false positives, compared to 30-50% when using a T-test.
{% /accordion %}
================================================================================
# Analyze your experiment data with the T-test
URL: https://amplitude.com/docs/feature-experiment/experiment-theory/analyze-with-t-test
================================================================================
# Analyze your experiment data with the T-test
A T-test compares the means of two data populations to decide if the difference is statistically significant. Amplitude uses the [Welch's T-test](https://en.wikipedia.org/wiki/Welch%27s_t-test), which makes a few assumptions about your dataset:
* The [Central Limit Theorem](https://en.wikipedia.org/wiki/Central_limit_theorem) applies to the metric.
* Neither population shares the same variance.
* You don't run the T-test until you reach the sample size specified by the duration estimator.
{% callout type="tip" heading="Looking for a Z-test?" %}
T-test supports many of the same options as a Z-test.
{% /callout %}
Conduct a T-test as either:
* Two-sided: looks for any change in the metric, in either direction.
* One-sided: looks for an increase or a decrease, but not both.
T-tests work for both binary and continuous metrics.
A two-sided test doesn't explicitly state a statistically significant increase or decrease, while a one-sided test does. If you select *Increase*, the upper confidence interval bound is positive infinity. For *Decrease*, the lower confidence interval bound is negative infinity.
{% callout type="note" %}
If you haven't run your experiment, or your sample size is large enough, use sequential testing instead of a T-test. Read more about the difference in testing options [in this blog](https://amplitude.com/blog/sequential-test-vs-t-test).
{% /callout %}
## Configure T-test settings
Access the T-test settings from the *Settings* tab. The required settings depend on the T-test type you want to run and the direction you want the metric to move. To configure your T-test:
1. Edit the *Goals* panel, then select *Increase* or *Decrease* for your metric.
2. Open the *Analysis Settings* panel. Go to *Stats Preferences > Advanced*. Select the *T-test* stats method. Choose *1-sided* or *2-sided* based on the T-test type you want to run. For example, to run a two-sided T-test looking for an increase, select *Increase* in the primary metric and *2-sided T-test* in statistical settings.
3. Enter the number of users needed under *Samples Per Variant Needed*. If you don't know which sample size to enter in *Samples Per Variant*, use Amplitude's duration estimator. To learn more, refer to the Help Center article on [planning experiments with the duration estimator](https://amplitude.com/docs/feature-experiment/workflow/experiment-estimate-duration).
{% callout type="note" %}
The T-test first computes the sample size you need to control for a specific false positive and false negative rate. Analyzing your data before reaching the sample size threshold increases your error rates. Review this [article](https://medium.com/@SkyscannerEng/the-fourth-ghost-of-experimentation-peeking-b33890dcd3de) for more explanation on how peeking can interrupt your experiment process.
{% /callout %}
4. Select **Save** to change the statistical settings to T-test.
## Manage sample size needed for the T-test
You must reach a minimum sample size before you run a T-test. Experiment warns you if your dataset is too small.
The Cumulative Exposure graph and its table show your sample size requirements. The graph shows a constant, dotted line named Sample Size Target, which represents the total number of users needed for each variant. The table next to the graph highlights the Exposure Remaining, which is the number of users each variant still needs. This information confirms the number of users needed before running the T-test, and provides an estimate of the time the experiment needs before you use a T-test to interpret your results.
Reaching the needed sample size doesn't guarantee statistically significant results. For example, if your lift is smaller than the MDE, your results often aren't statistically significant.
## Common questions
{% callout type="note" %}
This section applies to [A/B tests in a Funnel Analysis chart](https://amplitude.com/docs/analytics/charts/funnel-analysis/funnel-analysis-ab-test). It doesn't apply to the Experiment Results chart or to end-to-end experimentation in Amplitude Experiment.
{% /callout %}
### How does Amplitude calculate improvement over baseline?
Improvement over baseline is the ratio of the mean of the variant (A) over the mean of the baseline (B): `mean(A) / mean(B)`.
For each group, Amplitude calculates the mean as `k / n`, where `k` is the number of conversions and `n` is the sample size.
### Why do calculations use unique conversions instead of totals?
Amplitude uses unique conversions instead of totals when checking for statistical significance. Totals make false assumptions about a user's behavior in the funnel. The aggregate sum assumes that each time a user enters the funnel is independent of the previous time. That assumption isn't valid when calculating statistical significance, although totals can still help with other analyses in the [Experiment Results chart](https://amplitude.com/docs/analytics/charts/experiment-results/experiment-results-dig-deeper) or [end-to-end Amplitude Experiment](https://amplitude.com/docs/feature-experiment/overview).
### How does Amplitude calculate statistical significance?
Amplitude uses standardized statistical methods to calculate statistical significance. The method varies by feature: sequential testing or a two-tailed T-test. By default, Amplitude Experiment and the Experiment Results chart use sequential testing, while the Funnel Analysis chart uses the two-tailed T-test. When you compare analyses, p-values may not match across charts that use different testing methods.
For both methods, Amplitude uses a 5% false-positive rate by default. The threshold for significance is `(1 - p_value) > 95%`. You can change the false-positive rate in [Amplitude Experiment](https://amplitude.com/docs/feature-experiment/workflow/finalize-statistical-preferences). You can't change it in the Funnel Analysis chart.
To help reduce false positives, Amplitude requires a minimum sample size before declaring significance: 30 samples, five conversions, and five non-conversions for each variant. Amplitude automatically treats tests that don't meet these minimums as not statistically significant.
================================================================================
# Bayesian Statistics
URL: https://amplitude.com/docs/feature-experiment/experiment-theory/bayesian-statistics
================================================================================
# Bayesian Statistics
Bayesian statistics compares groups by calculating the probability that one variant outperforms another. Unlike traditional methods that rely on [p-values](https://en.wikipedia.org/wiki/P-value) and [fixed hypothesis](https://amplitude.com/docs/feature-experiment/overview#create-a-hypothesis) testing, Bayesian statistics provides direct probability estimates that align with how teams make decisions.
## How Bayesian analysis works
Bayesian methodology uses three core concepts to evaluate experiment results:
- Priors: your initial expectations about a parameter or hypothesis before you collect data. Amplitude Experiment uses uninformative priors to remain neutral about expected outcomes. For binary metrics, Amplitude uses a Beta(1,1) prior (a uniform distribution). For continuous metrics, Amplitude uses an uninformative normal prior.
- Likelihoods: the probability of observing the collected results given a particular set of parameter values. As users interact with your variants, the likelihood function incorporates the observed data into the analysis.
- Posteriors: the result of combining priors with observed likelihoods to produce updated beliefs about experiment outcomes. The posterior distribution shows the most likely values and the uncertainty around those estimates. The posterior forms the basis for all metrics in Amplitude Experiment, including relative lift, absolute lift, and variant means.
With Bayesian methodology, you can test whether the control mean differs from the treatment mean. Rather than setting an arbitrary significance threshold, you examine the entire distribution of possible outcomes and make decisions that fit your business goals and risk tolerance.
Bayesian statistics treats experimentation as an ongoing process of learning and updating expectations. As you gather more data, the posterior distribution refines to reflect your accumulated knowledge. This approach supports more responsive decisions based on market changes and customer preferences.
### Key Bayesian concepts
Review the following concepts to understand Bayesian statistics:
- Chance to Beat Control: the probability that the treatment variant performs better than the control. This differs from the frequentist p-value, which only tells you the probability of seeing your results (or more extreme results) if no true effect exists. Bayesian analysis answers the more intuitive question: "What's the probability this variant is actually better?"
- Credible Interval: the range where the difference between treatment and control means lies with a specified probability. Unlike confidence intervals in frequentist statistics, Bayesian credible intervals directly describe the likely values of the parameter. A 95% credible interval means there's a 95% probability the true difference falls within that range.
- Chance to Be Best: appears when your experiment includes more than two variants. This metric shows the probability that each variant outperforms all other variants. With only two variants, this metric equals the Chance to Beat Control.
### When to use Bayesian statistics
Bayesian methods work well when you want continuous insight into your experiment's performance. They're valuable when you need to incorporate prior knowledge, make decisions with smaller sample sizes, or require probability statements that directly answer business questions like "How likely is this variant to succeed?"
For teams running standard product experiments with straightforward decision criteria, Amplitude Experiment defaults to sequential testing, which offers fast results with strong false positive control. You can switch to Bayesian analysis at any point to gain additional perspective on your experiment outcomes.
## Set up Bayesian statistics
To use Bayesian statistics for your experiment, complete the following steps:
1. Go to your *Experiments* page.
2. Open an existing experiment or click **Create Experiment**.
3. Scroll to *Advanced (Optional)* settings, then click **Stats Preferences**.
4. Click the **Statistical Method** dropdown and select **Bayesian**.
If your experiment is already running, switch to Bayesian analysis in the Experiment Results Chart. Click the gear icon, then *Statistical Method*, then select **Bayesian**.
### Configure the Chance to Outperform Threshold
You can adjust the Chance to Outperform Threshold from 0% to 100%. Because Amplitude conducts a [two-tailed Bayesian test](https://www.statsig.com/perspectives/twotail-hypothesis-definition-examples-applications), setting this threshold at 95% means your experiment reaches significance when the chance to outperform meets or exceeds 97.5%, or falls at or below 2.5%. This corresponds to a 95% credible interval.
### How posterior-based metrics work
All metrics in Bayesian analysis (relative lift, absolute lift, and mean values) come from the posterior distribution. For example, with one exposure and zero conversions, the control mean displays as 33.3% because the prior adds one conversion and one non-conversion, producing a posterior mean of `(0+1) / (1 + 1 + 1)`.
To view the mean without the prior distribution's influence, hover over the metric in the Analysis section. The mean over time chart shows the posterior mean in cumulative view and the raw mean of the data in non-cumulative view.
### Minimum data requirements
To produce reliable results, Amplitude Experiment applies minimum thresholds before showing credible intervals and Chance to Beat Control:
- Binary metrics: at least 25 conversions and 100 exposures in each variant.
- Numeric metrics: at least 100 exposures in each variant.
## False positive control and multiple comparisons
Bayesian statistics doesn't guarantee false positive control in the traditional sense. Amplitude disables Bonferroni correction when you use this method. Instead, Bayesian analysis controls expected loss, providing a more nuanced approach to decision-making under uncertainty. This approach follows established research on Bayesian multiple comparison methodology.
## Custom priors
Click the 3 vertical dots icon for each metric. Then toggle on the "Customize the Prior". Set the parameters of the prior.
## Limitations
Amplitude Experiment's Bayesian implementation doesn't support CUPED (variance reduction).
================================================================================
# Multi-armed bandit experiments
URL: https://amplitude.com/docs/feature-experiment/workflow/multi-armed-bandit-experiments
================================================================================
# Multi-armed bandit experiments
In a traditional A/B test, Amplitude Experiment assesses all the variants in your experiment until it reaches a statistically significant result. From there, you can choose to roll out the winning variant, or roll all users back to the control variant. Your decision depends on why a particular variant outperformed the others.
Sometimes, that reason isn't relevant. You want to identify the best-performing variant and send as much traffic to it as possible. For example:
- [Optimizing hero images, messaging, or color changes to UI elements](https://amplitude.com/docs/web-experiment/set-up-a-web-experiment).
- In-product layout changes, like information hierarchy or order of operations.
- Optimizing menus or navigation.
- Ad optimization for seasonal or time-sensitive promotions or events.
- Hyperparameter tuning for ML models.
Unlike a traditional A/B test, multi-armed bandits don't use statistical significance to determine success. They also don't use a control or baseline variant. Amplitude Experiment also displays results differently for the two experiment types. A later section covers those differences.
Multi-armed bandit experiments use [Thompson sampling](https://en.wikipedia.org/wiki/Thompson_sampling). Amplitude Experiment doesn't support other statistical methodologies for multi-armed bandits.
## Before you begin
- You can evaluate multi-armed bandit experiments locally or remotely.
- You can configure multi-armed bandit experiments to reallocate traffic hourly, daily, or weekly.
- Amplitude Experiment requires at least 100 exposures in each variant before it reallocates traffic.
- Multi-armed bandits respect all mutual exclusion groups and holdouts that you associate with them.
- The flag config history shows each reallocation. Amplitude makes entries under the user `ampex_data_monster`.
## Reallocation schedule
Reallocation runs at fixed times, not relative to the experiment start date. The schedule depends on the reallocation frequency you choose. You can't configure these times.
## Create a multi-armed bandit experiment
Creating a multi-armed bandit experiment is almost identical to [creating an A/B test in Amplitude Experiment](https://amplitude.com/docs/feature-experiment/overview). The next section covers the differences.
## Differences between multi-armed bandits and A/B tests
### Metrics
A multi-armed bandit experiment requires a primary metric. Amplitude Experiment uses the primary metric to optimize your experiment. You can include secondary metrics, but Amplitude Experiment uses them for reporting only.
In an A/B test, your primary metric can be a guardrail metric: a metric that you don't want your experiment to negatively affect. Clickthrough rate is a common guardrail metric. A multi-armed bandit experiment optimizes for a metric, so a guardrail metric doesn't apply. You can't optimize for a change you don't want to occur. Primary metrics for multi-armed bandit experiments must be success metrics ("will increase" or "will decrease"). Amplitude Experiment supports both binary metrics and continuous metrics.
To optimize two metrics in your multi-armed bandit experiment, create a custom metric that's a weighted average of both. If you face a tradeoff between metrics you want to optimize, run an A/B test instead.
### Traffic allocation
Allocation for a multi-armed bandit experiment always begins with a uniform distribution, because the model can't know which variant is most effective before it collects data. The allocation changes after data starts arriving.
A multi-armed bandit adjusts the allocation between the variants only. It doesn't adjust the percentage rollout.
### Confidence level
The confidence level in a multi-armed bandit experiment has a different role than in an A/B test. The confidence level can accelerate traffic to the winning variant. For example, if your experiment's confidence level is 95%, and the multi-armed bandit has already allocated at least 95% of the experiment's traffic to the winning variant, Amplitude Experiment assumes confidence and allocates 100% of traffic to that variant from that point on.
### Duration estimate and MDE
In multi-armed bandit experiments, the minimum detectable effect (MDE) helps calculate the duration estimate. These experiments are automated and optimize for a metric, so the MDE doesn't affect the experiment after it starts running.
When calculating the duration estimate before the experiment starts, Amplitude Experiment simulates what happens when all variants except one share the same baseline mean (computed from historical data). When measuring an increase, the exception variant has `mean * (1+MDE)`. When measuring a decrease, the exception variant has `mean * (1-MDE)`. Amplitude Experiment then calculates how long the multi-armed bandit might take to assign all traffic to one variant. The duration estimate caps at 31 days.
### Displayed results
Amplitude Experiment doesn't display variant jumping while a multi-armed bandit runs, because variant jumping is expected behavior in these experiments.
Amplitude Experiment doesn't display the data quality card for multi-armed bandit experiments. Most checks for this display don't apply to this experiment type. You can't make changes to the experiment that affect traffic allocation while the experiment runs.
The Bandits card resembles the non-cumulative exposure chart in the Monitor card, but normalizes to 100%. The Bandits card lets you visualize the percentage of traffic each variant receives on a given day.
## Notifications
Amplitude Experiment sends notifications to experiment editors when a multi-armed bandit allocates 70%, 80%, 90%, or 100% of traffic to a variant. Amplitude Experiment also sends a notification if the bandit takes a long time to complete or if the experiment's end date arrives. Notifications can go through Slack or email. For more information, go to [Integrate Slack with Amplitude](https://amplitude.com/docs/analytics/integrate-slack).
To configure your notifications, go to *Settings > Personal settings > Notifications*.
================================================================================
# Winsorization in Experiment
URL: https://amplitude.com/docs/feature-experiment/advanced-techniques/winsorization-in-experiment
================================================================================
# Winsorization in Experiment
Outliers are data points that occur on the far fringes of a dataset. These data points typically rest far from measurements of central tendency like the mean, and can skew an analysis.
Outliers in your dataset sometimes result from instrumentation issues. For example, if your users primarily interact with your app through their mobile devices, but your web instrumentation sends event properties at a different rate (milliseconds) than iOS and Android instrumentations (seconds), the data from web-based users may look like outliers.
[Outliers can also appear for many other reasons, some of which you can't control.](https://medium.com/@pingsubhak/all-you-need-to-know-about-outliers-causes-types-and-methods-to-detect-them-0c331f9ec328)
## Find outliers in your data
You can often spot outliers by examining the tails of a histogram, but no single correct method defines what counts as an outlier.
One common method uses standard deviations from the mean. This works well if your data aligns with a normal distribution. If it does, [you can expect 68 percent of your data points to fall within one standard deviation](https://en.wikipedia.org/wiki/68%E2%80%9395%E2%80%9399.7_rule#:~:text=In%20statistics%2C%20the%2068%E2%80%9395,two%2C%20and%20three%20standard%20deviations), 95 percent within two, and 99.7 percent within three. Depending on your situation, you might decide that anything more than three standard deviations out is an outlier.
{% callout type="note" %}
Standard deviation can be sensitive to outliers. As skew in the distribution increases, so does the sample size you need to ensure the sample mean approaches a normal distribution. In datasets with fewer than millions of users, you can't always assume the sample mean has a normal distribution.
{% /callout %}
Boxplots are another way to identify outliers. Boxplots calculate the "inner fences" for outliers using the 25th percentile (Q1) and the 75th percentile (Q3):
* Upper Bound: `75th percentile + 1.5 * (75th percentile - 25th percentile)`.
* Lower Bound: `25th percentile - 1.5 * (75th percentile - 25th percentile)`.
[Refer to this article for a more advanced version that accounts for skewed distributions](https://www.sciencedirect.com/science/article/abs/pii/S0167947307004434).
You can also choose a specific percentile and designate everything beyond it as an outlier. Don't do this at random. Examine the plot of your dataset first, and work from there.
The correct definition for an outlier varies from case to case and often depends on your business use case. Use your domain knowledge to decide what counts as an outlier.
Amplitude's outlier analysis depends on the type of metric you're using. For example, binary metrics like uniques and retention don't have outliers, so the methods below don't apply to them.
## Outlier examples
The following example shows how outliers can distort your analysis. In a dataset of {1, 2, 5, 1000}, `1000` is the obvious outlier. Without this data point, the mean is 2.67. With it, the mean becomes 252. This is technically correct, but it misrepresents the dataset's actual character.
In this example, including an outlier in the dataset removes the statistical significance you'd get without it:
```r
set.seed(29)
control = rnorm(100)
treatment = rnorm(100, 3)
t.test(control, treatment)
treatment_with_outlier = c(rnorm(100, 3), -1000)
t.test(control, treatment_with_outlier)
```
Without the outlier, the p-value is basically 0. With the outlier, the p-value is .495.
| | Mean | Standard deviation |
| --- | --- | --- |
| With outlier | -6.92 | 99.81 |
| Without outlier | 3.01 | 1.14 |
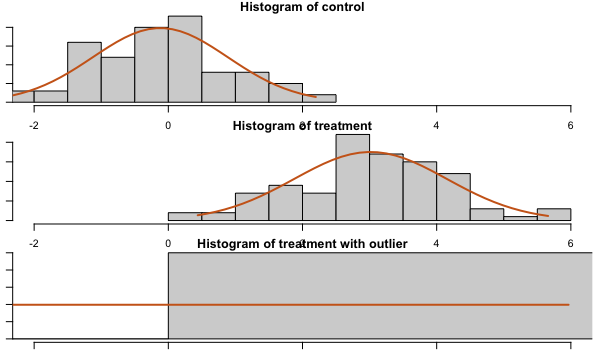
This is the distribution of the population, not the distribution of the sample mean.
{% callout type="note" %}
Instead of using means, you can use percentiles such as the median, which are more resistant to outliers.
{% /callout %}
## Resolve outliers in your data
Options to address long-tailed distributions include winsorization, removing outliers, bootstrapping, and non-parametric tests. Winsorization and removing outliers reduce skew, which allows a smaller sample size where the sample mean approximates a normal distribution (the [Central Limit Theorem](https://en.wikipedia.org/wiki/Central_limit_theorem)).
The best approach to handling outliers often depends on the type of metric you're using. This section covers options for several common metric types.
### Totals
When you use a totals metric, you have several options for resolving outliers.
#### Visualization and deeper analysis
Visualizing your data is often a good starting point. For example, create a segmentation chart of your dataset and select **Frequency** to find out if certain users trigger a particular event more often than most other users. Next, change the frequency chart into a bar chart to view it as a histogram. Adjust the bin size as needed.
Session replays can also help you understand why certain users act as outliers. First, define the number of times a user must trigger an event to qualify as an outlier. Then look for sessions where a user triggered the event enough to meet that threshold. Pay attention to how their behavior differs from other users to understand why they're outliers.
This approach helps when debugging a spike in event volume for a particular event. A small number of users might be responsible for the spike, which suggests a different interpretation than if the activity is evenly distributed across your user base.
#### FREQPERCENTILE
Continue analyzing your frequency chart by using this formula in a segmentation chart to get percentiles.
#### Computations
Use a computation to aggregate the count of events. Examine the distribution and individual user values in the charts, search to find specific values, and sort the sample to determine the range of valid values.
#### Winsorizing
Winsorizing transforms data by limiting extreme values to reduce the effect of outliers. A complete explanation of the process is beyond the scope of this article. This section explains how to apply winsorizing to outliers in Amplitude.
For example, to find out how many charts the average user creates when some power users create many more than most users, winsorize at a reasonable value (learn more about how to select a winsorization value here). For this example, the value is 100. Open a segmentation chart, select *Formula* from the *Measured As* block, and enter this formula:
`(TOTALS(A1) + 100*UNIQUES(A2)) / (UNIQUES(A1) + UNIQUES(A2))`
In this formula, only event A for segment 2 is winsorized (`100 * UNIQUES(A2)`). Amplitude counts the number of users subject to winsorization, then multiplies by the winsorization value selected in the first step (100 in this case).
You have several options for picking your winsorization value. A good starting point is to refer to your visualization and look for a cutoff point that separates the data into two distinct modes:
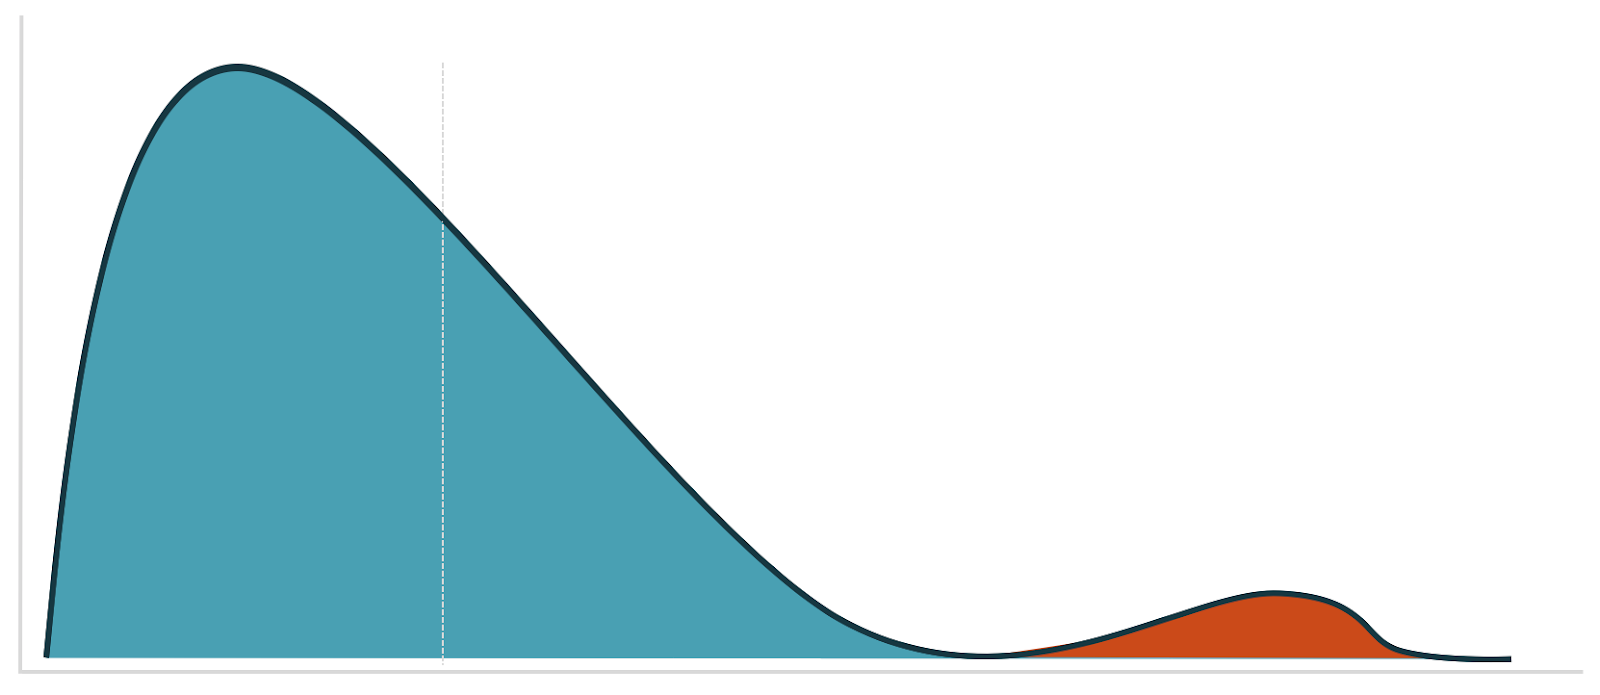
#### Filtering out users
Use the [Experiment Results chart](https://amplitude.com/docs/analytics/charts/experiment-results/experiment-results-dig-deeper) to filter out users who triggered the event more than a specified number of times. Add a *who performed* filter to each chart segment. To get a pre-filled Experiment Results chart, select *Open in chart* on the Analysis card in Amplitude Experiment.
### Sum of property
#### Winsorization
When it's difficult to know the best value for winsorization, use [derived properties](https://amplitude.com/docs/data/derived-properties) to help you:
* Run both min and max winsorization, together or separately, by creating a derived property of `min(max(1, X), 100)`, where X is the property you're interested in, and 1 and 100 are the lower and upper values for X.
* Use derived properties for transformations. For instance, `POWER(x, .5)` gives you a square root. Other transformations that reduce skew are `log`, `sqrt`, or a [Box Cox](https://onlinestatbook.com/2/transformations/box-cox.html) transformation.
{% callout type="note" %}
Some of these transformations require positive data only. To work around this, add the minimum plus a small number to each data point. You can also use the [Yeo-Johnson transformation](https://www.stat.umn.edu/arc/yjpower.pdf).
{% /callout %}
#### Visualize with a histogram
As with the frequency chart, adjust the bin sizes to visualize outliers at the event level. Depending on the size of the value range, change the range of the examined data to zoom into different parts of the histogram. The last bin in the histogram is larger than the other bins to account for outliers, so the rightmost bar is often taller than the others.
Then use the [Microscope](https://amplitude.com/docs/analytics/microscope) to view session replays for these users. You can also use the filters on the session replay page to gain more insight into a user who, for example, spends $1000 when most people spend $50.
#### PERCENTILE
Use the [PERCENTILE formula](https://amplitude.com/docs/analytics/charts/event-segmentation/event-segmentation-custom-formulas#percentile) to view the percentiles of the event property at a per-event level.
#### Computations
Create a computation that's a sum of a property, then explore the charts at the bottom of the page.
#### Filter out users
Use the computation in a cohort and filter out users who generate the outliers. You can also create a cohort with a total sum of property filter, then filter out users in that cohort. You can do this in both Amplitude Experiment and Amplitude Analytics.
#### Winsorization in Amplitude Analytics
Open a segmentation chart, select *Formula* from the *Measured As* block, and enter this formula:
`(PROPSUM(A1) + W*UNIQUES(A2)) / (UNIQUES(A1) + UNIQUES(A2))`
Where `W` is your winsorization value.
*Who performed* doesn't support `propsum`, but you can create a cohort with a total sum of property, then add that cohort as a segment filter.
### Average of property
All methods listed for `sum of property` events work for `average of property` events. Replace `sum` with `average`.
### Funnel totals
Approximate this as totals of the last step of the funnel.
### Sum of last step of funnel
Approximate this as a prop sum of the last step of the funnel.
### Prop min / prop max
Cohorts don't support prop min or prop max, but computations do. Add filters on computations in the segment controls to access them.
## Winsorization in Experiment
Amplitude Experiment supports max winsorization for all metric types except uniques, funnel uniques, and retention. Winsorization is only available for users on Enterprise plans.
When you turn winsorization on, Amplitude Experiment applies it at the per-metric level. Change the default value to the value you want to use for winsorization.
In the metrics table, hover over the cell to view how many users were winsorized.
As a best practice, avoid winsorizing more than 5% of your data. For example, if 10% of your data are outliers, investigate that group separately and run two different analyses. You can also find out if there are more outliers in one variant than another. For formula metrics, Amplitude applies the same winsorization value to each term.
## Log transform in Experiment
Like winsorization, Amplitude Experiment also supports log transforms as an alternative for handling outliers. Log transforms are only available for users on Enterprise plans.
When you enable log transforms, Amplitude Experiment applies the log transformation at a per-metric level. It uses logarithm with base `e`. Experiment uses `ln(1+x)` to handle the case where `x = 0`. `x` is the metric value for a particular user. If `1+x <= 0`, Experiment returns `0` for the metric value for that individual user.
If you enable both winsorization and log transform, Amplitude applies winsorization first, then the log transform.
## Related resources
- [Block bot web traffic](https://amplitude.com/docs/data/block-bot-traffic): Prevent bot traffic from affecting your metrics.
- [Block and filter internal users](https://amplitude.com/docs/data/troubleshooting/instrumentation-issues#block-and-filter-internal-users): Exclude internal user data from your metrics.
================================================================================
# Admin
URL: https://amplitude.com/docs/admin
================================================================================
# Admin
Administer your Amplitude organization by managing users, permissions, single sign-on, billing, and API access. Use the admin area to invite and deactivate users, set role-based permissions, configure SSO and SCIM, rotate API keys, track MTU usage, and review the audit log.
{% outcomes heading="Administer Amplitude" %}
{% outcome icon="Users" title="Get the right people in, fast" href="https://amplitude.com/docs/admin/account-management/manage-users" %}
Invite, assign, and deactivate users so your team has the access they need and nothing more.
{% /outcome %}
{% outcome icon="ShieldCheck" title="Sign in with corporate credentials" href="https://amplitude.com/docs/admin/single-sign-on/sso" %}
Connect Amplitude to your identity provider so users skip a password and IT keeps control.
{% /outcome %}
{% outcome icon="ShieldCheck" title="Match access to responsibility" href="https://amplitude.com/docs/admin/account-management/role-based-access-controls-rbac" %}
Use role-based access controls to grant each user only the actions their job requires.
{% /outcome %}
{% outcome icon="ClipboardList" title="Stay ahead of your plan" href="https://amplitude.com/docs/admin/billing-use/mtu-guide" %}
Watch MTU and usage trends so renewal and overage conversations never come as a surprise.
{% /outcome %}
{% outcome icon="Eye" title="Know who changed what" href="https://amplitude.com/docs/admin/audit-log" %}
Use the audit log to investigate incidents and prove compliance when auditors come knocking.
{% /outcome %}
{% outcome icon="Code" title="Keep API keys safe and rotatable" href="https://amplitude.com/docs/admin/account-management/manage-your-api-keys-and-secret-keys" %}
Find, rotate, and revoke the keys that authorize data ingestion and access before they leak.
{% /outcome %}
{% /outcomes %}
## Manage organization access
Start with the account controls that define who has access to Amplitude and what each team can change.
- [Manage users](https://amplitude.com/docs/admin/account-management/manage-users) to invite teammates, assign seats, and deactivate accounts.
- [Manage organizations and projects](https://amplitude.com/docs/admin/account-management/manage-orgs-projects) to structure work across products, environments, and teams.
- [Create permission groups](https://amplitude.com/docs/admin/account-management/manage-permission-groups) to reuse access patterns for groups of users.
- [Review role-based access controls](https://amplitude.com/docs/admin/account-management/role-based-access-controls-rbac) to match permissions to each user's responsibilities.
## Protect account operations
Use security, billing, and audit tools to keep the organization aligned with internal requirements.
- [Set up single sign-on](https://amplitude.com/docs/admin/single-sign-on/sso) so users authenticate through your identity provider.
- [Configure SCIM provisioning](https://amplitude.com/docs/admin/account-management/scim-provision) to keep account access in sync with your directory.
- [Monitor the audit log](https://amplitude.com/docs/admin/audit-log) to investigate changes across projects and settings.
- [Track monthly tracked users](https://amplitude.com/docs/admin/billing-use/mtu-guide) to understand usage and billing trends.
{% academy-link
title="Amplitude Analytics Admin Essentials"
url="https://academy.amplitude.com/amplitude-analytics-admin-essentials"
description="Learn essential steps and best practices for setting up and administering Amplitude"
/%}
================================================================================
# Monthly tracked users (MTUs) billing guide
URL: https://amplitude.com/docs/admin/billing-use/mtu-guide
================================================================================
# Monthly tracked users (MTUs) billing guide
A monthly tracked user (MTU) is a unique user who triggers at least one event in a calendar month, and your MTU count is the basis for Amplitude billing on MTU-priced plans. Amplitude identifies anonymous users by device ID and known users by user ID, and counts a user who appears in multiple projects as a single MTU.
If an anonymous user later logs into the site, Amplitude merges all events triggered while the user was anonymous under their user ID. The merged user counts as a single MTU.
Amplitude calculates MTU usage daily, with one final calculation after the end of the calendar month to accommodate late-arriving events. After the final calculation, Amplitude no longer updates the MTU count to reflect later user merges caused by identify calls on anonymous users.
Your MTU count doesn't increase due to user mapping, identify calls, or group identifies.
All Amplitude plans support MTU-based pricing. Customers who use sampling aren't eligible for MTU-based pricing.
{% callout type="note" heading="Events that don't count toward MTUs" %}
`[Experiment] Exposure` and `[Experiment] Assignment` events don't count toward your organization's MTU count. Amplitude uses these events for experiment analysis and monitoring but they don't affect your billing.
{% /callout %}
## Track your MTUs
The first step in setting up MTU tracking is to understand [how Amplitude tracks unique users](https://amplitude.com/docs/data/sources/instrument-track-unique-users). The best way to ensure accurate counting of MTUs is to support a one-to-one correlation between user IDs and actual users.
{% callout type="note" %}
If you're using test data and generating fictitious user IDs for testing, each test user is also included in your MTU count.
{% /callout %}
### Estimate your MTUs
If you haven't implemented tracking yet, you can use your monthly active user (MAU) count to estimate your current MTU usage. These counts are usually similar if they account for anonymous visitors identically.
## View your MTU use
To view your MTU usage, navigate to _Settings > Organization Settings > Plans & Billing_. MTU statistics are visible in their own panel.
{% callout type="note" %}
MTU counts aren't available for every plan type.
{% /callout %}
Sometimes, a single user may count **multiple times** when totaling MTUs. This can happen when users log in on their usual device, then later open the app anonymously on a different device or platform. Because Amplitude can't connect these two users, they register as distinct MTUs unless the user eventually logs in on all devices. At that point, Amplitude merges their profiles into a single user.
It can also happen if a user has two unlinked user IDs and uses both of them in a single month.
User actions can also result in a **reduced** MTU count. If a user interacts with your app anonymously and then later logs into their account on that same device, Amplitude merges the anonymous usage with the logged-in usage. The merged usage results in a single MTU.
{% callout type="note" %}
MTU billing uses UTC time.
{% /callout %}
Go to [Investigate your organization's MTU usage in the Amplitude Community](https://community.amplitude.com/building-and-sharing-your-analysis-58/learn-how-to-investigate-your-org-s-monthly-tracked-users-mtus-2163).
### Discrepancies with counts provided by other tools
No two tools work exactly the same way or under the exact same conditions. Most tools ingest and process data differently, which generates different results. Your MTU count can also differ from the results generated by running a user count query within Amplitude because MTU calculations use different logic.
If you believe there is an error in your MTU count, contact [Amplitude support](http://support.amplitude.com).
## MTU limits
MTU limits are defined by your organization's plan or the MTU volume you purchased. Amplitude determines whether you owe overage fees based on:
- Your total MTU volume.
- Your events per MTU volume.
Amplitude calculates each limit on the last day of each calendar month. Exceeding either limit can result in overage charges. Amplitude alerts you when you are approaching your limit so you can avoid exceeding it.
### Calculate your organization’s limit of events per MTU
Your organization's limit of events per MTU depends on your Amplitude plan. For organizations on the Free plan, this limit is 1,000 events per MTU.
Amplitude calculates billing based on **total MTU count**. Most of the time, your total MTU count is equal to your **unique MTU count**, which is the number of unique IDs associated with any tracked event triggered this month. If you exceed your monthly limit, Amplitude adds **synthetic MTUs** to your monthly MTU count.
Use this formula to calculate your organization's synthetic MTU count:
`(Events tracked this month - (Your plan's monthly MTU limit x 1,000)) / 1,000`
This works out to one synthetic MTU for every 1,000 events over your plan's quota allotment.
To calculate your total MTU count for the month, add your unique MTU count to your synthetic MTU count.
### Exceeding limits on a free plan
If you're a non-paying customer, Amplitude blocks your account when you exceed your monthly MTU limit **three times**. You lose access to your charts and dashboards, but you keep access to certain admin functions, like the User API, so you can meet compliance obligations. Amplitude continues to ingest data **up to and over** your limit. Unless you upgrade to a paid plan, you can't access that data. If you continue to exceed your monthly limit without upgrading, Amplitude deletes your account six months after it's first blocked.
## Unexpected usage spikes
Large and sudden increases in MTUs are almost always tied to spikes in product usage. If your company recently launched a new marketing campaign, a significant product update, or an instrumentation change, that may explain the spike.
MTUs may also increase unexpectedly when you add new event sources that result in either more users, or more events for users active in third-party tools but not necessarily in your product (for example, adding an email platform as a data source).
If you believe your MTUs have spiked in error, contact [Amplitude support](http://support.amplitude.com).
## How Amplitude counts backfilled events
When you add backdated events for previous months, Amplitude adds one MTU for each month in which a distinct user appears.
Amplitude bases MTU usage calculations on the month you add an event to Amplitude. If you backfill data from previous months in February, for example, Amplitude counts all backfilled usage against February’s MTU quota.
Similarly, determining whether a user is unique depends on the month they trigger the event. For example, if Amplitude records three events for a single user, with one dated today, one dated one month ago, and one dated two months ago, the count is one unique MTU in the current month.
Because of this, backfilling data is a common cause of spikes in MTU usage.
## Drop filters and MTUs
When you use a [drop filter](https://amplitude.com/docs/data/remove-invalid-data), Amplitude excludes a set of ingested events from your chart based on the criteria you set. Your query doesn't return these events, but the events still exist because Amplitude doesn't delete them. Because of this, the number of uniques on a drop-filtered chart in Amplitude Analytics may not match the number of uniques on the MTU chart in your billing report.
================================================================================
# Usage reports: Understand how your organization uses Amplitude
URL: https://amplitude.com/docs/admin/billing-use/usage-reports
================================================================================
# Usage reports: Understand how your organization uses Amplitude
Usage reports show how your organization uses Amplitude across two tabs: User Metrics, with ten charts on adoption and engagement, and Event Usage, a downloadable report of event use across all projects. Use them to find where your analytics practice is strongest and where teams can get more value from Amplitude.
## Access usage reports
Usage reports include ten charts on the User Metrics tab with metrics that help drive Amplitude adoption in your organization. Usage reports also include a report on the Event Usage tab that describes how your organization uses ingested events within Amplitude across all projects.
To access usage reports, navigate to _Settings > Organization settings > Usage Reports_.
{% callout type="note" %}
Only admins or managers on all projects can view usage reports.
{% /callout %}
## The User Metrics tab
User metrics provide insight into how users within your organization used Amplitude over the defined time period.
### Summary of metrics and users
The Summary Metrics chart displays the total number of users in your organization, along with metrics that summarize Amplitude adoption and engagement. The three trend-over-time metrics show the percentage change in retention, weekly learning users, broadcasted learnings, and engagement by team over the past 90 days.
### User metrics
The User Metrics panel provides information on active user count, top users and teams, and depth of engagement. You can set the active users chart to display data on a monthly, weekly, or daily basis by clicking the buttons in the top corner. The summary statistics in this chart work the same as the ones in the [KPI view](#detailed-kpis).
The Top Users / Teams chart shows which users or teams in your organization performed the most queries in Amplitude. In this chart, a "query" occurs whenever someone creates or loads a chart, dashboard, or notebook. When you switch from top users to top teams, the value reflects the teams users selected when they created their Amplitude account.
Amplitude calculates depth of engagement using the number of edits per session as a proxy. More edits suggest users are highly engaged in the charts they’re viewing.
### Detailed KPIs
The Detailed KPIs panel gives you a more in-depth look at some metrics from the Summary Metrics panel. **Weekly learning users** measures the breadth of Amplitude engagement in your organization. It counts active Amplitude users who've shared a learning that at least two other people consumed in the previous seven days.
**Broadcasted learnings** measures depth. It counts charts, dashboards, and notebooks that two or more people consumed in a seven-day period. [Learn more about the metrics and why they're important](https://amplitude.com/north-star/amplitudes-north-star-metric-and-inputs).
### Content usage
The Content Usage panel shows the Amplitude features and content your people rely on most, including chart types, dashboards, and notebooks. You can view content by clicking the titles if you have the required permissions.
### Export the usage report
To export the report as a PDF or PNG, click the export icon in the upper-right corner.
## The Event Usage tab
The Event Usage tab provides a downloadable, **organization-level** usage report in CSV or JSON format. This report details event use across all projects and portfolios within your organization. Organization admins can generate an up-to-date report by clicking **Generate Report**.
Amplitude measures event use by **queries**. Amplitude defines a query as the **selection of an event** in the definition of a chart, segment, or cohort. When you use [custom events](https://amplitude.com/docs/analytics/charts/event-segmentation/event-segmentation-in-line-events) or metrics composed of multiple events, Amplitude tallies queries for each component event separately.
Amplitude also tallies queries for events queried in [cross-project views](https://amplitude.com/docs/analytics/user-data-lookup), or when an event appears in the path in a [pathfinder analysis](https://amplitude.com/docs/analytics/charts/journeys/journeys-understand-paths).
{% callout type="note" %}
If you don't have access to the query counts feature, contact Amplitude Support to enable it.
{% /callout %}
Both files include every event that has ever appeared in Amplitude, including blocked and deleted events.
#### CSV fields and definitions
- **Event volume**: Total event volume ingested by Amplitude.
- **First Seen & Last Seen**: First and last ingestion date for the event.
- **N Day Queries**: Count of queries in the last N days.
- **N Day Volume**: Total count of event ingestion in the last N days.
- **# of Users**: Total number of users who have ever queried an event.
- **# of Charts**: Total count of all charts that have ever included the event in their definitions.
- **# of Cohorts**: Total count of cohorts that have ever included the event in their definitions.
- **User IDs**: A list of the email addresses.
- **Chart IDs**: A list of the chart IDs.
- **Cohort IDs**: A list of the cohort IDs.
{% callout type="warning" heading="" %}
User IDs, Chart IDs, and Cohort IDs list details for the counts in the previous three columns. As a result, these columns can exceed cell size limits in spreadsheets.
{% /callout %}
#### JSON fields and definitions
- **Event volume**: Total event volume ingested by Amplitude.
- **Query count**: Count of queries against an event when used in charts, cohorts, custom events.
- **Last_seen**: Last date of event ingestion.
- **First_seen**: First date of event ingestion.
- **Views**: Total number of views on charts and cohorts for an event.
- **Owners**: Current owners of a chart, cohort, or custom event.
- **Viewers**: Unique viewers for charts and cohorts.
================================================================================
# The Settings page
URL: https://amplitude.com/docs/admin/account-management/account-settings
================================================================================
# The Settings page
The Settings page is where you manage organization-level settings, personal Amplitude preferences, and account details in one place. Any user in your organization can open it, but only organization admins and managers can edit organization settings.
Click the **gear** icon to open Settings.
## Organizational settings
The organizational settings area contains settings for your organization and projects. The default view is the General page, which displays your organization's name, org ID, org URL, and plan type.
The Plans & Billing section contains your contract start and end date, event or MTU limit, event or MTU usage for this month and last month, and other usage information. Use this section to track usage from within Amplitude.
Users on Plus plans can also manage billing from here.
The organizational settings also include tools to:
- [Create organizations and projects](https://amplitude.com/docs/admin/account-management/manage-orgs-projects)
- [Manage users](https://amplitude.com/docs/admin/account-management/manage-users) and assign permissions
- Manage settings for your [identity provider, SSO, and provisioning](https://amplitude.com/docs/admin/single-sign-on/sso) (if you're an admin)
- [Control access to content](https://amplitude.com/docs/analytics/share-external) your organization generates in Amplitude (if you're an admin)
- View the [usage reports](https://amplitude.com/docs/admin/billing-use/usage-reports) dashboard
- Manage [user privacy notifications](https://amplitude.com/docs/admin/account-management/manage-notifications) (if you're an admin)
- Manage and update [AI Controls and Context](https://amplitude.com/docs/amplitude-ai/ai-controls)
- [Customize sidebar navigation](#navigation-customization) to show or hide features for your organization
### Session Replay settings
For information about Session Replay settings, review [Session Replay Settings](https://amplitude.com/docs/session-replay/session-replay-settings).
### Navigation Customization
Enterprise admins can show or hide major platform features from the left sidebar for all users in their organization. Use Navigation Customization to control which features appear in the sidebar, including:
- Ecommerce Analytics
- Session Replay
- Zoning Insights
- Experiment
- Guides and Surveys
To configure Navigation Customization:
1. Click the **gear** icon to open Settings.
2. Under *Product Configuration*, click **Navigation Customization**.
3. Toggle each feature to **Visible** or **Hidden**.
{% callout type="tip" heading="" %}
If you recently added a feature like Guides and Surveys or upgraded your plan tier but don't see the new features in the sidebar, check Navigation Customization first. An admin may have hidden the feature before the upgrade, and it stays hidden until an admin toggles it to **Visible**.
{% /callout %}
## Personal settings
The personal settings area contains your profile, site settings, and notifications.
### Profile
Your profile page displays information specific to you. You can also set up and manage your Slack integration here, as well as set certain preferences.
The Profile panel shows your organization, role, email, name, and password associated with your Amplitude account. Click the pencil to change your display name or update your password.
The Site Settings panel includes toggles that customize your Amplitude experience.
The "Always Remove Leading Spaces from Export" option tells Amplitude to delete empty spaces from the beginning of cells in a CSV export. With the default setting, these spaces remain in place, which can result in messy data or more significant data errors. This setting works for positive values, but not for values that start with `=`, `+`, `-`, or `@`.
If you keep this option disabled, remove these spaces later in Excel or Google Sheets with the Text to Columns feature.
For more details, refer to [Manage your Slack integration in Amplitude](https://amplitude.com/docs/analytics/integrate-slack).
### Notifications
In the Notifications area, you can change Slack direct message and email notification settings for Amplitude's [collaboration features](https://amplitude.com/docs/analytics/charts/chart-basics). You can enable or disable notification alerts for you, your organization, or your spaces.
{% callout type="tip" heading="" %}
You can also send notification alerts for your experiments or feature flags to a dedicated Slack channel or a unique webhook. Go to [Experiment Notifications](https://amplitude.com/docs/feature-experiment/notifications) for more information.
{% /callout %}
### Year in review
The Year in Review provides a high-level summary of your activity during the selected year. It summarizes your work based on active days, queries, and charts and dashboards you've created. It also summarizes the top followers of your content and the top authors of content you followed.
## Set Amplitude to light or dark mode
The **theme preferences** settings change how you view Amplitude. Use the Settings page to choose _Light Mode_, _Dark Mode_, or automatic matching with your system settings.
================================================================================
# Change the unit of currency your project uses
URL: https://amplitude.com/docs/admin/account-management/currency-unit
================================================================================
# Change the unit of currency your project uses
Amplitude Analytics displays the United States dollar ($) by default. Managers and admins can change the currency symbol Amplitude displays for a project.
{% callout type="note" %}
Changing the currency display doesn't modify or convert the underlying data.
{% /callout %}
To modify the currency display for a project:
1. Navigate to *Settings > Organization settings > Projects* to view a list of your projects.
2. Select the project whose currency display you want to modify.
3. Click `United States ($)` in _General_ to open the drop-down for _Currency Display_.
4. Select the currency from the drop-down list.
This updates the currency display. The new currency is now visible for all users. This chart shows a modified display currency from `United States ($)` to `UK (£)`.
After you make this change, the new currency appears in:
- Revenue LTV charts.
- Revenue metrics in Event Segmentation charts.
- Revenue metrics in Data Tables charts.
- Dashboard or notebook versions of those charts.
================================================================================
# Set up SCIM provisioning in Amplitude
URL: https://amplitude.com/docs/admin/account-management/scim-provision
================================================================================
# Set up SCIM provisioning in Amplitude
In Amplitude, the User Management API provides a programmatic solution to provisioning and group management through a public API. Use the API to manage organizations at scale and integrate provisioning with other tools, including identity providers.
The User Management API follows the [SCIM 2.0 Standard](http://www.simplecloud.info/#Specification). It supports create, retrieve, update, and delete calls for users, pending users, and permission groups.
{% callout type="note" %}
For a technical guide and spec for the SCIM API, refer to the [SCIM API guide](https://amplitude.com/docs/apis/analytics/scim). The guide is useful for developers testing the SCIM API, developing scripts that call the Amplitude SCIM API, or constructing one-off requests.
{% /callout %}
## Before you begin
The User Management API works in tandem with [permission groups](https://amplitude.com/docs/admin/account-management/manage-users).
If you plan to use SCIM provisioning to integrate with an identity provider or SSO solution, make sure SCIM is also enabled within that tool.
## Enable SCIM provisioning in Amplitude
If your organization includes SCIM provisioning, you can find it in the _Access and SSO Settings_ section of your organization's settings menu, under _Provisioning Settings_.
Set the _Enable SCIM Provisioning_ toggle to _Enabled_. Then click _Generate SCIM Key_ to generate the access token used to authenticate requests for the SCIM API.
{% callout type="note" %}
For security reasons, Amplitude shows the SCIM Key only when you enable it. If you lose access to the key, click _Regenerate SCIM Key_. Keep a record of the new key. When you generate or regenerate the SCIM key, changes apply immediately and Amplitude rejects the old key from any API calls, even if the other changes on the page aren't saved.
{% /callout %}
### Supported fields
Amplitude supports all fields of the SCIM core group schema and the following fields in the core user schema:
| | |
| ----------------------- | ---------------------------------------------------- |
| **SCIM user attribute** | **Special note** |
| `userName` | Same as `email`. |
| `givenName` | Prepended to `familyName` to create display name. |
| `familyName` | Appended to `givenName` to create display name. |
| `email` | Allows only one email. |
| `active` | `active` is true for invited users and joined users. |
## Configure a SCIM application with Okta
In Okta, the Amplitude SCIM API provides the following features:
- **Import Users/Groups**: Accesses the users and groups in your Amplitude organization, then adds new users or updates existing users within Okta.
- **Create New Users**: On assignment of a user or group to the application, Amplitude invites users to your organization and sends an invitation email to complete sign-up.
- **Update User Attributes**: Used to keep profiles in sync from Okta to Amplitude.
- **Deactivate Users**: On removal of a user assignment from the Okta application, Amplitude removes the users from your Amplitude organization.
- **Push Groups**: Creates new groups in Amplitude and links them to groups within Amplitude.
### Okta integration
The best way to integrate Okta provisioning with Amplitude is with the Amplitude application within the Okta Integration Network. To integrate Okta provisioning:
1. In the Okta Integration Catalog, navigate to _Applications_ and find the Amplitude application. Use the Org ID available in the _General Settings_ section in Amplitude to create the integration.
2. After you create the integration, set up and authenticate provisioning calls to Amplitude. Navigate to the _Provisioning_ tab and click _Configure API Integration_.
3. Enter the API Token. This token is the same as the SCIM key provided by Amplitude. Enter the token in the field and click _Save_. You should now have access to user provisioning actions in the _Import_, _Assignment_, and _Push Groups_ tabs of the application.
4. After Okta verifies the connection, select the provisioning actions that Okta can send to Amplitude. Check any features in the _To App_ section of the _Provisioning_ tab that fit your needs. Select all available features when possible, so Amplitude's user records closely match your Okta directory.
### Manual configuration (SAML)
If your SSO requires SAML support, use the manual configuration described in [Set up single sign-on (SSO) for Amplitude using Okta](https://amplitude.com/docs/admin/single-sign-on/okta).
## Troubleshooting
Amplitude asks users to provide their first and last names upon **first sign-up in Amplitude**, though they may receive an invitation to join an organization before first sign-up. If you use **Import Users** while pending users have never been in any Amplitude organization, the SCIM API uses placeholder values for their first and last names: `NO_GIVEN_NAME` and `NO_FAMILY_NAME`.
Authentication issues can occur between an identity provider's application and Amplitude's SCIM API. For example, this can happen when testing the SCIM connection within Okta. To troubleshoot SCIM authentication:
1. In your _Access and SSO Settings_ tab, ensure that you enable SCIM. Save the configuration if you enable SCIM.
2. Click _Regenerate SCIM Key_ and confirm the key regeneration. This immediately invalidates the old key.
3. Copy the new key value and retest the configuration. To construct your own requests outside of a provider's integration, refer to the [SCIM API guide](https://amplitude.com/docs/apis/analytics/scim).
================================================================================
# Portfolio: Conduct cross-project analysis in Amplitude
URL: https://amplitude.com/docs/admin/account-management/portfolio
================================================================================
# Portfolio: Conduct cross-project analysis in Amplitude
With Portfolio, you can build a holistic view of how your users interact with your entire product portfolio. If you've instrumented multiple platforms or product lines, Portfolio can show your users' complete journey across projects.
{% callout type="note" heading="Portfolio project limits" %}
Portfolios support an unlimited number of projects. User Streams within portfolios are limited to five projects. If your use case requires more, contact your account team to unlock up to 10 projects for User Streams.
{% /callout %}
## How it works
Portfolio uses **Views** for cross-product analysis. Views are collections of Amplitude Projects or data sources that merge activity from each project into a single display. A View with one or more data sources lets you analyze users across multiple projects at once.
{% callout type="note" %}
Views can't ingest data themselves, but you can update them at any point.
{% /callout %}
Amplitude assumes that the same user ID or device ID in different projects belongs to the same user.
However, Amplitude stores user properties on a per-project basis. User properties on events triggered in a particular project use the user property values for that project only.
For example, you have two projects named `iOS` and `Android`. One user has a user property called `Version`, with a value of `1.0` in the iOS project and a value of `2.0` in the Android project. Events triggered by this user in the iOS project have `Version` set to `1.0`. Events triggered in the Android project have `Version` set to `2.0`.
{% callout type="note" %}
If an event type has the same name on two or more projects, Amplitude considers it to be the same event in the dropdown.
{% /callout %}
Amplitude supports cohort export for portfolio projects for all destinations. When you select Amplitude User Property, the export includes only `device_id` and `user_id`.
## Create a Portfolio view
Admins and managers in an organization can access and create the Portfolio view by clicking the **Settings** icon and navigating to _Organization settings > Projects > Create Portfolio View_. In the modal, name the portfolio view and set user permissions.
To connect multiple projects into this cross-project view, click _Update Source Projects_ and select the projects to merge into a single view.
## User mapping (aliasing)
User IDs for the same user can differ across projects within the same organization. The [User Mapping API](https://amplitude.com/docs/apis/analytics/user-mapping) endpoint lets you merge two users that Amplitude would otherwise identify by different user IDs. You can only map users through the API.
In the following example, three user records with different user IDs are merged into the user ID `mike@hooli.com`. This new user ID is the user's "global" user ID in the cross-project view. This mapping provides an accurate count of unique users across your product portfolio.
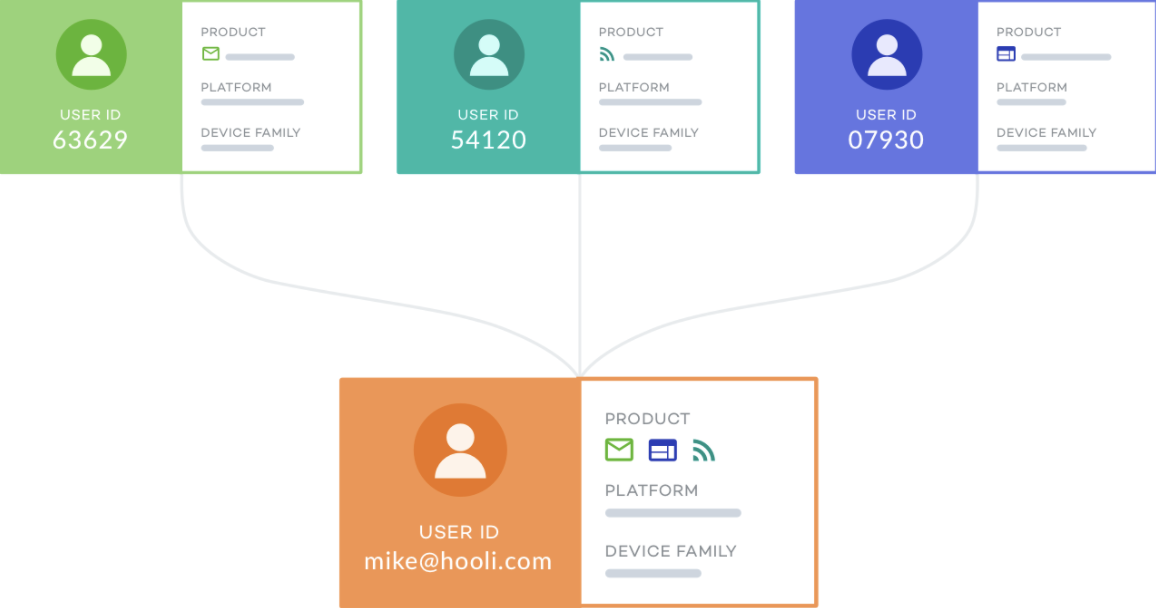
When Amplitude maps users, it doesn't merge user properties. This means the user properties attached to each event are those from the original user who triggered the event in the first place.
Read more about accessing the User Mapping (Aliasing) API, mapping, and unmapping users in [User Mapping (Aliasing) API](https://amplitude.com/docs/apis/analytics/user-mapping#usage).
================================================================================
# Scale: Manage your event volume with dynamic behavioral sampling
URL: https://amplitude.com/docs/admin/account-management/manage-event-volume
================================================================================
# Scale: Manage your event volume with dynamic behavioral sampling
Scale helps manage costs related to very high event volumes.
With Scale, Amplitude enables **dynamic behavioral sampling** for ultra-high volume customers who have unique cost challenges. Sampling lets you keep your data costs manageable without compromising the accuracy of your analyses.
{% callout type="note" %}
Scale is a paid add-on intended for extremely high volume customers. **Amplitude** **does not sample by default**. Contact your Account Manager if you believe Scale may be appropriate for your organization.
{% /callout %}
## How sampling works
At the user level, the Amplitude algorithmic sampling framework samples events based on **user identity**:
- For tracked users, Amplitude preserves users' full event streams and behaviors.
- User-level sampling preserves data integrity better than random event-level sampling, which can provide incomplete data.
When you enable sampling, Amplitude **upsamples metrics** to provide highly accurate estimates on every chart and analysis.
Amplitude multiplies your events and users by a sampling factor equivalent to `(100% / sampling rate)`.
For example, if you sample at 10%, Amplitude multiplies tracked events by 10 to estimate your **true event volume**. This helps Amplitude users focus on analytics without accounting for the sampling rate.
Each Amplitude chart shows the sampling rate applied to it.
You can view raw events for your project for last month and the current month, along with the number of events after sampling. This provides real-time access to event volume.
{% callout type="note" %}
Sampling doesn't apply to PROPCOUNT results.
{% /callout %}
## Set up sampling
You must be an [Admin](https://amplitude.com/docs/admin/account-management/user-roles-permissions) in your Amplitude organization to make sampling-related changes.
To set up sampling:
1. In the modal that opens, click _Edit_ to set the **dynamic sampling rate**.
The dynamic sampling rate specifies how often Amplitude queries your data. For example, if you have 50 million active users per year and set a dynamic sampling rate of 10%, your queried data contains 5 million active users per year. Your event costs are significantly lower, with enough data to generate highly accurate analyses.
2. Set your **user property inclusion list**, if needed.
This list acts as a safelist for small, key sub-populations in your sampling process. Users in these populations are exempt from sampling and always appear in your data. The user properties and values you select define these populations.
### Anonymous users
Although Amplitude prioritizes [identifying and tracking unique users](https://amplitude.com/docs/data/sources/instrument-track-unique-users), ingestion-side sampling can cause inaccuracies for anonymous users. For example, if an anonymous user triggers an event from a new device, Amplitude assigns that user a new Amplitude ID and samples based on that new ID. If Amplitude later determines that this user was a previous user on a new device, Amplitude can't retroactively link the paired events to the user's previous Amplitude ID. Because **event sampling uses the Amplitude ID at ingestion time**, analyses that rely on user behavior on new devices may be inaccurate or skewed.
## Accuracy benchmarks
Amplitude benchmarks sampled result accuracy in terms of percent error, or relative standard deviation at a 95%, two-tailed confidence interval. This is a function of standard error and the true unsampled result.
Customers with high volumes (10M DAUs and more) achieve results within 0.62% accuracy levels at a 5% sampling rate. Amplitude further assumes that any particular analysis only needs to consider 10% of the DAUs to achieve these results. Higher coverage generally results in higher accuracy.
The following table shows percent error at a 95% confidence interval across sampling rates for various DAU volumes:
| DAUs | 25% | 10% | 5% | 2% | 1% |
| ---------- | ----- | ----- | ----- | ----- | ----- |
| 500,000 | 1.73% | 2.76% | 3.91% | 6.19% | 8.76% |
| 1,000,000 | 1.22% | 1.95% | 2.76% | 4.38% | 6.19% |
| 5,000,000 | 0.55% | 0.87% | 1.24% | 1.96% | 2.77% |
| 10,000,000 | 0.39% | 0.62% | 0.87% | 1.38% | 1.96% |
| 20,000,000 | 0.27% | 0.44% | 0.62% | 0.98% | 1.39% |
| 50,000,000 | 0.17% | 0.28% | 0.39% | 0.62% | 0.88% |
For example, if you sample at 10% with 10 million users, it's extremely unlikely you will ever see more than 0.62% error in any metric. So, if your retention is 16%, you might see a variance of:
`+/- 0.62% * 16% = +/- 0.1%`
================================================================================
# Manage organizations and projects
URL: https://amplitude.com/docs/admin/account-management/manage-orgs-projects
================================================================================
# Manage organizations and projects
After you create your [account](https://amplitude.com/docs/get-started/create-a-new-account) and [first project](https://amplitude.com/docs/get-started/create-project), you manage them from Amplitude's organization and project settings. Common tasks include approving and provisioning new users, editing project settings, starring frequently-used projects, changing your organization's name or URL, deleting projects or organizations, and rotating API and secret keys.
{% callout type="note" %}
Amplitude Academy offers a [course on administering Amplitude](https://academy.amplitude.com/amplitude-analytics-admin-essentials) that covers these tasks in more depth.
{% /callout %}
## Approve and provision new users in your organization
New users who join an existing open organization or accept an invitation receive immediate access. For organizations that require admin approval, new users can't access the organization until an admin approves them.
Admins receive email notifications whenever a new user joins. If access requires admin approval, approve join requests by opening the email and clicking _Review access request_. Otherwise, assign permissions to the new user by clicking the button in the email: _Assign Project Permissions_ or _Go to Settings_, depending on whether you use project-level permissions.
## View and edit your project information
Navigate to _Settings > Organization settings > Projects_ and click the name of the project you want to view or edit. The General tab contains the following project information:
| **Term** | **Definition** |
| ------------------- | -------------------------------------------------------------------------------------------------------------------------------------------------------------------------------------------------------------------------------------------------------------------------------------------------------------------------------------------------------------------------------------------------------------------------------------------------------------------------------------------------------------------- |
| Project ID | The project’s unique Amplitude-generated ID. |
| API Key | The project’s API key, used for calling Amplitude’s APIs. Only admins and managers can view the API key. |
| Secret Key | The project's secret key, also used for calling Amplitude’s APIs. Only admins and managers can view the secret key. |
| Session Definition | The value Amplitude uses for this project to group events for sessions-based charts. The default setting is _Session ID_, but you can group sessions by an event or user property instead. |
| Query Time Sampling | Speeds up queries by restricting analyses to a 10% sample of your users. Amplitude **disables query time sampling by default**. |
| Time Zone | The time zone displayed on charts for this project. You can select a new time zone from the drop-down menu, and Amplitude shifts the timestamps of this project’s events to match. The default time zone is UTC. This setting affects all Amplitude users and queries, including the [Dashboard Rest API](https://developers.amplitude.com/docs/dashboard-rest-api). It doesn't affect the [HTTP API](https://developers.amplitude.com/docs/http-api-v2) or your raw data, because event ingestion continues in UTC. |
| Weeks Start On | Specifies the day each week begins. |
| Quarter Starts In | Specifies the month in which the current quarter begins. |
| Currency Display | [The unit of currency displayed for revenue metrics](https://help.amplitude.com/hc/en-us/articles/15581410157339-Change-the-unit-of-currency-your-project-uses-). |
| User Downloads | Enables or disables the [download users](https://help.amplitude.com/hc/en-us/articles/236032527#download-users) feature in Microscope, export cohorts, and export breakdown tables. |
| Event Types | Shows your project's current distinct count of event types sent to Amplitude. |
| Event Properties | Shows your project's current distinct count of event properties sent to Amplitude. |
| User Properties | Shows your project's current distinct count of user properties being sent to Amplitude. |
| Events This Month | Shows the number of events your project has sent to Amplitude this month. |
| Events Last Month | Shows the number of events your project sent to Amplitude last month. |
{% callout type="note" %}
Only admins and managers can edit project settings. Viewers and members can access all project information except the API key and secret key.
{% /callout %}
You can add, remove, and edit [annotations](https://amplitude.com/docs/analytics/microscope#add-annotation) easily from the _Annotations_ tab.
With [Insights](https://amplitude.com/docs/analytics/insights), you can bulk manage your automatic and custom monitors from the _Insights_ tab.
## Star a frequently-used project
If your organization has many projects, star the ones you access most often so they're easier to find. Starred projects appear at the top of the project dropdowns throughout Amplitude.
To star a project:
1. Open a project dropdown anywhere in Amplitude.
2. Click the star icon next to the project name.
Starred projects move to the top of the dropdown. To remove a project from your starred list, click its filled star icon again.
Starring applies only to your account. Each user in your organization manages their own starred projects.
{% callout type="note" %}
You can't star projects from the project selector in Data. That selector can represent tracking plans that map to multiple Analytics projects, which makes starring ambiguous. Star projects from any other project dropdown in Amplitude.
{% /callout %}
## Delete a project
To delete a project, follow these steps:
1. Navigate to _Settings > Projects_.
2. From the list, select the project you want to delete.
3. Click _Delete_.
## Change your name or URL, or delete your organization
If you're a **Growth** or **Enterprise** customer, contact your CSM to change your organization's name or URL, or to delete your organization. If you don't know your CSM, use Amplitude's in-product chat.
1. Log in to your account:
- US Region: [https://app.amplitude.com/login ](https://app.amplitude.com/login)
- EU Region: [https://app.eu.amplitude.com/login](https://app.eu.amplitude.com/login)
2. In the upper-right corner of the Amplitude app, click the Help icon, then click _Chat with us_.
3. Click _Get answer now with AI_, and enter `Talk to a person` in the chat. A dialog appears with your CSM's name and contact email.
If you're on another plan type and don't have a CSM or AE:
{% callout type="note" heading="" %}
Amplitude requires that you use the same email address listed on the Team Members page. Amplitude can't process requests from an unknown email address.
{% /callout %}
1. To request an organization URL or name change, go to [https://support.amplitude.com](https://support.amplitude.com), select the _Service Task_ request type, and select _Org url/name change_ as the service task.
2. To request an organization deletion, go to [https://support.amplitude.com](https://support.amplitude.com), select the _Service Task_ request type, and select _Org Deletion_ as the service task.
3. Click _Submit_ to complete the form. Amplitude sends a copy of the request to your email, and responds by email when the request is complete.
{% callout type="note" %}
The Amplitude Support team responds to these requests the first Monday of each month, or the following Tuesday if Monday is an observed holiday. The support team includes all requests sent before 9 AM Pacific Time on the first Monday of each month in the batch.
{% /callout %}
## How to rotate your project's API key or secret key
Refer to [Manage your API keys and secret keys](https://amplitude.com/docs/admin/account-management/manage-your-api-keys-and-secret-keys).
================================================================================
# Manage permissions at scale with permission groups
URL: https://amplitude.com/docs/admin/account-management/manage-permission-groups
================================================================================
# Manage permissions at scale with permission groups
With permission groups, you can assign permissions to multiple users in a single step based on group membership. Permission groups streamline provisioning and management for your Amplitude organization.
For example, you might create groups like "Marketing Team" or "Payments Team," add users to them, and assign project permissions to each group instead of each team member. All users assigned to a group receive that group's permissions. You can assign users to multiple groups. To change a specific group member's permission level, remove them from the group.
Amplitude grants the highest level of permissions assigned to a user. When you assign a user to a group, they inherit its project permissions. If a user has their own set of project permissions, their new set of permissions are a combination of the two, with projects taking on the highest role.
## Before you begin
- Only Admins in the organization can edit groups.
- You can manage permission groups through the [User Management API](https://amplitude.com/docs/admin/account-management/scim-provision) (a SCIM API).
- Review Amplitude's [user permissions model](https://amplitude.com/docs/admin/account-management/user-roles-permissions) before proceeding.
{% callout type="note" %}
Permission groups are different from [team spaces](https://amplitude.com/docs/analytics/collaborate-with-spaces). Permission groups control project-level access across the organization (Admin-only feature), while team spaces are collaborative workspaces that Members, Managers, and Admins can all create and manage.
{% /callout %}
## Create a group
To create a new group:
1. Navigate to _Settings_ > _Organization settings_. Then click _Members & Groups_.
2. From the _Groups_ tab, click _+ New Group_. The _Create New Group_ pane opens.
3. In the _General_ tab, name your group and add a description, if you want.
4. If you want, select from the [Team Spaces](https://amplitude.com/docs/analytics/collaborate-with-spaces) drop-down any team spaces you want to automatically add group members to. Amplitude doesn't automatically add existing members of the selected Team Spaces to this group.
5. Select the appropriate group type from the drop-down.
6. Click _+ Add Project_ and select the projects this group can access. You can add any number of projects to the group.
7. For each project, select the appropriate project role. All group members have the permission level that's attached to that project role.
{% callout type="note" %}
If a group member already has access to a project individually or through another group, Amplitude applies the **highest** permission level they have. For example, if a user has a "Member" role for a project through Group A and belongs to Group B that grants "Manager" access to the project, the user has manager access to this project. Review more [example scenarios](#example-scenarios).
{% /callout %}
8. Open the _Members_ tab and click _+ Add Members_. Select the users you want to add from the drop-down. You can skip this step if you aren't ready to add members.
9. Click _Save_ to finish creating your group.
## Edit a group
You can modify the group's permission levels, add or remove group members, change the group type or associated team spaces, or add projects to a group at any time.
To **remove a member** from the group, navigate to the _Members_ tab and check the box next to the member's name. Then click _Remove_.
To **modify the group's permission level** for a specific project, navigate to the _General_ tab and check the box next to the project's name. Click the _Edit Project Role_ dropdown and select the appropriate project role for the group, or click _Remove Project Access_ to prevent access to the project from members of this group.
## Assign groups when inviting new users
When [inviting new users](https://amplitude.com/docs/admin/account-management/manage-users) to your organization, you can assign them to a group, assign individual project permissions, or both during the _Assign Access_ step.
## Things to consider when assigning user permissions
You can assign user permissions through groups or individually through User Management. Admins should decide whether to use groups, individual assignment, or a hybrid of both methods. The following table helps you choose the best method for your organization.
| **Method** | **Pros** | **Cons** |
| --------------- | ----------------------------------------------------------------------------------------------------------------- | -------------------------------------------------------------------------------------------------------- |
| Groups | Organize permissions and scale. Integrate with other permissions models in the future. | Harder to manage individual overrides to user permissions. Requires creating a new group for exceptions. |
| User Management | Customized permissions for each user. | Difficult to manage at larger scales. Difficult to keep organized. |
| Hybrid | Benefits of both methods: organization and scale, along with individually assigned permissions for one-off cases. | Difficult to know which assignment is the source of truth. |
If your organization uses third-party identity and access management software, such as Okta, Google Workspace, or SailPoint, you can integrate these tools with Amplitude in the future. Consider setting up groups within Amplitude that align with your company structure and standard permissions and roles. Access management integrations can only manage access through groups.
## Example scenarios
When a user has multiple permission levels for a single project through group membership or individual assignment, the user receives the highest permission level available to them.
**Example A**: You assign Oleg to a group that provides Member permissions to a project.
- You can individually upgrade Oleg to a higher role through User Management.
- If you later decide to reassign Oleg to the lower-level Member role, you can individually downgrade Oleg to that permission level.
If you assign permissions to a user through User Management, those permissions can't be removed, downgraded, or limited through a group's permission levels. Conversely, if you assign permissions to a user through membership in a group, those permissions can't be removed, downgraded, or limited through User Management.
**Example B**: Akiko is a Manager of a project through membership in a group with Manager-level permissions.
- You can't individually downgrade Akiko to a Member or Viewer through User Management.
If you remove a user from a group, Amplitude revokes the permissions granted through the group. If a user also has project permissions through User Management, those permissions remain intact.
**Example C**: You individually assign Marco Viewer permissions for Project A. Marco also receives Manager permissions for Project A and Project B through group membership.
- Marco is a Manager of Project A and Project B, because Manager is the highest permission level Marco has.
- If you remove Marco from the group, he's only a Viewer for Project A.
- If you add Marco back to the group later, he recovers the union of all the user-specified and group-specified permissions—in this case, he becomes a Manager for Project A and Project B again.
If you don't assign any permissions to a user individually or through group membership, that user can't view any content within your Amplitude organization.
**Example D**: Tyra doesn't have any individually assigned project permissions but belongs to a group that grants Member permissions for Project A.
- If you remove Tyra from the group, she no longer has access to any content in the organization.
================================================================================
# Manage user privacy notifications in Amplitude
URL: https://amplitude.com/docs/admin/account-management/manage-notifications
================================================================================
# Manage user privacy notifications in Amplitude
To comply with GDPR and other user privacy regulations, Amplitude sends emails when it receives and processes user data deletion requests. You can control the kinds of emails each user receives by managing user privacy notifications.
This feature applies at the project level and requires admin privileges. Admins can control the following notification types:
- **Job Creation**: Confirmation email at the time of request.
- **Job Completion**: Confirmation email when Amplitude completes the requests.
- **Unset Violation**: Email sent when SDK unset isn't done.
- **All Notifications**: All notification types.
There must be at least one recipient for each notification.
## Enable user privacy notifications
To enable specific users to receive notifications:
1. Ensure you are in the project you want to manage and navigate to _Settings_ > _Organization settings_ > _User Privacy Notifications._
2. In the table listing the team members set to receive notifications, change their notification types and frequencies by selecting from the appropriate drop-down menus.
3. To add new team members to the notification list, enter their names or email addresses into the text box and click _Add Team Members_.
4. Repeat this process for each project within your organization, as needed.
For more information on Amplitude's user privacy API, refer to the [User Privacy API documentation](https://amplitude.com/docs/apis/analytics/user-privacy).
================================================================================
# Manage users and permissions
URL: https://amplitude.com/docs/admin/account-management/manage-users
================================================================================
# Manage users and permissions
In your Amplitude organization, you invite and add users, assign roles and permissions, manage project access, and remove users. Add users to your Amplitude organization before they can access any Amplitude projects. Do this immediately after creating an organization.
## Manage new users and user access
Manage users from the Members page. Navigate to _Settings > Organization settings > Members & Groups_.
At the top of the page, find an overview of users for your organization: total users, joined users, pending users, and users requesting access.
### Invite new users
Organization-level Admins and Managers can remove users from the organization. Organization-level Admins and Managers can invite new users to the organization; project-level Admins and Managers can also invite new users when their roles include the right permissions. Members can invite users to [team spaces](https://amplitude.com/docs/analytics/collaborate-with-spaces) but can't add users to the organization.
To invite new users to the organization:
1. From the Members page, click _Invite New Users_. The _Invite New Users_ modal appears.
2. Type the new user’s email address into the text box. You can add more than one email address at a time. Press the Enter key after each email address you type.
3. For each email you entered, select the appropriate team. Then click _Next_.
4. If you are an Enterprise customer with Groups enabled, choose the group or groups this user belongs to from the _Select Groups_ drop-down menu. The user inherits all the project permissions of those groups. Then click _Next_.
5. Select the individual projects the user has access to. For each project, choose the appropriate role from the drop-down menu on the right. If you’ve assigned the user to a group in the previous step, you can't downgrade those permissions here. Then click _Next_.
6. Specify the user's default project and select the appropriate team spaces for them. The default project sets the user's dropdown menus to that project when they first log into Amplitude. The team spaces appear under _Team Spaces_ in the left-hand rail when the user logs into Amplitude. Then click _Next_.
7. Review your invitation. If it’s ready to go, click _Send_.
### Allow team members to request access
You can allow team members to request access to the organization from the login page. Access requests prompt admin approval.
To turn this setting on, navigate to _Advanced Settings_ and switch the _Allow Team Members to Request Access_ toggle to Enabled.
### Change an Amplitude email address
Email addresses are unique identifiers for Amplitude user accounts. Neither users nor administrators can change a user account's email address.
To work around this limitation:
1. Invite your new email address to your Amplitude organization.
2. Create your new Amplitude account with your new email address.
3. Log in with your existing email address and [transfer ownership](#transfer-ownership-of-content-from-one-user-to-another) of all content to your new email address.
4. Remove your old email address from your Amplitude org.
{% callout type="note" %}
Repeat the process for other users who also need to change their email address.
{% /callout %}
## Change user roles and permissions
The _Joined Users_ view shows all current users. _Pending Users_ shows users with an outstanding invite. An admin or manager can adjust any user's organization role or [permissions](https://amplitude.com/docs/admin/account-management/user-roles-permissions) with the dropdown menu in the _Role_ column. Enterprise and Growth customers with project-level permissions enabled must select the checkbox next to a user's name to manage individual permissions.
{% callout type="note" %}
Granting organization admin access still requires an organization-level Admin.
{% /callout %}
To change user permissions in Amplitude:
1. Navigate to _Settings_ > _Organization settings_ > _[Members & Groups](https://amplitude.com/docs/admin/account-management/manage-users)._ The Team Members page opens.
2. Check the box next to the name of the user whose permissions you want to edit. You can select multiple users at once.
3. Click _Manage Project Access_.
4. In the modal that appears, find the project you want to adjust permissions for and check the checkbox next to it. You can select multiple projects at once.
5. From the _Role_ dropdown, choose the new permission level you want to assign to the selected users for each selected project.
{% callout type="note" %}
You can't change the role for the only Admin in an organization.
{% /callout %}
6. To remove a user from the organization, click _Remove_. This removes the user from the organization and eliminates all access provisions. Removing a user from the organization requires an organization-level Admin or Manager role.
{% callout type="note" %}
When you remove a user, Amplitude designates all their content (charts, dashboards, and cohorts) as unassigned. Admins can transfer ownership of unassigned content to other users.
{% /callout %}
### Project-level permissions
With project-level permissions, a user can have a different role for each project within an organization. This enables multiple teams in your company to operate autonomously and manage their own datasets. For example, a user may have Manager-level permission in one project and Viewer-level permission in another. Users without access to a project can't view content that belongs in that project.
{% callout type="note" %}
Only Growth and Enterprise plans support project-level permissions.
{% /callout %}
When viewing all members of your organization, Amplitude lists members as either _User_ or _Admin_. If you're an Admin or Manager of a project in the organization, you can use _Manage Project Access_ to grant, remove, or modify an existing organization member's access for projects you manage. Project-level Admins and Managers can only modify a user's project access for projects they manage.
Reach out to your Customer Success Manager to enable project-level permissions, as this isn't enabled by default.
### Transfer ownership of content from one user to another
When a user leaves the company or exits an Amplitude organization, any content they created no longer has an owner. Depending on the content, this can significantly hinder your company's analytics work.
Admins can avoid this by using the **bulk transfer ownership** feature to designate another user as the owner of that orphaned content. Navigate to _Settings > Organization settings > Members & Groups_, and then click _Bulk Transfer Edit Access_.
{% callout type="note" %}
This process can't be reversed, so use it with care.
{% /callout %}
You can also transfer content when you're removing a user. Check the box on the _Remove Members?_ modal, and Amplitude provides the option to transfer each removed user's content to another existing user.
You can only transfer a user's content **before** they're deleted from the organization. The user who receives the content must have logged into Amplitude at least one time in the previous 30 days. You may have to explicitly grant them the permissions they need to access the transferred content.
## Request an email domain change
Before an email domain migration:
- **Migrated items**: Permission levels including App-Level Permissions, Admin Status, and Group Membership; and content including Cohorts, Charts, Dashboards, and Notebooks.
- **Non-migrated items**: User spaces and the content contained within these spaces.
- **Active user impact**: Anyone in an active session redirects to an error page. Let your team know they may not have access to Amplitude during the domain change.
- **Turn off SSO**: If you have SSO enabled in your organization, turn it off before the migration. You have to set up SSO again after the migration.
To request an email domain change, submit a [ticket](https://help.amplitude.com/hc/en-us/requests/new) with the following information:
- Your org ID.
- The old email domain.
- The new email domain.
An admin must request email domain changes. If you aren't an admin of the organization, CC an admin in your request.
================================================================================
# User roles and permissions in Amplitude
URL: https://amplitude.com/docs/admin/account-management/user-roles-permissions
================================================================================
# User roles and permissions in Amplitude
User permissions define the level of Amplitude access a user in your organization has. Amplitude bases permissions on a user's role, though Enterprise customers can use [project-level permissions](https://amplitude.com/docs/admin/account-management/manage-users) and [permission groups](https://amplitude.com/docs/admin/account-management/manage-permission-groups) for more targeted security controls. For more information about permissions in Amplitude Experiment, go to [Project-level user permissions](https://amplitude.com/docs/feature-experiment/project-level-permissions).
{% callout type="note" %}
Amplitude Academy offers a [course on administering Amplitude](https://academy.amplitude.com/amplitude-analytics-admin-essentials) that covers roles and permissions.
{% /callout %}
The **admin** sets user permissions. The admin is the first user of any Amplitude organization, and each organization must have at least one admin. Any admin can designate other users as admins. When you invite new users to an organization, Amplitude assigns the **viewer** role by default.
## User roles and permissions in Amplitude
By default, user permissions in Amplitude exist at the **organization** level. With the default configuration, a user in an organization has the same level of access to all projects within that organization.
Enterprise and Growth customers can enable project-level permissions, which allow users to have different roles for different projects within the same organization. For example, a user could be a Manager in one project but only a Viewer in another. Go to [Project-level permissions](https://amplitude.com/docs/admin/account-management/manage-users#project-level-permissions) for more information.
Go to [Manage users, organizations, and projects](https://amplitude.com/docs/admin/account-management/manage-users) to learn more about creating and managing organizations and projects.
### Viewer
The Viewer role is ideal for third-party collaborators or users who need to view content without creating items discoverable to the entire organization.
**Viewer permissions:**
- Create, edit, and delete undiscoverable dashboards, charts, and behavioral cohorts (Viewers must own the content to edit and delete it)
- Co-own undiscoverable content created by another user
- View [project settings](https://amplitude.com/docs/admin/account-management/manage-orgs-projects)
- View data sources and data destinations
- Connect their account to [Slack](https://amplitude.com/docs/analytics/integrate-slack)
- Edit their own profile (name, title, team, password)
- Edit their own [email subscriptions](https://amplitude.com/docs/analytics/dashboard-create)
- Set and subscribe to custom [monitors](https://amplitude.com/docs/analytics/insights)
- Share content they create with others
- View Guides and Surveys
- Create and view [Heatmaps](https://amplitude.com/docs/heatmaps)
- Open project details from notification alerts
**Viewer restrictions:**
- Can't save discoverable content such as charts, dashboards, notebooks, cohorts, or saved segments
- Can't create shareable links
- Can't export data to third-party integration partners
- Can't create a guide or survey
### Member
The Member role is suited for most users within an organization who need to create and manage discoverable content.
**Member permissions:**
- All Viewer-level permissions
- Create discoverable dashboards, charts, behavioral cohorts, and saved segments
- Create [custom events](https://amplitude.com/docs/data/custom-events)
- Create and manage [team spaces](https://amplitude.com/docs/analytics/collaborate-with-spaces), including adding content, inviting users to spaces, and archiving spaces
- Edit [releases](https://amplitude.com/docs/analytics/releases)
- Label events with [Visual Labeling](https://amplitude.com/docs/data/visual-labeling)
- Edit unpublished guides or surveys
- Create and manage experiment notification alerts
**Member restrictions:**
- Can't search for undiscoverable content
- Can't add or remove users from the organization (can only invite users to team spaces)
- Can't edit project settings
### Manager
The Manager role is designed for users who need comprehensive access to content and the ability to modify project settings.
**Manager permissions:**
- All Member-level permissions
- Add and remove users from the organization
- Edit user roles (permissions)
- Create, edit, and delete [annotations](https://amplitude.com/docs/analytics/microscope)
- View API keys and secret keys in project settings
- Remove and edit saved segments
- Create new projects
- Edit project settings
- Mark content as "Official Content"
- Add and edit data sources and data destinations
- Transfer ownership of content they don't own
- Create, modify, and delete derived properties
- Full access to Guides and Surveys
### Admin
The Admin role is the highest-level role, granting extensive control over the organization and its settings. Amplitude recommends limiting the number of users in an organization who are Admins. Only existing administrators can grant or revoke the Admin role.
**Admin permissions:**
- All Manager-level permissions
- Remove shared chart and dashboard links
- Change sampling settings
- Create [permission groups](https://amplitude.com/docs/admin/account-management/manage-permission-groups)
- Delete the organization or change its name and URL (requires submission to Amplitude Support)
- Change organization Admins
- Full access to Guides and Surveys
## Experiment-specific permissions
Amplitude Experiment has its own set of permissions that work alongside the general organization roles. The following sections describe what each role can do specifically in Experiment.
For more detailed information about Experiment permissions, including flag-level access controls, go to [Project-level user permissions](https://amplitude.com/docs/feature-experiment/project-level-permissions).
### Viewer permissions in Experiment
**Experiment viewer permissions:**
- View experiments, flags, and deployments
- View mutual exclusion groups
- View analysis and metrics
- View project API keys
**Experiment viewer restrictions:**
- Can't create, edit, or delete experiments or flags
- Can't create, edit, or delete deployments
- Can't create, edit, or delete mutual exclusion groups
- Can't modify variants, allocation, or activation settings
- Can't add users to projects or edit roles
### Member permissions in Experiment
**Experiment member permissions:**
- All Experiment viewer permissions
- Create, edit, and delete experiments and flags
- Create, edit, and delete deployments
- Create, edit, and delete mutual exclusion groups
- Read and write to variants, allocation, activation, analysis, and metrics
**Experiment member restrictions:**
- Can't add users to projects or edit project roles
- Can't add users to the organization or edit organization roles
### Manager permissions in Experiment
**Experiment manager permissions:**
- All Experiment member permissions
- Add users to projects
- Edit project-level roles for users
**Experiment manager restrictions:**
- Can't add users to the organization
- Can't edit organization-level roles
### Admin permissions in Experiment
**Experiment admin permissions:**
- All Experiment manager permissions
- Add users to the organization
- Edit organization-level roles for users
- Edit restricted flags and experiments (even without being listed as an editor)
## General restrictions for all users
Regardless of role, all users have the following restrictions:
- Can't change the full name of other users
- Can't change or reset passwords for other users
- Can't change their own role within the organization
- Can't remove themselves from the organization (an admin or manager must perform this action)
- Can't permanently delete another user's content (only content owners can delete their content after archiving)
================================================================================
# Self-service data deletion in Amplitude
URL: https://amplitude.com/docs/admin/account-management/self-service-data-deletion-in-amplitude
================================================================================
# Self-service data deletion in Amplitude
Self-service data deletion permanently removes specific events or properties from your Amplitude projects. You submit deletion requests directly, without contacting Amplitude Support. Use it to remove data you sent by mistake. For privacy law compliance (GDPR, CCPA), use the [User Privacy API](https://amplitude.com/docs/apis/analytics/user-privacy) instead.
{% callout type="warning" heading="" %}
If you need to comply with end-user data deletion requests mandated by global privacy laws such as [GDPR](https://gdpr-info.eu/) or [CCPA](https://oag.ca.gov/privacy/ccpa), use Amplitude's [User Privacy](https://amplitude.com/docs/apis/analytics/user-privacy) API. Self-service data deletion permanently removes specific data from your Amplitude projects. It's not designed for privacy law compliance.
{% /callout %}
{% callout type="note" heading="Limitations" %}
Self-service data deletion doesn't support custom events or transformed events. You can only delete raw events ingested directly into Amplitude.
{% /callout %}
Self-service data deletion requires Administrator privileges. After you submit a deletion request, you can't cancel it.
## Submit a data deletion task
To delete your Amplitude data, create a task. Self-service data deletion supports events and properties.
When you delete events, Amplitude deletes all properties and property data associated with those events. When you delete properties, specify whether you want to limit deletion to properties attached to specific events, or to delete these properties for all events.
Add up to five clauses to each deletion task.
To create and submit a data deletion task, follow these steps:
1. Click the gear icon and navigate to _Organization settings > Self Service Data Deletion_.
2. Click _New Deletion Task_.
3. Name the task and specify the project holding the data you want to delete.
4. Under _Time Range_, set the beginning and ending dates for the data you want to delete. Amplitude bases times on server upload time, in UTC.
5. Under _Delete_, click _Add events or properties_.
6. From the dropdown, select the type of data you want to delete: an event, an event property, or a user property.
7. For events, select the specific events to delete. Amplitude deletes those events and all properties associated with them.
For properties, select the properties you'd like to delete, and specify whether you want to delete them for all events or specific events only. If you want to delete for specific events only, select them in the next drop-down that appears.
8. Click **Next** to move to the verification screen and then click **Next** to confirm.
9. Follow the instructions that appear and click **Delete**. You can't undo this action.
You can find the statuses of all existing tasks on the Home page. The speed at which Amplitude processes your deletion request depends on the current volume of requests.
================================================================================
# Webhooks for custom monitors
URL: https://amplitude.com/docs/admin/account-management/webhooks
================================================================================
# Webhooks for custom monitors
Webhooks are automated messages your application sends when something happens. They include a message, or **payload**, and send it to a unique endpoint. Webhooks let one application deliver real-time information to other applications without waiting for your API to poll data.
[Custom alerts](https://amplitude.com/docs/analytics/insights) notify you when your most important KPIs change in meaningful ways.
With webhooks for custom monitors, you can send triggered monitors to an endpoint whenever user behavior changes in a way that affects your KPIs.
## Create and configure a webhook
To create and configure a webhook:
1. Navigate to _Organization settings > Projects_.
2. Click the name of the project you want to receive notifications for.
3. Click the _Webhooks_ tab. Use this tab to manage webhooks and automatic and custom monitors. The owner of the webhook, managers, and admins can edit or delete webhooks.
4. To create a new webhook, click _+ Create_.
5. Give your webhook a name and paste the URL of the endpoint that receives the message.
6. At the bottom, select the custom monitors to send to the endpoint you configured.
After you choose your custom monitors, click _Send a test message_ to test the endpoint and view how the message posts to your endpoint.
================================================================================
# Manage your API keys and secret keys
URL: https://amplitude.com/docs/admin/account-management/manage-your-api-keys-and-secret-keys
================================================================================
# Manage your API keys and secret keys
Managers and Admins use the key management page to create and revoke API keys and to create and delete secret keys for a project. **All changes are permanent**.
Use an API key to identify a project so Amplitude routes ingested data to it. Use a secret key to authenticate to server-side Analytics APIs that read or modify project data.
You can:
- Create and name multiple API keys and secret keys.
- View a log of the creator and the last action taken on the key.
- Disable API access.
## Manage your keys
To manage your keys, follow these steps:
1. Select _Organization settings_ in the upper navigation.
2. Select _API Keys_ in the side navigation.
## API key
An API key identifies your project so Amplitude can route ingested data to it. Learn more about [API Key](https://amplitude.com/docs/apis/keys-and-tokens#api-key).
### Legacy API key
The first time you use API key management, you see the legacy API key in the _API Keys_ tab. Amplitude created this key when you created the project. You can't disable it, but you can click **Rotate** to replace the key.
### Generate an API key
To generate an API key, follow these steps:
1. Select the project you’re interested in.
2. Click **Generate API Key**.
3. Name the API key.
You can copy this API key to store or use elsewhere.
### Revoke an API key
To revoke an API key, follow these steps:
1. Select the API key.
2. Confirm that you want to revoke the key.
After you click **Revoke**, the key is permanently unusable. You still retain the API key for your records.
## Secret key (Beta)
Secret keys authenticate you to server-side Analytics APIs that read or modify project data. For more information, review [Keys and Tokens](https://amplitude.com/docs/apis/keys-and-tokens#secret-key).
### Generate a secret key
To generate a secret key, follow these steps:
1. Select the appropriate project.
2. Click **Generate Secret Key**.
3. Name the secret key and copy it into your records. Amplitude doesn't store secret keys, and there's no way to retrieve a secret key. The Key ID is a unique identifier for your secret key, but it's not the key itself.
### Delete a secret key
To delete a secret key, select the secret key you want to delete, then type “DELETE” to confirm your intent.
You can't use, see, or recover a secret key after deleting it.
## Limitations
- You can have a maximum of 50 active keys.
- While key creation is instantaneous, a revoked key can take up to 6 hours to stop working in rare cases. This applies to both legacy and non-legacy API keys.
================================================================================
# Role-based Access Controls (RBAC)
URL: https://amplitude.com/docs/admin/account-management/role-based-access-controls-rbac
Updated: 2025-12-11
================================================================================
# Role-based Access Controls (RBAC)
Role-based Access Control (RBAC) defines which areas of Amplitude each user can access and what actions they can take. Administrators use it to centralize permission management, enforce least-privilege access, and prevent unauthorized actions as the organization grows.
RBAC provides administrators a centralized location for assigning permissions to individual users or [groups](https://amplitude.com/docs/admin/account-management/manage-permission-groups). For example, if your organization has an `Analyst` role, you can assign the same base permissions to that role. When a new analyst joins the team and receives the `Analyst` role, they automatically inherit the same set of permissions as everyone else with the `Analyst` role.
RBAC provides the following benefits to your enterprise:
- **Improved security**: Limit data access based on job responsibilities.
- **Operational efficiency**: Simplify user management across large organizations.
- **Compliance support**: Support regulatory requirements around access control and auditing.
- **Scalability**: Manage access for growing teams and multiple business units.
{% callout type="note" heading="Feature availability" %}
RBAC role customization requires an Enterprise plan. If you aren't on an Enterprise plan, you can't customize roles or create new ones.
{% /callout %}
To learn more, take the [Manage roles and permissions with RBAC](https://academy.amplitude.com/manage-roles-and-permissions-with-role-based-access-controls-rbac) course on Amplitude Academy.
## Create an Analyst role and assign it to your team
This walkthrough ties together the three tasks admins most often split across separate articles: [create a custom role](https://amplitude.com/docs/admin/account-management/manage-rbac-roles), [assign it to users](https://amplitude.com/docs/admin/account-management/manage-users), and [verify and audit access](https://amplitude.com/docs/admin/account-management/rbac-best-practices). You need an Enterprise plan to create custom roles.
### Scenario
Your product analytics team has three analysts who need to build charts and dashboards in the **Web App** project. They don't need to edit tracking plans, run data cleanups, or change data settings. This example creates an `Analyst` role with those boundaries, assigns it to the analysts, and confirms their access before they start work.
### Step 1: Create the Analyst role
Navigate to *Org Settings > Role Management*.
1. Click **+New Role**.
2. Enter **Analyst** as the role name and add a short description, such as "Builds charts and dashboards without data model access."
3. Click **Create**.
4. For **Charts & Metrics**, grant Base permissions so analysts can create and share charts and dashboards.
5. For **Data Management**, leave permissions at the default level so analysts can't edit tracking plans or change data settings.
6. Click **Save Changes**.
For full role-creation options, go to [Manage RBAC roles](https://amplitude.com/docs/admin/account-management/manage-rbac-roles).
### Step 2: Assign the role to users
Navigate to *Settings > Organization settings > Members & Groups*.
1. Check the boxes next to the three analysts you want to update. You can select multiple users at once.
2. Click **Manage Project Access**.
3. Check the box next to **Web App**.
4. From the **Role** dropdown, select **Analyst** for each selected user.
If your organization manages access through groups instead of individual assignment, add users to a group with the **Analyst** role for **Web App**. Go to [Manage permissions at scale with permission groups](https://amplitude.com/docs/admin/account-management/manage-permission-groups) for that workflow.
### Step 3: Verify access
Confirm the assignment took effect before the analysts log in:
1. On the *Members & Groups* page, open the **User Overview** panel for one of the analysts you updated.
2. Confirm **Web App** appears with the **Analyst** role and the access method shows **Direct** (or your group name if you assigned through a group).
3. Ask one analyst to log in and open **Web App**. They should be able to create charts and dashboards but not access data model settings they shouldn't have.
For ongoing audits and scalable group design, go to [RBAC best practices](https://amplitude.com/docs/admin/account-management/rbac-best-practices).
## Amplitude RBAC concepts
Amplitude's RBAC contains three main layers: Roles, Permissions, and Actions. Roles contain permissions, and permissions contain actions. An action is a single task, such as editing a metric or creating an annotation.
### Roles
By default, your Amplitude organization contains four default roles, in order of increasing access:
- Viewer.
- Member.
- Manager.
- Admin.
If an org admin previously enabled "Restrict access in Amplitude Data" for a project (a pre-RBAC setting that Amplitude no longer surfaces in the UI), Amplitude provisioned one or both of two additional default roles for the org: Member - Limited Data and Manager - Limited Data. These roles mirror the standard Member and Manager roles but can't manage tracking plans, run data cleanups or enrichments, change data settings, or backfill event data.
{% callout type="tip" heading="Admin role" %}
The Administrator (Admin) role is the only default role that doesn't support permission updates. If administrators require different permissions in your org, create a new role to reflect those permissions.
{% /callout %}
Amplitude’s default roles cover most common use cases, but every organization has unique structures and responsibilities. Custom roles enable your organization to fine-tune access for:
- Specialized teams, such as Growth Engineering or Data Governance, can have finely scoped permissions.
- Hybrid roles serve employees who work across functions. For example, a product manager may also create official dashboards and metrics.
This flexibility enables your organization to follow the security best practice of providing the least access users need to complete their work.
#### Admin-only permissions
The Admin role has special permissions that custom roles don't have.
Admin-only permissions include:
- Modify discovery settings at org level.
- Change the organization's master password.
- Modify organization admin assignments.
- Change the organization's subscription plan.
- Modify query time sampling rules.
- Change event sampling rules.
- Configure Single Sign-On settings.
- Permanently delete the organization.
- Edit permission groups/settings.
- Full administrative access flag.
- Invite users with restrictions.
- Transfer org ownership.
### Permissions
Permissions define the specific actions Amplitude users can perform. They’re the building blocks of RBAC. Most permissions define a user’s ability to create, edit, or delete items in specific areas. Some permissions provide access to a single action, like marking a dashboard or metric as official.
Amplitude organizes permissions by product area:
- Administration.
- Charts & Metrics.
- Data Management.
- Audiences.
- Integrations.
- Session Replay & Heatmaps.
- Zoning.
- Experiment.
- Guides & Surveys.
- Resource Center & Content.
### Projects
In Amplitude, projects determine which projects an organization member can access. Roles within each project determine what that member can do in that project. Organization-level roles control organization-level actions separately.
### Groups
Groups enable you to manage users at scale. Groups define the projects that a member can access and their role within those projects. Groups most often map to teams in your organization. For example, the Business Intelligence team may use a defined set of Amplitude projects and permissions. You may have a group called "Business Intelligence" with access to Project A and Project B, with the `Analyst` role.
#### Group permission prioritization
When you add a user to a group, admins can't change their permissions at the individual level for projects where the group grants access. This ensures permission consistency and simplifies troubleshooting when determining why a user has certain access levels.
When you try to modify permissions for a user who has group-assigned access, a tooltip explains that group access controls the project.
To change a user's permissions for projects they access through a group:
- Remove the user from the group and assign permissions directly.
- Modify the group's permissions for that project.
### Permission assignment warnings
Amplitude displays warning indicators when permission assignments require attention:
**Multiple**: Appears when a user has different roles for the same project, typically because they belong to multiple groups with different permission levels. When this occurs, Amplitude grants the user the union of all assigned role permissions for that project.
**Conflict**: Appears when you manage roles for multiple users simultaneously and those users have a permissions mismatch for the same project.
### Access definitions
The access method column in the User Overview panel indicates how a user received their project access:
| Access method | Meaning |
| ------------- | ------------------------------------------------------------------------------ |
| Direct | Amplitude assigns this role directly through the Manage Project Access modal. |
| [Group Name] | The user has this role through membership in the specified group. |
## RBAC permission reference
{% rbac-permissions /%}
================================================================================
# Manage RBAC roles
URL: https://amplitude.com/docs/admin/account-management/manage-rbac-roles
================================================================================
# Manage RBAC roles
Administrators in your organization can create new roles and update existing roles. All changes take effect immediately.
Amplitude recommends the principle of least privilege. When you create or edit a role, grant the minimum permissions a user needs to do their job. Adding "just in case" permissions can create unnecessary security risks. Amplitude's RBAC system is flexible, so you can update roles to add permissions later.
## Create a new role
If you’re an org administrator, navigate to _Org Settings > Role Management_. This page lists existing roles in your organization and includes a description, the type of role, and the user who last modified the role.
1. Click **+New Role**.
2. Provide a Role Name and Description. Amplitude recommends a descriptive role name with a maximum of 30 characters, such as "Analyst" or "Marketing," and a short role description.
3. Click **Create** to continue.
Amplitude organizes permissions by product area and displays only the products and features available to your organization. All new roles inherit permissions from the default `Member` role. For each product area, you can grant Base permissions, Expanded permissions, or Full permissions:
- **Base permissions**: Permissions Amplitude provides by default to non-Admin users.
- **Expanded permissions**: Permissions beyond the default but not full permissions.
- **Full permissions**: All permissions for the product area.
Within each product area, select the individual permissions to grant to the role. After you set the role's permissions, click **Save Changes**.
After you create a role, it’s immediately available to assign to users or groups.
## Edit an existing role
Org administrators can edit and update existing roles with the same flow as creating a new role. Navigate to _Org Settings > Role Management_ to begin.
1. Click the role to edit.
2. Update the permissions on the role.
3. Click **Save**.
When you save the role, the permissions update applies immediately to users with that role assignment. Before you update a role, Amplitude recommends that you audit where your organization uses that role to help minimize disruption.
================================================================================
# RBAC best practices
URL: https://amplitude.com/docs/admin/account-management/rbac-best-practices
================================================================================
# RBAC best practices
Amplitude’s Role-based Access Controls (RBAC) system unifies permissions across all Amplitude products and features. These best practices show how to design and govern project-level access so it stays consistent, scalable, and auditable as your organization grows. For the concepts behind roles, permissions, and actions, or the full permission reference, go to [Role-based Access Controls (RBAC)](https://amplitude.com/docs/admin/account-management/role-based-access-controls-rbac).
## Projects in Amplitude
In Amplitude, projects define the data users can view or modify, the Amplitude products and features they can use, and the actions they can perform within that project.
When you configure and manage permissions by project, users in your organization receive consistent access across Amplitude products within that project.
## System architecture
Follow these guidelines to help ensure your RBAC implementation meets your organization’s access and security requirements.
### Use groups as the default management layer
Groups are the foundation for managing access at scale. In Amplitude, a group defines:
- The projects that the group’s members have access to.
- The roles users hold in those projects.
- Any [Data Access Controls](https://amplitude-docs.test/docs/data/data-access-control) that apply.
All members of a group inherit the same set of permissions for the same projects. This helps simplify onboarding, offboarding, and audits.
{% callout type="tip" heading="Don’t mix management methods" %}
If a user belongs to a group, ensure their permissions derive from that group, not from manual overrides.
{% /callout %}
### Use direct role assignment only when necessary
Use individual user-level permissions only when group membership isn’t practical. For example:
- Contractors or temporary collaborators.
- Executives who need read-only access.
- Service or system accounts.
If you assign permissions directly to a user, document the reason internally.
{% callout type="tip" heading="Be consistent" %}
As much as possible, manage each user through a group or individually. Avoid using both methods for the same user.
{% /callout %}
### Standardize roles across the organization
Define a small set of core, reusable roles that apply across projects and products. This creates a shared mental model and reduces administrative overhead. Review the following table for example roles, intended use, and permissions.
| Role | Intended For | Permissions Summary |
| ------------------- | ------------------------------------- | ------------------------------------------------------------------------------------ |
| **Viewer** | Executives, stakeholders | Read-only access to all Amplitude products within assigned projects |
| **Analyst** | PMs, analysts | Can build and share charts and dashboards only (no data model or experiment editing) |
| **Data Governor** | Data stewards, admins | Manages event taxonomy, tracking plans, and naming conventions across products |
| **Engineer** | Experiment owners, feature developers | Manages feature flags, experiment setups, and validation within Experiment |
| **Growth Marketer** | Lifecycle and activation teams | Manages Guides & Surveys, CDP audiences, and cohort syncs |
{% callout type="tip" heading="Keep it simple" %}
Most organizations succeed with between five and seven roles. Add custom roles only when governance or compliance requires it.
{% /callout %}
### Design groups
Groups are the foundation of scalable access in Amplitude’s RBAC system. Amplitude recommends groups that combine function and scope into one logical structure by considering:
- How users in your organization use Amplitude.
- The projects those users need to access.
#### Anchor groups to both workflow and project scope
As you plan your groups, make sure to design groups that capture:
- How teams in your organization use Amplitude.
- The projects each team should access.
Consider both the team’s function or use case and the data or product context they need to do their job.
Ensure each group describes what the members of the group do, and where they do it.
#### Keep groups project-scoped and purposeful
A well-designed group provides a clear function, a set of projects, and a consistent role.
To achieve this:
- Assign each group to the specific projects they need. Avoid granting access to the entire workspace.
- If a team works across projects, assign those projects within the same group.
- Avoid overlapping or nesting groups to keep access clear and auditable.
#### Apply clear and consistent naming
Use a predictable, readable naming format that reflects the role and the project scope:
`Function / Use Case - Role - Projects`
The following table contains a list of group names using this format.
| Group | Users |
| :------------------------------------------------------ | :----------------------------------------------------------------------- |
| Product Analytics - Analysts (Web App + iOS App) | Analysts who create charts and dashboards for both web and mobile. |
| Experiment Owners - Engineers (Android App) | Engineers who make feature flags and experiments in the Android project. |
| Marketing Ops - Growth Marketers (web App) | Marketers who manage Guides, Surveys, and cohort syncs for the Web App. |
| Data Governance Council - Data Governors (All Projects) | Data stewards who maintain the taxonomy and tracking plans. |
Consistent naming makes it clear who belongs in the group and the content and features they can access.
#### Keep membership manageable
Think of groups as access blueprints. Each one should have a clear purpose, ownership, and lifecycle management.
- Keep your groups to between 10 and 50 members.
- Split groups when their project roles or responsibilities diverge. For example, `Experimentation - Engineer - Android App` or `Experimentation - Engineer - iOS App`.
- Avoid catchall groups like `All Analysts` or `Marketing Team`. Catchall groups can create confusion and overexpose parts of your Amplitude environment.
================================================================================
# Single sign-on (SSO) in Amplitude
URL: https://amplitude.com/docs/admin/single-sign-on/sso
================================================================================
# Single sign-on (SSO) in Amplitude
**Single sign-on** (SSO) is an authentication scheme that lets users use a single ID and password combination to log into multiple platforms, services, or systems. Amplitude supports SSO and is compatible with any SAML 2.0-compliant SSO provider, including:
- [Auth0](https://amplitude.com/docs/admin/single-sign-on/auth-0)
- [AWS IAM Identity Center](https://amplitude.com/docs/admin/single-sign-on/aws-iam-identity-center)
- [G Suite](https://amplitude.com/docs/admin/single-sign-on/g-suite)
- [Microsoft Azure Active Directory](https://amplitude.com/docs/admin/single-sign-on/azure-active-directory)
- [Okta](https://amplitude.com/docs/admin/single-sign-on/okta)
- [OneLogin](https://amplitude.com/docs/admin/single-sign-on/one-login)
- [Other](https://amplitude.com/docs/admin/single-sign-on/set-up-single-sign-on-sso-for-amplitude-using-another-service) providers not specifically named.
Follow the provider-specific guide for setup and configuration details.
## SSO basics
Before you enable SSO:
- You can **require** members of your organization to sign in with SSO. Requiring SSO prevents users from signing in with their email and password, so make sure your SSO system works before you turn it on in Amplitude.
- You can also **automatically** grant new users access to your organization through just-in-time provisioning. Amplitude only requires a new user to successfully authenticate with your identity provider. After Amplitude receives authentication, Amplitude adds the user to your organization. You can then configure roles for each new user to reflect their needs and the organization's needs.
Enterprise customers with access to project [permissions](https://amplitude.com/docs/admin/account-management/user-roles-permissions) can also choose the default project(s) that JIT-provisioned users will have access to.
## What your identity provider must send
When a user signs in through SSO, Amplitude looks for their email in the SAML assertion in this order:
1. The assertion subject.
2. An email claim attribute (`http://schemas.xmlsoap.org/ws/2005/05/identity/claims/emailaddress`).
3. An `emailaddress` attribute (case insensitive).
4. An `email` attribute (case insensitive).
**If Amplitude can't find a valid email, the user can't sign in.** Most identity providers send the email by default. If yours doesn't, follow the provider-specific guide linked above to map the user's email into the assertion.
================================================================================
# Set up single sign-on (SSO) for Amplitude using Auth0
URL: https://amplitude.com/docs/admin/single-sign-on/auth-0
================================================================================
# Set up single sign-on (SSO) for Amplitude using Auth0
Amplitude provides a single sign-on integration with Auth0 for customers on Scholarship, Growth, or Enterprise plans.
## Before you begin
For general information about Single Sign-On (SSO), review [SSO in Amplitude](https://amplitude.com/docs/admin/single-sign-on/sso).
To set up SSO, you must be an org admin for your Amplitude organization. You must also have the permissions to configure Auth0 for your organization.
## Set up SSO for Amplitude using Auth0
To configure SSO for Amplitude using Auth0:
1. In Auth0, navigate to the _[Clients](https://manage.auth0.com/#/clients)_ page.
2. Click _+ Create Client_ to create a new client for Amplitude. Don't worry about specifying the client type; Amplitude communicates with Auth0 over SAML.
3. Navigate to the _Addons_ tab and switch the SAML2 plugin toggle to "enabled."
4. Enter the Application Callback URL in the appropriate field in the modal that appears.
5. To find the entity ID and Assertion Consumer Service URL in Amplitude, navigate to _Settings > Organizational settings > Access & SSO Settings_.
6. After entering the URL and saving the SAML2 settings, open the _Usage_ tab and download the identity provider certificate metadata file.
7. Upload the metadata file in Amplitude, under _Settings > Organizational settings > Access & SSO Settings_.
8. Save your changes to enable SSO.
================================================================================
# Set up single sign-on (SSO) for Amplitude using AWS IAM Identity Center
URL: https://amplitude.com/docs/admin/single-sign-on/aws-iam-identity-center
================================================================================
# Set up single sign-on (SSO) for Amplitude using AWS IAM Identity Center
Amplitude provides a single sign-on integration with AWS IAM Identity Center (formerly AWS SSO) for customers on Scholarship, Growth, or Enterprise plans.
## Before you begin
For general information about SSO, go to [SSO in Amplitude](https://amplitude.com/docs/admin/single-sign-on/sso).
To set up SSO, you must be an [org admin](https://amplitude.com/docs/admin/account-management/manage-users) for your Amplitude organization. You must also have permission to create and configure custom SAML 2.0 applications in AWS IAM Identity Center.
## Set up SSO for Amplitude using AWS IAM Identity Center
To configure SSO for Amplitude using AWS IAM Identity Center:
1. Sign in to the AWS console and open _IAM Identity Center_.
2. In the left navigation, select _Applications_, then click **Add application**.
3. Select **I have an application I want to set up**, select the **SAML 2.0** application type, and then click **Next**.
4. Enter a **Display name** (for example, "Amplitude") and an optional **Description**.
5. In the IAM Identity Center metadata section, click **Download** to save the _IAM Identity Center SAML metadata file_. Save the XML file to your local drive.
6. In Amplitude, navigate to _Settings > Organization settings > Access & SSO Settings > Single Sign-On Settings_. From the _Identity Provider_ dropdown, select **Other**, and upload the metadata file you downloaded from AWS.
7. Copy the _Entity ID_ and _Assertion Consumer Service URL_ shown on the Amplitude SSO settings page.
8. In AWS, in the _Application metadata_ section, select **Manually type your metadata values** and paste the _Application ACS URL_ (the assertion consumer service URL from Amplitude) and the _Application SAML audience_ (the entity ID from Amplitude). Click **Submit** to create the application.
9. On the application detail page in AWS, open the _Actions_ dropdown and select _Edit attribute mappings_. Configure the **Subject** row with these values:
- **Maps to this string value or user attribute in IAM Identity Center**: `${user:email}`.
- **Format**: `emailAddress`.
10. Click **Add new attribute mapping** and add a second row with these values:
- **User attribute in the application**: `email`.
- **Maps to this string value or user attribute in IAM Identity Center**: `${user:email}`.
- **Format**: `basic`.
11. Click **Save changes**.
12. On the application detail page, select the **Assigned users and groups** tab.
13. Click **Assign users and groups**, choose the IAM Identity Center users or groups that need to sign in to Amplitude, and click **Assign users**.
14. Confirm that each assigned user has a _Primary email_ set on their IAM Identity Center user record. Without it, the `${user:email}` mapping resolves to an empty value and sign-in fails.
15. Sign in to the AWS access portal as an assigned user and click the Amplitude tile to test the integration.
{% callout type="note" %}
Steps 9 and 10 are required. AWS IAM Identity Center doesn't send any user attributes by default. If you skip the attribute mappings, the SAML assertion AWS sends to Amplitude either contains placeholder text instead of the user's email or contains an empty attribute statement, and sign-in fails.
{% /callout %}
================================================================================
# Set up single sign-on (SSO) for Amplitude using G Suite
URL: https://amplitude.com/docs/admin/single-sign-on/g-suite
================================================================================
# Set up single sign-on (SSO) for Amplitude using G Suite
Amplitude provides a single sign-on integration with G Suite for customers on Scholarship, Growth, or Enterprise plans.
## Before you begin
For general information about SSO, refer to [SSO in Amplitude](https://amplitude.com/docs/admin/single-sign-on/sso).
To set up SSO, you must be an org admin for your Amplitude organization. You must also be an administrator for your G Suite organization, and you must configure your own SSO settings. Amplitude enforces this requirement when users log in to your org.
## Set up SSO for Amplitude using G Suite
To configure SSO for Amplitude using G Suite:
1. In the [G Suite admin console](https://admin.google.com/), navigate to _Apps_ and click the _SAML apps_ card.
2. Click the **_+_** button (in the bottom left corner) to add a SAML app.
3. In the modal, click _Setup my own custom app_.
4. Under Option 2, click _Download_ to download the IDP metadata.
5. Upload the metadata file in Amplitude, under _Settings > Organizational settings > Access & SSO Settings_, then save the changes.
6. Go back to G Suite and continue with the app creation process. Enter a name and description and optionally upload the logo for easy recognition.
7. Next, G Suite prompts you for the "ACS URL" and "Entity ID".
To find the Entity ID and Assertion Consumer Service URL in Amplitude, navigate to _Settings > Organizational settings > Access & SSO Settings_.
8. Finally, in Google Admin, click _Finish_ to save the app and enable SSO.
{% callout type="note" %}
Review [just-in-time (JIT) provisioning settings for G Suite administration](http://cloud.google.com/identity/solutions/automate-user-provisioning). There may be a short "settling period" when setting up and validating the configuration. If users get 403 errors, wait a day and try JIT again.
{% /callout %}
================================================================================
# Set up single sign-on (SSO) for Amplitude using Microsoft Azure Active Directory
URL: https://amplitude.com/docs/admin/single-sign-on/azure-active-directory
================================================================================
# Set up single sign-on (SSO) for Amplitude using Microsoft Azure Active Directory
Amplitude provides a single sign-on integration with Microsoft Azure Active Directory for customers on Scholarship, Growth, or Enterprise plans.
## Before you begin
For general information about SSO, refer to [SSO in Amplitude](https://amplitude.com/docs/admin/single-sign-on/sso).
To set up SSO, you must be an org admin for your Amplitude organization. You must also be able to configure Azure Active Directory for your organization in Microsoft Azure.
## Set up SSO for Amplitude using Microsoft Azure Active Directory
To configure SSO for Amplitude using Azure Active Directory:
1. From the [Azure portal](https://portal.azure.com), navigate to the Azure Active Directory section.
2. Open the _Enterprise applications_ sub-section.
3. Click _+ New application_ to add a new application.
4. Search for Amplitude in the app gallery. From the results list, select Amplitude and click _Add_ in the bottom-right of the app summary.
5. Click _Single sign-on_ to open the SSO app settings. Then enter the identifier and the reply URL in the appropriate text fields.
Find these values under _Entity ID_ and _Assertion Consumer Service URL_, respectively, in Amplitude's SSO settings.
6. In the _User identifier_ field, select _user.mail_ from the drop-down list.
7. Save the changes. Then click _Metadata XML_ to download the metadata file.
8. In Amplitude, navigate to _Settings > Organization settings > Access & SSO Setting > Single Sign-On Settings_ and upload the metadata file. Choose Microsoft Azure Active Directory as the _Identity Provider_.
9. Save your changes to enable SSO.
================================================================================
# Set up single sign-on (SSO) for Amplitude using Okta
URL: https://amplitude.com/docs/admin/single-sign-on/okta
================================================================================
# Set up single sign-on (SSO) for Amplitude using Okta
Amplitude provides a single sign-on integration with Okta for customers on Scholarship, Growth, or Enterprise plans.
## Before you begin
For general information about SSO, refer to [SSO in Amplitude](https://amplitude.com/docs/admin/single-sign-on/sso).
To set up SSO, you must be an org admin for your Amplitude organization. You must also be able to configure your organization in Okta.
## Set up SSO for Amplitude using Okta
To configure SSO for Amplitude using Okta:
1. In Okta, navigate to the admin dashboard and click *Applications*.
2. On the _Applications_ page, click _Create App Integration_.
3. In the modal that appears, select the _SAML 2.0_ radio button and click _Next_.
4. Enter a name for the app. For easier recognition, you can also upload a logo to go with it. Then click _Next_.
5. Configure your SAML settings. Enter the single sign-on URL (ACS URL) and the audience URL (Entity ID) in the appropriate spaces. Then, from the _Application username_ dropdown, select _Email_.
You can find the Entity ID and Assertion Consumer Service URL in Amplitude, under _Settings > Organization settings > Access & SSO Settings > Single Sign-On settings_.
6. After you create the app, view the identity provider (**IdP**) metadata on the _Sign On_ tab in Okta.
7. Click the metadata to display the XML. Save this as an XML file. Many browsers can save the active page as a file with the `.xml` suffix.
8. In Amplitude, navigate to _Settings > Organization settings > Access & SSO Setting > Single Sign-On Settings_ and upload the metadata file.
9. Save your changes to enable SSO.
================================================================================
# Set up single sign-on (SSO) for Amplitude using OneLogin
URL: https://amplitude.com/docs/admin/single-sign-on/one-login
================================================================================
# Set up single sign-on (SSO) for Amplitude using OneLogin
Amplitude provides a single sign-on integration with OneLogin for customers on Scholarship, Growth, or Enterprise plans.
## Before you begin
For general information about SSO, refer to [SSO in Amplitude](https://amplitude.com/docs/admin/single-sign-on/sso).
To set up SSO, you must be an org admin for your Amplitude organization. You must also be able to configure your organization in OneLogin.
## Set up SSO for Amplitude using OneLogin
To configure SSO for Amplitude using OneLogin:
1. In OneLogin, click _Add Apps_ from the _Apps_ drop-down menu.
2. Enter "Amplitude" in the search box. Select the SAML2.0 app from the list of results.
3. Enter a name for the app in the _Display Name_ text box. Then click _Save_.
4. Open the _Configuration_ tab of the new app. Then enter your Amplitude org ID and click _Save_.
You can find your org ID in Amplitude's SSO settings. The org ID is at the end of the ACS URL.
5. From the _More Actions_ menu, click _SAML Metadata_ to download the metadata file.
6. In Amplitude, navigate to _Settings > Access & SSO Settings_, then click _Upload Metadata File_ to upload your SAML metadata file. Choose OneLogin as the _Identity Provider_.
7. Save your changes to enable SSO.
================================================================================
# Set up single sign-on (SSO) for Amplitude using another service
URL: https://amplitude.com/docs/admin/single-sign-on/set-up-single-sign-on-sso-for-amplitude-using-another-service
================================================================================
# Set up single sign-on (SSO) for Amplitude using another service
You can set up single sign-on (SSO) using a custom-built SSO provider or a provider not explicitly named in the Amplitude app. Amplitude is compatible with any SAML 2.0-compliant SSO provider.
## Before you begin
Read [single sign-on in Amplitude](https://amplitude.com/docs/admin/single-sign-on/sso) to understand the basic requirements.
## What your identity provider must send
Amplitude expects your identity provider to send a SAML response that contains the user's email address. At a minimum:
- Set the assertion **Subject** to the user's email address, with format `urn:oasis:names:tc:SAML:1.1:nameid-format:emailAddress`.
- Map at least one SAML attribute (for example, `email`) to a non-empty value. Some identity providers emit an empty `<AttributeStatement>` element when you don't configure any attributes, which prevents Amplitude from processing the SAML response.
- Sign either the SAML response, the assertion, or both. Amplitude accepts any of these signing modes.
If your identity provider supports it, set the assertion **Subject** to the user's email address rather than a username or numeric ID. Amplitude looks at the Subject first when resolving the user.
## Set up SSO for an unlisted ("Other") SSO provider
To set up SSO using a provider that isn't Auth0, AWS IAM Identity Center, G Suite, Microsoft Azure Active Directory, Okta, or OneLogin, click the gear icon in Amplitude and navigate to _Organization Settings > Access & SSO Settings_. Then, from the _Identity Provider_ dropdown, select _Other_.
Find the Entity ID and Assertion Consumer Service (ACS) URL on the same Amplitude SSO settings page. Both values are specific to your organization and follow these patterns:
- **Entity ID**: `https://amplitude.com/saml/2/metadata/<your-org-id>`
- **Assertion Consumer Service URL**: `https://amplitude.com/saml/2/acs/<your-org-id>`
Enter the Entity ID and ACS URL in the appropriate fields in your identity provider's app configuration. Some providers label the Entity ID field as Audience.
Next, download the IdP metadata file from your provider. In Amplitude, upload the metadata file, then click _Save_.
================================================================================
# Audit log
URL: https://amplitude.com/docs/admin/audit-log
================================================================================
# Audit log
The Audit Log tracks security events and user actions across your Amplitude organization, including who did what, when, and from which IP address. Organization admins use it to monitor configuration changes, user access, and authentication activity.
## Tracked events by category
The Audit Log tracks the following events:
| Risk level | Category | Events |
| ---------- | -------- | ------ |
| High | Project and configuration | Project creation, updates (permissions), and deletion. Project data export. |
| Medium | User management | User invitations. Role updates to or from Admin. Role permission changes. Create, update, or delete roles. User exports. Access toggles (for example, request access). Bulk access transfers or edits. User deletions. Group creation and member updates. |
| Medium | Access controls | SSO configuration changes (settings updates, toggles such as "require SSO"). |
| Low | Authentication | Login through SSO, magic link, password, or Google. Registration events. Password reset attempts. |
| Low | Content management | Chart, dashboard, or notebook deletion. Chart, dashboard, or notebook export. Cohort export to external destinations. |
| Low | User access | User profile views. User timeline views. |
## Data captured per event
Each audit log entry includes:
| Field | Description |
| ----- | ----------- |
| **Timestamp** | When the action occurred. |
| **Domain** | Category (for example, content, config, group). |
| **Feature** | Sub-category (for example, chart, user, group). |
| **Action** | What the user did (create, delete, update, invite, and so on). |
| **Target** | The entity the action affects. |
| **User (Email)** | Who performed the action. |
| **Org ID** | Which organization the action belongs to. |
| **App/Project ID** | Associated project (if relevant). |
| **IP Address** | The IP address of the user who performed the action. |
| **User Agent** | The browser or client info. |
| **Event Properties** | Additional context specific to the event (JSON). |
| **Error** | Error information if the action failed. |
{% callout type="note" heading="Availability through the API" %}
You can only access IP address, Org ID, User Agent, and Error metadata through the API endpoint, not the UI CSV export.
{% /callout %}
## Key behaviors and notes
- Audit logs retain up to 90 days of data.
- Audit logging is asynchronous and doesn't block the user's original action.
- Amplitude captures events automatically; you don't need to add instrumentation.
- The audit log scopes to the organization.
- Admins can access events across all projects in their org.
- You can search audit logs by user email in the UI.
- Audit logs exist in all production environments, including US and EU.
## Accessing audit logs
You can access audit logs from the _Organization Settings_ page in Amplitude or through the [Audit Logs API](https://amplitude.com/docs/apis/audit-logs).
### Access audit logs in the UI
1. Navigate to _Organization Settings_.
2. Select the **Audit Logs** tab.
Only organization admins can access the Audit Log menu item.
#### Summary cards
At the top of the Audit Logs view, summary cards show counts for the time period selected in the date picker:
| Card | Description |
| ---- | ----------- |
| **All Events** | Total count of logged events. |
| **High Risk Event** | Total count of high-risk activity. |
| **Medium Events** | Total count of medium-risk events. |
#### High-risk events table
A filtered table shows only high-risk security events, such as promoting a user to org admin or updating organization link settings. You can search and sort this table.
#### Controls
| Control | Description |
| ------- | ----------- |
| **Refresh** | Reload the latest audit log data. |
| **Export CSV** | Download all raw audit log data as a CSV file for offline analysis or compliance archival. |
### Access audit logs through the API
For programmatic access to the full raw audit log, use the REST API endpoint to query and download raw audit logs.
#### Obtain an org secret key
Before you use the API, request an organization secret key. Contact [Amplitude Customer Support](https://gethelp.amplitude.com/hc/en-us/categories/26943798330267-Amplitude-Technical-Support) and provide your organization ID. After Support generates your key, you can use it to authenticate and download audit logs securely.
#### Make the API request
**Endpoint:**
```http
POST https://amplitude.com/api/2/audit-logs/<ORG_ID>
```
**Example request:**
```bash
curl -X POST "https://amplitude.com/api/2/audit-logs/76273" \
-H "Authorization: Basic Base64<ORG_API_KEY:ORG_SECRET_KEY>" \
-H "Content-Type: application/json" \
-d '{
"start_date": "2025-11-01T00:00:00Z",
"end_date": "2025-11-10T23:59:59Z",
"filters": {
"domain": "auth",
"feature": "auth",
"action": "login"
},
"pagination": {
"limit": 100
}
}'
```
#### Required parameters
| Parameter | Required | Description |
| ------------ | -------- | ------------------------------------------- |
| `start_date` | Yes | Start of the date range in ISO 8601 format. |
| `end_date` | Yes | End of the date range in ISO 8601 format. |
All other fields (`filters`, `pagination`) are optional and refine your query.
#### API limitations
- Maximum 30-day query range for each request.
- 90-day data retention: You can access only the last 90 days of audit log data.
================================================================================
# Amplitude SDKs
URL: https://amplitude.com/docs/sdks
Updated: 2025-02-04
================================================================================
# Amplitude SDKs
This catalog lists Amplitude's official SDKs, grouped by product and platform across web, mobile, server, and game engines. Each SDK links to its reference documentation, including installation steps, configuration options, and lifecycle status. For a new implementation, choose the current SDK for your platform.
================================================================================
# Browser Unified SDK
URL: https://amplitude.com/docs/sdks/analytics/browser/browser-unified-sdk
================================================================================
# Browser Unified SDK
Amplitude offers multiple ways to install browser SDKs, each with different product support and version control options. This guide compares the three main installation methods.
{% callout type="tip" %}
To skip manual setup, use the [Amplitude Wizard CLI](https://amplitude.com/docs/get-started/setup-wizard-cli). It reads your codebase, proposes tracking events, and instruments the SDK automatically with your approval.
{% /callout %}
## Choose your installation method
Amplitude provides three ways to install browser SDKs:
| Method | Description | Version control | Best for |
| ------------------------------------------- | --------------------------------------------------- | --------------------------- | ---------------------------------------------------------------- |
| [Unified SDK (npm)](#unified-sdk-npm) | Single npm package with all Amplitude features | Customer-managed | Teams requiring reproducible builds and strict change management |
| [Unified Script (CDN)](#unified-script-cdn) | Single script tag that loads Amplitude capabilities | Amplitude-managed | Quick setup with automatic updates and sensible defaults |
| [GTM Template](#google-tag-manager) | Google Tag Manager template | Template version-controlled | Teams using GTM for tag management |
### Product support by installation method
Each installation method supports a different set of Amplitude products:
| Product | Unified Script (CDN) | Unified SDK (npm) | GTM Template |
| ------------------------------------------------------ | -------------------- | ----------------- | ---------------------- |
| Analytics (`@amplitude/analytics-browser`) | ✅ Included | ✅ Included | ✅ Included |
| Session Replay | ✅ Included | ✅ Included | ✅ Optional (checkbox) |
| Guides & Surveys | ⚠️ Separate script | ✅ Included | ✅ Optional (checkbox) |
| Web Experiment (`@amplitude/experiment-tag`) | ✅ Included | ❌ Not included | ❌ Not supported |
| Feature Experiment (`@amplitude/experiment-js-client`) | ❌ Not included | ✅ Included | ❌ Not supported |
{% callout type="note" heading="Web Experiment compared with Feature Experiment" %}
- **Web Experiment**: uses visual editing for no-code A/B testing on web pages. The Unified Script includes it automatically.
- **Feature Experiment**: uses code-based feature flags with the Experiment JavaScript SDK. The Unified npm package includes it.
{% /callout %}
## Unified SDK (npm)
The Unified SDK provides a single npm package (`@amplitude/unified`) that gives you access to Analytics, Session Replay, Feature Experiment, and Guides & Surveys through a single API. Install it with npm or yarn, and control the version in your `package.json`.
**Key characteristics:**
- Customer-managed package installation with full control over versions.
- Includes Feature Experiment (code-based feature flags), not Web Experiment (visual editor).
- To upgrade, bump the package version in your dependency file.
- Best for teams that require reproducible builds and strict change management.
{% callout type="info" heading="Individual product installation" %}
If you're concerned about bundle size and only need specific products, install them individually:
- [Analytics](https://amplitude.com/docs/sdks/analytics/browser/browser-sdk-2): for tracking user events and behavior.
- [Experiment](https://amplitude.com/docs/sdks/experiment-sdks/experiment-javascript): for running A/B tests and feature flags.
- [Session Replay](https://amplitude.com/docs/sdks/session-replay/session-replay-standalone-sdk): for capturing and replaying user sessions.
- [Guides and Surveys](https://amplitude.com/docs/guides-and-surveys/sdk): for in-product messaging and surveys.
{% /callout %}
### Install the Unified SDK
Install the dependency with npm or yarn.
{% tabs tabs="npm, yarn, AI prompt" %}
{% tab name="npm" %}
```bash
npm install @amplitude/unified
```
{% /tab %}
{% tab name="yarn" %}
```bash
yarn add @amplitude/unified
```
{% /tab %}
{% tab name="AI prompt" %}
Use the getting started prompt generator to create an installation prompt with your Amplitude API key and selected setup options.
{% get-data-flowing /%}
{% /tab %}
{% /tabs %}
### Initialize the Unified SDK
The Unified SDK provides a single initialization method that initializes all Amplitude features.
```typescript
import { initAll } from "@amplitude/unified";
initAll("AMPLITUDE_API_KEY");
```
### Access SDK features
The Unified SDK provides access to all Amplitude features through a single interface:
{% callout type="info" heading="Feature documentation" %}
For details about each product's features and APIs, refer to its documentation:
- [Analytics Browser SDK](https://amplitude.com/docs/sdks/analytics/browser/browser-sdk-2).
- [Experiment JavaScript SDK](https://amplitude.com/docs/sdks/experiment-sdks/experiment-javascript).
- [Session Replay Standalone SDK](https://amplitude.com/docs/sdks/session-replay/session-replay-standalone-sdk).
- [Guides and Surveys Web SDK](https://amplitude.com/docs/guides-and-surveys/sdk).
{% /callout %}
```typescript
import { track, identify, experiment, sessionReplay } from "@amplitude/unified";
// Track events
track("Button Clicked", { buttonName: "Sign Up" });
// Identify users
identify(new Identify().set("userType", "premium"));
// Access Experiment features
const variant = await experiment.fetch("experiment-key");
// Access Session Replay features
sessionReplay.flush();
```
### Configuration
The Unified SDK supports configuration options for all Amplitude features. Configure each product individually while sharing some common options.
```typescript
import { initAll } from "@amplitude/unified";
initAll("AMPLITUDE_API_KEY", {
// Shared options for all SDKs (optional)
serverZone: "US", // or 'EU'
instanceName: "my-instance",
// Analytics options
analytics: {
// Analytics configuration options
},
// Session Replay options
sessionReplay: {
// Session Replay configuration options
sampleRate: 1, // To enable session replay
},
// Experiment options
experiment: {
// Experiment configuration options
},
// Guides and Surveys options
engagement: {
// Guides and Surveys configuration options
},
});
```
#### Shared options
| Name | Type | Default | Description |
| -------------- | ---------------- | ------------------- | ------------------------------------------- |
| `serverZone` | `'US'` or `'EU'` | `'US'` | The server zone to use for all SDKs. |
| `instanceName` | `string` | `$default_instance` | A unique name for this instance of the SDK. |
#### Analytics options
The Unified Browser SDK supports all options from `@amplitude/analytics-browser`. Refer to the [Analytics Browser SDK documentation](https://amplitude.com/docs/sdks/analytics/browser/browser-sdk-2#initialize-the-sdk) for details.
#### Session Replay options
The Unified Browser SDK supports all options from `@amplitude/plugin-session-replay-browser`. Refer to the [Session Replay Plugin documentation](https://amplitude.com/docs/sdks/session-replay/session-replay-plugin#configuration) for more information. To enable Session Replay, set `config.sessionReplay.sampleRate` to a non-zero value.
Sample rate controls the rate at which Amplitude captures session replays. For example, if you set `config.sessionReplay.sampleRate` to `0.5`, Session Replay captures roughly half of all sessions.
#### Experiment options
The Unified Browser SDK supports all options from `@amplitude/plugin-experiment-browser`. Refer to the [Experiment documentation](https://amplitude.com/docs/sdks/experiment-sdks/experiment-javascript#configuration) for details.
#### Guides and Surveys options
The Unified Browser SDK supports all [Guides and Surveys options](https://amplitude.com/docs/sdks/guides-and-surveys/sdk#initialize-the-sdk). The engagement plugin initializes by default.
##### Opting out of Guides & Surveys initialization
Guides & Surveys initializes by default in `@amplitude/unified`. If you don't use Guides & Surveys and want to prevent the engagement SDK from loading, pass `skip: true` in the `engagement` block. This prevents `amplitude.engagement.*` localStorage entries on properties that don't use Guides & Surveys.
**Requirements:** Requires `@amplitude/engagement-browser` 1.0.10 or later.
```typescript
initAll("AMPLITUDE_API_KEY", {
// ... other options
engagement: {
skip: true,
},
});
```
When `skip: true`, the engagement plugin returns immediately without setting up storage, network, or any Guides & Surveys-related side effects.
To enable Guides & Surveys later, remove the `skip: true` option (or set it to `false`) and re-initialize.
## Unified script (CDN)
The Unified Script is a single script tag that loads Amplitude browser capabilities from Amplitude's CDN. Amplitude controls the versions of the underlying SDKs remotely, offering a "single line of code" experience with sensible defaults and optional remote or manual configuration.
**Key characteristics:**
- Amplitude manages SDK versions and can patch bugs or improve performance centrally without requiring a customer release.
- Includes Web Experiment (visual editor) by default.
- Session Replay and Web Experiment enable automatically with default settings.
- Guides & Surveys requires a separate script because of size concerns.
### Install the Unified Script
Add the following script tag to the `<head>` of your site:
```html
<script src="https://cdn.amplitude.com/script/AMPLITUDE_API_KEY.js"></script>
```
Replace `AMPLITUDE_API_KEY` with your project's API key.
### Initialize the Unified Script
The Unified Script enables Session Replay and Web Experiment by default. For manual configuration:
```html
<script src="https://cdn.amplitude.com/script/AMPLITUDE_API_KEY.js"></script>
<script>
window.amplitude.init("AMPLITUDE_API_KEY", {
defaultTracking: true,
autocapture: true,
fetchRemoteConfig: true,
});
// Enable Session Replay with custom sample rate
window.amplitude.add(window.sessionReplay.plugin({ sampleRate: 1 }));
</script>
```
### Add Guides & Surveys to the Unified Script
Because of size concerns, Guides & Surveys requires a separate script. Add it after the Unified Script:
```html
<script src="https://cdn.amplitude.com/script/AMPLITUDE_API_KEY.js"></script>
<script src="https://cdn.amplitude.com/script/AMPLITUDE_API_KEY.engagement.js"></script>
<script>
window.amplitude.add(window.engagement.plugin());
window.amplitude.init("AMPLITUDE_API_KEY", {
fetchRemoteConfig: true,
autocapture: true,
});
</script>
```
Refer to the [Guides and Surveys SDK documentation](https://amplitude.com/docs/guides-and-surveys/sdk) for more configuration options.
## Google Tag Manager
The [Amplitude GTM template](https://amplitude.com/docs/data/source-catalog/google-tag-manager) directly wraps the Analytics Browser 2.0 SDK (`@amplitude/analytics-browser`). It doesn't use the Unified SDK or Unified Script.
**Key characteristics:**
- Template version-controlled through GTM.
- Supports Analytics, Session Replay, and Guides & Surveys.
- Doesn't support Web Experiment or Feature Experiment.
- Session Replay and Guides & Surveys default to disabled and require manual checkbox selection.
### Enable Session Replay and Guides & Surveys in GTM
To enable these features:
1. Go to your Amplitude tag in GTM.
2. In the tag configuration, select the **Session Replay** checkbox to enable session replays.
3. Select the **Guides & Surveys** checkbox to enable in-product messaging.
4. Save and publish your changes.
Refer to the [Google Tag Manager documentation](https://amplitude.com/docs/data/source-catalog/google-tag-manager) for detailed configuration options.
================================================================================
# Browser SDK 2
URL: https://amplitude.com/docs/sdks/analytics/browser/browser-sdk-2
================================================================================
# Browser SDK 2
Amplitude's Browser SDK 2 lets you send events to Amplitude.
{% callout type="tip" %}
To skip manual setup, use the [Amplitude Wizard CLI](https://amplitude.com/docs/get-started/setup-wizard-cli). It reads your codebase, proposes tracking events, and instruments the SDK automatically with your approval.
{% /callout %}
## Install the SDK
Install the dependency with npm, yarn, or the script loader.
{% callout type="info" heading="Unified SDK" %}
Install the [Browser Unified SDK](https://amplitude.com/docs/sdks/analytics/browser/browser-unified-sdk) to access the Experiment SDK along with other Amplitude products (Analytics, Session Replay). The Unified SDK provides a single entry point for all Amplitude features and simplifies the integration by initializing and configuring all components for you.
{% /callout %}
{% tabs tabs="Script loader, npm, yarn" %}
{% tab name="Script loader" %}
When you use the script loader and enable Autocapture, Browser SDK tracks interactions on your site automatically. For more information, refer to [Autocapture](#autocapture).
{% get-data-flowing-snippet /%}
{% /tab %}
{% tab name="npm" %}
```bash
# Install Analytics SDK only
npm install @amplitude/analytics-browser
# Or install Unified SDK to get access to all Amplitude products
npm install @amplitude/unified
```
Import Amplitude into your project
```js
// If using Analytics SDK only
import * as amplitude from "@amplitude/analytics-browser";
// If using Unified SDK
import * as amplitude from "@amplitude/unified";
```
{% /tab %}
{% tab name="yarn" %}
```bash
# Install Analytics SDK only
yarn add @amplitude/analytics-browser
# Or install Unified SDK to get access to all Amplitude products
yarn add @amplitude/unified
```
Import Amplitude into your project
```js
// If using Analytics SDK only
import * as amplitude from "@amplitude/analytics-browser";
// If using Unified SDK
import * as amplitude from "@amplitude/unified";
```
{% /tab %}
{% /tabs %}
## Initialize the SDK
{% callout type="warning" heading="Load and initialize only when context is ready" %}
Don't load the Amplitude SDK from third-party scripts that run before the page has fully loaded. In those setups, user identifiers, traits, and page URL or state often aren't available yet, so the SDK may send early events with missing or incorrect properties. Initialize the SDK only after your app has access to all relevant data (for example, user ID, user properties, and the final page URL).
{% /callout %}
{% callout type="note" heading="Sending events" %}
This SDK uses the [HTTP V2](https://amplitude.com/docs/apis/analytics/http-v2) API and follows the same constraints for events. Make sure that all events logged in the SDK have the `event_type` field and at least one of `deviceId` (included by default) or `userId`, and follow the HTTP API's constraints on each of those fields.
To prevent instrumentation issues, device IDs and user IDs must be strings with a length of 5 characters or more. If an event contains a device ID or user ID that's too short, Amplitude removes the ID value from the event. If the event doesn't have a `userId` or `deviceId` value, Amplitude may reject the upload with a 400 status. Override the default minimum length of 5 characters by setting the `minIdLength` config option.
{% /callout %}
This SDK requires initialization before you can instrument any events and requires your Amplitude project's API key. You can pass an optional `userID` and `config` object in this call.
```js
// Option 1, initialize with Amplitude API key only
amplitude.init(AMPLITUDE_API_KEY);
// Option 2, initialize with options
amplitude.init(AMPLITUDE_API_KEY, options);
// Option 3, initialize with user ID if it's already known
amplitude.init(AMPLITUDE_API_KEY, "user@amplitude.com");
// Option 4, initialize with a user ID and options
amplitude.init(AMPLITUDE_API_KEY, "user@amplitude.com", options);
```
{% callout type="warning" heading="" %}
When using the SDK in an [Angular](https://angular.dev/) app with [Zone.js](https://angular.dev/api/core/NgZone), invoke `init` [outside of the Angular zone](https://angular.dev/api/core/NgZone#runOutsideAngular).
```javascript
runOutsideAngular(function () {
amplitude.init(...args);
});
```
The Angular zone overwrites certain DOM functions that, when invoked by [Amplitude autocapture](https://amplitude.com/docs/sdks/analytics/browser/browser-sdk-2#autocapture), cause some user interactions to break.
{% /callout %}
{% callout type="info" heading="Next.js Integration" %}
For detailed instructions on integrating Amplitude with Next.js applications, including both client-side and server-side setups, refer to the [Next.js Installation Guide](https://amplitude.com/docs/sdks/frameworks/nextjs-installation-guide).
{% /callout %}
## Configure the SDK
{% accordion title="SDK configuration options" %}
| Name | Description | Default Value |
| -------------------------- | ---------------------------------------------------------------------------------------------------------------------------------------------------------------------------------------------------------------------------------------------------------------------------------- | --------------------------------------- |
| `instanceName` | `string`. The instance name. | `$default_instance` |
| `flushIntervalMillis` | `number`. Sets the interval of uploading events to Amplitude in milliseconds. | 1,000 (1 second) |
| `flushQueueSize` | `number`. Sets the maximum number of events batched in a single upload attempt. | 30 events |
| `flushMaxRetries` | `number`. Sets the maximum number of retries for failed upload attempts. This is only applicable to errors that the SDK can retry. | 5 times. |
| `logLevel` | `LogLevel.None` or `LogLevel.Error` or `LogLevel.Warn` or `LogLevel.Verbose` or `LogLevel.Debug`. Sets the log level. You can also use numeric values: `0` (None), `1` (Error), `2` (Warn), `3` (Verbose), or `4` (Debug). | `LogLevel.Warn` |
| `loggerProvider ` | `Logger`. Sets a custom `loggerProvider` class that implements the [Logger interface](https://github.com/amplitude/Amplitude-TypeScript/blob/main/packages/analytics-types/src/logger.ts#L1-L8) to emit log messages to a specified destination. | [Amplitude Logger](https://github.com/amplitude/Amplitude-TypeScript/blob/main/packages/analytics-core/src/logger.ts) |
| `minIdLength` | `number`. Sets the minimum length for the value of `userId` and `deviceId` properties. | `5` |
| `optOut` | `boolean`. Sets permission to track events. Setting a value of `true` prevents Amplitude from tracking and uploading events. | `false` |
| `serverUrl` | `string`. Sets the URL where the SDK uploads events. | `https://api2.amplitude.com/2/httpapi` |
| `serverZone` | `EU` or `US`. Sets the Amplitude server zone. Set this to `EU` for Amplitude projects created in `EU` data center. | `US` |
| `useBatch` | `boolean`. Sets whether to upload events to Batch API instead of the default HTTP V2 API or not. | `false` |
| `appVersion` | `string`. Sets an app version for tracked events. This can be the version of your application. For example: "1.0.0". | `undefined` |
| `autocapture` | `boolean\|AutocaptureOptions`. Configures autocapture tracking. Refer to [Autocapture](#autocapture). | |
| `defaultTracking` | `boolean`. Deprecated in version 2.10.0. Use `autocapture` instead. Configures default event tracking. | `true` |
| `customEnrichment` | `boolean`. Whether the SDK adds the [Custom Enrichment plugin](https://amplitude.com/docs/sdks/analytics/browser/custom-enrichment-plugin), which runs an Amplitude-managed enrichment function on every event. Available in version 2.37.0 and later. | `false` |
| `deviceId` | `string`. Sets an identifier for the device running your application. | `UUID()` |
| `identify` | `Identify`. Calls "identify" with this object during initialization. Called before Autocapture events, like `session_start`, ensuring proper attribution of events. | `undefined` |
| `cookieOptions.domain` | `string`. Sets the domain property of cookies created. | `undefined` |
| `cookieOptions.expiration` | `number`. Sets expiration of cookies created in days. | 365 days |
| `cookieOptions.sameSite` | `string`. Sets `SameSite` property of cookies created. | `Lax` |
| `cookieOptions.secure` | `boolean`. Sets `Secure` property of cookies created. | `false` |
| `cookieOptions.upgrade` | `boolean`. Sets upgrading from cookies created by [maintenance Browser SDK](https://amplitude.com/docs/sdks/analytics/browser/javascript-sdk). If `true`, new Browser SDK deletes cookies created by maintenance Browser SDK. If `false`, Browser SDK keeps cookies created by maintenance Browser SDK. | `true` |
| `identityStorage` | `string`. Sets storage API for user identity. Options include `cookie` for `document.cookie`, `localStorage` for `localStorage`, `sessionStorage` for `sessionStorage`, or `none` to opt-out of persisting user identity. | `cookie` |
| `partnerId` | `string`. Sets partner ID. Amplitude requires the customer who built an event ingestion integration to add the partner identifier to `partner_id`. | `undefined` |
| `sessionTimeout` | `number`. Sets the period of inactivity from the last tracked event before a session expires in milliseconds. | 1,800,000 milliseconds (30 minutes) |
| `storageProvider` | `Storage<Event[]>`. Sets a custom implementation of `Storage<Event[]>` to persist unsent events. | `LocalStorage` |
| `userId` | `string`. Sets an identifier for the tracked user. Must have a minimum length of 5 characters unless overridden with the `minIdLength` option. | `undefined` |
| `trackingOptions` | `TrackingOptions`. Configures tracking of extra properties. | Enable all tracking options by default. |
| `transport` | `TransportType \| TransportConfig`. Sets the request API to use. Pass a string (`'fetch'`, `'xhr'`, or `'beacon'`), or an object with `type`, `headers`, and `enableKeepalive` properties. Use `headers` to set custom HTTP headers. Go to [Custom HTTP request headers](#custom-http-request-headers). Use `enableKeepalive` to control whether `fetch` requests survive page navigation. Go to [Survive page navigation with keepalive](#survive-page-navigation-with-keepalive). | `'fetch'` |
| `enableRequestBodyCompression` | `boolean`. Enables gzip compression for event upload request bodies. When using Amplitude's default ingestion endpoints, the SDK enables compression automatically. When using a custom `serverUrl`, set this to `true` to enable compression. Refer to [Request body compression](#request-body-compression) for more details. | `false` (custom servers), `true` (default endpoints) |
| `offline` | `boolean`. Whether the SDK connects to the network. Refer to [Offline mode](#offline-mode). | `false` |
| `fetchRemoteConfig` | `boolean`. _Deprecated._ Use `remoteConfig.fetchRemoteConfig` instead. Whether the SDK fetches remote configuration. Refer to [Remote configurations](#remote-configuration). | `true` |
| `remoteConfig` | `object`. Remote configuration options. Go to [Remote configuration](#remote-configuration). Fields: `fetchRemoteConfig` (`boolean`, default `true`): whether the SDK fetches remote configuration. `serverUrl` (`string`): custom server URL for proxying remote config requests. | `undefined` |
{% /accordion %}
### Configure batching behavior
To support high-performance environments, the SDK sends events in batches. The SDK queues in memory every event the `track` method logs. Customize this behavior with the `flushQueueSize` and `flushIntervalMillis` configuration parameters. If you plan to send large batches of data at once, set `useBatch` to `true` and `setServerUrl` to the batch API: `https://api2.amplitude.com/batch`. Both standard and batch modes use the same event upload threshold and flush time intervals.
### EU data residency
To send data to Amplitude's EU-based servers, set the server zone when you initialize the client. After you set the server zone, the SDK sends to the region determined by this setting.
```ts
amplitude.init(AMPLITUDE_API_KEY, {
serverZone: "EU",
});
```
{% callout type="note" heading="Data residency requirement" %}
To send data to Amplitude's EU servers, your organization must use the EU data storage region, which you set during signup.
{% /callout %}
### Debugging
Control the level of logs the SDK prints to the console with the following `logLevel` settings:
| Log level | Description |
| --------- | ------------------------------------------------------------------------------------------------------------------------------------------------------------ |
| `none` | Suppresses all log messages |
| `error` | Shows error messages only |
| `warn` | Default. Shows error and warning messages. |
| `verbose` | Shows informative messages. |
| `debug` | Shows all messages, including function context information for each public method the SDK invokes. Amplitude recommends this log level for development only. |
Set the `logLevel` parameter.
```ts
amplitude.init(AMPLITUDE_API_KEY, OPTIONAL_USER_ID, {
logLevel: amplitude.Types.LogLevel.Warn,
});
```
{% callout type="note" title="Using numeric values for logLevel" %}
In environments where you can't import the `LogLevel` enum (such as Google Tag Manager), use numeric values instead:
| Numeric value | Log level | Enum equivalent |
| ------------- | --------- | ------------------ |
| `0` | None | `LogLevel.None` |
| `1` | Error | `LogLevel.Error` |
| `2` | Warn | `LogLevel.Warn` |
| `3` | Verbose | `LogLevel.Verbose` |
| `4` | Debug | `LogLevel.Debug` |
For example, to suppress all logs in GTM, set `logLevel` to `0`:
```js
// In GTM configuration
logLevel: 0;
```
Don't use string values like `"LogLevel.None"` in GTM, as these won't work correctly.
{% /callout %}
The default logger outputs log to the developer console. You can provide your own logger implementation based on the `Logger` interface for any customization purpose. For example, collecting any error messages from the SDK in a production environment.
Set the logger by configuring the `loggerProvider` with your own implementation.
```ts
amplitude.init(AMPLITUDE_API_KEY, OPTIONAL_USER_ID, {
loggerProvider: new MyLogger(),
});
```
#### Debug mode
Enable the debug mode by setting the `logLevel` to "Debug", for example:
```ts
amplitude.init(AMPLITUDE_API_KEY, OPTIONAL_USER_ID, {
logLevel: amplitude.Types.LogLevel.Debug,
});
```
With the default logger, the SDK outputs extra function context information to the developer console when you invoke any SDK public method, including:
- `type`: Category of this context, for example "invoke public method".
- `name`: Name of invoked function, for example "track".
- `args`: Arguments of the invoked function.
- `stacktrace`: Stacktrace of the invoked function.
- `time`: Start and end timestamp of the function invocation.
- `states`: Useful internal states snapshot before and after the function invocation.
## Performance
The Browser SDK 2 minimizes its impact on page performance through event batching, asynchronous processing, and optimizing bundle sizes.
### Bundle size
The Browser SDK 2 bundle size varies based on the installation method and features you use.
For the most up-to-date bundle size information, check the [npm package page](https://www.npmjs.com/package/@amplitude/analytics-browser) or [BundlePhobia](https://bundlephobia.com/package/@amplitude/analytics-browser).
### Runtime performance
The Browser SDK 2 runs asynchronously and doesn't block the main thread during event tracking. Performance characteristics include:
- **Event tracking**: Event tracking operations are non-blocking and typically complete in less than 1ms for each event.
- **Network requests**: The SDK batches events and sends them asynchronously, minimizing network overhead. The default configuration batches up to 30 events or sends every 1 second, whichever comes first.
- **Memory usage**: The SDK maintains a small in-memory queue for event batching. Memory usage scales with the number of queued events (default: up to 30 events).
- **CPU impact**: Event processing and batching operations have minimal CPU impact, typically less than 1% of CPU time during normal operation.
### Optimization tips
To further optimize performance:
- Adjust `flushQueueSize` and `flushIntervalMillis` to balance between network efficiency and memory usage.
- Use the `offline` mode to defer event uploads when network conditions are poor.
- Enable `useBatch` mode for high-volume event tracking to reduce the number of HTTP requests.
## Autocapture (replaces defaultTracking)
Starting in SDK version 2.10.0, the Browser SDK can autocapture events when you enable it, and adds a configuration to control the collection of autocaptured events. The Browser SDK can autocapture the following event types:
- Attribution
- Page views
- Sessions
- Form interactions
- File downloads
- Element interactions
- Page URL enrichment
- Network tracking
- Web vitals
{% accordion title="Autocapture options" %}
| Name | Description |
|------|-------------|
| `config.autocapture.attribution` | Optional. Type: `boolean`. Enables or disables marketing attribution tracking. If `true`, Amplitude tracks marketing attribution events. Default value is `true`. |
| `config.autocapture.pageViews` | Optional. Type: `boolean`. Enables or disables default page view tracking. If `true`, Amplitude tracks page view events on initialization. Tracked event properties include: `[Amplitude] Page Domain`, `[Amplitude] Page Location`, `[Amplitude] Page Path`, `[Amplitude] Page Title`, `[Amplitude] Page URL`. Default value is `true`. Refer to [Track page views](#track-page-views) for more information. |
| `config.autocapture.sessions` | Optional. Type: `boolean`. Enables or disables session tracking. If `true`, Amplitude tracks session start and session end events. Otherwise, Amplitude doesn't track session events. When this setting is `false`, Amplitude tracks `sessionId` only. Default value is `true`. Refer to [Track sessions](#track-sessions) for more information. |
| `config.autocapture.formInteractions` | Optional. Type: `boolean`. Enables or disables form interaction tracking. If `true`, Amplitude tracks form start and form submit events. Tracked event properties include: `[Amplitude] Form ID`, `[Amplitude] Form Name`, `[Amplitude] Form Destination`. Default value is `true`. Refer to [Track form interactions](#track-form-interactions) for more information. |
| `config.autocapture.fileDownloads` | Optional. Type: `boolean`. Enables or disables file download tracking. If `true`, Amplitude tracks file download events. Tracked event properties include: `[Amplitude] File Extension`, `[Amplitude] File Name`, `[Amplitude] Link ID`, `[Amplitude] Link Text`, `[Amplitude] Link URL`. Default value is `true`. Refer to [Track file downloads](#track-file-downloads) for more information. |
| `config.autocapture.elementInteractions` | Optional. Type: `boolean`. Enables or disables element interaction tracking. If `true`, Amplitude tracks clicks and form field interactions. Default value is `false`. Go to [Track element interactions](#track-element-interactions) for more information and configuration options. |
| `config.autocapture.frustrationInteractions` | Optional. Type: `boolean`. Enables or disables frustration interaction tracking. If `true`, Amplitude tracks rage clicks and dead clicks. Error clicks and thrashed cursor are available separately (minimum SDK version 2.40.0). Default value is `false`. Review [Track frustration interactions](#track-frustration-interactions) for more information and configuration options. Minimum SDK version 2.24.0. |
| `config.autocapture.pageUrlEnrichment` | Optional. Type: `boolean`. Enables or disables page URL enrichment tracking. If `true`, Amplitude automatically adds page URL-related properties to all events, including previous page information and page type classification. Default value is `true`. Go to [Page URL enrichment plugin](#page-url-enrichment-plugin) for more information. |
| `config.autocapture.networkTracking` | Optional. Type: `boolean`. Enables or disables capturing network request events invoked by [XHR](https://developer.mozilla.org/en-US/docs/Web/API/XMLHttpRequest) and [Fetch](https://developer.mozilla.org/en-US/docs/Web/API/Fetch_API). If `true`, Amplitude tracks failed network requests. To configure what Amplitude captures, set this as a network tracking options object. Default value is `false`. Refer to [Track network interactions](#track-network-requests) for more information and configuration options. |
| `config.autocapture.webVitals` | Optional. Type: `boolean`. Enables or disables Core Web Vitals tracking. If `true`, Amplitude automatically captures web performance metrics (INP, LCP, FCP, CLS, TTFB) and sends them as `[Amplitude] Web Vitals` events. Default value is `false`. Refer to [Track web vitals](#track-web-vitals) for more information. Minimum SDK version 2.27.0. |
{% /accordion %}
### Remote configuration
Autocapture supports [remote configuration](#remote-configuration). For more information, refer to [Autocapture Settings](https://amplitude.com/docs/data/amplitude-data-settings#autocapture).
### Disable Autocapture
To disable Autocapture, refer to the following code sample.
```ts
// Disable individual default tracked events
amplitude.init(AMPLITUDE_API_KEY, OPTIONAL_USER_ID, {
autocapture: {
attribution: false,
pageViews: false,
sessions: false,
formInteractions: false,
fileDownloads: false,
elementInteractions: false,
pageUrlEnrichment: false,
webVitals: false,
},
});
// Disable all default tracked events
amplitude.init(AMPLITUDE_API_KEY, OPTIONAL_USER_ID, {
autocapture: false,
});
```
### Track marketing attribution
Amplitude tracks marketing attribution by default. Browser SDK 2 captures UTM parameters, referrer information, and click IDs.
As of Browser SDK version 2.45.0, both attribution persistence methods are on by default:
- **User property tracking**: Tracks campaign parameters as user properties through identify events for first-touch and multi-touch attribution.
- **Event property tracking**: Attaches campaign parameters to each event's properties for event-level attribution granularity. Use with [Persisted Properties](https://amplitude.com/docs/data/persisted-properties) to select different attribution models.
Both methods work with no configuration change.
{% accordion title="Attribution overview" %}
Amplitude tracks marketing attribution to identify your user's traffic source using the UTM, referrer, and click ID parameters.
#### UTM parameters
UTM (Urchin Traffic Monitor) parameters help you analyze the effectiveness of different ad campaigns and referring sites. UTM parameters are case-sensitive, so Amplitude treats them as different values when the capitalization varies.
There are five different standard UTM parameters:
| Name | Description |
| -------------- | -------------------------------------------------------------------------------------------------------------------------------- |
| `utm_source` | This identifies which website sent the traffic (for example, Google, Facebook) |
| `utm_medium` | This identifies a specific campaign used (for example, "summer_sale") |
| `utm_campaign` | This identifies a specific campaign used (for example, "summer_sale") |
| `utm_term` | This identifies paid search terms used (for example, product+analytics) |
| `utm_content` | This identifies what brought the user to the site and is commonly used for A/B testing (for example, "banner-link", "text-link") |
Here is an example URL with UTM parameters:
```bash
https://www.amplitude.com/?utm_source=newsletter&utm_campaign=product_analytics_playbook&utm_medium=email&utm_term=product%20analytics&utm_content=banner-link
```
#### Referrer parameters
Referrer is the URL of the page that linked to the destination page. Amplitude tracks the following parameters:
| Name | Description |
| ------------------ | ---------------------------------------------------------------------------------------------------------- |
| `referrer` | The last page the user was on (for example, `https://amplitude.com/behavioral-analytics-platform?ref=nav`) |
| `referring_domain` | The domain that the user was last on (for example, `https://amplitude.com`) |
Referrer is an empty string (`''`) if the user navigated to the destination page directly.
#### Click ID parameters
Click IDs are campaign identifiers included as URL query parameters. Ad platforms use these IDs to identify the campaign and other attributes. While Amplitude doesn't have access to further campaign attributes associated to Click IDs, Amplitude can track Click ID values specified in the following table.
| Name | Description |
| ------------- | --------------------------------------------------------- |
| `dclid` | Google Marketing Platform click identifier |
| `fbclid` | Facebook click identifier |
| `gbraid` | Google click identifier on iOS for web-to-app measurement |
| `wbraid` | Google click identifier on iOS for app-to-web measurement |
| `gclid` | Google click identifier |
| `ko_click_id` | Kochava click identifier |
| `li_fat_id` | LinkedIn click identifier |
| `msclkid` | Microsoft click identifier |
| `rdt_cid` | Reddit click identifier |
| `ttclid` | TikTok click identifier |
| `twclid` | Twitter click identifier |
#### First-touch attribution
When using user property tracking (default), Amplitude captures the initial attribution data at the start of the first session. Amplitude sets the first-touch attribution values when it sees a user's attribution data for the first time. Amplitude sets the following user properties one time:
- `initial_utm_source`
- `initial_utm_medium`
- `initial_utm_campaign`
- `initial_utm_term`
- `initial_utm_content`
- `initial_referrer`
- `initial_referring_domain`
- `initial_gclid`
- `initial_fbclid`
- `initial_dclid`
- `initial_gbraid`
- `initial_ko_click_id`
- `initial_msclkid`
- `initial_ttclid`
- `initial_twclid`
- `initial_wbraid`
- `initial_li_fat_id`
- `initial_rdt_cid`
#### Multi-touch attribution
When using user property tracking (default), Amplitude captures the attribution data at the start of each session, and sets those values as user properties. For organic or direct traffic, these properties may not be available. Therefore, Amplitude unsets these user properties from user identity.
For every new campaign, Amplitude captures the changes regardless of the state of the user session. You can configure `resetSessionOnNewCampaign` to `true` to reset the session on every new campaign. The default behavior doesn't reset the session on new campaign.
Amplitude tracks the following as user properties:
- `utm_source`
- `utm_medium`
- `utm_campaign`
- `utm_term`
- `utm_content`
- `referrer`
- `referring_domain`
- `gclid`
- `fbclid`
- `dclid`
- `gbraid`
- `ko_click_id`
- `msclkid`
- `ttclid`
- `twclid`
- `wbraid`
- `li_fat_id`
- `rdt_cid`
{% /accordion %}
Set `config.autocapture.attribution` to `false` to disable marketing attribution tracking.
```ts
amplitude.init(AMPLITUDE_API_KEY, OPTIONAL_USER_ID, {
autocapture: {
attribution: false,
},
});
```
#### Advanced configuration for marketing attribution tracking
{% accordion title="Marketing attribution configuration" %}
| Name | Description |
|------|-------------|
| `config.autocapture.attribution.trackingMethod` | Optional. Type: `'userProperty'` or `'eventProperty'` or `['userProperty', 'eventProperty']`. Configures how the SDK persists campaign attribution data. Set to `'userProperty'` to track as user properties only, `'eventProperty'` to attach campaign parameters to event properties only, or `['userProperty', 'eventProperty']` to use both. The default value is `['userProperty', 'eventProperty']` as of version 2.45.0. |
| `config.autocapture.attribution.fallbackAttributionEvent` | Optional. Type: `boolean`. When `trackingMethod` includes `'eventProperty'`, fires an `[Amplitude] Attribution` event on each page view and SPA navigation as a fallback when the SDK doesn't track other events. This ensures Amplitude captures campaign data even if users don't trigger other events. Applies only to event property tracking. The default value is `false`. |
| `config.autocapture.attribution.excludeReferrers` | Optional. Type: Array of `string` or `RegExp`. Sets rules to decide which referrers to exclude from tracking as traffic source. Use string values for exact matching and RegExp values for pattern matching against the referring domain. When you don't set this option, the SDK excludes the current domain (and its subdomains). If explicitly adding an external referrer to exclude, you must also add the current domain (and its subdomains) as more referrers to exclude. For user property based attribution tracking. |
| `config.autocapture.attribution.excludeInternalReferrers` | Optional. Type: `boolean` or `{ condition: 'always' \| 'ifEmptyCampaign' }`. When enabled, the SDK doesn't track campaign information when the referrer and the current page are on the same domain (internal referrer). Set to `true` or `{ condition: 'always' }` to always skip campaign tracking for internal referrers. Set to `{ condition: 'ifEmptyCampaign' }` to always skip campaign tracking for internal referrers where there are no UTM parameters or click IDs (empty campaign). For user property based attribution tracking.
| `config.autocapture.attribution.initialEmptyValue` | Optional. Type: `string`. Sets the value to represent undefined/no initial campaign parameter for first-touch attribution. The default value is `"EMPTY"`. For user property based attribution tracking. |
| `config.autocapture.attribution.resetSessionOnNewCampaign` | Optional. Type: `boolean`. Configures Amplitude to start a new session if any campaign parameter changes. The default value is `false`. For user property based attribution tracking. |
{% /accordion %}
#### Event property tracking
As of Browser SDK version 2.45.0, event property tracking is on by default. The SDK attaches campaign parameters (UTMs, click IDs, referrer, and referring_domain) to the `event_properties` of every tracked event.
With event property tracking, the SDK:
- Parses campaign parameters on page load and SPA navigations (History API changes like `pushState`, `replaceState`, `popstate`).
- Attaches campaign fields to the `event_properties` of every tracked event.
User property tracking also remains on by default. Both methods run independently: event property tracking doesn't replace the identify calls that set user properties.
To disable event property tracking and use only user property tracking, set `trackingMethod` to `'userProperty'`:
```ts
amplitude.init(AMPLITUDE_API_KEY, OPTIONAL_USER_ID, {
autocapture: {
attribution: {
trackingMethod: "userProperty",
},
},
});
```
To disable user property tracking and use only event property tracking, set `trackingMethod` to `'eventProperty'`:
```ts
amplitude.init(AMPLITUDE_API_KEY, OPTIONAL_USER_ID, {
autocapture: {
attribution: {
trackingMethod: "eventProperty",
},
},
});
```
{% callout type="note" heading="SDK versions below 2.45.0" %}
On Browser SDK versions before 2.45.0, event property tracking is opt-in. To enable it, set `trackingMethod` to `['userProperty', 'eventProperty']`. Event property tracking requires Browser SDK version 2.40.0 or later.
```ts
amplitude.init(AMPLITUDE_API_KEY, OPTIONAL_USER_ID, {
autocapture: {
attribution: {
trackingMethod: ["userProperty", "eventProperty"],
},
},
});
```
{% /callout %}
##### Fallback attribution event
When using event property tracking, enable `fallbackAttributionEvent` to ensure Amplitude captures campaign data even when users don't trigger other events. This sends an `[Amplitude] Attribution` event on each page view and SPA navigation.
```ts
amplitude.init(AMPLITUDE_API_KEY, OPTIONAL_USER_ID, {
autocapture: {
attribution: {
fallbackAttributionEvent: true,
},
},
});
```
##### Exclude internal referrers
Use `excludeInternalReferrers` when you want to avoid attributing traffic to internal navigation (same domain or subdomain). The SDK treats a referrer as internal when `document.referrer` and `location.hostname` resolve to the same domain.
- **Always exclude**: Set `excludeInternalReferrers: true` or `excludeInternalReferrers: { condition: 'always' }` to never track campaign information for internal referrers.
- **Exclude only when campaign is empty**: Set `excludeInternalReferrers: { condition: 'ifEmptyCampaign' }` to skip campaign tracking for internal referrers where there are no UTM parameters or click IDs. If the user arrives from an internal page with UTM or click IDs, Amplitude still tracks campaign data (if `excludeReferrers` doesn't exclude the referrer).
{% accordion title="Example: always exclude internal referrers" %}
```ts
amplitude.init(AMPLITUDE_API_KEY, OPTIONAL_USER_ID, {
autocapture: {
attribution: {
excludeInternalReferrers: true,
},
},
});
```
{% /accordion %}
{% accordion title="Example: exclude internal referrers only when campaign is empty" %}
```ts
amplitude.init(AMPLITUDE_API_KEY, OPTIONAL_USER_ID, {
autocapture: {
attribution: {
excludeInternalReferrers: { condition: "ifEmptyCampaign" },
},
},
});
```
{% /accordion %}
##### Exclude referrers
{% callout type="note" heading="" %}
All sub-configurations of `config.autocapture.attribution` take effect only on user properties and do **NOT** affect the event properties of the default page view events.
{% /callout %}
The default value of `config.autocapture.attribution.excludeReferrers` is the top level domain with cookie storage enabled. For example, if you initialize the SDK on `https://www.docs.developers.amplitude.com/`, the SDK first checks `amplitude.com`. If `amplitude.com` doesn't allow cookie storage, then the SDK checks `developers.amplitude.com` and subsequent subdomains. If the domain allows cookie storage, then the SDK sets `excludeReferrers` to a RegExp object `/amplitude\.com$/` which matches and excludes tracking referrers from all subdomains of `amplitude.com`, for example, `data.amplitude.com` and `analytics.amplitude.com`.
In addition to excluding referrers from the default configuration, you can add other domains by setting the custom `excludeReferrers`. Custom `excludeReferrers` overrides the default values. For example, to also exclude referrers from `google.com`, set `excludeReferrers` to `[/amplitude\.com$/, 'google.com']`.
{% accordion title="Example of including all referrers" %}
Track complete web attribution, including self-referrals, for comprehensive insight:
```ts
amplitude.init(AMPLITUDE_API_KEY, OPTIONAL_USER_ID, {
autocapture: {
attribution: {
// Override the default setting to exclude all subdomains
excludeReferrers: [],
},
},
});
```
{% /accordion %}
{% accordion title="Example of excluding all self-referrals and other subdomains" %}
For customers who want to exclude tracking campaign from any referrers across all subdomains of `your-domain.com`, as well as from a specific subdomain:
```ts
amplitude.init(AMPLITUDE_API_KEY, OPTIONAL_USER_ID, {
autocapture: {
attribution: {
excludeReferrers: [/your-domain\.com$/, "www.test.com"],
},
},
});
```
{% /accordion %}
{% accordion title="Exclude referrers that match a specific pattern" %}
For customers who want to exclude tracking campaign from all referrers across all subdomains of `test.com`:
```ts
amplitude.init(AMPLITUDE_API_KEY, OPTIONAL_USER_ID, {
autocapture: {
attribution: {
excludeReferrers: [/test\.com$/],
},
},
});
```
{% /accordion %}
### Track page views
Amplitude tracks page view events by default. The default behavior sends a page view event on initialization. The event type for this event is `[Amplitude] Page Viewed`.
Set `config.autocapture.pageViews` to `false` to disable page view tracking.
```ts
amplitude.init(AMPLITUDE_API_KEY, OPTIONAL_USER_ID, {
autocapture: {
pageViews: false,
},
});
```
#### Advanced configuration for tracking page views
Use the advanced configuration to control when the SDK sends page view events.
{% accordion title="Tracking page views options" %}
| Name | Description |
|------|-------------|
| `config.autocapture.pageViews.trackOn` | Optional. Type: `"attribution"` or `() => boolean`. Provides advanced control for when the SDK tracks page view events. Omit or set the value to `undefined`, and configure the SDK to track page view events to on initialization. Set the value to `"attribution"` and configure the SDK to track page view events to only when it tracks web attribution. Set the value to a function that returns a boolean (`true` or `false`) and configure the SDK to track page view events to based on your criteria. |
| `config.autocapture.pageViews.trackHistoryChanges` | Optional. Type: `"pathOnly"` or `"all"`. Provides advanced control for single page application for when the SDK tracks page views. Omit or set the value to `"all"`, and configure the SDK to track page view events on any navigation change to the URL within your single page application. For example: navigating from `https://amplitude.com/#company` to `https://amplitude.com/#blog`. Set the value to `pathOnly`, and configure the SDK to track page view events on navigation change to the URL path only within your single page application. For example: navigating from `https://amplitude.com/company` to `https://amplitude.com/blog`. |
| `config.autocapture.pageViews.eventType` | Optional. Type: `string`. Customize the event_type for page view event. |
{% /accordion %}
For example, you can configure Amplitude to track page views only when the URL path contains a certain substring.
```ts
amplitude.init(API_KEY, OPTIONAL_USER_ID, {
autocapture: {
pageViews: {
trackOn: () => {
return window.location.pathname.includes("home");
},
},
},
});
```
The Browser SDK tracks the following information in page view events.
| Name | Description | Default Value |
| -------------------------------------------- | -------------------------------------------------------------------------------------------------------------------------- | ----------------------------------------------------------------- |
| `event_type` | `string`. The event type for page view event. Configurable through `autocapture.pageViews.eventType` or enrichment plugin. | `[Amplitude] Page Viewed` from version 1.9.1. |
| `event_properties.[Amplitude] Page Domain` | `string`. The page domain. | `location.hostname`or `''`. |
| `event_properties.[Amplitude] Page Location` | `string`. The page location. | `location.href` or `''`. |
| `event_properties.[Amplitude] Page Path` | `string`. The page path. | `location.path` or `''`. |
| `event_properties.[Amplitude] Page Title` | `string`. The page title. | `document.title` or `''`. |
| `event_properties.[Amplitude] Page URL` | `string`. The value of page URL. | `location.href.split('?')[0]` or `''`. |
| `event_properties.${CampaignParam}` | `string`. The value of `UTMParameters` `ReferrerParameters` `ClickIdParameters` if has any. | Any undefined `campaignParam` or `undefined`. |
| `event_properties.[Amplitude] Page Counter` | `integer`. The count of pages viewed in the session. | `1` |
| `event_properties.referrer` | `string`. The full URL of the users previous page. | `https://amplitude.com/docs/sdks/analytics/browser/browser-sdk-2` |
| `event_properties.referring_domain` | `string`. The domain of the page referrer. `amplitude.com` |
Review [this example](https://github.com/amplitude/Amplitude-TypeScript/blob/main/examples/plugins/page-view-tracking-enrichment/index.ts) to understand how to enrich default page view events, such as adding more properties along with page view tracking.
{% callout type="warning" heading="" %}
If you want Autocapture to include page views for multi-step forms that dynamically update and, therefore, don't refresh the URL with each step, you must use hash elements for Single Page Applications (SPAs). Autocapture doesn't capture the individual dynamic components automatically. Tools such as Google Tag Manager (GTM) can help you [apply hashes to the URL](https://support.google.com/tagmanager/answer/7679410?hl=en) of the SPA between steps. Autocapture can then ingest the different steps as users proceed through the form.
{% /callout %}
#### Page title masking
Amplitude lets you to mask page titles in events that include the `[Amplitude] Page Title` property. This protects your sensitive page title information. Use the `data-amp-mask` attribute on your `<title>` element to exclude the actual page title from this property.
When the `<title>` element has the `data-amp-mask` attribute, Amplitude replaces the page title with a masked value across all events that capture page title information. For example:
```html
<head>
<!-- This page title will be masked in all events that capture page titles -->
<title data-amp-mask>John Doe - Personal Banking Dashboard
```
```html
Sensitive Customer Information
```
{% callout type="note" heading="Page title masking behavior" %}
- Any presence of `data-amp-mask` triggers masking, regardless of the attribute value.
- Amplitude masks only the page title text. The SDK tracks events as expected.
- This affects page view events, page URL enrichment events, and any other events that include `[Amplitude] Page Title`.
- This is separate from [element interaction masking](https://amplitude.com/docs/data/autocapture#precise-text-masking), which uses `data-amp-mask` on individual elements.
- The masked value appears as `*****` in your event data.
{% /callout %}
### Track sessions
Amplitude tracks session events by default. A session is the period of time a user has your website open. For more information, refer to [How Amplitude defines sessions](https://amplitude.com/docs/data/sources/instrument-track-sessions). When a new session starts, Amplitude tracks a session start event, which is the first event of the session. The event type for session start is `[Amplitude] Start Session`. When an existing session ends, Amplitude tracks a session end event, which is the last event of the session. The event type for session end is `[Amplitude] End Session`.
You can opt out of tracking session events by setting `config.autocapture.sessions` to `false`. Refer to the following code sample.
```ts
amplitude.init(AMPLITUDE_API_KEY, OPTIONAL_USER_ID, {
autocapture: {
sessions: false,
},
});
```
### Track form interactions
Amplitude tracks form interaction events by default. The SDK tracks `[Amplitude] Form Started` when the user initially interacts with the form element. An initial interaction can be the first change to a text input, radio button, or dropdown. The SDK tracks a `[Amplitude] Form Submitted` when the user submits the form. If a user submits a form with no initial change to any form fields, Amplitude tracks both `[Amplitude] Form Started` and `[Amplitude] Form Submitted` events.
Amplitude can track forms constructed with `
```
#### Disable form interaction tracking
Set `config.autocapture.formInteractions` to `false` to disable form interaction tracking.
```ts
amplitude.init(AMPLITUDE_API_KEY, OPTIONAL_USER_ID, {
autocapture: {
formInteractions: false,
},
});
```
#### Control form submit tracking
{% callout type="note" heading="Minimum SDK version" %}
Minimum SDK version 2.34.0.
{% /callout %}
You can control when Amplitude tracks `[Amplitude] Form Submitted` events by passing a `FormInteractionsOptions` object with a `shouldTrackSubmit` callback.
By default, Amplitude tracks all form submit events. However, when a form has the [`novalidate`](https://developer.mozilla.org/en-US/docs/Web/API/HTMLFormElement/noValidate) attribute set, the browser [submit event](https://developer.mozilla.org/en-US/docs/Web/API/HTMLFormElement/submit_event) fires without performing default validation checks. This means the submit event triggers even if the form is empty or contains invalid data. In these cases, use `shouldTrackSubmit` to implement custom validation logic and control when Amplitude tracks the submit event.
The `shouldTrackSubmit` callback receives the form submit event and returns `true` to track the submit event or `false` to skip tracking.
```ts
amplitude.init(AMPLITUDE_API_KEY, OPTIONAL_USER_ID, {
autocapture: {
formInteractions: {
shouldTrackSubmit: (event) => {
// Only track submit if form is valid
const form = event.target;
return form.checkValidity();
},
},
},
});
```
### Track file downloads
Amplitude tracks file download events by default. The SDK tracks `[Amplitude] File Downloaded` when the user clicks an anchor or `` tag linked to a file. Amplitude determines that the anchor or `` tag linked to a file if the file extension matches the following regex:
`pdf|xlsx?|docx?|txt|rtf|csv|exe|key|pp(s|t|tx)|7z|pkg|rar|gz|zip|avi|mov|mp4|mpe?g|wmv|midi?|mp3|wav|wma`
Set `config.autocapture.fileDownloads` to `false` to disable file download tracking.
```ts
amplitude.init(AMPLITUDE_API_KEY, OPTIONAL_USER_ID, {
autocapture: {
fileDownloads: false,
},
});
```
### Track element interactions
You can enable element interaction tracking to capture clicks and changes for elements on your page, which [Visual labeling](https://amplitude.com/docs/data/visual-labeling) requires and which powers [Zoning Insights](https://amplitude.com/docs/zoning-insights) for analyzing engagement within defined page areas. Refer to [Autocapture privacy and security](https://amplitude.com/docs/data/autocapture#privacy-and-security) for more information about the data collected with these events.
Set `config.autocapture.elementInteractions` to `true` to enable element click and change tracking.
```ts
amplitude.init(AMPLITUDE_API_KEY, OPTIONAL_USER_ID, {
autocapture: {
elementInteractions: true,
},
});
```
#### Advanced configuration for element interactions
Use the advanced configuration to control element interaction tracking.
{% accordion title="Tracking element interaction options" %}
| Name | Description |
| ------------------------------------------------------------- | -------------------------------------------------------------------------------------------------------------------------------------------------------------------------------------------------------------------------------------------------------------------------------------------------------------- |
| `config.autocapture.elementInteractions.cssSelectorAllowlist` | Optional. Type: `(string)[]`. Accepts one or more CSS selectors that define which elements on the page Amplitude always tracks. The default value is `['a','button','input','select','textarea','label','video','audio','[contenteditable="true" i]','[data-amp-default-track]','.amp-default-track']`. |
| `config.autocapture.elementInteractions.actionClickAllowlist` | Optional. Type: `(string)[]`. Accepts one or more CSS selectors that define which elements on the page Amplitude tracks when the page changes (for example, a new visual element appears) or the click takes a user to a new page. The default value is `['div', 'span', 'h1', 'h2', 'h3', 'h4', 'h5', 'h6']`. |
| `config.autocapture.elementInteractions.pageUrlAllowlist` | Optional. Type: `(string\|RegExp)[]`. Defines the URL, URLs, or URL pattern on which Amplitude tracks element click and change events. By default, Amplitude captures element interactions on any URL if undefined. |
| `config.autocapture.elementInteractions.dataAttributePrefix` | Optional. Type: `(string\|RegExp)[]`. Allows the SDK to capture data attributes as an event property. The default value is `data-amp-track`. |
{% /accordion %}
For example, you could configure Amplitude only to capture clicks on elements with a class of `amp-tracking` on the blog pages of a site as follows:
```ts
amplitude.init(API_KEY, OPTIONAL_USER_ID, {
autocapture: {
elementInteractions: {
cssSelectorAllowlist: [".amp-tracking"],
// When you use `cssSelectorAllowlist` to target specific elements, set `actionClickAllowlist`
// to ensure that Amplitude tracks interactions with non-standard clickable elements during page transitions or DOM updates.
actionClickAllowlist: [],
pageUrlAllowlist: [new RegExp("https://amplitude.com/blog/*")],
},
},
});
```
By default, if you don't use these settings, Amplitude tracks the default selectors on every page where you enable the plugin.
{% callout type="note" heading="" %}
When you specify the CSS selectors to track, your selection overrides the default. To retain the default selectors, import the `DEFAULT_CSS_SELECTOR_ALLOWLIST` and include it in your code.
```js
import { DEFAULT_CSS_SELECTOR_ALLOWLIST } from "@amplitude/plugin-autocapture-browser";
const selectors = [
...DEFAULT_CSS_SELECTOR_ALLOWLIST,
".class-of-a-thing-i-want-to-track",
];
```
{% /callout %}
{% accordion title="Element interaction events" %}
When you enable element interactions for Autocapture, Amplitude sends two events, from which you can create labeled events with [visual labeling](https://amplitude.com/docs/data/visual-labeling):
- `[Amplitude] Element Clicked`
- `[Amplitude] Element Changed`
These two events capture properties that describe the corresponding element and other context about the user's browser:
- `[Amplitude] Element ID`
- `[Amplitude] Element Class`
- `[Amplitude] Element Tag`
- `[Amplitude] Element Text` (Collected for `[Amplitude] Element Clicked`, only)
- `[Amplitude] Element Href` (Collected for `[Amplitude] Element Clicked`, only)
- `[Amplitude] Element Position Left`
- `[Amplitude] Element Position Top`
- `[Amplitude] Viewport Height`
- `[Amplitude] Viewport Width`
- `[Amplitude] Page URL`
- `[Amplitude] Page Title`
- `[Amplitude] Element Selector`
- `[Amplitude] Element Hierarchy`
- `[Amplitude] Element Attributes`
- `[Amplitude] Element Aria Label`
- `[Amplitude] Element Parent Label`
{% /accordion %}
### Track frustration interactions
Enable frustration interaction tracking to capture rage clicks, dead clicks, error clicks, and thrashed cursor. Amplitude defines these events as:
- **Rage click**: A user clicks the same element, within 50px, four times in under a second.
- **Dead click**: A user clicks an interactable element, but no navigation change happens and the DOM doesn't change.
- **Error click**: A user clicks an element and a browser error occurs within two seconds of the click.
- **Thrashed cursor**: A user's cursor moves rapidly back and forth within a short time window, indicating potential frustration.
Set `config.autocapture.frustrationInteractions` to `true` to enable capture of dead clicks and rage clicks.
Set `config.autocapture.frustrationInteractions.rageClicks` to `true` to enable capture of rage clicks.
Set `config.autocapture.frustrationInteractions.deadClicks` to `true` to enable capture of dead clicks.
Set `config.autocapture.frustrationInteractions.errorClicks` to `true` to enable capture of error clicks.
Set `config.autocapture.frustrationInteractions.thrashedCursor` to `true` to enable capture of thrashed cursors.
```ts
amplitude.init(AMPLITUDE_API_KEY, OPTIONAL_USER_ID, {
autocapture: {
frustrationInteractions: true,
},
});
```
#### Advanced configuration for frustration interactions
Use the advanced configuration to control frustration interaction tracking.
{% accordion title="Tracking frustration interaction options" %}
| Name | Description |
|------|-------------|
| `config.autocapture.frustrationInteractions.deadClicks.cssSelectorAllowlist` | Optional. Type: `(string)[]`. Accepts one or more CSS selectors that define the elements on which Amplitude captures dead clicks. The default value is [DEFAULT_DEAD_CLICK_ALLOWLIST](https://github.com/amplitude/Amplitude-TypeScript/blob/AMP-139424-frustration-interactions-ga/packages/analytics-core/src/types/frustration-interactions.ts#L94-L101). |
| `config.autocapture.frustrationInteractions.rageClicks.cssSelectorAllowlist` | Optional. Type: `(string)[]`. Accepts one or more CSS selectors that define the elements on which Amplitude captures rage clicks. By default, the SDK captures on any element. |
| `config.autocapture.frustrationInteractions.errorClicks.cssSelectorAllowlist` | Optional. Type: `(string)[]`. Accepts one or more CSS selectors that define the elements on which Amplitude captures error clicks. The default value is [DEFAULT_ERROR_CLICK_ALLOWLIST](https://github.com/amplitude/Amplitude-TypeScript/blob/main/packages/analytics-core/src/types/frustration-interactions.ts#L129). |
| `config.autocapture.frustrationInteractions.thrashedCursor.directionChanges` | Optional. Type: `number`. Number of direction changes required to consider a thrashed cursor. X-axis changes and Y-axis changes are counted separately. Default is 10 |
| `config.autocapture.frustrationInteractions.thrashedCursor.threshold` | Optional. Type: `number`. Time window (in milliseconds) that direction changes need to happen for it to be considered a thrashed cursor. Default is 2000 (2 seconds). |
{% /accordion %}
#### Track error clicks
{% callout type="note" heading="Minimum SDK version" %}
Error clicks and thrashed cursor require Browser SDK version 2.40.0 or later.
{% /callout %}
Error click tracking captures when a user clicks an element and a browser error occurs within two seconds of the click. This helps you identify which user interactions may be triggering errors in your application.
Enable error click tracking:
```ts
amplitude.init(AMPLITUDE_API_KEY, OPTIONAL_USER_ID, {
autocapture: {
frustrationInteractions: {
errorClicks: true,
},
},
});
```
When you enable error click tracking, it emits an event `[Amplitude] Error Click` that includes these properties:
- `[Amplitude] Kind`: The type of error (one of uncaught exception, console error, unhandled promise rejection).
- `[Amplitude] Message`: The error message.
- `[Amplitude] Stack`: The error stack trace.
- `[Amplitude] Filename`: The filename where the error occurred.
- `[Amplitude] Line Number`: The line number where the error occurred.
- `[Amplitude] Column Number`: The column number where the error occurred.
- Element properties from the clicked element (for example, `[Amplitude] Element Text`, `[Amplitude] Element Tag Name`).
#### Track thrashed cursor
Thrashed cursor tracking captures when a user's cursor moves rapidly back and forth with multiple direction changes within a short time window. This helps identify areas where users may be experiencing frustration or confusion.
Enable thrashed cursor tracking:
```ts
amplitude.init(AMPLITUDE_API_KEY, OPTIONAL_USER_ID, {
autocapture: {
frustrationInteractions: {
thrashedCursor: true,
},
},
});
```
It emits an event called `[Amplitude] Thrashed Cursor`.
### Track network requests
Track when network requests fail (only XHR and fetch). By default, tracks network requests with a response code in the range `500-599`, excluding requests made to any `amplitude.com` domain.
Set `config.autocapture.networkTracking` to `true` to enable network request tracking.
```ts
amplitude.init(AMPLITUDE_API_KEY, OPTIONAL_USER_ID, {
autocapture: {
networkTracking: true,
},
});
```
When you enable this setting, Amplitude tracks the `[Amplitude] Network Request` event whenever the application makes a network request.
{% accordion title="Event Properties Descriptions" %}
| Event property | Description |
| --- | --- |
| `[Amplitude] URL` | The URL of the network request with sensitive information masked. |
| `[Amplitude] URL Query` | The query parameters of the URL. |
| `[Amplitude] URL Fragment` | The fragment identifier of the URL. |
| `[Amplitude] Request Method` | The HTTP method used for the request (GET, POST, and so forth). |
| `[Amplitude] Status Code` | The HTTP status code of the response. |
| `[Amplitude] Error Code` | The local error code if the request failed with out a status code. |
| `[Amplitude] Error Message` | The local error message if the request failed with out a status code. |
| `[Amplitude] Start Time` | The timestamp when the request started, in milliseconds since Unix epoch. |
| `[Amplitude] Completion Time` | The timestamp when the request completed, in milliseconds since Unix epoch. |
| `[Amplitude] Duration` | The duration of the request in milliseconds. |
| `[Amplitude] Request Body Size` | The size of the request body in bytes. |
| `[Amplitude] Response Body Size` | The size of the response body in bytes. |
| `[Amplitude] Request Body` | The captured JSON request body (when you configure a `requestBody` capture rule). |
| `[Amplitude] Response Body` | The captured JSON response body (when you configure a `responseBody` capture rule). |
{% /accordion %}
#### Advanced configuration for network tracking
Set `config.autocapture.networkTracking` to a `NetworkTrackingOptions` object to configure which network requests get tracked.
```ts
amplitude.init(AMPLITUDE_API_KEY, OPTIONAL_USER_ID, {
autocapture: {
networkTracking: {
captureRules: [
{
statusCodeRange: "400-599",
},
],
ignoreHosts: ["*.example.com"],
ignoreAmplitudeRequests: true,
},
},
});
```
This example tracks network requests with status codes from 400-599, ignores requests to `*.example.com` domains, and excludes Amplitude's own requests. Review the configuration options below for more details.
{% accordion title="NetworkTrackingOptions" %}
| Name | Description | Value |
| ------------------------- | ---------------------------------------------------------------------------------------------------------------------------------------------------------------------------------- | ----------- |
| `captureRules` | The rules for capturing network requests. You should always append rules with specific hosts to the bottom of the list. | `undefined` |
| `ignoreHosts` | The hosts to ignore. Supports wildcard characters `*`. For example, `["*"]` to ignore all hosts, `["*.notmyapi.com", "notmyapi.com"]` to ignore `notmyapi.com` and all subdomains. | `[]` |
| `ignoreAmplitudeRequests` | Whether to ignore Amplitude requests. | `true` |
{% /accordion %}
{% accordion title="NetworkTrackingOptions.NetworkCaptureRule" %}
| Name | Description | Default Value |
| ----------------- | ----------------------------------------------------------------------------------------------------------------------------------------------------------------------------------------------------------------------------------------- | ------------- |
| `urls` | Defines the URL, URLs, or URL pattern to capture. By default captures all URLs. eg. `[/https:\/\/example.com\/api\/*/, 'https://example.com/api/status']` | `` |
| `hosts` | The hosts to capture. Supports wildcard characters `*`. eg. `["*"]` to match all hosts, `["*.example.com", "example.com"]` to match `example.com` and all subdomains. (this is deprecated. URLs is the preferred way to filter by hosts.) | `none` |
| `methods` | The HTTP methods to capture. e.g.: `["POST", "PUT", "DELETE"]` | `['*']` |
| `statusCodeRange` | The status code range to capture. Supports comma-separated ranges or single status codes. For example, `"0,200-299,413,500-599"` | `"500-599"` |
| `requestBody` | Captures fields in the request body (go to #BodyCaptureRule). | `undefined` |
| `responseBody` | Captures fields in the response body (go to #BodyCaptureRule). | `undefined` |
| `requestHeaders` | Captures request headers. If `true`, captures safe headers. If `false`, no headers captured. If an array of strings, captures the specified headers. | `false` |
| `responseHeaders` | Captures response headers. If `true`, captures safe headers. If `false`, no headers captured. If an array of strings, captures the specified headers. | `false` |
{% /accordion %}
{% accordion title="BodyCaptureRule" %}
| Name | Description | Default Value |
| ----------- | ----------------------------------------------------------------------------------------------------------------------------------------------------------------------------------------------------------------------------------------------------- | ------------- |
| `allowlist` | Array of JSON property names to capture from request/response bodies. Uses JSON Pointer syntax where leading `/` is optional. Supports wildcards: `*` matches any key, `**` matches any number of keys. Maintains the structure of the original JSON. | `[]` |
| `blocklist` | Array of JSON property names to exclude from captured request/response bodies. This removes properties that the allowlist would otherwise capture. | `[]` |
{% /accordion %}
#### Safe headers
When you set `requestHeaders: true` or `responseHeaders: true`, Amplitude captures only safe headers and excludes sensitive ones that may contain authentication credentials or personally identifiable information.
{% accordion title="Safe headers list" %}
- `access-control-allow-origin`
- `access-control-allow-credentials`
- `access-control-expose-headers`
- `access-control-max-age`
- `access-control-allow-methods`
- `access-control-allow-headers`
- `accept-patch`
- `accept-ranges`
- `age`
- `allow`
- `alt-svc`
- `cache-control`
- `connection`
- `content-disposition`
- `content-encoding`
- `content-language`
- `content-length`
- `content-location`
- `content-md5`
- `content-range`
- `content-type`
- `date`
- `delta-base`
- `etag`
- `expires`
- `im`
- `last-modified`
- `link`
- `location`
- `permanent`
- `p3p`
- `pragma`
- `proxy-authenticate`
- `public-key-pins`
- `retry-after`
- `server`
- `status`
- `strict-transport-security`
- `trailer`
- `transfer-encoding`
- `tk`
- `upgrade`
- `vary`
- `via`
- `warning`
- `www-authenticate`
- `x-b3-traceid`
- `x-frame-options`
{% /accordion %}
#### Network body capture
If a network request or response body is in JSON, you can capture part of the response body by configuring `responseBody.allowlist` and `responseBody.blocklist`. You can capture part of the request body by configuring `requestBody.allowlist` and `requestBody.blocklist`.
The allowlist and blocklist are lists of JSON Pointer-like strings that capture specific fields. (For example: `['foo/bar', 'hello/**']`). `allowlist` tells the client which fields to capture. `excludelist` tells the client to exclude fields from capture (by default, the SDK captures nothing).
Example request/response body
```json
{
"a": "A",
"b": {
"c": "C",
"d": {
"e": "E",
"f": "F"
}
},
"g": "G"
}
```
| allowlist | Captured Result |
| --------- | ---------------------------------------------------- |
| `a` | `{ "a": "A" }` |
| `a/b/*` | `{ "a": { "b": { "c": "C" } } }` |
| `b/c` | `{ "b": { "c": "C" } }` |
| `b/**` | `{ "b": { "c": "C", "d": { "e": "E", "f": "F" } } }` |
| `b/d/*` | `{ "b": { "d": { "e": "E", "f": "F" } } }` |
| `b/**` | `{ "b": { "c": "C", "d": { "e": "E", "f": "F" } }` |
| `*` | `{ "a": "A", "g": "G" }` |
### Track web vitals
Track Core Web Vitals performance metrics automatically. When you enable this, Amplitude captures web performance metrics and sends them as `[Amplitude] Web Vitals` events when the browser tab first becomes hidden (when users navigate away, close the tab, or switch tabs).
{% callout type="note" heading="" %}
Requires Browser SDK 2.27.0 or higher.
{% /callout %}
Set `config.autocapture.webVitals` to `true` to enable web vitals tracking:
```ts
amplitude.init(AMPLITUDE_API_KEY, OPTIONAL_USER_ID, {
autocapture: {
webVitals: true,
},
});
```
#### Metrics captured
The web vitals autocapture feature captures the following Core Web Vitals metrics.
- [INP](https://web.dev/articles/inp)
- [TTFB](https://web.dev/articles/ttfb)
- [LCP](https://web.dev/articles/lcp)
- [FCP](https://web.dev/articles/fcp)
- [CLS](https://web.dev/articles/cls)
#### Event properties
The `[Amplitude] Web Vitals` event includes the following properties:
| Property | Description |
| --------------------------- | ------------------------------------------------------------------------------------------------------------------- |
| `[Amplitude] Page Domain` | The hostname of the current page |
| `[Amplitude] Page Location` | The full URL of the current page |
| `[Amplitude] Page Path` | The pathname of the current page |
| `[Amplitude] Page Title` | The title of the current page |
| `[Amplitude] Page URL` | The URL of the current page without query parameters |
| `[Amplitude] LCP` | [Largest Contentful Paint](https://github.com/GoogleChrome/web-vitals?tab=readme-ov-file#lcpmetric) (if available) |
| `[Amplitude] FCP` | [First Contentful Paint](https://github.com/GoogleChrome/web-vitals?tab=readme-ov-file#fcpmetric) (if available) |
| `[Amplitude] INP` | [Interaction to Next Paint](https://github.com/GoogleChrome/web-vitals?tab=readme-ov-file#inpmetric) (if available) |
| `[Amplitude] CLS` | [Cumulative Layout Shift](https://github.com/GoogleChrome/web-vitals?tab=readme-ov-file#clsmetric) (if available) |
| `[Amplitude] TTFB` | [Time to First Byte](https://github.com/GoogleChrome/web-vitals?tab=readme-ov-file#ttfbmetric) (if available) |
## Track an event
Events represent how users interact with your application. For example, the Button Clicked event might be an action you want to track.
```ts
// Track a basic event.
amplitude.track("Button Clicked");
// Track events with optional properties.
const eventProperties = {
buttonColor: "primary",
};
amplitude.track("Button Clicked", eventProperties);
```
You can also pass a `BaseEvent` object to `track`. For more information, review the [BaseEvent](https://amplitude.github.io/Amplitude-TypeScript/interfaces/_amplitude_analytics_browser.Types.BaseEvent.html) interface for all available fields.
```ts
const event_properties = {
buttonColor: "primary",
};
const event = {
event_type: "Button Clicked",
event_properties,
groups: { role: "engineering" },
group_properties: { groupPropertyKey: "groupPropertyValue" },
};
amplitude.track(event);
```
## Track events to multiple projects
By default, Amplitude SDKs send data to one Amplitude project. To send data to more than one project, add an instance of the Amplitude SDK for each project you want to receive data. Then, pass instance variables to wherever you want to call Amplitude. Each instance allows for independent `apiKey`, `userId`, `deviceId`, and `settings` values.
```ts
const defaultInstance = amplitude.createInstance();
defaultInstance.init(API_KEY_DEFAULT);
const envInstance = amplitude.createInstance();
envInstance.init(API_KEY_ENV, {
instanceName: "env",
});
```
## User properties
User properties are details like device details, user preferences, or language that help you understand your users at the time they performed an action in your app.
Identify sets the user properties of a particular user without sending any event. The SDK supports the operations `set`, `setOnce`, `unset`, `add`, `append`, `prepend`, `preInsert`, `postInsert`, `remove`, and `clearAll` on individual user properties. Declare the operations through a provided Identify interface. You can chain together multiple operations in a single Identify object. Then pass the Identify object to the Amplitude client to send to the server.
{% callout type="note" heading="Identify calls" %}
If the SDK sends the Identify call after the event, the details of the call appear immediately in the user's profile in Amplitude. Results don't appear in chart results until the SDK sends another event after Identify. Identify calls affect events that happen after it. For more information, refer to [Overview of user properties and event properties](https://amplitude.com/docs/data/user-properties-and-events).
{% /callout %}
### Set a user property
The Identify object provides controls for setting user properties. To set a user property:
1. Instantiate an Identify object.
2. Call methods on that object.
3. Instruct the SDK to make a call with the Identify object.
```ts
const identifyEvent = new amplitude.Identify();
// Use methods in the following sections to update the Identify object
amplitude.identify(identifyEvent);
```
#### Identify.set
This method sets the value of a user property. For example, you can set a role property of a user.
```ts
const identifyEvent = new amplitude.Identify();
identifyEvent.set("location", "LA");
amplitude.identify(identifyEvent);
```
#### Identify.setOnce
This method sets the value of a user property only one time. Subsequent calls using `setOnce()` are ignored. For example, you can set an initial login method for a user. `setOnce()` ignores later calls.
```ts
const identifyEvent = new amplitude.Identify();
identifyEvent.setOnce("initial-location", "SF");
identify(identifyEvent);
```
#### Identify.add
This method increments a user property by a numerical value. If the user property doesn't have a value set yet, the SDK initializes it to `0` before incrementing. For example, you can track a user's travel count.
```ts
const identifyEvent = new amplitude.Identify();
identifyEvent.add("travel-count", 1);
amplitude.identify(identifyEvent);
```
#### Identify.unset
This method removes a user property from a user profile. Use `unset` when you no longer need a property or want to remove it completely.
```ts
const identifyEvent = new amplitude.Identify();
identifyEvent.unset("location");
amplitude.identify(identifyEvent);
```
### Arrays in user properties
Call the `prepend`, `append`, `preInsert`, or `postInsert` methods to use arrays as user properties.
#### Identify.prepend
This method prepends a value or values to a user property array. If the user property doesn't have a value set yet, the SDK initializes it to an empty list before prepending the new values.
```ts
const identifyEvent = new Identify();
identifyEvent.prepend("visited-locations", "LAX");
identify(identifyEvent);
```
#### Identify.append
This method appends a value or values to a user property array. If the user property doesn't have a value set yet, the SDK initializes it to an empty list before appending the new values.
```ts
const identifyEvent = new amplitude.Identify();
identifyEvent.append("visited-locations", "SFO");
amplitude.identify(identifyEvent);
```
#### Identify.postInsert
This method post-inserts a value or values to a user property if the value doesn't exist in the user property yet. Post-insert means inserting the values at the end of a given list. If the user property doesn't have a value set yet, the SDK initializes it to an empty list before post-inserting the new values. If the user property has an existing value, this method is a no-op.
```ts
const identifyEvent = new amplitude.Identify();
identifyEvent.postInsert("unique-locations", "SFO");
amplitude.identify(identifyEvent);
```
#### Identify.remove
This method removes a value or values to a user property if it exists in the user property. Remove means remove the existing values from the given list. If the user property has an existing value, this method is a no-op.
```ts
const identifyEvent = new amplitude.Identify();
identifyEvent.remove("unique-locations", "JFK");
amplitude.identify(identifyEvent);
```
#### Identify.clearAll
This method removes all user properties from the user. Use `clearAll` with care because it's irreversible.
```ts
const identifyEvent = new amplitude.Identify();
identifyEvent.clearAll();
amplitude.identify(identifyEvent);
```
## User groups
Amplitude supports assigning users to groups and performing queries, such as Count by Distinct, on those groups. If at least one member of the group has performed the specific event, then the count includes the group.
For example, you want to group your users based on what organization they're in by using an 'orgId'. Joe is in 'orgId' '10', and Sue is in 'orgId' '15'. Sue and Joe both perform a certain event. You can query their organizations in the Event Segmentation Chart.
When setting groups, define a `groupType` and `groupName`. In the previous example, 'orgId' is the `groupType` and '10' and '15' are the values for `groupName`. Another example of a `groupType` could be 'sport' with `groupName` values like 'tennis' and 'baseball'.
Setting a group also sets the `groupType:groupName` as a user property, and overwrites any existing `groupName` value set for that user's `groupType`, and the corresponding user property value. `groupType` is a string, and `groupName` can be either a string or an array of strings to indicate that a user is in multiple groups.
{% callout type="example" heading="" %}
If Joe is in 'orgId' '15', then the `groupName` is `15`.
```ts
// set group with a single group name
amplitude.setGroup("orgId", "15");
```
If Joe is in 'sport' 'soccer' and 'tennis', then the `groupName` is `["tennis", "soccer"]`.
```ts
// set group with multiple group names
amplitude.setGroup("sport", ["soccer", "tennis"]);
```
{% /callout %}
Pass an `Event` object with `groups` to a Track call to set an **event-level group**. With event-level groups, the group designation applies only to the specific logged event, and doesn't persist to the user unless you explicitly set it with `setGroup`.
```ts
amplitude.track({
event_type: "event type",
event_properties: { eventPropertyKey: "event property value" },
groups: { orgId: "15" },
});
```
## Group properties
Use the Group Identify API to set or update the properties of particular groups. These updates only affect events from this point onward.
The `groupIdentify()` method accepts a group type and group name string parameter, as well as an Identify object that the SDK applies to the group.
```ts
const groupType = "plan";
const groupName = "enterprise";
const groupIdentifyEvent = new amplitude.Identify();
groupIdentifyEvent.set("key1", "value1");
amplitude.groupIdentify(groupType, groupName, groupIdentifyEvent);
```
## Track revenue
The preferred method of tracking revenue for a user is to use `revenue()` in conjunction with the provided Revenue interface. Revenue instances store each revenue transaction and allow you to define several special revenue properties (like `revenueType` and `productId`) that Amplitude's Event Segmentation and Revenue LTV charts use. Pass these Revenue instance objects into `revenue()` to send as revenue events to Amplitude. This lets Amplitude automatically display data relevant to revenue in the platform. You can use this to track both in-app and non-in-app purchases.
{% callout type="tip" heading="" %}
Amplitude recommends to also enable [product array](https://amplitude.com/docs/analytics/charts/cart-analysis) tracking method to get the most information possible.
{% /callout %}
To track revenue from a user, call revenue each time a user generates revenue. In this example, the user purchased 3 units of a product at $3.99.
```ts
const event = new amplitude.Revenue()
.setProductId("com.company.productId")
.setPrice(3.99)
.setQuantity(3)
.setRevenueType("purchase");
amplitude.revenue(event);
```
This example shows tracking revenue with currency type:
```ts
const event = new amplitude.Revenue()
.setProductId("com.company.productId")
.setPrice(3.99)
.setQuantity(3)
.setRevenueType("purchase")
.setCurrency("JPY");
amplitude.revenue(event);
```
This example shows tracking revenue with additional properties:
```ts
const event = new amplitude.Revenue()
.setProductId("com.company.productId")
.setPrice(3.99)
.setQuantity(3)
.setRevenueType("purchase")
.setEventProperties({
category: "electronics",
brand: "Acme",
});
amplitude.revenue(event);
```
### Revenue interface
Revenue objects support the following properties. Use the corresponding setter methods to assign values.
| Name | Setter Method | Description | Default Value |
| ------------------ | ----------------------- | ------------------------------------------------------------------------------------------------------------------------ | ------------- |
| `productId` | `setProductId()` | Optional. `string`. An identifier for the product. Amplitude recommends something like the Google Play Store product ID. | Empty string. |
| `quantity` | `setQuantity()` | Required. `number`. The quantity of products purchased. `revenue = quantity * price`. | `1` |
| `price` | `setPrice()` | Required. `number`. The price of the products purchased, and this can be negative. `revenue = quantity * price`. | `null` |
| `revenueType` | `setRevenueType()` | Optional, but required for revenue verification. `string`. The revenue type (for example, tax, refund, income). | `null` |
| `currency` | `setCurrency()` | Optional. `string`. The currency type for the revenue (for example, `'USD'`, `'JPY'`, `'EUR'`). | `null` |
| `receipt` | `setReceipt()` | Optional. `string`. The receipt identifier of the revenue. | `null` |
| `receiptSignature` | `setReceiptSignature()` | Optional, but required for revenue verification. `string`. The receipt signature of the revenue. | `null` |
| `eventProperties` | `setEventProperties()` | Optional. `{ [key: string]: any }`. An object of event properties to include in the revenue event. | `null` |
## Flush the event buffer
The `flush` method triggers the client to send buffered events immediately.
```ts
amplitude.flush();
```
By default, the Browser SDK calls `flush` automatically at an interval. If you want to flush all events, control the async flow with the optional Promise interface, for example:
```ts
amplitude.init(API\_KEY).promise.then(function() {
amplitude.track('Button Clicked');
amplitude.flush();
});
```
## Custom user identifier
If your application has a login system that you want to track users with, call `setUserId` to update the user's identifier.
```ts
amplitude.setUserId("user@amplitude.com");
```
## Custom session identifier
Assign a new session ID with `setSessionId`. When you set a custom session ID, make sure the value is in milliseconds since epoch (Unix Timestamp).
```ts
amplitude.setSessionId(Date.now());
```
## Custom device identifier
Assign a new device ID with `deviceId`. When you set a custom device ID, make sure the value is sufficiently unique. Amplitude recommends using a UUID.
```ts
amplitude.setDeviceId(uuid());
```
## Reset when the user logs out
Use `reset` as a shortcut to anonymize users after they log out. `reset` does the following:
1. Sets `userId` to `undefined`.
2. Sets `deviceId` to a new UUID value.
With an undefined `userId` and a new `deviceId`, the user appears to Amplitude as a new user.
```ts
amplitude.reset();
```
## Opt users out of tracking
Set `setOptOut` to `true` to disable logging for a specific user.
```ts
amplitude.setOptOut(true);
```
Amplitude doesn't save or send events to the server while `setOptOut` is enabled. The setting persists across page loads.
Set `setOptOut` to `false` to re-enable logging.
```ts
amplitude.setOptOut(false);
```
## Optional tracking
By default, the SDK tracks these properties automatically. You can override this behavior by passing a configuration called `trackingOptions` when initializing the SDK, setting the appropriate options to false.
| Tracking Options | Default |
| ---------------- | ------- |
| `ipAddress` | `true` |
| `language` | `true` |
| `platform` | `true` |
```ts
amplitude.init(AMPLITUDE_API_KEY, {
trackingOptions: {
ipAddress: false,
language: false,
platform: false,
},
});
```
## Callback
All asynchronous APIs are optionally awaitable through a Promise interface. This also serves as a callback interface.
{% code-group %}
```ts Promise
amplitude.init("apikey", "12321.com").promise.then(function () {
// init callback
});
amplitude.track("Button Clicked").promise.then(function (result) {
result.event; // {...} (The final event object sent to Amplitude)
result.code; // 200 (The HTTP response status code of the request.
result.message; // "Event tracked successfully" (The response message)
});
```
```ts async/await
// Using async/await
const initResult = await amplitude.init("apikey", "12321.com").promise;
const results = await amplitude.track("Button Clicked").promise;
result.event; // {...} (The final event object sent to Amplitude)
result.code; // 200 (The HTTP response status code of the request.
result.message; // "Event tracked successfully" (The response message)
```
{% /code-group %}
## Plugins
Plugins allow you to extend Amplitude SDK's behavior by, for example, modifying event properties (enrichment plugin) or sending to third-party endpoints (destination plugin). A plugin is an `Object` with optional fields `name` and `type` and methods `setup()`, `execute()`, and `teardown()`.
### add
The `add` method adds a plugin to Amplitude.
```ts
amplitude.add(new Plugin());
```
### remove
The `remove` method removes the given plugin name from the client instance if it exists.
```ts
amplitude.remove(plugin.name);
```
### Create a custom plugin
| Field / Function | Description |
| ------------------- | ----------------------------------------------------------------------------------------------------------------------------------------------------------------------------------------------------------------------------------------------------------------------------------------------------------------------------------------------------------------------------------------------------------------------------------------------------------------------------------------------------------------------------------------------------------------------------------------------------------------------------------------------------------------------- |
| `plugin.name` | Optional. The name field is an optional property that allows you to reference the plugin for deletion purposes. If you don't provide one, Amplitude assigns a random name when you add the plugin. If you don't plan to delete your plugin, you can skip assigning a name. |
| `plugin.type` | Optional. The type field is an optional property that defines the type of plugin you are creating. Refer to the `plugin.execute()` function below to distinguish the two types. If not defined, the plugin defaults to an enrichment type. |
| `plugin.setup()` | Optional. The setup function is an optional method that the SDK calls when you add the plugin or on first init, whichever happens later. This function accepts two parameters: 1) Amplitude configuration; and 2) Amplitude instance. This is useful for setup operations and tasks that depend on either the Amplitude configuration or instance. Examples include assigning baseline values to variables, setting up event listeners, and many more. |
| `plugin.execute()` | Optional for type:enrichment. For enrichment plugins, execute function is an optional method that the SDK calls on each event. This function must return a new event, otherwise, the SDK drops the passed event from the queue. This is useful for cases where you need to add or remove properties from events, filter events, or perform any operation for each event tracked. **For destination plugins**, execute function is a required method that the SDK calls on each event. This function must return a response object with keys: `event` (BaseEvent), `code` (number), and `message` (string). This is useful for sending events for third-party endpoints. |
| `plugin.teardown()` | Optional. The teardown function is an optional method that the SDK calls when Amplitude re-initializes. This is useful for resetting unneeded persistent state that setup or execute methods create or set. Examples include removing event listeners or mutation observers. |
### Plugin examples
{% tabs tabs="Enrichment, Destination" %}
{% tab name="Enrichment" %}
Here's an example of an enrichment plugin that includes an extra event property `page_url` to all events.
```ts
const enrichPageUrlPlugin = (): EnrichmentPlugin => {
return {
execute: async (event: Event) => {
event.event_properties = {
...event.event_properties,
page_url: location.href,
};
return event;
},
};
};
amplitude.add(enrichPageUrlPlugin());
amplitude.init(API_KEY);
```
{% /tab %}
{% tab name="Destination" %}
Here's an example of a destination plugin that sends each tracked event to a custom server URL using Fetch API.
```ts
const customDestination = (customUrl: string): DestinationPlugin => {
return {
type: "destination",
execute: async (event: Event) => {
const payload = {
k: "apikey",
d: event,
};
const response = await fetch(customUrl, {
method: "POST",
headers: {
"Content-Type": "application/json",
Accept: "\*/\*",
},
body: JSON.stringify(payload),
});
return {
code: response.status,
event: event,
message: response.statusText,
};
},
};
};
amplitude.init(API_KEY);
amplitude.add(myDestinationPlugin("https://custom.url.com"));
```
{% /tab %}
{% /tabs %}
### Available plugins
Amplitude provides several official plugins to extend the Browser SDK functionality:
#### Page URL enrichment plugin
Autocapture enables the [page URL enrichment plugin](https://amplitude.com/docs/sdks/analytics/browser/page-url-enrichment-plugin) by default. The plugin automatically adds page URL-related properties to all events, including current page information, previous page location, and page type classification.
To disable page URL enrichment, set `autocapture.pageUrlEnrichment` to `false`:
```ts
amplitude.init(API_KEY, {
autocapture: {
pageUrlEnrichment: false,
},
});
```
For custom configuration or if you disabled autocapture entirely, you can still add the plugin manually:
```ts
import { pageUrlEnrichmentPlugin } from "@amplitude/plugin-page-url-enrichment-browser";
const pageUrlEnrichment = pageUrlEnrichmentPlugin();
amplitude.add(pageUrlEnrichment);
amplitude.init(API_KEY);
```
#### Custom enrichment plugin
The [Custom Enrichment plugin](https://amplitude.com/docs/sdks/analytics/browser/custom-enrichment-plugin) runs an enrichment function against every event the SDK tracks. Amplitude stores that function in your project's remote configuration. The plugin is off by default, and requires version 2.37.0 or later.
This plugin is separate from the custom plugins you add with `amplitude.add()`. Enabling it doesn't change how your own plugins behave.
To enable it, set `customEnrichment` to `true`:
```ts
amplitude.init(API_KEY, {
customEnrichment: true,
});
```
## Troubleshooting and debugging
Debugging in a browser can help you identify problems related to your code's implementation, as well as potential issues within the SDKs you're using. Here's a basic guide on how to use the browser's built-in Developer Tools (DevTools) for debugging.
### Console
You can find JavaScript errors in _Inspect > Console_, which might have the details about the line of code and file that caused the problem. The console also allows you to execute JavaScript code in real time.
- Enable debug mode by following these [instructions](#debugging). Then, with the default logger, the SDK outputs extra function context information to the developer console when you invoke any SDK public method, which can help with debugging.
- Amplitude supports SDK deferred initialization. The SDK dispatches events tracked before initialization after the initialization call. If you can't send events but can send the event successfully after entering `amplitude.init(API_KEY, 'USER_ID')` in the browser console, your `amplitude.init` call might not have triggered in your codebase or you aren't using the correct Amplitude instance during initialization. Therefore, check your implementation.
### Network request
Use the _Inspect > Network_ tab to view all network requests your page made. Search for the Amplitude request.
Check the response code and ensure that the response payload is as expected.
### Instrumentation Explorer Chrome extension
The Amplitude Instrumentation Explorer is an extension available in the Google Chrome Web Store. The extension captures each Amplitude event you trigger and displays it in the extension popup. Ensure that the SDK sent the event successfully and check the context in the event payload.
### Common issues
The following are common issues specific to Browser SDK. For more general common issues, refer to [SDK Troubleshooting and Debugging](https://amplitude.com/docs/sdks/sdk-debugging).
#### Ad blocker
`Ad Blocker` might lead to event dropping. The following errors indicate that an `Ad Blocker` affected tracking. When loading through a script tag, an error may appear in the console or network tab while loading the SDK script. When loaded with npm package, there could be errors in the network tab when trying to send events to the server. The errors might vary depending on the browser.
- Chrome (Ubuntu, MacOS)
Console: error net::ERR_BLOCKED_BY_CLIENT
Network: status (blocked:other)
- Firefox (Ubuntu)
Console: error text doesn’t contain any blocking-specific info
Network: Transferred column contains the name of plugin Blocked by uBlock Origin
- Safari (MacOS)
Console: error contains text Content Blocker prevented frame ... from loading a resource from ...
Network: it looks like blocked requests aren't listed. Not sure if it’s possible to show them.
Amplitude recommends using a proxy server to avoid this situation.
#### Cookies related
Here is the [information](#cookie-management) the SDK stores in the cookies. This means that client behavior, like disabling cookies or using a private browser, window, or tab, affects the persistence of these saved values in the cookies. If these values aren't persistent or aren't increasing by one, that could be the reason.
#### CORS
Cross-Origin Resource Sharing (CORS) is a security measure browsers implement to restrict how a web page can request resources from a different domain. It might cause this issue if you used `setServerURL`.
`Access to fetch at 'xxx' from origin 'xxx' has been blocked by CORS policy: Response to preflight request doesn't pass access control check: No 'Access-Control-Allow-Origin' header is present on the requested resource. If an opaque response serves your needs, set the request's mode to 'no-cors' to fetch the resource with CORS disabled.`
Cross-origin resource sharing (CORS) prevents a malicious site from reading another site's data without permission. The error message suggests that the server you're trying to access isn't allowing your origin to access the requested resource. This is due to the lack of the `Access-Control-Allow-Origin` header in the server's response.
- If you have control over the server, you can update the server's CORS policy. Add the `Access-Control-Allow-Origin` header to the server's responses. This allows your origin to make requests. The value of `Access-Control-Allow-Origin` can be `*` to allow all origins, or it can be the specific URL of your web page.
- If you don't have control over the server, you can set up a proxy server that adds the necessary CORS headers. The web page makes requests to the proxy, which then makes requests to the actual server. The proxy adds the `Access-Control-Allow-Origin` header to the response before sending it back to the web page.
If you have set up an API proxy and run into configuration issues related to that on a platform you've selected, that's no longer an SDK issue but an integration issue between your application and the service provider.
#### Events fired but no network requests
If you [set the logger to "Debug" level](#debugging) and see track calls in the developer console, your code has called the `track()` method. If you don't see the corresponding event in Amplitude, the Amplitude Instrumentation Explorer Chrome extension, or the network request tab of the browser, the SDK didn't send the event to Amplitude. The SDK fires events and places them in its internal queue upon a successful `track()` call, but sometimes these queued events may not send successfully. This can happen when the browser cancels an in-progress HTTP request. For example, if you close the browser or leave the page.
This most often happens when an event fires just before a redirect or navigation, such as a login event that immediately loads a new page. There are a few ways to address this issue:
1. By default, the `fetch` transport sends events with `keepalive`, which lets requests finish even after the page unloads. This handles most navigation cases automatically for request bodies up to 16 KB. Confirm that keepalive isn't disabled and that the event batch is within the size limit. For more information, refer to the [Survive page navigation with keepalive](#survive-page-navigation-with-keepalive) section.
2. For payloads larger than the keepalive limit, set the transport to `beacon` during initialization or upon page exit. `sendBeacon` sends events in the background but doesn't return server responses like `4xx` or `5xx`, so it doesn't retry on failure. For more information, refer to the [sendBeacon](#use-sendbeacon) section.
3. To make `track()` synchronous, [add the `await` keyword](#callback) before the call.
## Advanced topics
### Cross-domain tracking
You can track anonymous behavior across two different domains. Amplitude identifies anonymous users by their device IDs which must be passed between the domains. To maintain the same session and ensure a continuous user journey, also pass session IDs to the other domain.
{% callout type="note" heading="" %}
Starting from `v2.8.0`, the SDK supports getting the device ID from the URL parameter `ampDeviceId`. The SDK configuration, for example, `init('API_KEY', { deviceId: 'custom-device-id' })`, still takes precedence over the URL parameter. Previous versions of the SDK supported the `deviceId` URL parameter. The SDK still supports this option for backward compatibility, but `ampDeviceId` takes precedence if you set both. You don't need to change your code if you upgrade to versions higher than `v2.8.0`, but Amplitude recommends it.
{% /callout %}
For example:
- Site 1: `www.example.com`
- Site 2: `www.example.org`
Users who start on Site 1 and then navigate to Site 2 must have the device ID generated from Site 1 passed as a parameter to Site 2. Site 2 then needs to initialize the SDK with the device ID.
The SDK can parse the URL parameter automatically if `deviceId` is in the URL query parameters.
Starting from `v2.8.0`, the SDK can automatically get session ID from the URL to keep the same session and ensure a continuous user journey.
1. From Site 1, grab the device ID from `getDeviceId()` and the session ID from `getSessionId()`.
2. Pass the device ID and session ID to Site 2 through a URL parameter when the user navigates. (for example: `www.example.com?ampDeviceId=device_id_from_site_1&SessionId=1716245958483`)
3. Initialize the Amplitude SDK on Site 2 with `init('API_KEY', null)`.
If you don't set the `deviceId` and `sessionId` in `init('API_KEY', null, { deviceId: 'custom-device-id', sessionId: 1716245958483 })`, the SDK automatically falls back to using the URL parameters respectively.
#### Evaluation window with ampTimestamp
{% callout type="note" heading="" %}
This feature requires @amplitude/analytics-browser@2.21.1 and above.
{% /callout %}
To improve security and prevent the use of stale session or device IDs, you can include an `ampTimestamp` parameter that acts as an evaluation window. The SDK only uses `ampSessionId` and `ampDeviceId` URL parameters if the `ampTimestamp` value is in the future (greater than the current time).
For example:
```
www.example.com?ampDeviceId=device_id&SessionId=session_id&Timestamp=1640995500000
```
When `ampTimestamp` expires (is less than the current time), the SDK ignores the `ampSessionId` and `ampDeviceId` parameters. The SDK falls back to generating new values or using stored values from cookies. If you don't provide `ampTimestamp`, the SDK behaves as before for backward compatibility.
This feature ensures that cross-domain tracking parameters remain valid only for a limited time window. This prevents potential security issues from long-lived URLs with embedded tracking parameters.
Amplitude recommends that you follow the same session ID format as the Browser SDK using `Date.now()` because the SDK checks if an event is in session every time it tracks an event. For example:
```typescript
// if session ID is set to 12345
// https://www.example.com?ampDeviceId=my-device-id&SessionId=12345
amplitude.init(API_KEY);
// session ID is set to 12345 after init()
amplitude.track("event");
// session ID is set back to Date.now()
// because the tracked "event" is not in the previous session 12345
```
### Custom HTTP request headers
Use the `transport` configuration option to attach custom HTTP headers to event upload requests. Instead of passing a transport name string, pass an object with `transport` and `headers` properties. This is useful for scenarios like routing requests through a proxy server that requires specific headers.
{% callout type="note" heading="" %}
Custom headers only work with `fetch` and `xhr` transports. When using the `beacon` transport, the browser doesn't support custom headers due to limitations of the [sendBeacon API](https://developer.mozilla.org/en-US/docs/Web/API/Navigator/sendBeacon).
{% /callout %}
```ts
amplitude.init(API_KEY, {
transport: {
type: "fetch",
headers: {
"X-Custom-Header": "custom-value",
Authorization: "Bearer your-token",
},
},
});
```
You can also use the `xhr` transport with custom headers:
```ts
amplitude.init(API_KEY, {
transport: {
type: "xhr",
headers: {
"X-Custom-Header": "custom-value",
},
},
});
```
### Request body compression
The Browser SDK supports gzip compression for event upload request bodies to reduce bandwidth usage and improve upload performance. Compression is especially beneficial when sending large batches of events.
#### How compression works
The SDK automatically compresses request bodies when:
- The payload size is 2KB or larger.
- The browser supports the `CompressionStream` API (available in modern browsers).
- The transport type is `fetch` or `xhr` (the SDK doesn't support compression with the `beacon` transport).
When using Amplitude's default ingestion endpoints (`https://api2.amplitude.com`), the SDK automatically enables compression. When using a custom `serverUrl` (for example, a proxy server), you must explicitly enable compression by setting `enableRequestBodyCompression` to `true`.
{% callout type="note" heading="" %}
The `beacon` transport doesn't support compression because the [sendBeacon API](https://developer.mozilla.org/en-US/docs/Web/API/Navigator/sendBeacon) doesn't allow setting custom headers, which are required for gzip compression.
{% /callout %}
#### Enable compression for custom servers
If you route events through a custom proxy server, enable compression by setting `enableRequestBodyCompression` to `true`:
```ts
amplitude.init(API_KEY, {
serverUrl: "https://your-proxy.example.com/events",
enableRequestBodyCompression: true,
});
```
Your proxy server must support gzip-compressed request bodies and handle the `Content-Encoding: gzip` header.
#### Browser compatibility
Request body compression requires the `CompressionStream` API, which is available in:
- Chrome 80+
- Edge 80+
- Safari 16.4+
- Firefox 113+
For browsers that don't support `CompressionStream`, the SDK automatically sends uncompressed payloads.
### Survive page navigation with keepalive
By default, the Browser SDK sends events on the `fetch` transport with the [`keepalive`](https://developer.mozilla.org/en-US/docs/Web/API/RequestInit#keepalive) flag enabled. Browsers allow keepalive requests to finish even after the page that started them unloads. As a result, events that fire just before a redirect or navigation reach Amplitude instead of being canceled. A common example is a login event that immediately sends the user to another page.
Keepalive applies only to the `fetch` transport. Unlike the `beacon` transport, it preserves gzip compression, custom headers, server responses, and retries.
#### Keepalive size limit
The [Fetch specification](https://fetch.spec.whatwg.org/#http-network-or-cache-fetch) enforces a shared 64 KiB budget across all in-flight keepalive requests in a document. This budget includes Amplitude analytics, Session Replay, and any keepalive requests your own code makes. To stay within the budget, the SDK applies keepalive only when the request body is 16 KB or smaller. Larger payloads send as a standard `fetch` request with no size limit, but those requests don't survive navigation, which matches the behavior in earlier versions. Typical event batches are well under the limit, so nearly all traffic benefits.
If the browser rejects a keepalive request because the shared budget is exhausted mid-session, the SDK retries it on the next flush. The result is a delay, not data loss.
#### Disable keepalive
Keepalive is on by default. To turn it off, set `enableKeepalive` to `false` in the transport configuration. This option applies only to the `fetch` transport.
```ts
amplitude.init(API_KEY, {
transport: {
type: "fetch",
enableKeepalive: false,
},
});
```
On browsers that don't support keepalive, the SDK ignores the option and sends requests normally.
### Use sendBeacon
{% callout type="note" heading="" %}
The default `fetch` transport already sends events with [`keepalive`](#survive-page-navigation-with-keepalive), which survives page navigation while keeping gzip compression, custom headers, server responses, and retries. The `beacon` transport doesn't support those features, so reach for it only when keepalive doesn't fit your case, such as payloads larger than the keepalive limit.
{% /callout %}
Unlike standard network requests, `sendBeacon` sends events in the background, even if the user closes the browser or leaves the page.
{% callout type="warning" heading="" %}
`sendBeacon` sends events in the background. As a result, events that `sendBeacon` dispatches don't return server responses. Note the following if you use `sendBeacon`:
1. The SDK doesn't retry requests, including failed requests with 4xx or 5xx responses, so events may be lost.
2. The SDK can't guarantee event order, because `sendBeacon` may send events in parallel. This can leave some UTM properties unset, for example for session start events. In contrast, while using `fetch`, the SDK waits for responses before proceeding, guaranteeing event order.
{% /callout %}
#### Set the transport to use sendBeacon for all events
To send an event using `sendBeacon`, set the transport SDK option to `beacon` in one of two ways:
```ts
amplitude.init(API_KEY, "user@amplitude.com", {
transport: TransportType.SendBeacon,
// To make sure the SDK schedules the event right away.
flushIntervalMillis: 0,
flushQueueSize: 1,
});
```
#### Set the transport to use beacon only when exiting page
Amplitude recommends adding your own event listener for pagehide event.
```ts
window.addEventListener("pagehide", () => {
amplitude.setTransport("beacon");
// Sets https transport to use `sendBeacon` API
amplitude.flush();
});
```
### Content Security Policy (CSP)
If your web app configures the strict Content Security Policy (CSP) for security concerns, adjust the policy to allow the Amplitude domains:
- When using ["Script Loader"](https://github.com/amplitude/Amplitude-TypeScript/tree/main/packages/analytics-browser#installing-via-script-loader), add `https://*.amplitude.com` to `script-src`.
- Add `https://*.amplitude.com` to `connect-src`.
### Cookie management
The Browser SDK uses cookie storage to persist information that multiple subdomains of the same domain may likely want to share. This includes information like user sessions and marketing campaigns, which the SDK stores in separate cookie entries.
#### Cookie prefix
- **AMP**: The SDK creates user session cookies with `AMP` prefix and the first ten digits of the API key: `AMP_{first_ten_digits_API_KEY}`.
- **AMP_MKTG**: The SDK creates marketing campaign cookies with `AMP_MKTG` and the first ten digits of the API key: `AMP_MKTG_{first_ten_digits_API_KEY}`.
- **AMP_TEST**: On initialization, the SDK creates a cookie with `AMP_TEST` prefix to check whether cookie storage is working properly. Then the SDK sets the value as the current time, retrieves the cookie by a key, and checks if the retrieved value matches the original set time. You **can safely delete** the `AMP_TEST` prefix cookies if, for some reason, the SDK didn't successfully delete them.
- **AMP_TLDTEST**: On initialization, the SDK creates a cookie with `AMP_TLDTEST` prefix to find a subdomain that supports cookie storage. For example, when checking for cookie support on `https://analytics.amplitude.com/amplitude/home`, the SDK first tries to find a subdomain that matches the root domain (`amplitude.com`) and then falls back to the full domain (`analytics.amplitude.com`). You **can safely delete** the `AMP_TLDTEST` prefix cookies if, for some reason, the SDK didn't successfully delete them.
#### Cookie domain
By default, the SDK assigns these cookies to the top-level domain that supports cookie storage. The SDK can share cookies on multiple subdomains, which allows for a consistent user experience across all subdomains.
For example, if a user logs into the website on one subdomain (`data.amplitude.com`) where you initialize the SDK. On initialization, the SDK assigns cookies to `.amplitude.com`. If the user then navigates to another subdomain (`analytics.amplitude.com`), shared cookies share the login information across subdomains.
#### Cookie data
The SDK creates two types of cookies: user session cookies and marketing campaign cookies.
{% accordion title="User session cookies" %}
| Name | Description |
| ---------------------------------- | --------------------------------------------------------------------------------------------------------------------------------------------------------------------------------------------------------------------------- |
| `optOut` | Required. A flag to opt this device out of Amplitude tracking. If you set this flag, the SDK doesn't store additional information for the user. |
| `userId` | Upon user log-in, if you send this value, the SDK stores it in the cookie. Set this to uniquely identify their users (non-anonymous navigation). The SDK stores it encoded using Base64. |
| `deviceId` | A randomly generated string. It persists unless a user clears their browser cookies or browses in private mode. Even if a user consistently uses the same device and browser, the device ID can still vary. |
| `sessionId` | A randomly generated string for each session. |
| `lastEventTime` | Time of the last event, used to determine when to expire and create a new session ID. |
| `lastEventId` | ID of the last event. |
{% /accordion %}
{% accordion title="Marketing campaign cookies" %}
| Name | Description |
| ---------------------------------- | -------------------------------------------------------------------------------------------------------------------------------- |
| `utm_campaign` | This identifies a specific campaign used (for example, "summer_sale") |
| `utm_content` | This identifies what brought the user to the site and is commonly used for A/B testing (for example, "banner-link", "text-link") |
| `utm_id` | An optional parameter for tracking unique IDs or transaction IDs associated with the link. |
| `utm_medium` | This identifies a specific campaign used (for example, "summer_sale") |
| `utm_source` | This identifies which website sent the traffic (for example, Google, Facebook) |
| `utm_term` | This identifies paid search terms used (for example, product+analytics) |
| `referrer` | The last page the user was on (for example, `https://amplitude.com/behavioral-analytics-platform?ref=nav`) |
| `referring_domain` | The domain that the user was last on (for example, `https://amplitude.com`) |
| `dclid` | Google campaign manager Click Identifier |
| `gbraid` | Google Click Identifier for iOS device from Web to App |
| `gclid` | Google Click Identifier from URL parameters |
| `fbclid` | Facebook Click Identifier from URL parameters |
| `ko_click_id` | Kochava Click Identifier from URL parameters |
| `msclkid` | Microsoft Click Identifier |
| `ttclid` | TikTok Click Identifier |
| `twclid` | Twitter Click Identifier from URL parameter |
| `wbraid` | Google Click Identifier for iOS device from App to Web |
| `li_fat_id` | LinkedIn member indirect identifier for Members for conversion tracking, retargeting, analytics |
| `rdt_cid` | Reddit Click Identifier |
{% /accordion %}
#### Disable cookies
Opt-out of using cookies by setting `identityStorage` to `localStorage` so that the SDK uses `LocalStorage` instead. `LocalStorage` is a useful alternative, but because access to `LocalStorage` is restricted by subdomain, you can't track anonymous users across subdomains of your product (for example: `www.amplitude.com` versus `analytics.amplitude.com`).
```ts
amplitude.init("api-key", null, {
identityStorage: "localStorage",
});
```
### Offline mode
{% callout type="note" heading="Autoflush when reconnecting" %}
Setting `config.flushIntervalMillis` to a small value like `1` may cause an `ERR_NETWORK_CHANGED` error.
{% /callout %}
Beginning with version 2.4.0, the Amplitude Browser SDK supports offline mode. The SDK checks network connectivity every time it tracks an event. If the device is connected to network, the SDK schedules a flush. If not, it saves the event to storage. The SDK also listens for changes in network connectivity and schedules a flush of all stored events when the device reconnects, based on the `config.flushIntervalMillis` setting.
To disable offline mode, add `offline: amplitude.Types.OfflineDisabled` to the `amplitude.init()` call, as in the following example.
```ts
amplitude.init(AMPLITUDE_API_KEY, {
offline: amplitude.Types.OfflineDisabled,
});
```
### Marketing attribution tracking
Amplitude tracks marketing attribution and excludes all referrers from subdomains by default. Learn more about [exclude referrers](#exclude-referrers) and [exclude internal referrers](#exclude-internal-referrers). After you enable marketing attribution tracking, Amplitude generates `identify` events to assign the campaign values as user properties in specific scenarios. Refer to the following section to learn when Amplitude tracks marketing attribution and updates user properties.
#### Tracking scenarios
Amplitude tracks changes in marketing attribution in two scenarios: during SDK initialization and event processing.
##### Amplitude SDK initialization (Hard page refresh)
- At the start of a session, the referrer isn't excluded and campaign has any change or customer first visit.
- In the middle of the session, the referrer isn't excluded, not direct traffic, and campaign has any change.

To debug, you can get the referrer by typing `document.referrer` in your Browser console and compare it with your `config.autocapture.attribution.excludeReferrers`. If `document.referrer` is empty, Amplitude considers it direct traffic. You can get the session ID under `AMP_{last 10 digits of your API key}` on the _Cookies_ tab of the [Amplitude Chrome extension](https://amplitude.com/docs/data/chrome-extension-debug) and get the previous campaign stored under `AMP_MKTG_{last 10 digits of your API key}`.
##### Processing the event
- At the start of a session, the referrer isn't excluded, and campaign has any change.
For more information, refer to the scenarios outlined below that demonstrate when Amplitude does or doesn't track marketing attribution. These examples are illustrative, not exhaustive.
Tracking occurs when either of the following applies:
| Rule | Example |
| -------------------------------------------------------------------- | -------------------------------------------------------------------------------------------------------------------------------------------------------------- |
| The current subdomain isn't an excluded referrer. | The referrer doesn't originate from the same domain, or the current subdomain doesn't match any referrer in `config.autocapture.attribution.excludeReferrers`. |
| No previous campaign. | A user's initial visit. |
| There is an introduction of new UTM parameter or Click ID parameter. | If any utm parameters or Click ID parameters drop during a session, Amplitude unsets them. |
| The referrer domain changes to a new one. | Referrer domain changed from `a.test.com` to `b.test-new.com`. |
Amplitude doesn't track marketing attribution under any of the following conditions:
| Rule | Example |
| ------------------------------------------------------------------------------------------------------------------ | ---------------------------------------------------------------------------------------------------------------------------------------------------------- |
| The referrer originates from the same domain with default configuration. | The landing page is `a.test.com`, with the referrer set to `b.test.com`. |
| You explicitly exclude a specific referrer domain. | When setting `config.autocapture.attribution.excludeReferrers` = `[a.test.com]`, and the referrer domain is `a.test.com` for the current page. |
| The subdomain is specified or matches the regular expression in `config.autocapture.attribution.excludeReferrers`. | Configuration of excludeReferrers involves specific string arrays or a regular expression. |
| The user engages in direct traffic within the same session. | During a session, a user clicks on a link without any campaign attribution parameters, including the absence of UTM and click id parameters from an email. |
| SPA redirect without page reloading. | During a session, a user clicks on a link without any campaign attribution parameters, including the absence of UTM and click id parameters from an email. |
#### Rogue referral problem for SPAs
SPAs typically don't experience a true page load after a visitor enters the site, which means the referrer information doesn't update when clicking internal links. UTM parameters may drop during SPA redirects, while the referrer remains unchanged. This is a known issue in the industry. To address this problem, you can either:
- Control the page and location parameters, or
- Unset the referrer after the first hit.
### Remote configuration
Beginning with version 2.10.0, the Amplitude Browser SDK supports remote configuration.
{% callout type="note" heading="Default behavior changed in version 2.16.1" %}
Starting in SDK version 2.16.1, `fetchRemoteConfig` **defaults to `true`**. For versions 2.10.0 to 2.16.0, remote configuration defaults to disabled and requires explicit enablement.
{% /callout %}
Autocapture supports remote configuration options for tracking default events. When you enable remote configuration, settings from Amplitude's servers merge with your local SDK configuration, with remote settings taking precedence. Find the remote configuration options in _Data > Settings > Autocapture_.
#### Enable or disable remote configuration
**For SDK versions 2.16.1 and later:** Remote configuration defaults to enabled. To disable it, explicitly set `fetchRemoteConfig: false`:
```ts
amplitude.init(AMPLITUDE_API_KEY, {
fetchRemoteConfig: false, // Disable remote config
});
```
**For SDK versions 2.10.0 to 2.16.0:** Remote configuration defaults to disabled. To enable it, set `fetchRemoteConfig: true`:
```ts
amplitude.init(AMPLITUDE_API_KEY, {
fetchRemoteConfig: true, // Enable remote config (only needed for versions < 2.16.1)
});
```
{% callout type="note" heading="Configuration merging behavior" %}
When you enable `fetchRemoteConfig`, the SDK merges remote configuration with local configuration at the feature level. Remote configuration can override specific autocapture features even when you set `autocapture: false` locally.
How the merging works:
- If remote configuration specifies a value for an autocapture feature, that value takes precedence.
- If remote configuration doesn't specify a value for a feature, the SDK uses the local configuration value.
- Each autocapture feature such as `sessions`, `pageViews`, and `elementInteractions` merges independently.
{% accordion title="Remote config enables specific features when local config disables all" %}
```ts
// Local configuration disables all autocapture
amplitude.init(AMPLITUDE_API_KEY, {
autocapture: false,
});
// Remote config (set in Data > Settings > Autocapture) enables only:
// - Page Views: enabled
// - Element Interactions: enabled
// Result: Only Page Views and Element Interactions are tracked
// All other features (sessions, formInteractions, fileDownloads, etc.) remain disabled
```
{% /accordion %}
{% accordion title="Remote config overrides specific local settings" %}
```ts
// Local configuration enables most features
amplitude.init(AMPLITUDE_API_KEY, {
autocapture: {
pageViews: true,
sessions: true,
elementInteractions: true,
formInteractions: true,
},
});
// Remote config (set in Data > Settings > Autocapture):
// - Element Interactions: disabled
// - Frustration Interactions: enabled
// Result:
// - pageViews: true (from local config)
// - sessions: true (from local config)
// - elementInteractions: false (overridden by remote config)
// - formInteractions: true (from local config)
// - frustrationInteractions: true (set by remote config)
```
{% /accordion %}
{% accordion title="Remote config when you don't specify local config" %}
```ts
// Local configuration doesn't specify autocapture settings
amplitude.init(AMPLITUDE_API_KEY);
// Remote config (set in Data > Settings > Autocapture):
// - Page Views: enabled
// - Sessions: enabled
// Result: Only Page Views and Sessions are tracked
// All other features use their default values
```
{% /accordion %}
Set baseline settings locally and adjust specific features remotely through the Amplitude UI without code changes.
{% /callout %}
In Amplitude, navigate to _Data > Settings > Autocapture_ to add or update a remote configuration.
#### Proxy remote config requests
To proxy remote configuration requests through your own server (for example, to bypass ad blockers), configure the `remoteConfig` option:
```ts
amplitude.init(AMPLITUDE_API_KEY, {
remoteConfig: {
serverUrl: "https://your-proxy.example.com/config",
},
});
```
When you set `remoteConfig.serverUrl`, the SDK sends remote configuration requests to your custom URL instead of Amplitude's endpoints. Analytics events still use `serverUrl` or the default Amplitude endpoints.
{% callout type="note" heading="" %}
The top-level `fetchRemoteConfig` option is deprecated. Use `remoteConfig.fetchRemoteConfig` instead for new implementations.
{% /callout %}
================================================================================
# Ampli for Browser SDK 2.0
URL: https://amplitude.com/docs/sdks/analytics/browser/ampli-for-browser-sdk-2-0
================================================================================
# Ampli for Browser SDK 2.0
The [Ampli Wrapper](https://amplitude.com/docs/sdks/ampli) is a generated, strongly typed API for tracking Analytics events based on your Tracking Plan in Amplitude Data. The tracking library exposes a function for every event in your team's tracking plan. The function's arguments correspond to the event's properties.
Ampli provides autocompletion for events and properties defined in Data and enforces your event schemas in code to prevent bad instrumentation.
Amplitude Data supports tracking analytics events from browser apps written in JavaScript (ES6 and higher) and TypeScript (2.1 and higher). Amplitude packages the generated tracking library as a CJS module.
{% callout type="tip" title="Enable real-time type checking for JavaScript" %}
Because JavaScript isn't a type-safe language, static type checking isn't built in like TypeScript. Some common IDEs allow for real-time type checks in JavaScript based on JSDoc.
For a better development experience, Ampli generates JSDocs for all methods and classes.
To enable real-time type checking in VSCode for JavaScript:
1. Go to *Preferences > Settings* then search for **checkJs**.
2. Select *JS/TS > Implicit Project Config: Check JS*.
After activation, type errors appear directly in the IDE.
Jetbrains provides similar support:
1. Go to *Preferences > Editor > Inspections > JavaScript and TypeScript > General*.
2. In **Signature mismatch** and **Type mismatch**, set the **Severity** to Warning or Error based on the level of strictness you need.
{% /callout %}
{% callout type="tip" title="Linting with Prettier" %}
To prevent linting errors for eslint and tslint, the SDK-generated files have the following to disable the linters:
`/* tslint:disable */`
`/* eslint-disable */`
There's no corresponding "in-code" functionality with Prettier. Instead, add the generated `path/to/ampli` to your `.prettierignore` file. You can get the path with `ampli pull`. For more information, refer to the [Prettier documentation](https://prettier.io/docs/en/ignore.html).
{% /callout %}
## Quickstart
1. [(Prerequisite) Create a Tracking Plan in Amplitude Data](https://amplitude.com/docs/data/create-tracking-plan)
Plan your events and properties in [Amplitude Data](https://data.amplitude.com/).
1. [Install the Amplitude SDK](#install-the-amplitude-sdk)
```bash
npm install @amplitude/analytics-browser
```
1. [Install the Ampli CLI](#install-the-ampli-cli)
```bash
npm install -g @amplitude/ampli
```
1. [Pull the Ampli Wrapper into your project](#pull)
```bash
ampli pull [--path ./src/ampli]
```
1. [Initialize the Ampli Wrapper](#load)
```js
import { ampli } from "./src/ampli";
ampli.load({ client: { apiKey: AMPLITUDE_API_KEY } });
```
1. [Identify users and set user properties](#identify)
```js
ampli.identify("user-id", {
userProp: "A trait associated with this user",
});
```
1. [Track events with strongly typed methods and classes](#track)
```js
ampli.songPlayed({ songId: "song-1" });
ampli.track(new SongPlayed({ songId: "song-2" }));
```
1. [Flush events before application exit](#flush)
```js
ampli.flush();
```
1. [Verify implementation status with CLI](#status)
```shell
ampli status [--update]
```
## Install the Amplitude SDK
If you haven't already, install the core Amplitude SDK dependencies.
{% code-group %}
```bash npm
npm install @amplitude/analytics-browser
```
```bash yarn
yarn add @amplitude/analytics-browser
```
{% /code-group %}
{% callout type="note" title="" %}
When you use Ampli in the browser, Amplitude recommends loading `amplitude-js` as a module rather than as a JavaScript snippet.
{% /callout %}
## Install the Ampli CLI
You can install the Ampli CLI from Homebrew or npm.
{% code-group %}
```bash brew
brew tap amplitude/ampli
brew install ampli
```
```bash npm
npm install -g @amplitude/ampli
```
{% /code-group %}
### Pull the Ampli Wrapper into your project
Run the Ampli CLI `pull` command to log in to Amplitude Data and download the strongly typed Ampli Wrapper for your tracking plan. Run Ampli CLI commands from the project root directory.
```bash
ampli pull
```
## API
Ampli generates a thin facade over the Amplitude SDK which provides convenience methods. The Ampli Wrapper also grants access to every method of the underlying Amplitude SDK through `ampli.client`. For [more details, refer to the Ampli documentation](https://amplitude.com/docs/sdks/ampli#wrapping-the-amplitude-sdk).
### Load
Initialize Ampli in your code. The `load()` function requires an options object to configure the SDK's behavior:
| Option | Type | Required | Description |
|---|---|---|---|
| `disabled` | Boolean | No | Specifies whether the Ampli Wrapper does any work. When `true`, all calls to the Ampli Wrapper are no-ops. Useful in local or development environments. Defaults to `false`. |
| `client.instance` | `AmplitudeClient` | Required if `client.apiKey` isn't set | Specifies an Amplitude instance. By default, Ampli creates an instance for you. |
| `client.apiKey` | String | Required if `client.instance` isn't set | Specifies an API Key. This option overrides the default, which is the API Key configured in your tracking plan. |
| `client.configuration` | `Amplitude.Config` | No | Overrides the default configuration for the AmplitudeClient. |
Example of initialization with `load` to override the default configuration:
```js
ampli.load({
client: {
apiKey: AMPLITUDE_API_KEY,
configuration: {
minIdLength: 10,
},
},
});
```
### Identify
Call `identify()` to identify a user in your app and associate all future events with their identity, or to set their properties.
The Ampli Wrapper creates types for user properties as well as for events and their properties.
The `identify()` function accepts an optional `userId`, optional user properties, and optional `options`.
For example, your tracking plan contains a user property called `role`. The property's type is a string.
```ts
ampli.identify("user-id", {
role: "admin",
});
```
The options argument allows you to pass [Amplitude fields](https://amplitude.com/docs/apis/analytics/http-v2#event-array-keys) for this call, such as `deviceId`.
```ts
ampli.identify(
"user-id",
{
role: "admin",
},
{
deviceId: "my-device-id",
},
);
```
### Group
Call `setGroup()` to associate a user with their group (for example, their department or company). The `setGroup()` function accepts a required `groupType` and `groupName`.
```ts
ampli.client.setGroup("groupType", "groupName");
```
Amplitude supports assigning users to groups and performing queries, such as Count by Distinct, on those groups. If at least one member of the group performs the specific event, then the count includes the group.
For example, you want to group your users based on what organization they're in by using an 'orgId'. Joe is in 'orgId' '10', and Sue is in 'orgId' '15'. Sue and Joe both perform a certain event. You can query their organizations in the Event Segmentation Chart.
When setting groups, define a `groupType` and `groupName`. In the previous example, 'orgId' is the `groupType` and '10' and '15' are the values for `groupName`. Another example of a `groupType` could be 'sport' with `groupName` values like 'tennis' and 'baseball'.
Setting a group also sets `groupType:groupName` as a user property, overwrites any existing `groupName` value set for that user's `groupType`, and overwrites the corresponding user property value. `groupType` is a string. `groupName` accepts a string or an array of strings to show that a user belongs to multiple groups. For example, if Joe is in 'orgId' '10' and '20', then the `groupName` is '[10, 20]'.
Your code might look like this:
```ts
ampli.client.setGroup("orgId", ["10", "20"]);
```
### Track
To track an event, call the event's corresponding function. Every event in your tracking plan gets its own function in the Ampli Wrapper. The call structure looks like this:
```ts
ampli.eventName(properties: EventNameProperties, options: EventOptions)
```
The `properties` argument passes event properties. The `options` argument lets you pass [Amplitude fields](https://amplitude.com/docs/apis/analytics/http-v2#event-array-keys), like `price`, `quantity`, and `revenue`.
For example, in the following code, your tracking plan contains an event called `songPlayed`. The event has two required properties: `songId` and `songFavorited`. The property type for `songId` is string, and `songFavorited` is a boolean.
The event has an Amplitude field defined: `deviceId`. For more information, refer to [Amplitude fields](https://amplitude.com/docs/apis/analytics/http-v2/#event-array-keys).
```ts
ampli.songPlayed(
{
songId: "songId", // string,
songFavorited: true, // boolean
},
{
deviceId: "a-device-id",
},
);
```
Ampli also generates a class for each event.
```ts
const myEventObject = new SongPlayed({
songId: "songId", // string,
songFavorited: true, // boolean
});
```
Track Event objects using Ampli `track`:
```ts
ampli.track(
new SongPlayed({
songId: "songId", // string,
songFavorited: true, // boolean
}),
);
```
### Flush
The Ampli wrapper queues events and sends them on an interval based on the configuration.
Call `flush()` to immediately send any pending events.
The `flush()` method returns a promise you can use to ensure all pending events send before continuing. Call `flush()` before application exit.
```typescript
ampli.flush();
```
### Plugin
Plugins let you extend Amplitude behavior, for example, by modifying event properties (enrichment type) or sending to third-party APIs (destination type).
First, define your plugin. Enrichment Plugin example:
{% code-group %}
```ts TypeScript
import {
BrowserConfig,
EnrichmentPlugin,
Event,
} from "@amplitude/analytics-types";
export class AddEventIdPlugin implements EnrichmentPlugin {
name = "add-event-id";
type = "enrichment" as const;
currentId = 100;
/**
* setup() is called on plugin installation
* example: client.add(new AddEventIdPlugin());
*/
setup(config: BrowserConfig): Promise {
this.config = config;
}
/**
* execute() is called on each event instrumented
* example: client.track('New Event');
*/
execute(event: Event): Promise {
event.event_id = this.currentId++;
return event;
}
}
```
```js JavaScript
export class AddEventIdPlugin {
name = "add-event-id";
type = "enrichment";
currentId = 100;
/**
* setup() is called on plugin installation
* example: client.add(new AddEventIdPlugin());
*/
setup(config) {
this.config = config;
}
/**
* execute() is called on each event instrumented
* example: client.track('New Event');
*/
execute(event) {
event.event_id = this.currentId++;
return event;
}
}
```
{% /code-group %}
Add your plugin after you initialize Ampli.
```ts
ampli.client.add(new AddEventIdPlugin());
```
## Ampli CLI
### Pull
The `pull` command downloads the Ampli Wrapper code to your project. Run the `pull` command from the project root.
```bash
ampli pull
```
Log in to your workspace when prompted, and select a source.
```bash
➜ ampli pull
Ampli project is not initialized. No existing `ampli.json` configuration found.
? Create a new Ampli project here? Yes
? Organization: Amplitude
? Workspace: My Workspace
? Source: My Source
```
For more information, refer to [`ampli pull`](https://amplitude.com/docs/sdks/ampli/ampli-cli#pull).
### Status
Verify that events are in your code with the status command:
```bash
ampli status [--update]
```
The output displays status and indicates which events are missing.
```bash
➜ ampli status
✘ Verifying event tracking implementation in source code
✔ Song Played (1 location)
✘ Song Stopped Called when a user stops playing a song.
Events Tracked: 1 missed, 2 total
```
For more information, refer to [`ampli status`](https://amplitude.com/docs/sdks/ampli/ampli-cli#status).
================================================================================
# Autocapture Plugin
URL: https://amplitude.com/docs/sdks/analytics/browser/autocapture-plugin
================================================================================
# Autocapture Plugin
{% callout type="warning" heading="Autocapture plugin is deprecated" %}
Starting with Browser SDK version 2.10.0, Amplitude includes [Autocapture](https://amplitude.com/docs/get-started/autocapture) functionality with the SDK.
For best results, upgrade to Browser SDK 2.10.0 or higher using the following instructions.
{% /callout %}
## Update to the built-in Autocapture
If you use the Autocapture plugin and update the Browser SDK to version 2.10.0 or newer, complete the following steps to remove the plugin and use the Autocapture that ships with Browser SDK.
### Script loader
Replace your referenced script with the following snippet:
```html
```
### Npm or yarn
If you use npm or yarn to add the Browser SDK, update the Browser SDK package and remove the Autocapture plugin.
```js
// package.json
{
"dependencies": {
"@amplitude/analytics-browser": "^2.10.0", // make sure the minimum version is 2.10.0
"@amplitude/plugin-autocapture-browser": "0.9.0",
}
}
```
In your script, remove references to the Autocapture plugin.
```js
import * as amplitude from "@amplitude/analytics-browser";
import { autocapturePlugin } from "@amplitude/plugin-autocapture-browser";
amplitude.init(AMPLITUDE_API_KEY);
amplitude.init(AMPLITUDE_API_KEY, {
autocapture: {
elementInteractions: true,
},
});
amplitude.add(autocapturePlugin());
```
================================================================================
# Page URL Enrichment Plugin
URL: https://amplitude.com/docs/sdks/analytics/browser/page-url-enrichment-plugin
================================================================================
# Page URL Enrichment Plugin
The Page URL Enrichment plugin automatically adds page URL-related properties to all events tracked by the Browser SDK through `amplitude.track()`. This setting doesn't affect autocaptured events. The plugin enriches your event data with contextual information about the current page and previous page navigation, which helps you understand user journeys and page transitions.
{% callout type="note" title="Enabled by default" %}
Starting with Browser SDK version 2.x, autocapture enables this plugin by default. Install it manually only if you want custom configuration or have disabled autocapture entirely.
{% /callout %}
When using the plugin, note the following:
- The plugin starts tracking page changes when enabled.
- Session storage maintains state, so previous page information persists across page refreshes within the same session.
- The plugin works with both traditional multi-page applications and single-page applications.
- If session storage isn't available, the plugin still functions, but previous page tracking may have limitations.
## Installation
Install this package from the npm registry using `npm` or `yarn`.
```bash
# npm
npm install @amplitude/plugin-page-url-enrichment-browser
# yarn
yarn add @amplitude/plugin-page-url-enrichment-browser
```
## Usage
{% callout type="info" title="Enabled by default with autocapture" %}
Autocapture in Browser SDK version 2.x enables this plugin automatically. Use the manual installation steps below only if you want custom configuration or have disabled autocapture entirely.
{% /callout %}
This plugin works on top of the Amplitude Browser SDK and adds page URL enrichment properties to all events. To use this plugin, you must use `@amplitude/analytics-browser` version `v2.0.0` or later.
### Disable page URL enrichment
To disable automatic page URL enrichment, set `autocapture.pageUrlEnrichment` to `false`:
```typescript
import * as amplitude from "@amplitude/analytics-browser";
amplitude.init("YOUR_API_KEY", {
autocapture: {
pageUrlEnrichment: false,
},
});
```
### Manual plugin installation
If you need custom configuration or have disabled autocapture entirely, install the plugin manually.
### 1. Import Amplitude packages
```typescript
import * as amplitude from "@amplitude/analytics-browser";
import { pageUrlEnrichmentPlugin } from "@amplitude/plugin-page-url-enrichment-browser";
```
### 2. Instantiate page URL enrichment plugin
The plugin accepts an optional parameter of type `Object` to configure the plugin.
```typescript
const pageUrlEnrichment = pageUrlEnrichmentPlugin();
```
### 3. Install plugin to Amplitude SDK
```typescript
amplitude.add(pageUrlEnrichment);
```
### 4. Initialize Amplitude SDK
```typescript
amplitude.init("API_KEY");
```
## Event properties
This plugin adds the following properties to all events:
| Property | Description |
| ------------------------------------ | ---------------------------------------------------------------------------------------------------------------------------- |
| `[Amplitude] Page Domain` | The website's hostname (`location.hostname`). |
| `[Amplitude] Page Location` | The website's full URL (`location.href`). |
| `[Amplitude] Page Path` | The website's pathname (`location.pathname`). |
| `[Amplitude] Page Title` | The website's title (`document.title`). To mask the title, add the `data-amp-mask` attribute to the `` element. |
| `[Amplitude] Page URL` | The website's URL excluding query parameters. |
| `[Amplitude] Previous Page Location` | The URL of the previous page the user visited. |
| `[Amplitude] Previous Page Type` | A classification of the previous page type. |
### Previous page type classification
The `[Amplitude] Previous Page Type` property classifies the previous page based on the following logic:
- `direct`: no previous page or referrer (user came directly to the site).
- `internal`: previous page came from the same domain (same hostname).
- `external`: previous page came from a different domain.
## How the plugin works
The Page URL Enrichment plugin:
1. Tracks page changes: monitors navigation events such as `pushState`, `replaceState`, and `popstate` to detect page changes in single-page applications.
2. Stores navigation history: uses session storage to maintain the current and previous page URLs across page navigation.
3. Enriches all events: adds page URL properties to every event the Browser SDK tracks.
4. Preserves existing properties: if an event already has any of the page URL properties, the plugin preserves the existing values.
## Page title masking
The Page URL Enrichment plugin supports page title masking through the `data-amp-mask` attribute on your page's `<title>` element. This attribute tells the plugin that you've disguised the page title from users and want to use the masked value in the `[Amplitude] Page Title` property.
For example:
```html
<head>
<!-- Masked page title
This page title is fully masked in the `[Amplitude] Page Title`
of all events enriched by the Page URL Enrichment plugin on this page
Page title: "*****"
-->
<title data-amp-mask>Private Dashboard For John Doe
```
The Page URL Enrichment plugin replaces the actual page title with the masked value (`*****`) in all events that the plugin enriches.
## Session storage
The plugin uses session storage to persist navigation information across page changes. The plugin stores data using these keys:
- `AMP_URL_INFO`: stores the current and previous page URLs.
Session storage ensures that previous page information persists during single-page application navigation or page refreshes within the same session.
## Example
A complete example of how to set up the Page URL Enrichment plugin:
```typescript
import * as amplitude from "@amplitude/analytics-browser";
import { pageUrlEnrichmentPlugin } from "@amplitude/plugin-page-url-enrichment-browser";
// Create the plugin instance
const pageUrlEnrichment = pageUrlEnrichmentPlugin();
// Add the plugin to Amplitude
amplitude.add(pageUrlEnrichment);
// Initialize Amplitude
amplitude.init("YOUR_API_KEY");
// Track an event - it automatically includes page URL properties
amplitude.track("Button Clicked", {
button_name: "Sign Up",
});
```
The tracked event includes properties like:
```json
{
"event_type": "Button Clicked",
"event_properties": {
"button_name": "Sign Up",
"[Amplitude] Page Domain": "example.com",
"[Amplitude] Page Location": "https://example.com/signup?utm_source=google",
"[Amplitude] Page Path": "/signup",
"[Amplitude] Page Title": "Sign Up - Example",
"[Amplitude] Page URL": "https://example.com/signup",
"[Amplitude] Previous Page Location": "https://example.com/home",
"[Amplitude] Previous Page Type": "internal"
}
}
```
================================================================================
# Custom Enrichment Plugin
URL: https://amplitude.com/docs/sdks/analytics/browser/custom-enrichment-plugin
================================================================================
# Custom Enrichment Plugin
The Custom Enrichment plugin runs an enrichment function against every event the Browser SDK tracks, before the SDK uploads the event. Amplitude stores that function in your project's remote configuration, so you can change what it does without shipping a new build of your site.
The plugin is off by default. Enable it with the `customEnrichment` configuration option.
{% callout type="warning" title="This plugin doesn't affect plugins you write" %}
This plugin is separate from the [custom plugins](https://amplitude.com/docs/sdks/analytics/browser/browser-sdk-2#plugins) you add with `amplitude.add()`. Enabling or disabling `customEnrichment` has no effect on your own plugins, and your own plugins keep working whether or not you enable this one.
{% /callout %}
## Requirements
- `@amplitude/analytics-browser` version 2.37.0 or later.
- Remote configuration enabled. The SDK fetches remote configuration by default. If you set `remoteConfig.fetchRemoteConfig` to `false`, the plugin loads but never receives a function, so it leaves every event unchanged. Refer to [Remote configuration](https://amplitude.com/docs/sdks/analytics/browser/browser-sdk-2#remote-configuration).
- An enrichment function defined in your project's remote configuration. The SDK doesn't read a function from your local configuration.
## Enable the plugin
Set `customEnrichment` to `true` when you initialize the SDK:
```ts
import * as amplitude from "@amplitude/analytics-browser";
amplitude.init(AMPLITUDE_API_KEY, {
customEnrichment: true,
});
```
| Name | Description | Default value |
| ------------------- | ------------------------------------------------------------------------------------------ | ------------- |
| `customEnrichment` | `boolean`. Whether the SDK adds the Custom Enrichment plugin. | `false` |
Amplitude's remote configuration can also turn the plugin on, with one exception: when you set `customEnrichment: false` at initialization, remote configuration can't re-enable it. Omit the option instead of setting it to `false` if you want remote configuration to control the plugin.
{% callout type="note" title="" %}
The SDK reads the enrichment function only from remote configuration. Passing a function body in local configuration has no effect.
{% /callout %}
## How the plugin works
1. On setup, the plugin subscribes to the `configs.analyticsSDK.browserSDK.customEnrichment` key in your project's remote configuration.
2. When remote configuration delivers a function body, the plugin evaluates it into a function that takes an event and returns an event.
3. The plugin runs that function against every event, including autocaptured events, as the event passes through the SDK's enrichment stage.
4. When remote configuration delivers no valid function body, the plugin passes every event through unchanged.
Because the plugin subscribes to remote configuration rather than reading it once, an update to the enrichment function reaches active sessions without a page reload.
### Return values
What the enrichment function returns determines what Amplitude receives:
- **Returns an event**: the SDK uploads the returned event. This is how the function adds, changes, or removes properties.
- **Returns nothing**: the SDK drops the event, and the event never reaches Amplitude. An enrichment function that forgets to return the event silently drops all traffic.
- **Throws an error**: the SDK logs the error and uploads the original, unenriched event.
If the configured function body doesn't evaluate to a function, the plugin logs an error and passes every event through unchanged.
## Content Security Policy
The plugin evaluates the enrichment function from remote configuration at runtime. If your site sets a Content Security Policy that restricts `script-src`, the policy must allow `unsafe-eval` for the plugin to build the function. Without it, the browser blocks the evaluation, the plugin logs an error, and events pass through unchanged.
Refer to [Content Security Policy (CSP)](https://amplitude.com/docs/sdks/analytics/browser/browser-sdk-2#content-security-policy-csp) for the other policy adjustments the Browser SDK needs.
## Troubleshooting
Set `logLevel` to `Debug` to log what the plugin does:
```ts
import * as amplitude from "@amplitude/analytics-browser";
amplitude.init(AMPLITUDE_API_KEY, {
customEnrichment: true,
logLevel: amplitude.Types.LogLevel.Debug,
});
```
| Log message | What it means |
| ---------------------------------------------------------- | ------------------------------------------------------------------------------------------------------------------ |
| `Adding custom enrichment plugin` | The SDK enabled the plugin and added it. |
| `Installing @amplitude/plugin-custom-enrichment-browser` | The plugin started its setup. |
| `Remote config client is not provided, skipping remote config fetch` | The plugin can't reach remote configuration, so it leaves events unchanged. Check that remote configuration is on. |
| `Custom enrichment body did not evaluate to a function` | Remote configuration delivered a body that isn't a function. Events pass through unchanged. |
| `Could not create custom enrichment function` | The plugin couldn't evaluate the body. Check your Content Security Policy. |
| `Could not execute custom enrichment function` | The enrichment function threw an error. The SDK uploads the original event. |
If the log doesn't include `Adding custom enrichment plugin`, the SDK didn't enable the plugin. Confirm that `customEnrichment` isn't set to `false` in your initialization options.
## Google Tag Manager
The Amplitude Browser SDK GTM template exposes this plugin as the **Enable Custom Enrichment Plugin** checkbox on the `init` tag. Refer to [Google Tag Manager (client)](https://amplitude.com/docs/data/source-catalog/google-tag-manager#custom-enrichment-plugin).
================================================================================
# Cookies and consent management (Browser SDK)
URL: https://amplitude.com/docs/sdks/analytics/browser/cookies-and-consent-management
================================================================================
# Cookies and consent management (Browser SDK)
This guide covers how Amplitude Browser SDK 2 works with cookies, local storage, opt-in and opt-out options, and consent management, including CNIL regulations for France.
{% callout type="info" heading="Browser SDK 2 compatibility" %}
This guide covers Browser SDK 2 (TypeScript SDK). For the legacy JavaScript SDK, refer to the [legacy cookies and consent management guide](https://amplitude.com/docs/sdks/analytics/browser/cookies-and-consent-management-javascript-sdk).
{% /callout %}
## Amplitude cookies
A cookie is a piece of data from a website that browsers store on users' devices. Websites retrieve cookies later to access stored data for functional or technical purposes. After initialization, Amplitude Browser SDK 2 creates cookies that begin with specific prefixes and include the first 10 digits of your project API key.
For example, if you initialize the SDK with:
```ts
import * as amplitude from "@amplitude/analytics-browser";
amplitude.init("a2dbce0e18dfe5f8e...");
```
Amplitude Browser SDK 2 creates cookies with the following format:
- **User session cookies**: `AMP_` with the first 10 characters of your project's API key appended (for example, `AMP_a2dbce0e18`).
- **Marketing campaign cookies**: `AMP_MKTG_` with the first 10 characters of your project's API key appended (for example, `AMP_MKTG_a2dbce0e18`).
### Test cookies
During initialization, the SDK may create temporary test cookies to verify cookie functionality:
- `AMP_TEST_` followed by a timestamp: tests whether cookies work.
- `AMP_TLDTEST_` followed by a timestamp: finds the appropriate subdomain for cookie storage.
The SDK removes these test cookies after testing completes. If they persist, you can safely delete them manually.
### Cookie data
The SDK stores different types of information in cookies:
#### User session cookies (`AMP_*`)
The user session cookie contains metadata the SDK needs to function correctly:
- `deviceId`: a randomly generated string that persists across sessions.
- `userId`: when users log in, if your app sends this value to Amplitude, the SDK stores it in the cookie. Set this value to uniquely identify users. Amplitude encodes this value as Base64 before storing it.
- `sessionId`: a randomly generated string for each session.
- `lastEventTime`: time of the last event, used to decide when to expire and create a new session ID.
- `lastEventId`: an incrementing sequence of identifiers used to distinguish events.
#### Marketing campaign cookies (`AMP_MKTG_*`)
The marketing campaign cookie stores attribution data:
- UTM parameters (`utm_source`, `utm_medium`, `utm_campaign`, `utm_term`, `utm_content`).
- Referrer information (`referrer`, `referring_domain`).
- Click IDs (`gclid`, `fbclid`, `dclid`, `gbraid`, `wbraid`, `ko_click_id`, `msclkid`, `ttclid`, `twclid`, `li_fat_id`, `rdt_cid`).
### Cookie size
Cookie size varies from approximately 60 bytes to 120 bytes per cookie. With both user session and marketing campaign cookies, expect around 240 bytes total for Amplitude cookies per project API key.
### Expiration time
By default, Amplitude cookies expire after 365 days (1 year). You can customize this with the `cookieOptions.expiration` configuration parameter:
```ts
amplitude.init("API_KEY", {
cookieOptions: {
expiration: 30, // Set cookies to expire after 30 days
},
});
```
### Remove Amplitude cookies
To remove Amplitude cookies programmatically, run the following snippet.
```ts
const API_KEY = "1234567890abcdefghijklmnopqrstuv"; // Replace it with your API KEY
const cookieName = `AMP_${API_KEY.substring(0, 10)}`;
const cookieNameMktg = `AMP_MKTG_${API_KEY.substring(0, 10)}`;
const cookies = document.cookie.split(";");
cookies.forEach((cookie) => {
const [name] = cookie.trim().split("=");
if (name === cookieName || name === cookieNameMktg) {
document.cookie = `${name}=; Max-Age=0; path=/; SameSite=Lax`;
}
});
```
To anonymize users after they log out, call `reset`.
```ts
amplitude.reset();
```
`reset` does the following:
1. Sets `userId` to `undefined`.
2. Sets `deviceId` to a new UUID value.
With an undefined `userId` and a new `deviceId`, the user appears to Amplitude as a new user.
## Disable cookies using localStorage
Set the `identityStorage` option to configure the SDK to use localStorage rather than cookies.
```ts
amplitude.init("API_KEY", {
identityStorage: "localStorage",
});
```
### Data stored in local storage
When using localStorage, the SDK stores the same user session information that cookies normally hold, plus:
- **Unsent events**: events that didn't upload successfully to Amplitude.
- **Failed events**: events that failed to send and that the SDK queues for retry.
The SDK stores data in localStorage with keys that include your project API key:
- `AMP_unsent_[API_KEY]`: stores unsent events.
{% callout type="warning" heading="Local storage limitations" %}
Local storage restricts access by subdomain. For example, if you track non-identified users across subdomains like `www.amplitude.com` and `analytics.amplitude.com`, the `device_id` value for each subdomain isn't available while browsing the other.
The Amplitude SDK supports cross-site tracking. For more information, refer to [Cross-domain tracking](https://amplitude.com/docs/sdks/analytics/browser/browser-sdk-2#cross-domain-tracking).
{% /callout %}
## Disable cookies and local storage (opt-out storage)
You can disable all persistent storage by setting `identityStorage` to `none`:
```ts
amplitude.init("API_KEY", {
identityStorage: "none",
});
```
When you disable all storage, Amplitude creates a new `device_id` for that user every time they visit your site because the SDK can't find an existing ID. If the user logs in or provides other identifying information, Amplitude's identity resolution system ties the various `device_id` values together with that user ID.
## Managing cookie consent
Certain jurisdictions require users to consent to non-essential cookies before you can collect any data. You are ultimately responsible for getting any necessary consents and making any necessary disclosures for the personal data you collect and send to Amplitude. You're also responsible for determining how you classify the Amplitude cookies in your cookie policy based on your specific use case and the jurisdictions in which you use them.
{% callout type="note" heading="" %}
Amplitude may create cookies as soon as the SDK initializes, regardless of the user's opt-out status. If you require that no cookies exist before consent, defer SDK initialization until after the user provides consent.
{% /callout %}
If you use the Amplitude SDK in one of these jurisdictions, don't initialize the SDK until the user consents to your use of cookies. SDK initialization enables or disables Amplitude functions, such as cookie storage, local storage, and event tracking.
### Deferred initialization approach
For consent management, you can track events before cookie consent and initialize the SDK later:
```ts
// Track events
amplitude.track("Button Clicked");
// Later, when user provides consent,
// initialize the SDK
amplitude.init("API_KEY");
```
### Configuration options related to storage
Each storage-related option in Browser SDK 2:
| Option | Default value | Definition |
| -------------------------- | -------------- | --------------------------------------------------------------------------------------------------------------------------------------------------------------------------------------------------------------- |
| `cookieOptions.expiration` | 365 | The number of days after which the Amplitude cookie expires. The default of 12 months supports GDPR compliance. |
| `cookieOptions.domain` | `undefined` | Sets a custom domain for the Amplitude cookie. To include subdomains, add a preceding period, for example: `.amplitude.com`. |
| `cookieOptions.secure` | `false` | If `true`, Amplitude sets the cookie with the Secure flag. The Secure flag tells the browser to send this cookie only on encrypted HTTPS transmissions. |
| `cookieOptions.sameSite` | `Lax` | Sets the SameSite flag on the Amplitude cookie. Determines cookie privacy policy. |
| `identityStorage` | `cookie` | Sets the storage API for user identity. Options include `cookie` for `document.cookie`, `localStorage` for `localStorage`, `sessionStorage` for `sessionStorage`, or `none` to opt out of persisting user identity. |
| `storageProvider` | `LocalStorage` | Sets a custom implementation of `Storage` to persist unsent events. |
## Abstraction layer for storage
The abstraction layer for storage, the available options, and the stored metadata are available in Amplitude's GitHub repository for the TypeScript SDK:
- [Browser SDK 2 source code](https://github.com/amplitude/Amplitude-TypeScript/tree/main/packages/analytics-browser)
- [Configuration types](https://github.com/amplitude/Amplitude-TypeScript/blob/main/packages/analytics-types/src/config/browser.ts)
- [Cookie storage implementation](https://github.com/amplitude/Amplitude-TypeScript/tree/main/packages/analytics-browser/src/storage)
## Frequently asked questions
{% accordion title="Are Amplitude's cookies first-party or third-party cookies?" %}
Amplitude uses first-party cookies. From a technical standpoint, there's no difference between first-party and third-party cookies. The distinction relates to:
1. The context of a particular visit.
2. Who creates the cookie.
Every cookie has an owner, which is the domain defined in the cookie:
- First-party cookies are issued by a website that a user views directly. If a user lands on a website, for example, fit.amplitude.com, this site creates a cookie that is then saved on the user's computer.
This is how Amplitude works. When a customer adds Amplitude Browser SDK 2 to their website, the customer (through their website) directly creates the cookie stored in the visitor's computer.
- Third-party cookies are not created by the website being visited, but by someone else. Imagine you're visiting fit.amplitude.com, and the site uses YouTube videos for virtual non-live classes. In this case, YouTube sets the cookie that is saved on the user's computer.
In this case, the website owner embeds pieces of code, provided by YouTube, so that the videos play directly in fit.amplitude.com. When that YouTube code executes in the browser, or the video loads, YouTube can track the player and put data in its cookies. The cookie qualifies as a third-party cookie because a different domain than fit.amplitude.com or amplitude.com creates it.
{% /accordion %}
{% accordion title="Will Google Chrome's plan to remove third party cookies affect Amplitude?" %}
No. Amplitude is not a third-party cookie. Amplitude customers add Amplitude to their website or bundle themselves, and Amplitude sets the cookie in their bundled code through document.cookie, so Amplitude has the privileges of a first-party cookie.
{% /accordion %}
{% accordion title="Why aren't Amplitude cookies marked as `HttpOnly`?" %}
Amplitude's cookies aren't HttpOnly because the purpose of that option is to prevent document.cookie from reading those cookies (since the browser uses them only in client-server communication). The purpose of Amplitude's cookies is the opposite: Amplitude needs to persist data in the browser and store it in document.cookies. Amplitude can't read from the server because Amplitude is client-side code.
If you're concerned that this renders the Amplitude cookie vulnerable to authentication information theft, you shouldn't be. Amplitude stores no authentication information in that cookie, so there's no danger of an XSS attack. The worst thing an attacker could do is steal Amplitude's cookie and take that user's device ID and user ID, which shouldn't be PII to begin with.
If this is a serious concern for you, disable Amplitude's cookies.
{% /accordion %}
{% accordion title="Why aren't Amplitude's cookies marked as secure?" %}
The Secure flag tells the browser to send the cookie only on encrypted HTTPS transmissions. The Secure flag ensures that your cookie isn't visible to an attacker, for example in a man-in-the-middle attack. Amplitude has no authentication information in that cookie or any type of sensitive information, so Amplitude isn't in danger of an XSS attack. The worst thing an attacker could do is steal Amplitude's cookie and take that user's device ID and user ID.
For these reasons, Amplitude doesn't consider this a security vulnerability. However, you can enable the Secure flag if needed:
```ts
amplitude.init("API_KEY", {
cookieOptions: {
secure: true,
},
});
```
{% /accordion %}
{% accordion title="Will cookies cause unsent events to send to a project with a different API key?" %}
No. Browser SDK 2 scopes all stored events with the API key. If a product changes the project (or its API key) it sends events to, those old events don't reach the new project. The SDK stores events in localStorage with keys that include the API key, which ensures proper isolation between different projects.
{% /accordion %}
{% accordion title="How do you integrate with third-party Consent Management Platforms?" %}
Websites and applications can use a consent management platform (CMP) to manage legal consent from users around collecting and processing their personal data through any cookies and other trackers operating on the domain, as applicable privacy laws may require, such as GDPR, CCPA, and ePrivacy. Examples of these tools include OneTrust, Axeptio, and Responsum.
Amplitude doesn't currently have a default integration with any of these tools. Configure your CMP to pass the outcome of the consent to the Amplitude SDK, so that any end user who hasn't provided consent or who has revoked consent (depending on the end user's jurisdiction) opts out of tracking by the Amplitude SDK.
Here's an example integration pattern:
```ts
// Track events
amplitude.track("Button Clicked");
// Initialize when CMP provides consent status
amplitude.init("API_KEY");
```
{% /accordion %}
{% accordion title="Can I use OneTrust with Amplitude to stay GDPR compliant?" %}
Yes, you can use Amplitude with a CMP, like OneTrust, in a GDPR-compliant manner. Amplitude can't direct you on how to classify the Amplitude SDK or cookies. Instead, your privacy and legal teams should make this assessment based on the data you're collecting. Most customers, including in the EU, classify Amplitude cookies as Performance/Analytics cookies.
Customers may also choose to implement through a server-side integration, which bypasses Amplitude's SDK cookies. Customers who integrate through a server-side integration are still responsible for getting any necessary consents and making any necessary disclosures for the personal data they collect and send to Amplitude.
{% /accordion %}
## CNIL France - Frequently asked questions
{% callout type="warning" heading="CNIL France FAQs" %}
FAQs related to CNIL aren't intended as legal or regulatory advice and don't constitute any warranty or contractual commitment on the part of Amplitude. Amplitude encourages customers to seek independent legal advice on your legal and regulatory obligations with issues related to this subject matter.
{% /callout %}
{% accordion title="CNIL France - What is the CNIL cookie exemption?" %}
The CNIL (Commission Nationale Informatique & Libertés) is the French Data Protection Agency. As a general rule, the CNIL requires user consent before a website, mobile application, or other connected device can use cookies. The CNIL allows a limited exemption from this requirement for cookies that collect only anonymous, aggregated statistical data used for measuring website traffic or performance. Data collected from these cookies can't combine with other data or identify users.
{% /accordion %}
{% accordion title="CNIL France - What does the CNIL cookie exemption really mean?" %}
The CNIL maintains a list of services that can operate under the exemption. Any use of an analytics service under the CNIL exemption is subject to the following limitations:
1. Analytics cookies can ONLY operate without user consent if they only collect anonymous statistical data for audience measurement (total traffic, page views).
2. This doesn't mean a customer can collect ALL data about a user for analysis.
3. Under the exemption, customers can't use or create "user" analyses.
{% /accordion %}
{% accordion title="CNIL France - What does the CNIL exemption mean for Amplitude and our cookies?" %}
The CNIL allows a limited exemption for the requirement that companies obtain user consent for any non-essential cookies. This exemption applies to analytics cookies for the limited purpose of audience measurement of an app or a site, and it's limited to the use of anonymous tracers.
A customer's use of an analytics service under the exemption is therefore limited. Without the CNIL cookie exemption, customers might only collect and measure part of their traffic. The limited data set in Amplitude (for example, the data set with only users who opted in or consented) is more valuable than the limited data that the exemption permits, because:
- Audience measurement (page views, total sessions) doesn't help customers make better decisions. Behavioral analytics guide actions and learning.
- Amplitude doesn't need 100% of traffic to derive meaningful insights.
- Most exempted tools don't have the powerful analytics capabilities of Amplitude.
In addition to using the SDKs, customers can send data to Amplitude server-side. Server-side integration doesn't require customers to obtain consent for a separate Amplitude SDK cookie. Customers who integrate through a server-side integration are responsible for obtaining any necessary consents and making any necessary disclosures for the personal data they collect and send to Amplitude.
{% /accordion %}
{% accordion title="CNIL France - 13-month cookie limit" %}
Amplitude Browser SDK 2 has a `cookieOptions.expiration` option that lets customers set the number of days a cookie lives. The default is 1 year (365 days) as of the current version. Most browsers limit the lifetime of cookies set using document.cookie from 1 to 7 days.
```ts
amplitude.init("API_KEY", {
cookieOptions: {
expiration: 395, // 13 months in days
},
});
```
{% /accordion %}
{% accordion title="CNIL France - 25-month data retention max" %}
Use [Amplitude's Time to Live](https://amplitude.com/docs/data/time-to-live) functionality to set a retention schedule for event data.
{% /accordion %}
{% accordion title="CNIL France - Purpose strictly limited to the sole measurement of the site's or application's audience" %}
The requirement limits the purpose to the sole measurement of the site's or application's audience: performance measurement, detection of browsing problems, optimization of technical performance or ergonomics, estimation of the power of the servers required, and analysis of contents consulted, for the exclusive account of the publisher. Amplitude customers are in full control of the data that they choose to send to the Amplitude platform, and can choose to send only Amplitude events related to audience measurement and page views.
Configure the SDK to track only page views and basic session information:
```ts
amplitude.init("API_KEY", {
autocapture: {
attribution: false,
pageViews: true,
sessions: true,
formInteractions: false,
fileDownloads: false,
elementInteractions: false,
},
});
```
{% /accordion %}
{% accordion title="CNIL France - Only serve to produce anonymous statistical data" %}
Before you start using Amplitude to produce anonymous statistical data:
- [Contact Amplitude](https://amplitude.zendesk.com/hc/en-us/requests/new) to:
- Request that Amplitude drop the IP address for projects that contain end users who haven't provided consent.
- Discuss disabling Amplitude's User Look-Up and the ability to view user streams for projects that contain data for end users who haven't provided consent.
- Discuss the most effective configuration options for your use case.
- Ensure you don't send `deviceID` to Amplitude for end users who haven't provided consent.
- For end users who haven't provided consent, set a `userID` that's randomly generated or hashed.
- Consider disabling the capacity to filter end users at the individual level by hiding user properties, such as `userID`, `deviceID`, and `Amplitude ID`. Refer to [Transformations](https://amplitude.com/docs/data/transformations) for more information.
- Consider disabling user downloads. Refer to [Managing Projects](https://amplitude.com/docs/admin/account-management/manage-orgs-projects) for more information.
{% /accordion %}
{% accordion title="CNIL France - Compliant with GDPR" %}
Amplitude's privacy program is based on privacy-by-design principles. Amplitude's privacy program ensures that it complies with all relevant domestic and international privacy regulations and laws regarding the processing of personal data, including GDPR.
Amplitude also offers customers the choice of hosting their data in the US-West based AWS environment or the EU based AWS environment. To ensure that Amplitude's customers can appropriately respond to and comply with end-user data deletion requests as required by global privacy laws such as GDPR, Amplitude built an API endpoint that lets customers submit requests programmatically to delete all data for a set of known Amplitude IDs or User IDs. For more details, refer to the developer documentation: [User Privacy API](https://amplitude.com/docs/apis/analytics/user-privacy).
Customers can complete Data Subject Access Requests (DSARs) using the [DSAR API](https://amplitude.com/docs/apis/analytics/ccpa-dsar), which makes it easy to retrieve all data about a single user.
For more information on Amplitude's stance on privacy and security, refer to [Amplitude Trust](https://amplitude.com/trust).
{% /accordion %}
{% accordion title="CNIL France - Cookies must not lead to a cross-checking of the data with other processing or that data be passed on to third parties." %}
Amplitude doesn't export data unless the customer chooses to export data to third-party products. Customers shouldn't use Amplitude to export data related to end users who haven't provided consent to third-party products.
Upon request, Amplitude can disable its cohort syncing and data streaming capabilities for orgs that contain only data for end users who haven't provided consent.
{% /accordion %}
{% accordion title="CNIL France - Cookies must not allow the global follow-up" %}
The CNIL exemption states that cookies must not allow the global follow-up of the navigation of the person using different applications or browsing on different websites. Any solution that uses the same identifier across multiple sites (for example, through cookies placed on a third-party domain loaded by multiple sites) to cross-reference, duplicate, or measure a unified reach for content is excluded.
To comply with this requirement, customers shouldn't use Amplitude's [cross domain tracking](https://amplitude.com/docs/sdks/analytics/browser/browser-sdk-2#cross-domain-tracking), and should use a [separate platform instrumentation](https://amplitude.com/docs/get-started/cross-platform-vs-separate-platform) for any projects with data from end users who haven't provided consent. By default, Amplitude doesn't employ cross-domain tracking for customers.
{% /accordion %}
{% accordion title="CNIL France - The data is collected, processed and stored independently for each publisher" %}
Amplitude logically separates customer data and stores it in encrypted form in Amplitude's AWS environment.
{% /accordion %}
{% accordion title="CNIL France - The trackers are completely independent of each other and of any other tracker" %}
The cookie used by Amplitude Browser SDK 2 is a [first party cookie](#frequently-asked-questions). The customer collects any data the cookie collects as the controller of the data. Amplitude processes the customer's data only as a processor or service provider, and doesn't use customer data for its own purposes.
{% /accordion %}
================================================================================
# Migrate from Browser SDK 1.0 to 2.0
URL: https://amplitude.com/docs/sdks/analytics/browser/migrate-from-browser-sdk-1-0-to-2-0
================================================================================
# Migrate from Browser SDK 1.0 to 2.0
Amplitude Browser SDK 2.0 (`@amplitude/analytics-browser`) features [Autocapture](https://amplitude.com/docs/data/autocapture), improved marketing attribution tracking, a simplified interface, and a lighter-weight package.
Browser SDK 2.0 is compatible with [Amplitude Session Replay](https://amplitude.com/docs/session-replay).
{% callout type="info" title="Using Browser SDK with Ampli v2" %}
Ampli v2 is compatible with both Browser SDK 2.0 and Browser SDK 1.0. Follow this migration guide to upgrade.
{% /callout %}
## Terminology
- `@amplitude/analytics-browser@1`: Browser SDK 1.0
- `@amplitude/analytics-browser@2`: Browser SDK 2.0
## Dependency
```diff
{
"dependencies": {
- "@amplitude/analytics-browser": "^1"
+ "@amplitude/analytics-browser": "^2"
}
}
```
## Autocapture
Starting with Browser SDK 2.10.0, Amplitude enables Autocapture by default. Autocapture is implicit tracking that Amplitude performs on your behalf, and includes page views, sessions, file downloads, form and element interactions, and marketing attribution.
To opt out of default tracking, set `options.autocapture` to `false`.
```ts
amplitude.init(API_KEY, undefined, {
autocapture: false,
});
```
You can also select which events Amplitude tracks. For example, to enable default tracking only for marketing attribution and page views, use the code below.
```ts
amplitude.init(API_KEY, undefined, {
autocapture: {
attribution: true,
pageViews: true,
sessions: false,
fileDownload: false,
formInteractions: false,
elementInteractions: false,
},
});
```
## Marketing attribution tracking
Starting with Browser SDK 2.0, Amplitude consolidates Browser SDK and Marketing Analytics SDK into a single solution for both product and marketing analytics use cases.
Marketing attribution tracking excludes all subdomains of the same root domain as referrer. By default, Amplitude doesn't track traffic from one subdomain to another (for example, `analytics.amplitude.com` to `experiment.amplitude.com`).
By default, Browser SDK 1.0 tracks other subdomains as referrer. To preserve this behavior, refer to the code below.
### Deprecates `options.attribution.trackNewCampaigns`
This option is no longer supported because Amplitude adopted it as non-configurable default behavior. Amplitude tracks any changes to campaign parameters, which includes UTM, referrer, and click ID parameters.
### Deprecates `options.attribution.trackPageViews`
This option no longer exists, but you can configure Amplitude similarly using page view options.
```diff
amplitude.init(API_KEY, undefined, {
- attribution: {
- trackPageViews: true,
- },
+ defaultTracking: {
+ pageViews: {
+ trackOn: 'attribution',
+ },
+ },
});
```
## Cookie options
Starting with Browser SDK 2.0, Amplitude simplified the options that manage cookie use. By default, Amplitude stores user identity in browser cookies.
### Using an alternative storage API
```ts
amplitude.init(API_KEY, undefined, {
disableCookies: true,
identityStorage: "localStorage",
});
```
### Disabling user identity persistence
```ts
import { MemoryStorage } from "@amplitude/analytics-core";
amplitude.init(API_KEY, undefined, {
cookieStorageProvider: new MemoryStorage(),
identityStorage: "none",
});
```
### Configuring cookie options
The options that manage cookie usage now nest under `options.cookieOptions` for a more discoverable interface.
```ts
amplitude.init(API_KEY, undefined, {
cookieExpiration: 365,
cookieSameSite: "Lax",
cookieSecure: false,
cookieUpgrade: true,
domain: "",
cookieOptions: {
expiration: 365,
sameSite: "Lax",
secure: false,
upgrade: true,
domain: "",
},
});
```
## Deprecates user agent client-side parsing
Starting with Browser SDK 2.0, Amplitude moved user agent property enrichment from client-side to server-side. The enriched user properties include `os_name`, `os_version`, `device_model`, and `device_manufacturer`. The new enrichment strategy yields more accurate results, but it produces slightly different results than Browser SDK 1.0 and may affect existing analytics charts that query these properties. To preserve Browser SDK 1.0 behavior, install [@amplitude/plugin-user-agent-enrichment-browser](https://www.npmjs.com/package/@amplitude/plugin-user-agent-enrichment-browser) to enrich these user properties on the client-side. Refer to the [plugin-user-agent-enrichment-browser package on NPM](https://www.npmjs.com/package/@amplitude/plugin-user-agent-enrichment-browser) for more details.
## No enums
Amplitude no longer requires the enums `TransportType`, `ServerZone`, and `PluginType`, and accepts their literal values.
Set the transport provider on initialization:
```ts
import * as amplitude from "@amplitude/analytics-browser";
amplitude.init(API_KEY, USER_ID, {
transport: amplitude.Types.TransportType.Fetch,
transport: "fetch",
});
```
Set the transport provider using `setTransport()`:
```ts
import * as amplitude from "@amplitude/analytics-browser";
amplitude.setTransport(amplitude.Types.TransportProvider.Fetch);
amplitude.setTransport("fetch");
```
Set the server zone on initialization:
```ts
import * as amplitude from "@amplitude/analytics-browser";
amplitude.init(API_KEY, USER_ID, {
serverZone: amplitude.Types.ServerZone.US,
serverZone: "US",
});
```
## Simplified plugin interface
Amplitude makes it easier to create your own plugins, requiring fewer properties for faster authoring.
### plugin.name [optional]
The name field is an optional property that lets you reference the plugin for deletion. If you don't provide a name, Amplitude assigns a random name when you add the plugin. If you don't plan to delete your plugin, you can skip assigning a name.
### plugin.type [optional]
The type field is an optional property that defines the type of plugin you're creating. Refer to the `execute()` function below to distinguish the two types. If you don't define a type, the plugin defaults to an enrichment type.
### plugin.setup() [optional]
The setup function is an optional method that Amplitude calls when you add the plugin, or on first init, whichever happens later. This function accepts two parameters:
1. Amplitude configuration.
2. Amplitude instance.
The setup function is useful for setup operations and tasks that depend on either the Amplitude configuration or instance. Examples include assigning baseline values to variables and setting up event listeners.
### plugin.execute() [optional for type: enrichment]
For enrichment plugins, the execute function is an optional method that Amplitude calls on each event. This function must return a new event. Otherwise, Amplitude drops the passed event from the queue. The execute function is useful when you need to add or remove properties from events, filter events, or perform any operation for each event tracked.
For destination plugins, the execute function is a required method that Amplitude calls on each event. This function must return a response object with keys: `event` (BaseEvent), `code` (number), and `message` (string). The execute function is useful for sending events to third-party endpoints.
### plugin.teardown() [optional]
The teardown function is an optional method that Amplitude calls when Amplitude re-initializes. The teardown function is useful for resetting unneeded persistent state that the setup or execute methods created. Examples include removing event listeners and mutation observers.
## Web attribution v2 vs web attribution v1
Web Attribution V2:
- Enabled by default.
- Tracks attribution on init with a new campaign regardless of session context (new or existing). Not configurable.
- Default value for all initial touch attribution properties is `"EMPTY"`. Configurable with `config.initialEmptyValue`.
- Doesn't start a new session on new campaign. Configurable with `config.resetSessionOnNewCampaign = true`.
- Tracks ad click IDs.
Web Attribution V1:
- Enabled by default.
- Tracks attribution on init with a new session. Not configurable.
- Doesn't track attribution on init with a new campaign. Configurable with `config.trackNewCampaigns`.
- Default value for all initial touch attribution properties is `"EMPTY"`. Configurable with `config.initialEmptyValue`.
- Doesn't start a new session on new campaign. Configurable with `config.resetOnNewCampaign`.
- Tracks ad click IDs.
================================================================================
# Migrate from Javascript SDK to Browser SDK 2.0
URL: https://amplitude.com/docs/sdks/analytics/browser/migrate-from-javascript-sdk-to-browser-sdk-2-0
================================================================================
# Migrate from Javascript SDK to Browser SDK 2.0
Amplitude Browser SDK 2.0 (`@amplitude/analytics-browser@2+`) offers these features:
- Plugin architecture.
- Built-in type definition.
- Broader support for front-end frameworks.
- Autocapture.
- Improved marketing attribution tracking.
- Identical interfaces across platforms with other Amplitude SDKs.
Browser SDK 2.0 isn't backwards compatible with `amplitude-js`.
To migrate to `@amplitude/analytics-browser@2+`, update your dependencies and instrumentation.
{% callout type="warning" heading="Breaking changes" %}
When you migrate to `@amplitude/analytics-browser@2+`, your implementation may experience disruption to web attribution. Before you upgrade, choose whether attribution occurs during a session. After you upgrade, attribution can happen during the session, and you can't configure it.
In both versions, attribution can occur during initialization.
{% /callout %}
{% callout type="warning" heading="Cookie migration" %}
Browser SDK 2.0 automatically migrates cookies from the JavaScript SDK, version 6.0.0 or above:
- Old cookie name `AMP_{first 6 digit of api key}` from JavaScript SDK 6.0.0 and above.
- New cookie name `AMP_{first 10 digit of api key}` from Browser SDK 2.
Migrating from a JavaScript SDK version before 6.0.0 requires manual cookie migration.
To manually migrate cookies:
1. Read the values from the old cookie.
2. Pass those values to `amplitude.init()` in the SDK configuration.
```ts
this.init("API_KEY", {
deviceId: "device_id",
userId: "user_id",
});
```
{% /callout %}
## Terminology
- `amplitude-js`: Maintenance Browser SDK.
- `@amplitude/analytics-browser@2+`: Browser SDK 2.0.
## Dependency
For snippet installation, update your project's [snippet loader](https://amplitude.com/docs/sdks/analytics/browser/browser-sdk-2#install-the-sdk).
For Node projects, update your dependency list in `package.json`.
{% code-group %}
```json amplitude-js
{
"dependencies": {
"amplitude-js": "^8"
}
}
```
```json @amplitude/analytics-browser@2+
{
"dependencies": {
"@amplitude/analytics-browser": "^2.11.8"
}
}
```
{% /code-group %}
## Instrumentation
Browser SDK 2.0 offers an API to instrument events. To migrate to Browser SDK 2.0, update a few calls. The following sections detail which calls changed.
## Initialization
Browser SDK 2.0 removes `getInstance()`. To initialize the SDK, call `init()` with the same parameters. The `config` object uses a different shape. Refer to [Configuration](#configuration).
{% code-group %}
```javascript amplitude-js
import amplitude from "amplitude-js";
amplitude.getInstance().init(API_KEY, OPTIONAL_USER_ID, config);
```
```typescript @amplitude/analytics-browser@2+
import * as amplitude from "@amplitude/analytics-browser";
amplitude.init(API_KEY, OPTIONAL_USER_ID, config);
```
{% /code-group %}
## Configuration
{% accordion title="Configuration options" %}
|amplitude-js|@amplitude/analytics-browser@2+|
|-|-|
|`config.apiEndpoint`|`config.serverUrl`|
|`config.batchEvents`|`config.flushQueueSize`|
|`config.cookieExpiration`|`config.cookieOptions.expiration`|
|`config.secureCookie`|`config.cookieOptions.secure`|
|`config.sameSiteCookie`|`config.cookieOptions.sameSite`|
|`config.cookieName`|NOT SUPPORTED|
|`config.cookieForceUpgrade`|NOT SUPPORTED|
|`config.deferInitialization`|NOT SUPPORTED. Refer to [Defer initialization](#defer-initialization).|
|`config.disableCookies`|`config.identityStorage`. Set it to `'localStorage'` to disable cookies.|
|`config.deviceId`|`config.deviceId`|
|`config.deviceIdFromUrlParam`|Browser SDK 2.0 pulls the device ID from the URL parameter by default. Refer to [Browser SDK 2.0 Cross-domain tracking](https://amplitude.com/docs/sdks/analytics/browser/browser-sdk-2#cross-domain-tracking).|
|`config.domain`|NOT SUPPORTED|
|`config.eventUploadPeriodMillis`|`config.flushIntervalMillis`|
|`config.eventUploadThreshold`|`config.flushQueueSize`|
|`config.forceHTTPs`|NOT SUPPORTED|
|`config.includeFbclid`|NOT SUPPORTED. Refer to [Web attribution](#web-attribution).|
|`config.includeGclid`|NOT SUPPORTED. Refer to [Web attribution](#web-attribution).|
|`config.includeReferrer`|NOT SUPPORTED. Refer to [Web attribution](#web-attribution).|
|`config.includeUtm`|NOT SUPPORTED. Refer to [Web attribution](#web-attribution).|
|`config.language`|NOT SUPPORTED. Refer to [Plugins](#plugins).|
|`config.library`|NOT SUPPORTED. Refer to [Plugins](#plugins).|
|`config.logLevel`|`config.logLevel`|
|`config.logAttributionCapturedEvent`|NOT SUPPORTED|
|`config.optOut`|`config.optOut`|
|`config.onError`|NOT SUPPORTED|
|`config.onExitPage`|NOT SUPPORTED. Refer to [Flush](#flush-or-onexitpage).|
|`config.platform`|NOT SUPPORTED at the configuration level, but `platform` still exists in the event object. To overwrite it, assign a platform when you track an event, or enrich `event.platform` using the enrichment plugin. Refer to [Plugins](#plugins).|
|`config.savedMaxCount`|NOT SUPPORTED|
|`config.saveEvents`|NOT SUPPORTED|
|`config.saveParamsReferrerOncePerSession`|NOT SUPPORTED.|
|`config.sessionTimeout`|`config.sessionTimeout`|
|`config.storage`|`config.identityStorage`|
|`config.trackingOptions`|`config.trackingOptions`|
|`config.transport`|`config.transportProvider`|
|`config.unsetParamsReferrerOnNewSession`|NOT SUPPORTED. Default behavior.|
|`config.unsentKey`|NOT SUPPORTED|
|`config.unsentIdentifyKey`|NOT SUPPORTED|
|`config.uploadBatchSize`|`config.flushQueueSize`|
|`config.headers`|NOT SUPPORTED|
|`config.serverZone`|`config.serverZone`|
|`config.useDynamicConfig`|NOT SUPPORTED|
|`config.serverZoneBasedApi`|NOT SUPPORTED|
|`config.sessionId`|`config.sessionId`|
|`config.partnerId`|`config.partnerId`|
{% /accordion %}
## Tracking events
The maintenance Browser SDK offered several `logEvent` APIs, such as `logEventWithTimestamp` and `logEventWithGroups`, to override specific properties in the event payload. In `@amplitude/analytics-browser@2+`, use the unified `track` API instead.
### logEvent()
The `logEvent()` API maps to `track()`.
{% code-group %}
```javascript amplitude-js
const eventType = "Button Clicked";
const eventProperties = {
type: "primary",
};
amplitude.getInstance().logEvent(eventType, eventProperties);
```
```typescript @amplitude/analytics-browser@2+
const eventType = "Button Clicked";
const eventProperties = {
type: "primary",
};
amplitude.track(eventType, eventProperties);
```
{% /code-group %}
### logEventWithTimestamp()
The `logEventWithTimestamp()` API maps to `track()`.
{% code-group %}
```javascript amplitude-js
const eventType = "Button Clicked";
const eventProperties = {
type: "primary",
};
const timestamp = Date.now();
amplitude
.getInstance()
.logEventWithTimestamp(eventType, eventProperties, timestamp);
```
```typescript @amplitude/analytics-browser@2+
const eventType = "Button Clicked";
const eventProperties = {
type: "primary",
};
const eventOptions = {
time: Date.now(),
};
amplitude.track(eventType, eventProperties, eventOptions);
```
{% /code-group %}
### logEventWithGroups()
The `logEventWithGroups()` API maps to `track()`.
{% code-group %}
```javascript amplitude-js
const eventType = "Button Clicked";
const eventProperties = {
type: "primary",
};
const groups = {
orgId: "12345",
};
amplitude.getInstance().logEventWithGroups(eventType, eventProperties, groups);
```
```typescript @amplitude/analytics-browser@2+
const event_type = "Button Clicked";
const event_properties = {
type: "primary",
};
const groups = {
orgId: "12345",
};
const event = {
event_type,
event_properties,
groups,
};
amplitude.track(event);
```
{% /code-group %}
### `sendEvents()`
The `sendEvents()` API maps to `flush()`.
{% code-group %}
```javascript amplitude-js
amplitude.getInstance().sendEvents();
```
```typescript @amplitude/analytics-browser@2+
amplitude.flush();
```
{% /code-group %}
## Set user properties
The APIs for setting user properties are the same, except that `getInstance()` is no longer required. The following code snippets show how to migrate APIs for user properties.
### setUserId()
{% callout type="warning" heading="Minimum identifier length" %}
The maintenance SDK uses an old SDK endpoint (`api2.amplitude.com`) which enforces no length limit for `deviceId` and `userId`. The latest SDK uses Amplitude's HTTP V2 API (`api2.amplitude.com/2/httpapi`) and requires identifiers to be at least five characters by default. When you migrate to the latest SDK, set `config.minIdLength` to a smaller value if you allowed identifiers with fewer than five characters.
{% /callout %}
Set a `userId` when you invoke `amplitude` without calling `getInstance()`.
{% code-group %}
```javascript amplitude-js
const userId = "1";
amplitude.getInstance().setUserId(userId);
```
```typescript @amplitude/analytics-browser@2+
const userId = "1";
amplitude.setUserId(userId);
```
{% /code-group %}
### setDeviceId()
{% callout type="warning" heading="Minimum identifier length" %}
The maintenance SDK uses an old SDK endpoint (`api2.amplitude.com`) which enforces no length limit for `deviceId` and `userId`. The latest SDK uses Amplitude's HTTP V2 API (`api2.amplitude.com/2/httpapi`) and requires identifiers to be at least five characters by default. When you migrate to the latest SDK, set `config.minIdLength` to a smaller value if you allowed identifiers with fewer than five characters.
{% /callout %}
Set a `deviceId` when you invoke `amplitude` without calling `getInstance()`.
{% code-group %}
```javascript amplitude-js
const deviceId = "1";
amplitude.getInstance().setDeviceId(deviceId);
```
```typescript @amplitude/analytics-browser@2+
const deviceId = "1";
amplitude.setDeviceId(deviceId);
```
{% /code-group %}
### setSessionId()
Set a `sessionId` when you invoke `amplitude` without calling `getInstance()`.
{% code-group %}
```javascript amplitude-js
const sessionId = Date.now();
amplitude.getInstance().setSessionId(sessionId);
```
```typescript @amplitude/analytics-browser@2+
const sessionId = Date.now();
amplitude.setSessionId(sessionId);
```
{% /code-group %}
### clearUserProperties()
Browser SDK 2.0 removes the `clearUserProperties` API. Use the unified `identify` API to remove user properties.
{% code-group %}
```javascript amplitude-js
amplitude.getInstance().clearUserProperties();
```
```typescript @amplitude/analytics-browser@2+
amplitude.identify(new amplitude.Identify().identify.clearAll());
```
{% /code-group %}
### setUserProperties()
Browser SDK 2.0 removes the `setUserProperties` API. Use the unified `identify` API to add user properties.
{% code-group %}
```javascript amplitude-js
amplitude.getInstance().setUserProperties({
membership, "paid",
payment, "bank",
})
```
```typescript @amplitude/analytics-browser@2+
const identify = new amplitude.Identify();
identify.set("membership", "paid").set("payment", "bank");
amplitude.identify(identify);
```
{% /code-group %}
### identify()
Make an identify call on `amplitude` without calling `getInstance()`.
{% code-group %}
```javascript amplitude-js
const identify = new amplitude.Identify();
identify.set("membership", "paid");
amplitude.getInstance().identify(identify);
```
```typescript @amplitude/analytics-browser@2+
const identify = new amplitude.Identify();
identify.set("membership", "paid");
amplitude.identify(identify);
```
{% /code-group %}
## Set group properties
### groupIdentify()
Make an identify call on `amplitude` without calling `getInstance()`.
{% code-group %}
```javascript amplitude-js
const identify = new amplitude.Identify();
identify.set("membership", "paid");
amplitude.getInstance().groupIdentify(identify);
```
```typescript @amplitude/analytics-browser@2+
const identify = new amplitude.Identify();
identify.set("membership", "paid");
amplitude.groupIdentify(identify);
```
{% /code-group %}
## Track revenue
### logRevenueV2()
Track revenue using `revenue()` API on `amplitude` without calling `getInstance()`.
{% code-group %}
```javascript amplitude-js
const revenue = new amplitude.Revenue();
revenue.setProductId("productId").setPrice(10);
amplitude.getInstance().logRevenueV2(revenue);
```
```typescript @amplitude/analytics-browser@2+
const revenue = new amplitude.Revenue();
revenue.setProductId("productId").setPrice(10);
amplitude.revenue(revenue);
```
{% /code-group %}
## Patterns
### Plugins
In `amplitude-js`, the configs `config.language`, `config.library`, and `config.platform` let you modify event payloads for these specific fields. Although `@amplitude/analytics-browser@2+` doesn't support these configurations, you can add plugins to the new Browser SDK to enrich event payloads.
```ts
import {
BrowserConfig,
EnrichmentPlugin,
Event,
PluginType,
} from "@amplitude/analytics-types";
export class LibraryModifierPlugin implements EnrichmentPlugin {
name = "library-modifier";
type = PluginType.ENRICHMENT as const;
/**
* setup() is called on plugin installation
* example: client.add(new LibraryModifierPlugin());
*/
setup(config: BrowserConfig): Promise {
this.config = config;
}
/**
* execute() is called on each event instrumented
* example: client.track('New Event');
*/
execute(event: Event): Promise {
event.library = "my-library-name/1.0.0";
return Promise.resolve(event);
}
}
```
To install your custom plugin, use `add()` with your custom plugin as a parameter.
```typescript
import * as amplitude from "@amplitude/analytics-browser";
amplitude.add(new LibraryModifierPlugin());
amplitude.init(API_KEY, OPTIONAL_USER_ID);
```
### Defer initialization
To defer initialization in `amplitude-js`, call `init` with `config.deferInitialization` set to `true`, then call `enableTracking()` to formalize initialization and send all enqueued events.
{% tabs tabs="amplitude-js, @amplitude/analytics-browser@2+" %}
{% tab name="amplitude-js" %}
```javascript
amplitude.getInstance().init(API_KEY, OPTIONAL_USER_ID, {
deferInitialization: true,
});
amplitude.getInstance().logEvent("Event 1");
amplitude.getInstance().logEvent("Event 2");
amplitude.getInstance().logEvent("Event 3");
amplitude.getInstance().enableTracking();
```
{% /tab %}
{% tab name="@amplitude/analytics-browser@2+" %}
Call `init()` later than `track()`. The SDK processes all `track()` calls after initialization completes.
```typescript
amplitude.track("Event 1");
amplitude.track("Event 2");
amplitude.track("Event 3");
amplitude.init(API_KEY, OPTIONAL_USER_ID);
```
{% /tab %}
{% /tabs %}
### Web attribution
In `amplitude-js`, enable web attribution through the following configurations:
- `config.includeGclid`.
- `config.includeFbclid`.
- `config.includeReferrer`.
- `config.includeUtm`.
In `@amplitude/analytics-browser@2+`, the single configuration `config.autocapture.attribution` controls web attribution. The default setting is `true`, and it captures all campaign parameters. These are the same campaign parameters that `amplitude-js` supports.
### Flush or onExitPage
Sometimes you need to send events immediately, such as when a user navigates away from a page. Immediate sending is common when you track button clicks that direct the user to another page while sending event payloads in batches.
In `amplitude-js`, use the `onExitPage()` callback.
{% tabs tabs="amplitude-js, @amplitude/analytics-browser@2+" %}
{% tab name="amplitude-js" %}
```javascript
amplitude.getInstance().init(API_KEY, OPTIONAL_USER_ID, {
onExitPage: () => {
amplitude.sendEvents();
},
});
```
{% /tab %}
{% tab name="@amplitude/analytics-browser@2+" %}
Add your own event listener for the `pagehide` event.
```javascript
window.addEventListener("pagehide", () => {
// Set https transport to use sendBeacon API
amplitude.setTransport("beacon");
// Send all pending events to server
amplitude.flush();
});
```
{% /tab %}
{% /tabs %}
### Callback
`amplitude-js` accepts one `init` callback function to run after initialization, plus two separate callback functions for success and error network requests. Because `@amplitude/analytics-browser@2+` supports promises and async/await, asynchronous methods like `init()`, `track()`, `identify()`, and `groupIdentify()` return a custom promise interface.
```javascript
const initResult = await amplitude.init("YOUR_API_KEY").promise;
if (initResult.code === 200) {
// success logic
} else {
// error logic
}
const result = await amplitude.track("Button Clicked").promise;
if (result.code === 200) {
// success logic
} else {
// error logic
}
```
================================================================================
# Browser SDK 1
URL: https://amplitude.com/docs/sdks/analytics/browser/browser-sdk-1
================================================================================
# Browser SDK 1
The Browser SDK lets you send events to Amplitude.
{% callout type="note" title="Browser SDK 2.0 now available" %}
An improved version of Amplitude Browser SDK is now available. Amplitude [Browser SDK 2.0](https://amplitude.com/docs/sdks/analytics/browser/browser-sdk-2) features default event tracking, improved marketing attribution tracking, a simplified interface, and a lighter-weight package. Amplitude recommends Browser SDK 2.0 for both product analytics and marketing analytics use cases. Upgrade to the latest Browser SDK 2.0. For more information, refer to the [Migration Guide](https://amplitude.com/docs/sdks/analytics/browser/migrate-from-browser-sdk-1-0-to-2-0).
{% /callout %}
## Initialize the SDK
{% callout type="note" heading="Sending events" %}
This SDK uses the [HTTP V2](https://amplitude.com/docs/apis/analytics/http-v2) API and follows the same constraints for events. Make sure all events logged in the SDK include the `event_type` field and at least one of `deviceId` (included by default) or `userId`, and follow the HTTP API's constraints on each field.
To prevent instrumentation issues, device IDs and user IDs must be strings of 5 characters or more. If an event contains a device ID or user ID that's too short, Amplitude removes the ID value from the event. If the event doesn't have a `userId` or `deviceId` value, Amplitude may reject the upload with a 400 status. Override the default minimum length of 5 characters by setting the `minIdLength` config option.
{% /callout %}
Initialize the SDK before you instrument any events. Your Amplitude project's API key is required. You can pass an optional user ID and config object in this call. After initialization, you can use the SDK anywhere in an application.
```ts
// Option 1, initialize with API_KEY only
amplitude.init(API_KEY);
// Option 2, initialize with user ID if it's already known
amplitude.init(API_KEY, "user@amplitude.com");
// Option 3, initialize with configuration
amplitude.init(API_KEY, "user@amplitude.com", options);
```
## Configure the SDK
{% accordion title="Configuration options" %}
| Name | Description | Default Value |
| --- | --- | --- |
|`instanceName`| `string`. The instance name. | `$default_instance` |
|`flushIntervalMillis`| `number`. Sets the interval for uploading events to Amplitude, in milliseconds. | 1,000 (1 second) |
|`flushQueueSize`| `number`. Sets the maximum number of events batched in a single upload attempt. | 30 events |
|`flushMaxRetries`| `number`. Sets the maximum number of retries for failed upload attempts. Applies only to errors that can be retried. | 5 times.|
|`logLevel` | `LogLevel.None` or `LogLevel.Error` or `LogLevel.Warn` or `LogLevel.Verbose` or `LogLevel.Debug`. Sets the log level. | `LogLevel.Warn` |
|`loggerProvider `| `Logger`. Sets a custom `loggerProvider` class from the Logger to emit log messages to your chosen destination. | `Amplitude Logger` |
|`minIdLength`| `number`. Sets the minimum length for the value of `userId` and `deviceId` properties. | `5` |
|`optOut` | `boolean`. Sets permission to track events. A value of `true` prevents Amplitude from tracking and uploading events. | `false` |
|`serverUrl`| `string`. Sets the URL that Amplitude uploads events to. | `https://api2.amplitude.com/2/httpapi` |
|`serverZone`| `EU` or `US`. Sets the Amplitude server zone. Set this to `EU` for Amplitude projects created in the `EU` data center. | `US` |
|`useBatch`| `boolean`. Sets whether to upload events to the Batch API instead of the default HTTP V2 API. | `false` |
|`appVersion` | `string`. Sets an app version for tracked events. This can be the version of your application. For example: "1.0.0". | `undefined` |
|`deviceId` | `string`. Sets an identifier for the device running your application. | `UUID()` |
|`cookieExpiration` | `number`. Sets expiration of cookies created in days. | 365 days |
|`cookieSameSite` | `string`. Sets `SameSite` property of cookies created. | `Lax` |
|`cookieSecure` | `boolean`. Sets `Secure` property of cookies created. | `false` |
|`cookieStorage` | `Storage`. Sets a custom implementation of `Storage` to persist user identity. | `MemoryStorage` |
|`cookieUpgrade`| `boolean`. Sets upgrading from cookies created by the [maintenance Browser SDK](https://amplitude.com/docs/sdks/analytics/browser/javascript-sdk). If true, the new Browser SDK deletes cookies created by the maintenance Browser SDK. If false, the Browser SDK keeps cookies created by the maintenance Browser SDK. | `true` |
|`disableCookies`| `boolean`. Sets permission to use cookies. If the value is `true`, the SDK uses the localStorage API to persist user identity. | Cookies are enabled by default. |
|`domain` | `string`. Sets the domain property of cookies created. | `undefined` |
|`partnerId` | `string`. Sets partner ID. Amplitude requires the customer who built an event ingestion integration to add the partner identifier to `partner_id`. | `undefined` |
|`sessionTimeout` | `number`. Sets the period of inactivity, in milliseconds, from the last tracked event before a session expires. | 1,800,000 milliseconds (30 minutes) |
|`userId` | `number`. Sets an identifier for the tracked user. Must have a minimum length of 5 characters unless overridden with the `minIdLength` option. | `undefined` |
|`trackingOptions`| `TrackingOptions`. Configures tracking of more properties. For more information, refer to the `Optional tracking` section. | Enable all tracking options by default. |
{% /accordion %}
Along with the basic configuration options, you can configure attribution.
{% accordion title="Attribution options" %}
| Name | Description| Default Value|
|---|----|---|
|`config.attribution.disabled`| `boolean`. Whether to disable attribution tracking. | `false` |
|`config.attribution.excludeReferrers`| `string[]`. Excludes attribution tracking for the provided referrers string. | Includes all referrers by default. |
|`config.attribution.initialEmptyValue`| `string`. Customize the initial empty value for attribution-related user properties to any string value. | `EMPTY` |
|`config.attribution.resetSessionOnNewCampaign`| `boolean`. Whether to reset user sessions when Amplitude detects a new campaign. | `false` |
|`config.attribution.trackNewCampaigns`| `boolean`. Whether to track new campaigns on the current session. | `false` |
|`config.attribution.trackPageViews`| `boolean`. Whether to track page view on attribution. Note that `config.defaultTracking.pageViews` has higher priority than this configuration. For more information, refer to [Advanced configuration for tracking page views](#advanced-configuration-for-tracking-page-views). | `false` |
{% /accordion %}
### Configure batching behavior
To support high-performance environments, the SDK sends events in batches. The `track` method queues every logged event in memory. The SDK flushes events in batches in the background. Customize batch behavior with `flushQueueSize` and `flushIntervalMillis`. By default, the `serverUrl` is `https://api2.amplitude.com/2/httpapi`. To send large batches of data at a time, set `useBatch` to `true` to set `setServerUrl` to the batch event upload API `https://api2.amplitude.com/batch`. Both regular mode and batch mode use the same event upload threshold and flush time intervals.
```ts
amplitude.init(API_KEY, OPTIONAL_USER_ID, {
// Events queued in memory will flush when number of events exceed upload threshold
// Default value is 30
flushQueueSize: 50,
// Events queue will flush every certain milliseconds based on setting
// Default value is 10000 milliseconds
flushIntervalMillis: 20000,
// Using batch mode with batch API endpoint, `https://api2.amplitude.com/batch`
useBatch: true,
});
```
### EU data residency
Configure the server zone when you initialize the client to send data to Amplitude's EU servers. The SDK sends data based on the server zone if it's set.
{% callout type="note" title="" %}
For EU data residency, create your project in and use an API key from Amplitude EU.
{% /callout %}
```ts
amplitude.init(API_KEY, OPTIONAL_USER_ID, {
serverZone: "EU",
});
```
### Debugging
Control the level of logs the SDK prints to the console with the following `logLevel` settings:
| Log level | Description |
| --------- | ------------------------------------------------------------------------------------------------------------------------------------------------------------ |
| `none` | Suppresses all log messages. |
| `error` | Shows error messages only. |
| `warn` | Default. Shows error and warning messages. |
| `verbose` | Shows informative messages. |
| `debug` | Shows all messages, including function context information for each public method the SDK invokes. Amplitude recommends this log level for development only. |
Set the `logLevel` parameter.
```ts
amplitude.init(AMPLITUDE_API_KEY, OPTIONAL_USER_ID, {
logLevel: amplitude.Types.LogLevel.Warn,
});
```
The default logger outputs logs to the developer console. You can provide your own logger implementation based on the `Logger` interface for customization. For example, collecting any error messages from the SDK in a production environment.
Set the logger by configuring the `loggerProvider` with your own implementation.
```ts
amplitude.init(AMPLITUDE_API_KEY, OPTIONAL_USER_ID, {
loggerProvider: new MyLogger(),
});
```
#### Debug mode
Enable the debug mode by setting the `logLevel` to "Debug", for example:
```ts
amplitude.init(AMPLITUDE_API_KEY, OPTIONAL_USER_ID, {
logLevel: amplitude.Types.LogLevel.Debug,
});
```
With the default logger, the SDK outputs extra function context information to the developer console when you invoke any SDK public method, including:
- `type`: Category of this context, for example "invoke public method".
- `name`: Name of the invoked function, for example "track".
- `args`: Arguments of the invoked function.
- `stacktrace`: Stacktrace of the invoked function.
- `time`: Start and end timestamp of the function invocation.
- `states`: Useful internal states snapshot before and after the function invocation.
## Track an event
Events represent how users interact with your application. For example, "Button Clicked" might be an action you want to track.
```ts
// Track a basic event
amplitude.track("Button Clicked");
// Track events with optional properties
const eventProperties = {
buttonColor: "primary",
};
amplitude.track("Button Clicked", eventProperties);
```
You can also pass a `BaseEvent` object to `track`. For all available fields, refer to the [BaseEvent](https://amplitude.github.io/Amplitude-TypeScript/interfaces/_amplitude_analytics_browser.Types.BaseEvent.html) interface.
```ts
const event_properties = {
buttonColor: "primary",
};
const event = {
event_type: "Button Clicked",
event_properties,
groups: { role: "engineering" },
group_properties: { groupPropertyKey: "groupPropertyValue" },
};
amplitude.track(event);
```
## Track events to multiple projects
By default, Amplitude SDKs send data to one Amplitude project. To send data to more than one project, add an instance of the Amplitude SDK for each project that should receive data. Then, pass instance variables wherever you call Amplitude. Each instance supports independent `apiKey`, `userId`, `deviceId`, and `settings` values.
```ts
const defaultInstance = amplitude.createInstance();
defaultInstance.init(API_KEY_DEFAULT);
const envInstance = amplitude.createInstance();
envInstance.init(API_KEY_ENV, {
instanceName: "env",
});
```
## Track default events
Starting in SDK version 1.9.1, the Browser SDK tracks default events, and adds a configuration to control the collection of default events. Browser SDK tracks the following default events:
- Page views.
- Sessions.
- Form interactions.
- File downloads.
- **`config.defaultTracking.pageViews`**
- **Value**: Optional. `boolean`.
- **Description**:
- Enables default page view tracking. If the value is `true`, Amplitude tracks page view events on initialization. Default value is `false`.
- Tracked event properties include: `[Amplitude] Page Domain`, `[Amplitude] Page Location`, `[Amplitude] Page Path`, `[Amplitude] Page Title`, `[Amplitude] Page URL`.
- For more information, refer to [Track page views](#track-page-views).
- **`config.defaultTracking.sessions`**
- **Value**: Optional. `boolean`.
- **Description**:
- Enables session tracking. If the value is `true`, Amplitude tracks session start and session end events. Default value is `false`.
- For more information, refer to [Track sessions](#track-sessions).
- **`config.defaultTracking.formInteractions`**
- **Value**: Optional. `boolean`.
- **Description**:
- Enables form interaction tracking. If the value is `true`, Amplitude tracks form start and form submit events. Default value is `false`.
- Tracked event properties include: `[Amplitude] Form ID`, `[Amplitude] Form Name`, `[Amplitude] Form Destination`.
- For more information, refer to [Track form interactions](#track-form-interactions).
- **`config.defaultTracking.fileDownloads`**
- **Value**: Optional. `boolean`.
- **Description**:
- Enables file download tracking. If the value is `true`, Amplitude tracks file download events. Default value is `false`.
- Tracked event properties include: `[Amplitude] File Extension`, `[Amplitude] File Name`, `[Amplitude] Link ID`, `[Amplitude] Link Text`, `[Amplitude] Link URL`.
- For more information, refer to [Track file downloads](#track-file-downloads).
Use the following code sample to start tracking all default events. Or, omit the configuration to keep default events disabled.
```ts
amplitude.init(API_KEY, OPTIONAL_USER_ID, {
defaultTracking: {
pageViews: true,
sessions: true,
formInteractions: true,
fileDownloads: true,
},
});
```
To track all default events, you can also set `config.defaultTracking` to `true`. This setting enables the SDK to track any new default events that Amplitude may add.
```ts
amplitude.init(API_KEY, OPTIONAL_USER_ID, {
defaultTracking: true,
});
```
### Track page views
When you set `config.defaultTracking.pageViews` to true, Amplitude uses default page view tracking behavior. This setting sends a page view event on initialization, which appears in Amplitude as `[Amplitude] Page Viewed`.
```ts
amplitude.init(API_KEY, OPTIONAL_USER_ID, {
defaultTracking: {
pageViews: true,
},
});
```
{% callout type="note" title="Page view event configuration priority" %}
Both `config.defaultTracking.pageViews` and `config.attribution.trackPageViews` configure whether to enable page view tracking, especially when you use the web attribution plugin. The `config.defaultTracking.pageViews` setting has higher priority than `config.attribution.trackPageViews`, which means `config.defaultTracking.pageViews` overrides the attribution page view event setting. When `config.attribution.trackPageViews` is enabled, the SDK tracks page view events only when attribution changes. When `config.defaultTracking.pageViews` is enabled, the SDK tracks page view events when the page changes.
{% /callout %}
#### Advanced configuration for tracking page views
Use advanced configuration for better control of when the SDK sends page view events.
- **`config.defaultTracking.pageViews.trackOn`**
- **Value**: Optional. `"attribution"` or `() => boolean`.
- **Description**:
- Provides advanced control over when the SDK tracks page view events.
- Omit or set the value to `undefined` to track page view events on initialization.
- Set the value to `"attribution"` to track page view events only when Amplitude tracks web attribution.
- Set the value to a function that returns a boolean (`true` or `false`) to track page view events based on your criteria.
- **`config.defaultTracking.pageViews.trackHistoryChanges`**
- **Value**: Optional. `"pathOnly"` or `"all"`.
- **Description**:
- Provides advanced control for single-page applications over when the SDK tracks page views.
- Omit or set the value to `"all"` to track page view events on any URL navigation change within your single-page application. For example: navigating from `https://amplitude.com/#company` to `https://amplitude.com/#blog`.
- Set the value to `"pathOnly"` to track page view events on URL path navigation changes only within your single-page application. For example: navigating from `https://amplitude.com/company` to `https://amplitude.com/blog`.
- **`config.defaultTracking.pageViews.eventType`**
- **Value**: Optional. `string`.
- **Description**: Customize the `event_type` for the page view event.
For example, you can configure Amplitude to track page views only when the URL path contains a certain substring, for example `home`.
```ts
amplitude.init(API_KEY, OPTIONAL_USER_ID, {
defaultTracking: {
pageViews: {
trackOn: () => {
return window.location.pathname.includes("home");
},
},
},
});
```
Amplitude tracks the following information with page view events.
| Name | Description | Default Value |
| -------------------------------------------- | ------------------------------------------------------------------------------------------------------------------------------------------------------ | --------------------------------------------- |
| `event_type` | `string`. The event type for page view event. Configurable through `defaultTracking.pageViews.eventType` or enrichment plugin. | `[Amplitude] Page Viewed` from version 1.9.1. |
| `event_properties.[Amplitude] Page Domain` | `string`. The page domain. | location.hostname or ''. |
| `event_properties.[Amplitude] Page Location` | `string`. The page location. | location.href or ''. |
| `event_properties.[Amplitude] Page Path` | `string`. The page path. | location.path or ''. |
| `event_properties.[Amplitude] Page Title` | `string`. The page title. | document.title or ''. |
| `event_properties.[Amplitude] Page URL` | `string`. The value of page URL. | location.href.split('?')[0] or ''. |
| `event_properties.${CampaignParam}` | `string`. The value of `UTMParameters`, `ReferrerParameters`, or `ClickIdParameters`, if any. For possible keys, refer to [Track default events](#track-default-events). | Any undefined `campaignParam` or `undefined`. |
For an example of how to enrich default page view events, such as adding more properties along with page view tracking, refer to [this example](https://github.com/amplitude/Amplitude-TypeScript/blob/main/examples/plugins/page-view-tracking-enrichment/index.ts).
### Track sessions
Set `config.defaultTracking.sessions` to `true` to enable Amplitude to track sessions.
```ts
amplitude.init(API_KEY, OPTIONAL_USER_ID, {
defaultTracking: {
sessions: true,
},
});
```
A session is the period of time a user has your website open. For more information, refer to [How Amplitude defines sessions](https://amplitude.com/docs/data/sources/instrument-track-sessions). When a new session starts, Amplitude tracks a session start event as the first event of the session. The event type for session start is `[Amplitude] Start Session`. When an existing session ends, Amplitude tracks `[Amplitude] End Sessions`, which is the last event of the session.
### Track form interactions
Set `config.defaultTracking.formInteractions` to `true` to enable Amplitude to track form interactions.
```ts
amplitude.init(API_KEY, OPTIONAL_USER_ID, {
defaultTracking: {
formInteractions: true,
},
});
```
Amplitude tracks `[Amplitude] Form Started` when the user initially interacts with the form. An initial interaction can be the first change to a text input, radio button, or dropdown.
Amplitude tracks `[Amplitude] Form Submitted` when the user submits the form. If the user submits a form with no initial change to any form fields, Amplitude sends both `[Amplitude] Form Started` and `[Amplitude] Form Submitted` events.
Amplitude can track forms built with `
```
### Track file downloads
Set `config.defaultTracking.fileDownloads` to `true` to enable Amplitude to track file downloads.
```ts
amplitude.init(API_KEY, OPTIONAL_USER_ID, {
defaultTracking: {
fileDownloads: true,
},
});
```
Amplitude tracks a file download event when a user clicks an anchor or `` tag linked to a file. The event type for file download is `[Amplitude] File Downloaded`. Amplitude determines that the anchor or `` tag links to a file if the file extension matches the following regex:
`pdf|xlsx?|docx?|txt|rtf|csv|exe|key|pp(s|t|tx)|7z|pkg|rar|gz|zip|avi|mov|mp4|mpe?g|wmv|midi?|mp3|wav|wma`
## User properties
User properties are details such as device details, user preferences, or language that help you understand your users at the time they performed an action in your app.
Use Identify to set the user properties of a particular user without sending an event. The SDK supports the operations `set`, `setOnce`, `unset`, `add`, `append`, `prepend`, `preInsert`, `postInsert`, and `remove` on individual user properties. Declare the operations through the provided Identify interface. You can chain multiple operations in a single Identify object. Pass the Identify object to the Amplitude client to send to the server.
{% callout type="note" title="" %}
If you send the Identify call after the event, the results of operations appear immediately in the dashboard user's profile area. However, results don't appear in chart results until you send another event after the Identify call. The Identify call only affects events going forward.
{% /callout %}
### Set a user property
The Identify object provides controls over setting user properties. First, instantiate an Identify object, then call Identify methods on it. Finally, the client can make a call with the Identify object.
```ts
const identifyEvent = new amplitude.Identify();
amplitude.identify(identifyEvent);
```
### Identify.set
This method sets the value of a user property. For example, you can set a role property of a user.
```ts
const identifyEvent = new amplitude.Identify();
identifyEvent.set("location", "LAX");
amplitude.identify(identifyEvent);
```
### Identify.setOnce
This method sets the value of a user property only one time. The SDK ignores subsequent calls using `setOnce()`. For example, you can set an initial login method for a user. Because only the initial value is tracked, `setOnce()` ignores later calls.
```ts
const identifyEvent = new amplitude.Identify();
identifyEvent.setOnce("initial-location", "SFO");
identify(identifyEvent);
```
### Identify.add
This method increments a user property by some numerical value. If the user property doesn't have a value set yet, the SDK initializes the property to 0 before incrementing it. For example, you can track a user's travel count.
```ts
const identifyEvent = new amplitude.Identify();
identifyEvent.add("travel-count", 1);
amplitude.identify(identifyEvent);
```
### Arrays in user properties
You can use arrays as user properties. Directly set arrays or use `prepend`, `append`, `preInsert` and `postInsert` to generate an array.
### Identify.prepend
This method prepends a value or values to a user property array. If the user property doesn't have a value set yet, the SDK initializes the property to an empty list before prepending the new values.
```ts
const identifyEvent = new Identify();
identifyEvent.prepend("visited-locations", "LAX");
identify(identifyEvent);
```
### Identify.append
This method appends a value or values to a user property array. If the user property doesn't have a value set yet, the SDK initializes the property to an empty list before appending the new values.
```ts
const identifyEvent = new amplitude.Identify();
identifyEvent.append("visited-locations", "SFO");
amplitude.identify(identifyEvent);
```
### Identify.preInsert
This method pre-inserts a value or values to a user property if the value doesn't exist in the user property yet. Pre-insert means inserting the values at the beginning of a given list. If the user property doesn't have a value set yet, the SDK initializes the property to an empty list before pre-inserting the new values. If the user property has an existing value, this method is a no-op.
```ts
const identifyEvent = new amplitude.Identify();
identifyEvent.preInsert("unique-locations", "LAX");
identify(identifyEvent);
```
### Identify.postInsert
This method post-inserts a value or values to a user property if the value doesn't exist in the user property yet. Post-insert means inserting the values at the end of a given list. If the user property doesn't have a value set yet, the SDK initializes the property to an empty list before post-inserting the new values. If the user property has an existing value, this method is a no-op.
```ts
const identifyEvent = new amplitude.Identify();
identifyEvent.postInsert("unique-locations", "SFO");
amplitude.identify(identifyEvent);
```
### Identify.remove
This method removes a value or values from a user property if the value exists in the user property. Remove means removing the existing values from the given list. If the user property doesn't have an existing value, this method is a no-op.
```ts
const identifyEvent = new amplitude.Identify();
identifyEvent.remove("unique-locations", "JFK");
amplitude.identify(identifyEvent);
```
## User groups
Amplitude supports assigning users to groups and performing queries, such as Count by Distinct, on those groups. If at least one member of the group has performed the specific event, then the count includes the group.
For example, you want to group your users based on what organization they're in by using an 'orgId'. Joe is in 'orgId' '10', and Sue is in 'orgId' '15'. Sue and Joe both perform a certain event. You can query their organizations in the Event Segmentation Chart.
When setting groups, define a `groupType` and `groupName`. In the previous example, 'orgId' is the `groupType`, and '10' and '15' are the values for `groupName`. Another example of a `groupType` could be 'sport', with `groupName` values like 'tennis' and 'baseball'.
Setting a group also sets the `groupType:groupName` as a user property, and overwrites any existing `groupName` value set for that user's `groupType` and the corresponding user property value. `groupType` is a string, and `groupName` can be either a string or an array of strings to indicate that a user is in multiple groups.
{% callout type="example" title="" %}
If Joe is in 'orgId' '15', then the `groupName` would be '15'.
```ts
// set group with a single group name
amplitude.setGroup("orgId", "15");
```
If Joe is in 'sport' 'soccer' and 'tennis', then the `groupName` would be '["tennis", "soccer"]'.
```ts
// set group with multiple group names
amplitude.setGroup("sport", ["soccer", "tennis"]);
```
{% /callout %}
You can also set event-level groups by passing an `Event` Object with `groups` to `track`. With event-level groups, the group designation applies only to the specific logged event, and doesn't persist on the user unless you explicitly set it with `setGroup`.
```ts
amplitude.track({
event_type: "event type",
event_properties: { eventPropertyKey: "event property value" },
groups: { orgId: "15" },
});
```
## Track revenue
The preferred method of tracking revenue for a user is to use `revenue()` with the provided Revenue interface. Revenue instances store each revenue transaction and let you define several special revenue properties (such as 'revenueType' and 'productIdentifier') that Amplitude's Event Segmentation and Revenue LTV charts use. Pass these Revenue instance objects into `revenue()` to send as revenue events to Amplitude. This method automatically displays revenue-relevant data in the platform. Use this method to track both in-app and non-in-app purchases.
To track revenue from a user, call revenue each time a user generates revenue. In this example, the user purchased three units of a product at $3.99.
```ts
const event = new amplitude.Revenue()
.setProductId("com.company.productId")
.setPrice(3.99)
.setQuantity(3);
amplitude.revenue(event);
```
### Revenue interface
| Name | Description | Default Value |
| -------------- | ----------------------------------------------------------------------------------------------------------------------- | ------------- |
| `product_id` | Optional. `string`. An identifier for the product. Amplitude recommends something like the Google Play Store product ID. | Empty string. |
| `quantity` | Required. `number`. The quantity of products purchased. Note: revenue = quantity \* price. | `1` |
| `price` | Required. `number`. The price of the products purchased, and this can be negative. Note: revenue = quantity \* price. | `null` |
| `revenue_type` | Optional, but required for revenue verification. `string`. The revenue type (for example, tax, refund, income). | `null` |
| `receipt` | Optional. `string`. The receipt identifier of the revenue. | `null` |
| `receipt_sig` | Optional, but required for revenue verification. `string`. The receipt signature of the revenue. | `null` |
| `properties` | Optional. `{ [key: string]: any }`. An object of event properties to include in the revenue event. | `null` |
## Flush the event buffer
The `flush` method triggers the client to send buffered events immediately.
```ts
amplitude.flush();
```
By default, the SDK calls `flush` automatically on an interval. To flush the events altogether, control the async flow with the optional Promise interface, for example:
```ts
amplitude.init(API_KEY).promise.then(function () {
amplitude.track("Button Clicked");
amplitude.flush();
});
```
## Custom user ID
If your app has its own login system that you want to track users with, you can call `setUserId` at any time.
```ts
amplitude.setUserId("user@amplitude.com");
```
You can also assign the User ID as an argument to the init call.
```ts
amplitude.init(API_KEY, "user@amplitude.com");
```
## Custom session ID
You can assign a new Session ID using `setSessionId`. When setting a custom session ID, make sure the value is in milliseconds since epoch (Unix Timestamp).
```ts
amplitude.setSessionId(Date.now());
```
## Custom device ID
You can assign a new device ID using `deviceId`. When setting a custom device ID, make sure the value is sufficiently unique. Amplitude recommends using a UUID.
```ts
amplitude.setDeviceId(uuid());
```
## Reset when a user logs out
`reset` is a shortcut to anonymize users after they log out, by:
- Setting `userId` to `undefined`.
- Setting `deviceId` to a new UUID value.
With an undefined `userId` and a completely new `deviceId`, the current user appears as a brand new user in the dashboard.
```ts
amplitude.reset();
```
## Opt users out of tracking
You can turn off logging for a given user by setting `setOptOut` to `true`.
```ts
amplitude.setOptOut(true);
```
Amplitude doesn't save or send events to the server while `setOptOut` is enabled, and the setting persists across page loads.
Re-enable logging by setting `setOptOut` to `false`.
```ts
amplitude.setOptOut(false);
```
## Optional tracking
By default, the SDK tracks these properties automatically. You can override this behavior by passing a configuration called `trackingOptions` when initializing the SDK, setting the appropriate options to false.
| Tracking Options | Default |
| -------------------- | ------- |
| `deviceManufacturer` | `true` |
| `deviceModel` | `true` |
| `ipAddress` | `true` |
| `language` | `true` |
| `osName` | `true` |
| `osVersion` | `true` |
| `platform` | `true` |
```ts
amplitude.init(API_KEY, OPTIONAL_USER_ID, {
trackingOptions: {
deviceManufacturer: false,
deviceModel: false,
ipAddress: false,
language: false,
osName: false,
osVersion: false,
platform: false,
},
});
```
## Callback
You can optionally await all asynchronous APIs through a Promise interface. The Promise interface also serves as a callback interface.
{% code-group %}
```ts Promise
amplitude.init("apikey", "12321.com").promise.then(function () {
// init callback
});
amplitude.track("Button Clicked").promise.then(function (result) {
result.event; // {...} (The final event object sent to Amplitude)
result.code; // 200 (The HTTP response status code of the request.
result.message; // "Event tracked successfully" (The response message)
});
```
```ts async/await
// Using async/await
const initResult = await amplitude.init("apikey", "12321.com").promise;
const results = await amplitude.track("Button Clicked").promise;
result.event; // {...} (The final event object sent to Amplitude)
result.code; // 200 (The HTTP response status code of the request.
result.message; // "Event tracked successfully" (The response message)
```
{% /code-group %}
## Plugins
Plugins let you extend the Amplitude SDK's behavior by, for example, modifying event properties (enrichment type) or sending to third-party APIs (destination type). A plugin is an object with methods `setup()` and `execute()`.
### `add`
The `add` method adds a plugin to Amplitude. Plugins can help process and send events.
```ts
amplitude.add(new Plugin());
```
### `remove`
The `remove` method removes the given plugin name from the client instance if it exists.
```ts
amplitude.remove(plugin.name);
```
### Create your custom plugin
#### Plugin.setup
This method contains logic for preparing the plugin for use and takes config as a parameter. The expected return value is undefined. A typical use for this method is to copy configuration from config or instantiate plugin dependencies. The SDK calls this method when you register the plugin to the client through `amplitude.add()`.
#### Plugin.execute
This method contains the logic for processing events and takes event as a parameter. If used as an enrichment type plugin, the expected return value is the modified or enriched event. If used as a destination type plugin, the expected return value is a map with keys: `event` (BaseEvent), `code` (number), and `message` (string). The SDK calls this method for each event instrumented through the client interface, including Identify, GroupIdentify, and Revenue events.
### Plugin examples
#### Destination type plugin
Here's an example of a plugin that sends each instrumented event to a target server URL using your preferred HTTP client.
```ts
function myDestinationPlugin (serverUrl) {
const name = 'my-destination-plugin';
const type = amplitude.Types.PluginType.DESTINATION;
let amplitudeConfig;
/**
* setup() is called on plugin installation
* example: amplitude.add(new myDestinationPlugin());
*/
const setup = function (config) {
amplitudeConfig = config;
}
/**
* execute() is called on each event instrumented
* example: amplitude.track('New Event');
*/
const execute = function (event) {
const payload = {
key: 'secret',
data: event,
};
return fetch(this.serverUrl, {
method: 'POST',
headers: {
'Content-Type': 'application/json',
Accept: '*/*',
},
body: JSON.stringify(payload),
}).then(function(response) {
return {
code: response.status,
event: event,
message: response.statusText,
};
});
}
return {
name,
type,
setup,
execute,
},
}
amplitude.init(API_KEY);
amplitude.add(myDestinationPlugin('https://custom.domain.com'));
```
#### Enrichment type plugin
Here's an example of a plugin that modifies each instrumented event by adding an increment integer to the `event_id` property of an event, starting from 100.
```ts
const addEventIdPlugin = () => {
const name = "add-event-id";
const type = amplitude.Types.PluginType.ENRICHMENT;
let currentId = 100;
let amplitudeConfig;
/**
* setup() is called on plugin installation
* example: amplitude.add(new AddEventIdPlugin());
*/
const setup = function (config) {
amplitudeConfig = config;
};
/**
* execute() is called on each event instrumented
* example: client.track('New Event');
*/
const execute = function (event: Event) {
event.event_id = currentId++;
return event;
};
return {
name,
type,
setup,
execute,
};
};
amplitude.init(API_KEY);
amplitude.add(addEventIdPlugin());
```
#### Web attribution enrichment plugin
Download the `plugin-web-attribution-browser` package and add the `webAttributionPlugin` before you call the `init` method.
{% code-group %}
```bash npm
npm install @amplitude/plugin-web-attribution-browser
```
```bash yarn
yarn add @amplitude/plugin-web-attribution-browser
```
{% /code-group %}
Add the plugin to the Amplitude instance.
```ts
amplitude.add(webAttributionPlugin());
amplitude.init(API_KEY);
```
For configuration details, refer to the [configuration options](https://amplitude.com/docs/sdks/analytics/browser/marketing-analytics-sdk#configuration).
For details on what the [Web Attribution Plugin](https://amplitude.com/docs/sdks/analytics/browser/marketing-analytics-sdk#marketing-attribution) supports, refer to the plugin documentation.
##### Differences from the base SDK
Enabling the Attribution plugin overrides the default attribution tracking behavior of the SDK.
The SDK's built-in attribution tracking only tracks attribution at the start of sessions. This means if a user re-enters the site through a new campaign channel (such as direct or an ad) in the middle of a session, the SDK doesn't record this new channel.
If the `trackNewCampaigns` option is set to `true`, the SDK tracks the campaigns and resets the user's session when it detects a new campaign.
The Attribution plugin tracks all campaigns, regardless of whether the user is at the start of a session.
Set the `resetSessionOnNewCampaign` option to `true` to reset the user's session when Amplitude detects a new campaign. The session doesn't reset when the referrer is a different subdomain of your site.
#### Page view enrichment plugin
Download the `plugin-page-view-tracking-browser` and add `pageViewTrackingPlugin` before calling the init method.
{% code-group %}
```bash npm
npm install @amplitude/plugin-page-view-tracking-browser
```
```bash yarn
yarn add @amplitude/plugin-page-view-tracking-browser
```
{% /code-group %}
Add plugin to the Amplitude instance.
```ts
amplitude.add(pageViewTrackingPlugin());
amplitude.init(API_KEY);
```
For configuration details, refer to the [configuration options](https://amplitude.com/docs/sdks/analytics/browser/marketing-analytics-sdk#configuration).
For details on what the [Page View Plugin](https://amplitude.com/docs/sdks/analytics/browser/marketing-analytics-sdk#page-view) supports, refer to the plugin documentation.
##### Differences from base SDK
The base SDK sends Page View events when Amplitude tracks a user's campaign, if the `attribution.trackPageViews` option is set to `true`.
The page view plugin sends a Page View event on each page a user visits by default. The plugin also offers options to customize this behavior.
## Troubleshooting and debugging
Debugging in a browser can help you identify problems related to your code's implementation, as well as potential issues within the SDKs you use. Here's a basic guide on how to use the browser's built-in Developer Tools (DevTools) for debugging.
### Console
You can find JavaScript errors under *Inspect > Console*, which might have the details about the line of code and file that caused the problem. The console also lets you execute JavaScript code in real time.
- Enable debug mode by following the [debug mode instructions](#debug-mode). Then with the default logger, the SDK outputs extra function context information to the developer console when you invoke any SDK public method, which can be helpful for debugging.
- Amplitude supports SDK deferred initialization. Amplitude dispatches events tracked before initialization after the initialization call. If you can't send events but can send the event successfully after entering `amplitude.init(API_KEY, 'USER_ID')` in the browser console, your `amplitude.init` call might not have been triggered in your codebase, or you aren't using the correct Amplitude instance during initialization.
### Network request
Use the *Inspect > Network* tab to view all network requests made by your page. Search for the Amplitude request.
Check the response code and ensure the response payload is as expected.
### Instrumentation Explorer/Chrome extension
The Amplitude Instrumentation Explorer is an extension available in the Google Chrome Web Store. The extension captures each Amplitude event you trigger and displays it in the extension popup. Ensure that Amplitude sent the event successfully and check the context in the event payload.
For more details, refer to the [event stream analysis guide](https://amplitude.com/docs/analytics/debug-analytics#step-2-analyze-the-event-stream).
## Common issues
The following are common issues specific to Browser SDK. For more general common issues, refer to [SDK Troubleshooting and Debugging](https://amplitude.com/docs/sdks/sdk-debugging).
### Ad Blocker
`Ad Blocker` might cause event dropping. These errors show that `Ad Blocker` has affected tracking. When loading through a script tag, an error may appear in the console or network tab while loading the SDK script. When loaded with the npm package, errors might appear in the network tab when the SDK tries to send events to the server. The errors might vary depending on the browser.
- Chrome (Ubuntu, MacOS)
Console: error net::ERR_BLOCKED_BY_CLIENT
Network: status (blocked:other)
- Firefox (Ubuntu)
Console: error text doesn't contain any blocking-specific info
Network: Transferred column contains the name of plugin Blocked by uBlock Origin
- Safari (MacOS)
Console: error contains text Content Blocker prevented frame ... from loading a resource from ...
Network: blocked requests aren't listed. It's unclear whether the browser can show them.
Amplitude recommends using a proxy server to avoid this situation.
### Cookies related
For details on the [information](#cookie-management) the SDK stores in cookies, refer to the cookie management section. Client behavior, such as disabling cookies or using a private browser, window, or tab, affects the persistence of these saved values in the cookies. If these values aren't persistent or aren't increasing by one, that could be the reason.
### CORS
Cross-Origin Resource Sharing (CORS) is a security measure browsers implement to restrict how resources on a web page can be requested from a different domain. CORS might cause this issue if you used `setServerURL`.
`Access to fetch at 'xxx' from origin 'xxx' has been blocked by CORS policy: Response to preflight request doesn't pass access control check: No 'Access-Control-Allow-Origin' header is present on the requested resource. If an opaque response serves your needs, set the request's mode to 'no-cors' to fetch the resource with CORS disabled.`
Cross-origin resource sharing (CORS) prevents a malicious site from reading another site's data without permission. The error message suggests that the server you're trying to access isn't allowing your origin to access the requested resource. This is due to the lack of the `Access-Control-Allow-Origin` header in the server's response.
- If you have control over the server, you can update the server's CORS policy. Add the `Access-Control-Allow-Origin` header to the server's responses. This would allow your origin to make requests. The value of `Access-Control-Allow-Origin` can be \* to allow all origins, or it can be the specific URL of your web page.
- If you don't have control over the server, you can set up a proxy server that adds the necessary CORS headers. The web page makes requests to the proxy, which then makes requests to the actual server. The proxy adds the `Access-Control-Allow-Origin` header to the response before sending it back to the web page.
If you've set up an API proxy and run into configuration issues related to that on a platform you've selected, that's no longer an SDK issue but an integration issue between your application and the service provider.
### Events fired but no network requests
If you [set the logger to "Debug" level](#debug-mode) and see track calls in the developer console, the SDK has called the `track()` method. If you don't see the corresponding event in Amplitude, the Amplitude Instrumentation Explorer Chrome extension, or the network request tab of the browser, Amplitude didn't receive the event. The SDK sends events and places them in the SDK's internal queue upon a successful `track()` call, but sometimes these queued events may not send successfully. This can happen when an in-progress HTTP request is cancelled. For example, if you close the browser or leave the page.
There are two ways to address this issue:
1. If you use standard network requests, set the transport to `beacon` during initialization, or set the transport to `beacon` on page exit. `sendBeacon` doesn't work in this case because it sends events in the background and doesn't return server responses like `4xx` or `5xx`. As a result, it doesn't retry on failure. `sendBeacon` only sends scheduled requests in the background. For more information, refer to the [sendBeacon section](#use-sendbeacon).
2. To make track() synchronous, [add the `await` keyword](#callback) before the call.
## Advanced topics
### Cross-domain tracking
You can track anonymous behavior across two different domains. Amplitude identifies anonymous users by their device IDs, which must be passed between the domains. For example:
- Site 1: `www.example.com`.
- Site 2: `www.example.org`.
For users who start on Site 1 and then navigate to Site 2, you must pass the device ID generated from Site 1 as a parameter to Site 2. Site 2 then needs to initialize the SDK with the device ID.
The SDK can parse the URL parameter automatically if `deviceId` is in the URL query parameters.
1. From Site 1, get the device ID from `getDeviceId()`.
2. Pass the device ID to Site 2 through a URL parameter when the user navigates. For example: `www.example.com?deviceId=device_id_from_site_1`.
3. Initialize the Amplitude SDK on Site 2 with `init('API_KEY', null)`.
If you don't provide the `deviceId` with `init`, like `init('API_KEY', null, { deviceId: 'custom-device-id' })`, the SDK automatically falls back to using the URL parameter.
### Custom HTTP client
You can provide an implementation of the `Transport` interface to the `transportProvider` configuration option for customization. For example, sending requests to your proxy server with customized HTTP request headers.
```ts
class MyTransport {
send(serverUrl, payload) {
// check example: https://github.com/amplitude/Amplitude-TypeScript/blob/main/packages/analytics-client-common/src/transports/fetch.ts
}
}
amplitude.init(API_KEY, OPTIONAL_USER_ID, {
transportProvider: new MyTransport(),
});
```
### Use sendBeacon
Unlike standard network requests, sendBeacon sends events in the background, even if the user closes the browser or leaves the page.
{% callout type="warning" heading="" %}
`sendBeacon` sends events in the background, which means events dispatched from `sendBeacon` don't return a server response and the SDK can't retry them when they encounter failures like 4xx or 5xx errors. You can address these retry issues by sending one event per request, but this could increase the network load and the likelihood of throttling.
{% /callout %}
#### Set the transport to use sendBeacon for all events
To send an event using `sendBeacon`, set the transport SDK option to 'beacon' in one of two ways:
```ts
amplitude.init(API_KEY, "user@amplitude.com", {
transport: TransportType.SendBeacon,
// To make sure the event will be scheduled right away.
flushIntervalMillis: 0,
flushQueueSize: 1,
});
```
#### Set the transport to use beacon only when exiting page
Amplitude recommends adding your own event listener for `pagehide` event.
```ts
window.addEventListener("pagehide", () => {
amplitude.setTransport("beacon");
// Sets https transport to use `sendBeacon` API
amplitude.flush();
});
```
### Content security policy (CSP)
If your web app configures the strict Content Security Policy (CSP) for security concerns, adjust the policy to allow the Amplitude domains:
- When using the [Script Loader](https://github.com/amplitude/Amplitude-TypeScript/tree/main/packages/analytics-browser#installing-via-script-loader), add `https://*.amplitude.com` to `script-src`.
- Add `https://*.amplitude.com` to `connect-src`.
### Cookie management
The Browser SDK uses cookie storage to persist information that multiple subdomains of the same domain may want to share. This information includes user sessions and marketing campaigns, which the SDK stores in separate cookie entries.
#### Cookie prefix
- `AMP`: The SDK creates user session cookies with `AMP` prefix and the first ten digits of the API key: `AMP_{first_ten_digits_API_KEY}`.
- `AMP_MKTG`: The SDK creates marketing campaign cookies with `AMP_MKTG` and the first ten digits of the API key: `AMP_MKTG_{first_ten_digits_API_KEY}`.
- `AMP_TEST`: On initialization, the SDK creates a cookie with `AMP_TEST` prefix to check whether cookie storage is working properly. The SDK sets the value as the current time, retrieves the cookie by a key, and checks if the retrieved value matches the original set time. You can safely delete the `AMP_TEST` prefix cookies if they aren't successfully deleted for some reason.
- `AMP_TLDTEST`: On initialization, the SDK creates a cookie with `AMP_TLDTEST` prefix to find a subdomain that supports cookie storage. For example, when checking for cookie support on `https://analytics.amplitude.com/amplitude/home`, the SDK first tries to find a subdomain that matches the root domain (`amplitude.com`) and then falls back to the full domain (`analytics.amplitude.com`). You can safely delete the `AMP_TLDTEST` prefix cookies if they aren't successfully deleted for some reason.
#### Cookie domain
By default, the SDK assigns these cookies to the top-level domain that supports cookie storage. Cookies can be shared on multiple subdomains, which provides a consistent user experience across all subdomains.
For example, a user logs into the website on one subdomain (`data.amplitude.com`) where the SDK is initialized. On initialization, the SDK assigns cookies to `.amplitude.com`. If the user then navigates to another subdomain (`analytics.amplitude.com`), shared cookies share the login information.
#### Cookie data
The SDK creates two types of cookies: user session cookies and marketing campaign cookies.
{% accordion title="User session cookies" %}
|Name| Description|
|---|----|
|`optOut`|Required. A flag to opt this device out of Amplitude tracking. If this flag is set, the SDK doesn't store extra information for the user.|
|`userId`|Upon user log-in, if you send this value, the SDK stores it in the cookie. Set this to uniquely identify users (non-anonymous navigation). The SDK stores it encoded using Base64.|
|`deviceId`|A randomly generated string. The device ID persists unless a user clears their browser cookies or browses in private mode. Even if a user consistently uses the same device and browser, the device ID can still vary.|
|`sessionId`|A randomly generated string for each session.|
|`lastEventTime`|Time of the last event. Used to decide when to expire and create a new session ID.|
|`lastEventId`|ID of the last event.|
{% /accordion %}
{% accordion title="Marketing campaign cookies" %}
|Name| Description|
| --- | --- |
|`utm_campaign`| Identifies a specific campaign used (for example, "summer_sale"). |
|`utm_content` | Identifies what brought the user to the site, commonly used for A/B testing (for example, "banner-link", "text-link"). |
|`utm_id`|An optional parameter for tracking unique IDs or transaction IDs associated with the link.|
|`utm_medium`| Identifies a specific campaign used (for example, "summer_sale"). |
|`utm_source`| Identifies which website sent the traffic (for example, Google, Facebook). |
|`utm_term`| Identifies paid search terms used (for example, product+analytics). |
|`referrer`|The last page the user was on (for example, `https://amplitude.com/behavioral-analytics-platform?ref=nav`).|
|`referring_domain`|The domain that the user was last on (for example, `https://amplitude.com`).|
|`dclid`|Google campaign manager Click Identifier.|
|`gbraid`|Google Click Identifier for iOS device from Web to App.|
|`gclid`|Google Click Identifier from URL parameters.|
|`fbclid`|Facebook Click Identifier from URL parameters.|
|`ko_click_id`|Kochava Click Identifier from URL parameters.|
|`msclkid`|Microsoft Click Identifier.|
|`ttclid`|TikTok Click Identifier.|
|`twclid`|Twitter Click Identifier from URL parameter.|
|`wbraid`|Google Click Identifier for iOS device from App to Web.|
|`li_fat_id`|LinkedIn member indirect identifier for Members for conversion tracking, retargeting, analytics.|
|`rdt_cid`|Reddit Click Identifier.|
{% /accordion %}
#### Disable cookies
You can opt-out of using cookies by setting `disableCookies` to `true` so that the SDK uses `LocalStorage` instead. `LocalStorage` is a useful alternative, but because access to `LocalStorage` is restricted by subdomain, you can't track anonymous users across subdomains of your product (for example: `www.amplitude.com` vs `analytics.amplitude.com`).
### Device ID lifecycle
The SDK initializes the device ID in the following order, setting the device ID to the first valid value encountered:
1. Device ID in configuration on initialization.
2. `deviceId` value from URL parameter, for example `http://example.com/?deviceId=123456789`. For more details, refer to [cross domain tracking](#cross-domain-tracking).
3. Device ID in cookie storage. For more details, refer to [cookie management](#cookie-management).
4. Device ID in cookie storage of Browser SDK. For more details, refer to [cookie management](https://amplitude.com/docs/sdks/analytics/browser/browser-sdk-2#cookie-management).
5. A randomly generated 36-character UUID.
#### When does a device ID change
A device ID changes in many scenarios:
{% callout type="note" heading="Amplitude Analytics SDKs share an identity store with Experiment SDKS" %}
`setDeviceId` also updates the identity store to propagate new user info to experiment SDK and trigger a fetch if device ID has changed.
{% /callout %}
- You explicitly call `setDeviceId()`.
- By default, the SDK stores device IDs in cookies, so a device ID changes if a user clears cookies, uses another device, or uses privacy mode.
- On initialization, the URL parameter `deviceId` passes in a device ID.
- You call `reset()`.
#### Custom device ID
You can assign a new device ID using `setDeviceId()`. When setting a custom device ID, make sure the value is sufficiently unique. Amplitude recommends using a UUID.
```ts
amplitude.setDeviceId(uuid());
```
#### Get device ID
You can use the helper method `getDeviceId()` to get the value of the current `deviceId`.
```ts
const deviceId = amplitude.getDeviceId();
```
================================================================================
# Ampli for Browser SDK 1.0
URL: https://amplitude.com/docs/sdks/analytics/browser/ampli-for-browser-sdk-1-0
================================================================================
# Ampli for Browser SDK 1.0
The [Ampli Wrapper](https://amplitude.com/docs/sdks/ampli) is a generated, strongly typed API for tracking Analytics events based on your Tracking Plan in Amplitude Data. The tracking library exposes a function for every event in your team's tracking plan. The function's arguments correspond to the event's properties.
Ampli provides autocompletion for events and properties defined in Data and enforces your event schemas in code to prevent bad instrumentation.
Amplitude Data supports tracking analytics events from browser apps written in JavaScript (ES6 and higher) and TypeScript (2.1 and higher). Ampli packages the generated tracking library as a CJS module.
{% callout type="tip" title="Enable real-time type checking for JavaScript" %}
JavaScript isn't a type-safe language, so static type checking isn't built in like TypeScript. Some common IDEs allow real-time type checks in JavaScript based on JSDoc.
For a better development experience, Ampli generates JSDocs for all methods and classes.
To enable real-time type checking in VSCode for JavaScript:
1. Go to *Preferences > Settings* then search for **checkJs**.
2. Select **JS/TS > Implicit Project Config: Check JS**.
After you activate the setting, type errors appear directly in the IDE.
Jetbrains provides similar support:
1. Go to *Preferences > Editor > Inspections > JavaScript and TypeScript > General*.
2. In **Signature mismatch** and **Type mismatch**, set the **Severity** to Warning or Error based on the level of strictness you want.
{% /callout %}
{% callout type="tip" title="Linting with Prettier" %}
To prevent linting errors for eslint and tslint, the SDK-generated files include the following directives to disable the linters:
`/* tslint:disable */`
`/* eslint-disable */`
Prettier has no corresponding in-code directive. Instead, add the generated `path/to/ampli` to your `.prettierignore` file. You can get the path with `ampli pull`. For more information, refer to the [Prettier documentation](https://prettier.io/docs/en/ignore.html).
{% /callout %}
## Quickstart
1. [(Prerequisite) Create a Tracking Plan in Amplitude Data](https://amplitude.com/docs/data/create-tracking-plan)
Plan your events and properties in [Amplitude Data](https://data.amplitude.com/).
1. [Install the Amplitude SDK](#install-the-amplitude-sdk)
```shell
npm install @amplitude/analytics-browser
```
1. [Install the Ampli CLI](#install-the-ampli-cli)
```shell
npm install -g @amplitude/ampli
```
1. [Pull the Ampli Wrapper into your project](#pull)
```shell
ampli pull [--path ./src/ampli]
```
1. [Initialize the Ampli Wrapper](#load)
```js
import { ampli } from "./src/ampli";
ampli.load({ client: { apiKey: AMPLITUDE_API_KEY } });
```
1. [Identify users and set user properties](#identify)
```js
ampli.identify("user-id", {
userProp: "A trait associated with this user",
});
```
1. [Track events with strongly typed methods and classes](#track)
```js
ampli.songPlayed({ songId: "song-1" });
ampli.track(new SongPlayed({ songId: "song-2" }));
```
1. [Flush events before application exit](#flush)
```js
ampli.flush();
```
1. [Verify implementation status with CLI](#status)
```shell
ampli status [--update]
```
## Install the Amplitude SDK
If you haven't already, install the core Amplitude SDK dependencies.
{% code-group %}
```bash npm
npm install @amplitude/analytics-browser
```
```bash yarn
yarn add @amplitude/analytics-browser
```
{% /code-group %}
{% callout type="note" title="" %}
When you use Ampli in the browser, Amplitude recommends loading `@amplitude/analytics-browser` as a module rather than as a JavaScript snippet.
{% /callout %}
## Install the Ampli CLI
You can install the Ampli CLI from Homebrew or NPM.
{% code-group %}
```bash brew
brew tap amplitude/ampli
brew install ampli
```
```bash npm
npm install -g @amplitude/ampli
```
{% /code-group %}
### Pull the Ampli Wrapper into your project
Run the Ampli CLI `pull` command to log in to Amplitude Data and download the strongly typed Ampli Wrapper for your tracking plan. Run Ampli CLI commands from the project root directory.
```bash
ampli pull
```
## API
Ampli generates a thin facade over the Amplitude SDK that provides convenience methods. The Ampli Wrapper also grants access to every method of the underlying Amplitude SDK through `ampli.client`. For more details, refer to [Wrapping the Amplitude SDK](https://amplitude.com/docs/sdks/ampli#wrapping-the-amplitude-sdk).
### Load
Initialize Ampli in your code. The `load()` function requires an options object to configure the SDK's behavior.
| Option | Type | Required | Description |
|---|---|---|---|
| `disabled` | Boolean | No | Specifies whether the Ampli Wrapper does any work. When `true`, all calls to the Ampli Wrapper are no-ops. Useful in local or development environments. Defaults to `false`. |
| `client.instance` | `AmplitudeClient` | Required if `client.apiKey` isn't set | Specifies an Amplitude instance. By default, Ampli creates an instance for you. |
| `client.apiKey` | String | Required if `client.instance` isn't set | Specifies an API key. This option overrides the default, which is the API key configured in your tracking plan. |
| `client.configuration` | `Amplitude.Config` | No | Overrides the default configuration for the AmplitudeClient. |
Example of initialization with `load` to override the default configuration:
```js
ampli.load({
client: {
apiKey: AMPLITUDE_API_KEY,
configuration: {
minIdLength: 10,
},
},
});
```
### Identify
Call `identify()` to identify a user in your app and associate all future events with their identity, or to set their properties.
The Ampli Wrapper creates types for user properties in the same way it creates types for events and their properties.
The `identify()` function accepts an optional `userId`, optional user properties, and optional `options`.
For example, your tracking plan contains a user property called `role`. The property's type is a string.
```ts
ampli.identify("user-id", {
role: "admin",
});
```
The options argument allows you to pass [Amplitude fields](https://amplitude.com/docs/apis/analytics/http-v2#event-array-keys) for this call, such as `deviceId`.
```ts
ampli.identify(
"user-id",
{
role: "admin",
},
{
deviceId: "my-device-id",
},
);
```
### Group
Call `setGroup()` to associate a user with their group (for example, their department or company). The `setGroup()` function accepts a required `groupType` and `groupName`.
```ts
ampli.client.setGroup("groupType", "groupName");
```
Amplitude supports assigning users to groups and performing queries, such as Count by Distinct, on those groups. If at least one member of the group performs the specific event, the count includes the group.
For example, you want to group your users based on what organization they're in by using an 'orgId'. Joe is in 'orgId' '10', and Sue is in 'orgId' '15'. Sue and Joe both perform a certain event. You can query their organizations in the Event Segmentation Chart.
When you set groups, define a `groupType` and `groupName`. In the previous example, 'orgId' is the `groupType` and '10' and '15' are the values for `groupName`. Another example of a `groupType` is 'sport', with `groupName` values like 'tennis' and 'baseball'.
Setting a group also sets the `groupType:groupName` as a user property, overwrites any existing `groupName` value set for that user's `groupType`, and updates the corresponding user property value. `groupType` is a string. `groupName` can be either a string or an array of strings to show that a user is in multiple groups. For example, if Joe is in 'orgId' '10' and '20', then the `groupName` is '[10, 20]'.
Your code might look like this:
```ts
ampli.client.setGroup("orgId", ["10", "20"]);
```
### Track
To track an event, call the event's corresponding function. Every event in your tracking plan gets its own function in the Ampli Wrapper. The call structure looks like this:
```ts
ampli.eventName(properties: EventNameProperties, options: EventOptions)
```
The `properties` argument passes event properties.
The `options` argument allows you to pass [Amplitude fields](https://amplitude.com/docs/apis/analytics/http-v2#event-array-keys), like `price`, `quantity`, and `revenue`.
For example, in the following code, your tracking plan contains an event called `songPlayed`. The event has two required properties: `songId` and `songFavorited`. The property type for `songId` is string, and `songFavorited` is a boolean.
The event has an Amplitude field defined: `deviceId`. For more information, refer to [Amplitude fields](https://amplitude.com/docs/apis/analytics/http-v2/#event-array-keys).
```ts
ampli.songPlayed(
{
songId: "songId", // string,
songFavorited: true, // boolean
},
{
deviceId: "a-device-id",
},
);
```
Ampli also generates a class for each event.
```ts
const myEventObject = new SongPlayed({
songId: "songId", // string,
songFavorited: true, // boolean
});
```
Track Event objects using Ampli `track`:
```ts
ampli.track(
new SongPlayed({
songId: "songId", // string,
songFavorited: true, // boolean
}),
);
```
### Flush
The Ampli wrapper queues events and sends them on an interval based on the configuration.
Call `flush()` to immediately send any pending events.
The `flush()` method returns a promise you can use to ensure all pending events send before continuing. Calling `flush()` is useful before application exit.
```typescript
ampli.flush();
```
### Plugin
Plugins allow you to extend Amplitude behavior, for example, modifying event properties (enrichment type) or sending to third-party APIs (destination type).
First, define your plugin. Enrichment Plugin example:
{% code-group %}
```ts TypeScript
import {
BrowserConfig,
EnrichmentPlugin,
Event,
} from "@amplitude/analytics-types";
export class AddEventIdPlugin implements EnrichmentPlugin {
name = "add-event-id";
type = "enrichment" as const;
currentId = 100;
/**
* setup() is called on plugin installation
* example: client.add(new AddEventIdPlugin());
*/
setup(config: BrowserConfig): Promise {
this.config = config;
}
/**
* execute() is called on each event instrumented
* example: client.track('New Event');
*/
execute(event: Event): Promise {
event.event_id = this.currentId++;
return event;
}
}
```
```js JavaScript
export class AddEventIdPlugin {
name = "add-event-id";
type = "enrichment";
currentId = 100;
/**
* setup() is called on plugin installation
* example: client.add(new AddEventIdPlugin());
*/
setup(config) {
this.config = config;
}
/**
* execute() is called on each event instrumented
* example: client.track('New Event');
*/
execute(event) {
event.event_id = this.currentId++;
return event;
}
}
```
{% /code-group %}
Add your plugin after you initialize Ampli.
```ts
ampli.client.add(new AddEventIdPlugin());
```
## Ampli CLI
### Pull
The `pull` command downloads the Ampli Wrapper code to your project. Run the `pull` command from the project root.
```bash
ampli pull
```
Log in to your workspace when prompted and select a source.
```bash
➜ ampli pull
Ampli project is not initialized. No existing `ampli.json` configuration found.
? Create a new Ampli project here? Yes
? Organization: Amplitude
? Workspace: My Workspace
? Source: My Source
```
For more information, refer to [`ampli pull`](https://amplitude.com/docs/sdks/ampli/ampli-cli#pull).
### Status
Verify that events appear in your code with the status command:
```bash
ampli status [--update]
```
The output displays status and indicates what events are missing.
```bash
➜ ampli status
✘ Verifying event tracking implementation in source code
✔ Song Played (1 location)
✘ Song Stopped Called when a user stops playing a song.
Events Tracked: 1 missed, 2 total
```
For more information, refer to [`ampli status`](https://amplitude.com/docs/sdks/ampli/ampli-cli#status).
================================================================================
# Migrate from Javascript SDK to Browser SDK 1.0
URL: https://amplitude.com/docs/sdks/analytics/browser/migrate-from-javascript-sdk-to-browser-sdk-1-0
================================================================================
# Migrate from Javascript SDK to Browser SDK 1.0
Amplitude Browser SDK 1.0 (`@amplitude/analytics-browser`) features a plugin architecture, built-in type definition and broader support for front-end frameworks. Browser SDK 1.0 isn't backwards compatible with `amplitude-js`.
To migrate to `@amplitude/analytics-browser`, update your dependencies and instrumentation.
{% callout type="note" heading="Browser SDK 2.0" %}
An improved version of the Amplitude Browser SDK is now available. Amplitude Browser SDK 2.0 features default event tracking, improved marketing attribution tracking, simplified interface and a lighter weight package. Amplitude recommends the Browser SDK 2.0 for both product analytics and marketing analytics use cases. Upgrade to the latest [Browser SDK 2.0](https://amplitude.com/docs/sdks/analytics/browser/browser-sdk-2).
{% /callout %}
{% callout type="warning" heading="Breaking changes" %}
Migration to `@amplitude/analytics-browser` may disrupt Web Attribution in your implementation. Before you upgrade, you can choose whether attribution occurs during a session. After you upgrade, attribution always happens during the session, and you can no longer configure this behavior.
In both versions, attribution can happen during initialization.
{% /callout %}
## Terminology
- `amplitude-js`: Maintenance Browser SDK.
- `@amplitude/analytics-browser`: Browser SDK 1.0.
## Dependency
For snippet installation, update your project's [snippet loader](https://github.com/amplitude/Amplitude-TypeScript/tree/v1.x/packages/analytics-browser#using-script-loader).
For Node projects, update your dependency list in package.json.
{% code-group %}
```json amplitude-js
{
"dependencies": {
"amplitude-js": "^8"
}
}
```
```json @amplitude/analytics-browser
{
"dependencies": {
"@amplitude/analytics-browser": "^1"
}
}
```
{% /code-group %}
## Instrumentation
Browser SDK 1.0 offers an API to instrument events. To migrate to Browser SDK 1.0, update a few calls. The following sections detail which calls changed.
## Initialization
Like all other calls, Amplitude removed `getInstance()`. To initialize the SDK, call `init()` with the same parameters. The `config` parameter has a different shape. Refer to [Configuration](#configuration).
{% code-group %}
```javascript amplitude-js
import amplitude from "amplitude-js";
amplitude.getInstance().init(API_KEY, OPTIONAL_USER_ID, config);
```
```typescript @amplitude/analytics-browser
import * as amplitude from "@amplitude/analytics-browser";
amplitude.init(API_KEY, OPTIONAL_USER_ID, config);
```
{% /code-group %}
## Configuration
{% accordion title="Configuration options" %}
|amplitude-js|@amplitude/analytics-browser|
|-|-|
|`config.apiEndpoint`|`config.serverUrl`|
|`config.batchEvents`|`config.flushQueueSize`|
|`config.cookieExpiration`|`config.cookieExpiration`|
|`config.cookieName`|NOT SUPPORTED|
|`config.sameSiteCookie`|`config.cookieSameSite`|
|`config.cookieForceUpgrade`|NOT SUPPORTED|
|`config.deferInitialization`|NOT SUPPORTED. Refer to [Defer initialization](#defer-initialization).|
|`config.disableCookies`|`config.disableCookies`|
|`config.deviceId`|`config.deviceId`|
|`config.deviceIdFromUrlParam`|NOT SUPPORTED|
|`config.domain`|NOT SUPPORTED|
|`config.eventUploadPeriodMillis`|`config.flushIntervalMillis`|
|`config.eventUploadThreshold`|`config.flushQueueSize`|
|`config.forceHTTPs`|NOT SUPPORTED|
|`config.includeFbclid`|NOT SUPPORTED. Refer to [Web attribution](#web-attribution).|
|`config.includeGclid`|NOT SUPPORTED. Refer to [Web attribution](#web-attribution).|
|`config.includeReferrer`|NOT SUPPORTED. Refer to [Web attribution](#web-attribution).|
|`config.includeUtm`|NOT SUPPORTED. Refer to [Web attribution](#web-attribution).|
|`config.language`|NOT SUPPORTED. Refer to [Plugins](#plugins).|
|`config.library`|NOT SUPPORTED. Refer to [Plugins](#plugins).|
|`config.logLevel`|`config.logLevel`|
|`config.logAttributionCapturedEvent`|NOT SUPPORTED|
|`config.optOut`|`config.optOut`|
|`config.onError`|NOT SUPPORTED|
|`config.onExitPage`|NOT SUPPORTED. Refer to [Flush](#flush-or-onexitpage).|
|`config.platform`|NOT SUPPORTED at the configuration level, but `platform` still exists on the event object. To overwrite the platform, assign a platform while tracking an event, or enrich `event.platform` using an enrichment plugin. Refer to [Plugins](#plugins).|
|`config.savedMaxCount`|NOT SUPPORTED|
|`config.saveEvents`|NOT SUPPORTED|
|`config.saveParamsReferrerOncePerSession`|`config.attribution.trackNewCampaigns`. Opposite of `saveParamsReferrerOncePerSession`. Refer to [configuration](#configuration). |
|`config.secureCookie`|`config.cookieSecure`|
|`config.sessionTimeout`|`config.sessionTimeout`|
|`config.storage`|`config.identityStorage`|
|`config.trackingOptions`|`config.trackingOptions`|
|`config.transport`|`config.transportProvider`|
|`config.unsetParamsReferrerOnNewSession`|NOT SUPPORTED. Default behavior.|
|`config.unsentKey`|NOT SUPPORTED|
|`config.unsentIdentifyKey`|NOT SUPPORTED|
|`config.uploadBatchSize`|`config.flushQueueSize`|
|`config.headers`|NOT SUPPORTED|
|`config.serverZone`|`config.serverZone`|
|`config.useDynamicConfig`|NOT SUPPORTED|
|`config.serverZoneBasedApi`|NOT SUPPORTED|
|`config.sessionId`|`config.sessionId`|
|`config.partnerId`|`config.partnerId`|
{% /accordion %}
## Tracking events
The maintenance Browser SDK offered several `logEvent` APIs, such as `logEventWithTimestamp` and `logEventWithGroups`, to override specific properties in the event payload. Amplitude simplified these variations into a unified `track` API in `@amplitude/analytics-browser`.
### logEvent()
The `logEvent()` API maps to `track()`.
{% code-group %}
```javascript amplitude-js
const eventType = "Button Clicked";
const eventProperties = {
type: "primary",
};
amplitude.getInstance().logEvent(eventType, eventProperties);
```
```typescript @amplitude/analytics-browser
const eventType = "Button Clicked";
const eventProperties = {
type: "primary",
};
amplitude.track(eventType, eventProperties);
```
{% /code-group %}
### logEventWithTimestamp()
The `logEventWithTimestamp()` API maps to `track()`.
{% code-group %}
```javascript amplitude-js
const eventType = "Button Clicked";
const eventProperties = {
type: "primary",
};
const timestamp = Date.now();
amplitude
.getInstance()
.logEventWithTimestamp(eventType, eventProperties, timestamp);
```
```typescript @amplitude/analytics-browser
const eventType = "Button Clicked";
const eventProperties = {
type: "primary",
};
const eventOptions = {
time: Date.now(),
};
amplitude.track(eventType, eventProperties, eventOptions);
```
{% /code-group %}
### logEventWithGroups()
The `logEventWithGroups()` API maps to `track()`.
{% code-group %}
```javascript amplitude-js
const eventType = "Button Clicked";
const eventProperties = {
type: "primary",
};
const groups = {
orgId: "12345",
};
amplitude.getInstance().logEventWithGroups(eventType, eventProperties, groups);
```
```typescript @amplitude/analytics-browser
const event_type = "Button Clicked";
const event_properties = {
type: "primary",
};
const groups = {
orgId: "12345",
};
const event = {
event_type,
event_properties,
groups,
};
amplitude.track(event);
```
{% /code-group %}
### `sendEvents()`
The `sendEvents()` API maps to `flush()`.
{% code-group %}
```javascript amplitude-js
amplitude.getInstance().sendEvents();
```
```typescript @amplitude/analytics-browser
amplitude.flush();
```
{% /code-group %}
## Set user properties
The APIs for setting user properties are the same, except `getInstance()` no longer exists. The following code snippets show how to migrate user property APIs.
### setUserId()
{% callout type="warning" heading="Minimum identifier length" %}
The maintenance SDK uses an old SDK endpoint (`api2.amplitude.com`) which enforces no length limit for `deviceId` and `userId`. The latest SDK uses Amplitude's HTTP V2 API (`api2.amplitude.com/2/httpapi`) and requires identifiers to be at least 5 characters by default. When you migrate to the latest SDK, set `config.minIdLength` to a smaller value if you allowed identifiers with fewer than 5 characters.
{% /callout %}
Set a `userId` when you invoke `amplitude` without calling `getInstance()`.
{% code-group %}
```javascript amplitude-js
const userId = "1";
amplitude.getInstance().setUserId(userId);
```
```typescript @amplitude/analytics-browser
const userId = "1";
amplitude.setUserId(userId);
```
{% /code-group %}
### setDeviceId()
{% callout type="warning" heading="Minimum identifier length" %}
The maintenance SDK uses an old SDK endpoint (`api2.amplitude.com`) which enforces no length limit for `deviceId` and `userId`. The latest SDK uses Amplitude's HTTP V2 API (`api2.amplitude.com/2/httpapi`) and requires identifiers to be at least 5 characters by default. When you migrate to the latest SDK, set `config.minIdLength` to a smaller value if you allowed identifiers with fewer than 5 characters.
{% /callout %}
Set a `deviceId` when you invoke `amplitude` without calling `getInstance()`.
{% code-group %}
```javascript amplitude-js
const deviceId = "1";
amplitude.getInstance().setDeviceId(deviceId);
```
```typescript @amplitude/analytics-browser
const deviceId = "1";
amplitude.setDeviceId(deviceId);
```
{% /code-group %}
### setSessionId()
Set a `sessionId` when you invoke `amplitude` without calling `getInstance()`.
{% code-group %}
```javascript amplitude-js
const sessionId = Date.now();
amplitude.getInstance().setSessionId(sessionId);
```
```typescript @amplitude/analytics-browser
const sessionId = Date.now();
amplitude.setSessionId(sessionId);
```
{% /code-group %}
### clearUserProperties()
Amplitude removed the `clearUserProperties` API. Use the unified `identify` API to remove user properties.
{% code-group %}
```javascript amplitude-js
amplitude.getInstance().clearUserProperties();
```
```typescript @amplitude/analytics-browser
amplitude.identify(new amplitude.Identify().identify.clearAll());
```
{% /code-group %}
### setUserProperties()
Amplitude removed the `setUserProperties` API. Use the unified `identify` API to add user properties.
{% code-group %}
```javascript amplitude-js
amplitude.getInstance().setUserProperties({
membership, "paid",
payment, "bank",
})
```
```typescript @amplitude/analytics-browser
const identify = new amplitude.Identify();
identify.set("membership", "paid").set("payment", "bank");
amplitude.identify(identify);
```
{% /code-group %}
### identify()
Make an identify call on `amplitude` without calling `getInstance()`.
{% code-group %}
```javascript amplitude-js
const identify = new amplitude.Identify();
identify.set("membership", "paid");
amplitude.getInstance().identify(identify);
```
```typescript @amplitude/analytics-browser
const identify = new amplitude.Identify();
identify.set("membership", "paid");
amplitude.identify(identify);
```
{% /code-group %}
## Set group properties
### groupIdentify()
Make an identify call on `amplitude` without calling `getInstance()`.
{% code-group %}
```javascript amplitude-js
const identify = new amplitude.Identify();
identify.set("membership", "paid");
amplitude.getInstance().groupIdentify(identify);
```
```typescript @amplitude/analytics-browser
const identify = new amplitude.Identify();
identify.set("membership", "paid");
amplitude.groupIdentify(identify);
```
{% /code-group %}
## Track revenue
### logRevenueV2()
Track revenue using `revenue()` API on `amplitude` without calling `getInstance()`.
{% code-group %}
```javascript amplitude-js
const revenue = new amplitude.Revenue();
revenue.setProductId("productId").setPrice(10);
amplitude.getInstance().logRevenueV2(revenue);
```
```typescript @amplitude/analytics-browser
const revenue = new amplitude.Revenue();
revenue.setProductId("productId").setPrice(10);
amplitude.revenue(revenue);
```
{% /code-group %}
## Patterns
### Plugins
The configs `config.language`, `config.library`, and `config.platform` were available in `amplitude-js` to modify event payloads for these specific fields. Although `@amplitude/analytics-browser` doesn't support these configurations, you can add plugins to the new Browser SDK to enrich event payloads.
```ts
import {
BrowserConfig,
EnrichmentPlugin,
Event,
PluginType,
} from "@amplitude/analytics-types";
export class LibraryModifierPlugin implements EnrichmentPlugin {
name = "library-modifier";
type = PluginType.ENRICHMENT as const;
/**
* setup() is called on plugin installation
* example: client.add(new LibraryModifierPlugin());
*/
setup(config: BrowserConfig): Promise {
this.config = config;
}
/**
* execute() is called on each event instrumented
* example: client.track('New Event');
*/
execute(event: Event): Promise {
event.library = "my-library-name/1.0.0";
return Promise.resolve(event);
}
}
```
To install your custom plugin, use `add()` with your custom plugin as parameter.
```typescript
import { add } from "@amplitude/analytics-browser";
add(new LibraryModifierPlugin());
```
### Defer initialization
To defer initialization in `amplitude-js`, call `init` with `config.deferInitialization` set to `true`, then call `enableTracking()` to formalize initialization and send all enqueued events.
{% tabs tabs="amplitude-js, @amplitude/analytics-browser" %}
{% tab name="amplitude-js" %}
```javascript
amplitude.getInstance().init(API_KEY, OPTIONAL_USER_ID, {
deferInitialization: true,
});
amplitude.getInstance().logEvent("Event 1");
amplitude.getInstance().logEvent("Event 2");
amplitude.getInstance().logEvent("Event 3");
amplitude.getInstance().enableTracking();
```
{% /tab %}
{% tab name="@amplitude/analytics-browser" %}
Call `init()` after `track()`. The SDK processes all `track()` calls after initialization completes.
```typescript
amplitude.track("Event 1");
amplitude.track("Event 2");
amplitude.track("Event 3");
amplitude.init(API_KEY, OPTIONAL_USER_ID);
```
{% /tab %}
{% /tabs %}
### Web attribution
In `amplitude-js`, you enable web attribution by enabling the following configurations:
- `config.includeGclid`.
- `config.includeFbclid`.
- `config.includeReferrer`.
- `config.includeUtm`.
In `@amplitude/analytics-browser`, a single configuration controls web attribution: `config.attribution.disabled`. The default value is `false`, which captures all campaign parameters. This configuration collects the same campaign parameters that `amplitude-js` supports.
### Flush or onExitPage
Some scenarios warrant sending events immediately, such as when a user navigates away from a page. This case is common when tracking button clicks that direct the user to another page while sending event payloads in batches.
In `amplitude-js`, use the `onExitPage()` callback.
{% tabs tabs="amplitude-js, @amplitude/analytics-browser" %}
{% tab name="amplitude-js" %}
```javascript
amplitude.getInstance().init(API_KEY, OPTIONAL_USER_ID, {
onExitPage: () => {
amplitude.sendEvents();
},
});
```
{% /tab %}
{% tab name="@amplitude/analytics-browser" %}
Add your own event listener for the `pagehide` event.
```javascript
window.addEventListener("pagehide", () => {
// Set https transport to use sendBeacon API
amplitude.setTransport("beacon");
// Send all pending events to server
amplitude.flush();
});
```
{% /tab %}
{% /tabs %}
### Callback
In `amplitude-js`, you pass one `init` callback function to run after initialization, plus two separate callback functions for success and error network requests. Because `@amplitude/analytics-browser` supports Promises (and `async`/`await`), asynchronous methods such as `init()`, `track()`, `identify()`, and `groupIdentify()` return a custom promise interface.
```javascript
const initResult = await amplitude.init("YOUR_API_KEY").promise;
if (initResult.code === 200) {
// success logic
} else {
// error logic
}
const result = await amplitude.track("Button Clicked").promise;
if (result.code === 200) {
// success logic
} else {
// error logic
}
```
================================================================================
# Marketing Analytics SDK
URL: https://amplitude.com/docs/sdks/analytics/browser/marketing-analytics-sdk
================================================================================
# Marketing Analytics SDK
The Marketing Analytics Browser SDK extends the Browser SDK to identify users and events based on marketing channels. This library is open-source. View the source on [GitHub](https://github.com/amplitude/Amplitude-TypeScript/tree/v1.x/packages/marketing-analytics-browser).
{% callout type="deprecated" heading="" %}
This is a maintenance SDK and only receives bug fixes until deprecation. An improved version of Amplitude Browser SDK is now available. Amplitude Browser SDK 2.0 features default event tracking, improved marketing attribution tracking, a simplified interface, and a lighter weight package. Amplitude recommends the Browser SDK 2.0 for both product analytics and marketing analytics use cases. Upgrade to the latest [Browser SDK 2.0](https://amplitude.com/docs/sdks/analytics/browser/browser-sdk-2).
{% /callout %}
## Install the SDK
To get started with the Marketing Analytics Browser SDK, install the package in your project with npm or the script loader.
### Install the Node package
{% code-group %}
```bash npm
npm install @amplitude/marketing-analytics-browser
```
```bash yarn
yarn add @amplitude/marketing-analytics-browser
```
{% /code-group %}
### Install with the script loader
Amplitude also distributes this package through a CDN. Copy and paste this script in your HTML file.
```
```
### Configuration
{% accordion title="Configuration options" %}
| Name | Description | Default Value |
| --- | --- | --- |
|`instanceName`| `string`. The instance name. | `$default_instance` |
|`flushIntervalMillis`| `number`. Sets the interval of uploading events to Amplitude in milliseconds. | 1,000 (1 second) |
|`flushQueueSize`| `number`. Sets the maximum number of events that the SDK batches in a single upload attempt. | 30 events |
|`flushMaxRetries`| `number`. Sets the maximum number of retries for failed upload attempts. This applies only to retryable errors. | 5 times.|
|`logLevel` | `LogLevel.None` or `LogLevel.Error` or `LogLevel.Warn` or `LogLevel.Verbose` or `LogLevel.Debug`. Sets the log level. | `LogLevel.Warn` |
|`loggerProvider `| `Logger`. Sets a custom `loggerProvider` class from the Logger to emit log messages to the destination you choose. | `Amplitude Logger` |
|`minIdLength`| `number`. Sets the minimum length for the value of `userId` and `deviceId` properties. | `5` |
|`optOut` | `boolean`. Sets permission to track events. A value of `true` prevents Amplitude from tracking and uploading events. | `false` |
|`serverUrl`| `string`. Sets the URL where the SDK uploads events. | `https://api2.amplitude.com/2/httpapi` |
|`serverZone`| `EU` or `US`. Sets the Amplitude server zone. Set this to `EU` for Amplitude projects created in the `EU` data center. | `US` |
|`useBatch`| `boolean`. Sets whether the SDK uploads events to the Batch API instead of the default HTTP V2 API. | `false` |
|`appVersion` | `string`. Sets an app version for tracked events. This can be the version of your application. For example: "1.0.0". | `undefined` |
|`deviceId` | `string`. Sets an identifier for the device running your application. | `UUID()` |
|`cookieExpiration` | `number`. Sets expiration of created cookies in days. | 365 days |
|`cookieSameSite` | `string`. Sets the `SameSite` property of created cookies. | `Lax` |
|`cookieSecure` | `boolean`. Sets the `Secure` property of created cookies. | `false` |
|`cookieStorage` | `Storage`. Sets a custom implementation of `Storage` to persist user identity. | `MemoryStorage` |
|`cookieUpgrade`| `boolean`. Sets upgrading from cookies created by the [maintenance Browser SDK](https://amplitude.com/docs/sdks/analytics/browser/javascript-sdk). If true, the new Browser SDK deletes cookies created by the maintenance Browser SDK. If false, the Browser SDK keeps cookies created by the maintenance Browser SDK. | `true` |
|`disableCookies`| `boolean`. Sets permission to use cookies. If the value is `true`, the SDK uses the localStorage API to persist user identity. | Cookies are enabled by default. |
|`domain` | `string`. Sets the domain property of created cookies. | `undefined` |
|`partnerId` | `string`. Sets the partner ID. Amplitude requires the customer who built an event ingestion integration to add the partner identifier to `partner_id`. | `undefined` |
|`sessionTimeout` | `number`. Sets the period of inactivity from the last tracked event before a session expires, in milliseconds. | 1,800,000 milliseconds (30 minutes) |
|`userId` | `number`. Sets an identifier for the tracked user. Must have a minimum length of 5 characters unless overridden with the `minIdLength` option. | `undefined` |
|`trackingOptions`| `TrackingOptions`. Configures tracking of additional properties. Go to the `Optional tracking` section for more information. | All tracking options enabled by default. |
|`storageProvider`| `Storage`. Implements a custom `storageProvider` class from Storage. | `LocalStorage` |
{% /accordion %}
The Marketing Analytics SDK supports the following options to configure web attribution and page view tracking.
| Name | Description | Default Value |
| --------------------------------------- | ---------------------------------------------------------------------------------------------------------------------------------------------------------------------------------------------------------------------------------------------------------------------------------------------------------------------------------------------------------------------------------- | ----------------------------------------------------------- |
| `attribution.disabled` | `boolean`. Whether to disable attribution tracking. | `false` |
| `attribution.excludeReferrers` | `string[]`. Excludes attribution tracking for the provided referrer strings. | All referrers included by default. |
| `attribution.initialEmptyValue` | `string`. Customizes the initial empty value for attribution-related user properties to any string value. | `EMPTY` |
| `attribution.resetSessionOnNewCampaign` | `boolean`. Whether to reset the `sessionId` on a new campaign. | The SDK doesn't create a new session for a new campaign by default. |
| `pageViewTracking.trackOn` | `attribution` or `() => boolean`. `attribution`: fires a page view event when attribution information changes. `undefined`: fires a page view event on page load or on history changes for a single page application (default behavior). `() => boolean`: fires page view events based on a `trackOn` function. | `undefined` |
| `pageViewTracking.trackHistoryChanges` | `pathOnly` or `all` or `undefined`. Use this option to subscribe to page view changes in a single page application like React.js. `pathOnly`: compares path-only changes for page view tracking. `all`: compares full URL changes for page view tracking. `undefined`: default behavior. Page view changes in single page applications don't trigger a page view event. | `undefined` |
### Configure batching behavior
To support high-performance environments, the SDK sends events in batches. The SDK queues every event logged by the `track` method in memory. The SDK flushes events in batches in the background. Customize batch behavior with `flushQueueSize` and `flushIntervalMillis`. By default, the `serverUrl` is `https://api2.amplitude.com/2/httpapi`. To send large batches of data at a time, set `useBatch` to `true` to set `setServerUrl` to the batch event upload API at `https://api2.amplitude.com/batch`. Both the regular mode and the batch mode use the same events upload threshold and flush time intervals.
```ts
amplitude.init(API_KEY, OPTIONAL_USER_ID, {
// Events queued in memory will flush when number of events exceed upload threshold
// Default value is 30
flushQueueSize: 50,
// Events queue will flush every certain milliseconds based on setting
// Default value is 10000 milliseconds
flushIntervalMillis: 20000,
// Using batch mode with batch API endpoint, `https://api2.amplitude.com/batch`
useBatch: true,
});
```
### EU data residency
Configure the server zone when you initialize the client to send data to Amplitude's EU servers. The SDK sends data based on the server zone if you set it.
{% callout type="note" heading="" %}
For EU data residency, the project must be set up inside Amplitude EU. You must initialize the SDK with the API key from Amplitude EU.
{% /callout %}
```ts
amplitude.init(API_KEY, OPTIONAL_USER_ID, {
serverZone: "EU",
});
```
## Marketing attribution
Amplitude tracks marketing attribution to identify your user's traffic source using the UTM, referrer, and click ID parameters.
#### UTM parameters
UTM (Urchin Traffic Monitor) parameters help you analyze the effectiveness of different ad campaigns and referring sites. UTM parameters are case-sensitive, so Amplitude treats them as different values when the capitalization varies.
There are five different standard UTM parameters:
| Name | Description |
| -------------- | -------------------------------------------------------------------------------------------------------------------------------- |
| `utm_source` | Identifies which website sent the traffic (for example, Google, Facebook). |
| `utm_medium` | Identifies a specific campaign used (for example, "summer_sale"). |
| `utm_campaign` | Identifies a specific campaign used (for example, "summer_sale"). |
| `utm_term` | Identifies paid search terms used (for example, product+analytics). |
| `utm_content` | Identifies what brought the user to the site, commonly used for A/B testing (for example, "banner-link", "text-link"). |
Here is an example URL with UTM parameters:
`https://www.amplitude.com/?utm_source=newsletter&utm_campaign=product_analytics_playbook&utm_medium=email&utm_term=product%20analytics&utm_content=banner-link`
#### Referrer parameters
Referrer is the URL of the page that linked to the destination page. Amplitude tracks the following parameters:
| Name | Description |
| ------------------ | ---------------------------------------------------------------------------------------------------------- |
| `referrer` | The last page the user was on (for example, `https://amplitude.com/behavioral-analytics-platform?ref=nav`).|
| `referring_domain` | The domain that the user was last on (for example, `https://amplitude.com`). |
The referrer is an empty string (`''`) if the user navigated to the destination page directly.
#### Click ID parameters
Click IDs are campaign identifiers included as URL query parameters. Ad platforms use these IDs to identify the campaign and other attributes. Amplitude doesn't have access to further campaign attributes associated with click IDs, but Amplitude can track click ID values specified in the following table.
| Name | Description |
| ------------- | ------------------------------------------------------ |
| `dclid` | Google Click Identifier from URL parameters. |
| `fbclid` | Facebook Click Identifier from URL parameters. |
| `gbraid` | Google campaign manager Click Identifier. |
| `gclid` | Google Click Identifier for iOS device from Web to App.|
| `ko_click_id` | Google Click Identifier for iOS device from App to Web.|
| `li_fat_id` | Kochava Click Identifier from URL parameters. |
| `msclkid` | Microsoft Click Identifier. |
| `rdt_cid` | Reddit Click Identifier. |
| `ttclid` | TikTok Click Identifier from URL parameter. |
| `twclid` | Twitter Click identifier. |
| `wbraid` | Reddit campaign tracking/attribution Click identifier. |
#### First-touch attribution
Amplitude captures the initial attribution data at the start of the first session. Amplitude sets the first-touch attribution values when it sees a user's attribution data for the first time. Amplitude sets the following user properties one time:
- `initial_utm_source`.
- `initial_utm_medium`.
- `initial_utm_campaign`.
- `initial_utm_term`.
- `initial_utm_content`.
- `initial_referrer`.
- `initial_referring_domain`.
- `initial_gclid`.
- `initial_fbclid`.
- `initial_dclid`.
- `initial_gbraid`.
- `initial_ko_click_id`.
- `initial_msclkid`.
- `initial_ttclid`.
- `initial_twclid`.
- `initial_wbraid`.
- `initial_li_fat_id`.
- `initial_rdt_cid`.
#### Multi-touch attribution
Amplitude captures the attribution data at the start of each session and sets those values as user properties. For organic or direct traffic, these properties may not be available. In that case, Amplitude unsets these user properties from the user identity.
For every new campaign (when Amplitude sees new attribution data), Amplitude captures the changes regardless of the state of the user session. Configure `resetSessionOnNewCampaign` to `true` to reset the session on every new campaign. The default behavior doesn't reset the session on a new campaign.
Amplitude tracks the following as user properties:
- `utm_source`.
- `utm_medium`.
- `utm_campaign`.
- `utm_term`.
- `utm_content`.
- `referrer`.
- `referring_domain`.
- `gclid`.
- `fbclid`.
- `dclid`.
- `gbraid`.
- `ko_click_id`.
- `msclkid`.
- `ttclid`.
- `twclid`.
- `wbraid`.
- `li_fat_id`.
- `rdt_cid`.
For users who initially visit a page directly or organically, the initial value defaults to `"EMPTY"`. To use a different initial value, set `attribution.initialEmptyValue` to any string value.
```ts
amplitude.init(API_KEY, OPTIONAL_USER_ID, {
attribution: {
initialEmptyValue: "none",
},
});
```
#### Exclude the referrers from a specific domain
Configure Amplitude to opt out of attribution data collection for a given list of referrers.
```ts
amplitude.init(API_KEY, OPTIONAL_USER_ID, {
attribution: {
excludeReferrers: ["www.test.com"],
},
});
```
#### Reset the session on a new campaign
Configure Amplitude to start a new session if any campaign parameter changes by setting `attribution.resetSessionOnNewCampaign` to `true`. By default, `attribution.resetSessionOnNewCampaign` is `false`.
```ts
amplitude.init(API_KEY, OPTIONAL_USER_ID, {
attribution: {
resetSessionOnNewCampaign: true,
},
});
```
#### Disable attribution tracking
Configure Amplitude to opt out of automatic attribution data collection by setting `attribution.disabled` to `true`. By default, `attribution.disabled` is `false`.
```ts
amplitude.init(API_KEY, OPTIONAL_USER_ID, {
attribution: {
disabled: true,
},
});
```
### Page view
Enable page view tracking by setting `pageViewTracking` to `true`. The SDK fires the page view event when the page loads.
```ts
amplitude.init(API_KEY, OPTIONAL_USER_ID, {
pageViewTracking: true,
});
```
Set `pageViewTracking` to an object to pass more options.
#### Track the page view event when the attribution changes
Set the `trackOn` option to `'attribution'` to send Page View events *only* when attribution information changes.
```ts
amplitude.init(API_KEY, OPTIONAL_USER_ID, {
pageViewTracking: {
trackOn: "attribution",
},
});
```
#### Track the page view event based on specific criteria
You can also set `trackOn` to a function callback to fully customize when the SDK sends a Page View event.
```ts
amplitude.init(API_KEY, OPTIONAL_USER_ID, {
pageViewTracking: {
trackOn: () => {
return window.location.pathname === "/landing_page";
},
},
});
```
#### Single page app page view tracking
If you have a single page app that uses a [history](https://developer.mozilla.org/en-US/docs/Web/API/History)-based router such as react-router, enable `trackHistoryChanges` to send Page View events when users navigate between pages.
Possible values for `trackHistoryChanges`:
| Name | Description |
| ---------- | ---------------------------------------------------------------------------------------------------------------------------------------------------------------------------------------- |
| `all` | All pushes and pops from history send a page view. |
| `pathOnly` | The SDK sends Page Views if the [URL pathname](https://developer.mozilla.org/en-US/docs/Web/API/URL/pathname) changes. This prevents changes to the query string or hash from sending events. |
Set `trackHistoryChanges` to `pathOnly` to track only path changes. By default, the SDK considers the full page URL when checking for page view changes.
```ts
amplitude.init(API_KEY, OPTIONAL_USER_ID, {
pageViewTracking: {
trackHistoryChanges: "pathOnly", // or 'all'
},
});
```
The SDK tracks the following information in page view events.
| Name | Description | Default Value |
| ---------------------------------- | ------------------------------------------------------------------------------------------- | ------------------------------------------- |
| `event_type` | `string`. The event type for the page view event. Configurable through enrichment plugin. | `Page View`. |
| `event_properties.page_domain` | `string`. The page domain. | `location.hostname` or ''. |
| `event_properties.page_location` | `string`. The page location. | `location.href` or ''. |
| `event_properties.page_path` | `string`. The page path. | `location.path` or ''. |
| `event_properties.page_title` | `string`. The page title. | `document.title` or ''. |
| `event_properties.page_url` | `string`. The value of page URL. | `location.href.split('?')[0]` or ``. |
| `event_properties.[CampaignParam]` | `string`. The value of `UTMParameters`, `ReferrerParameters`, or `ClickIdParameters` if present. | Any undefined campaignParam or `undefined`. |
### Use the Marketing Analytics SDK with Ampli
Use Ampli with this SDK by passing an instance of the Marketing Analytics SDK to `ampli.load()`.
1. Add the Marketing Analytics Browser SDK to your project.
2. Create an instance of the SDK.
3. Pass the instance into `ampli.load()`.
This example passes the "amplitude" instance to `ampli.load`.
```ts
amplitude.init(REACT_APP_AMPLITUDE_API_KEY, undefined, {
...DefaultConfiguration,
logLevel: 3,
});
ampli.load({
client: {
instance: amplitude,
},
});
```
================================================================================
# Javascript SDK
URL: https://amplitude.com/docs/sdks/analytics/browser/javascript-sdk
================================================================================
# Javascript SDK
This is the official documentation for the Amplitude Analytics JavaScript SDK.
{% callout type="deprecated" heading="Maintenance SDK" %}
This is a maintenance SDK and receives only bug fixes until deprecation. Upgrade to the latest [Browser SDK 2.0](https://amplitude.com/docs/sdks/analytics/browser/browser-sdk-2), which supports plugins and more.
{% /callout %}
{% callout type="warning" heading="Supported browser versions" %}
This SDK uses modern JavaScript features. For browser compatibility information, refer to the following links:
- [Nullish coalescing `??` operator](https://caniuse.com/mdn-javascript_operators_nullish_coalescing)
- [Optional chaining `?.` operator](https://caniuse.com/mdn-javascript_operators_optional_chaining)
To ensure [wider browser support and ES5 conformity](https://caniuse.com/es5), use [Amplitude's TypeScript Browser SDK](https://amplitude.com/docs/sdks/analytics/browser/browser-sdk-2).
{% /callout %}
## Install
Install the Amplitude Analytics JavaScript SDK in your project.
{% tabs tabs="Snippet, npm, yarn" %}
{% tab name="Snippet" %}
Install the JavaScript SDK using a small snippet of code that you paste on your site to asynchronously load the SDK.
On every page where you want to install Amplitude analytics, paste the code snippet just before the `` tag, replacing `AMPLITUDE_API_KEY` with your project's API key.
{% callout type="warning" heading="Load and initialize only when context is ready" %}
Don't load the Amplitude SDK from third-party scripts that run before the page has fully loaded. In those setups, user identifiers, traits, and page URL or state often aren't available yet, so the SDK can send early events with missing or incorrect properties. Initialize the SDK only after your app has access to all relevant data (for example, user ID, user properties, and the final page URL).
{% /callout %}
You can find your project's API Key in your project's [Settings page](https://amplitude.com/docs/admin/account-management/manage-orgs-projects).
```html
```
{% /tab %}
{% tab name="npm" %}
```bash
npm install amplitude-js
```
{% /tab %}
{% tab name="yarn" %}
```bash
yarn add amplitude-js
```
You can also install the [npm module](https://www.npmjs.com/package/amplitude-js) and embed the SDK directly into your product.
{% /tab %}
{% /tabs %}
After you've installed the SDK, import `amplitude` into your project.
```ts
import amplitude from "amplitude-js";
```
{% callout type="tip" heading="Quickstart" %}
1. [Initialize](#initialize)
2. [Send an event](#send-events)
```ts
// initialize the client
var instance1 = amplitude.getInstance().init(AMPLITUDE_API_KEY);
```
```ts
// send an event
const event = "Button Clicked";
amplitude.getInstance().logEvent(event);
```
{% /callout %}
## Core functions
The following functions make up the core of the Amplitude Analytics JavaScript SDK.
### Initialize
Before you can instrument, you must initialize the SDK using the API key for your Amplitude project.
Initialization creates a default instance, but you can create more instances using `getInstance` with a string name.
```ts
var instance1 = amplitude.getInstance().init("AMPLITUDE_API_KEY"); // initializes default instance of Amplitude client
var instance2 = amplitude
.getInstance("instance-name")
.init("AMPLITUDE_API_KEY"); // initializes named instance of Amplitude client
```
#### Initialization with options
Pass custom options in the `init` method. Refer to the [list of options](https://github.com/amplitude/Amplitude-JavaScript/blob/main/src/options.js) on GitHub.
```ts
var options = {};
var instance = amplitude
.getInstance("instance")
.init(AMPLITUDE_API_KEY, null, options); // initializes with the given options
```
### Configuration
{% accordion title="Configuration options" %}
| Name | Description | Default Value |
| ---------------------------------- | ------------------------------------------------------------------------------------------------------------------------------------------------------------------------------------------------------------------------------------------------------------------------------------------------------------------------------------------------------------------------------------------------------------------------------------------------------- | ------------------------------------------------------------------------ |
| `apiEndpoint` | `string`. Endpoint to send Amplitude event requests to. | `https://api.amplitude.com` |
| `batchEvents` | `boolean`. Whether to batch events. If `true`, the SDK batches events and uploads them only when the number of unsent events meets or exceeds eventUploadThreshold, or after eventUploadPeriodMillis milliseconds pass since the SDK logged the first unsent event. | `false` |
| `cookieExpiration` | `number`. The number of days after which the Amplitude cookie expires. 12 months supports GDPR compliance. | `365` |
| `sameSiteCookie` | `string`. Sets the SameSite flag on the amplitude cookie. Decides cookie privacy policy. | `Lax` |
| `cookieForceUpgrade` | `boolean`. Forces pre-v6.0.0 instances to adopt post-v6.0.0 compat cookie formats. | `false` |
| `disableCookies` | `boolean`. Whether to disable Amplitude cookies altogether. | `false` |
| `deferInitialization` | `boolean`. Whether to defer initialization. If `true`, this option disables the core functionality of the SDK, including saving a cookie and all logging, until you explicitly enable it. | `false` |
| `deviceIdFromUrlParam` | `boolean`. If `true`, the SDK parses Device ID values from the URL parameter amp_device_id if available. Device IDs defined in the configuration options during init take priority over Device IDs from URL parameters. | `false` |
| `domain` | `string`. Set a custom domain for the Amplitude cookie. To include subdomains, add a preceding period, eg: `.amplitude.com`. | `null` |
| `eventUploadPeriodMillis` | `number`. Amount of time in milliseconds that the SDK waits before uploading events if batchEvents is true. | 30 seconds |
| `eventUploadThreshold` | `number`. Minimum number of events to batch together per request if batchEvents is true. | `30` |
| `forceHTTPs` | `boolean`. Whether to force uploads to the HTTPS endpoint. If `true`, the SDK always uploads events to the HTTPS endpoint. Otherwise, the SDK uses the embedding site's protocol. | `true` |
| `includeFbclid` | `boolean`. If `true`, captures the fbclid URL parameter and the user's initial_fbclid through a setOnce operation. | `false` |
| `includeGclid` | `boolean`. If `true`, captures the gclid URL parameter and the user's initial_gclid through a setOnce operation. | `false` |
| `includeReferrer` | `boolean`. If `true`, captures the referrer and referring_domain for each session, and the user's initial_referrer and initial_referring_domain through a setOnce operation. | `false` |
| `includeUtm` | `boolean`. If `true`, finds UTM parameters in the query string or the \_utmz cookie, parses them, and includes them as user properties on all uploaded events. This option also captures initial UTM parameters for each session through a setOnce operation. | `false` |
| `language` | `string`. Custom language to set. | The language determined by the browser. |
| `library` | `Object`. Values for the library version | `{ name: 'amplitude-js', version: packageJsonVersion }` |
| `logLevel` | `string`. 'DISABLE', 'ERROR', 'WARN', 'INFO'. Level of logs to be printed in the developer console. | `WARN` |
| `logAttributionCapturedEvent` | `boolean`. If `true`, the SDK logs an Amplitude event whenever it captures new attribution values from the user. These events count toward your event volume. Event name logged: [Amplitude] Attribution Captured. Event Properties the SDK can log: `utm_source`, `utm_medium`, `utm_campaign`, `utm_term`, `utm_content`, `referrer`, `referring_domain`, `gclid`, `fbclid`. | `false` |
| `optOut` | `boolean`. Whether or not to disable tracking for the current user. | `false` |
| `onError` | `function`. Function to call on error. | `() => {}` |
| `onExitPage` | `function`. Function called when the user exits the browser. Useful logging on page exit. | `() => {}` |
| `platform` | `string`. Platform device is running on. | `Web` (browser, including mobile browsers). |
| `savedMaxCount` | `number`. Maximum number of events to save in localStorage. If the SDK logs more events while offline, the SDK removes old events. | `1000` |
| `saveEvents` | `boolean`. If `true`, the SDK saves events to localStorage and removes them after a successful upload. Without saving events, the SDK can lose events if the user navigates to another page before the SDK uploads the events. | `true` |
| `saveParamsReferrerOncePerSession` | `boolean`. If `true`, includeGclid, includeFbclid, includeReferrer, and includeUtm track their respective properties only once per session. The SDK ignores new values that arrive during the middle of the user's session. Set to false to always capture new values. | `true` |
| `secureCookie` | `boolean`. If `true`, the SDK sets the amplitude cookie with the Secure flag. | `false` |
| `sessionTimeout` | `number`. The time between logged events before a new session starts in milliseconds. | `30 minutes` |
| `storage` | `string`. Storage for metadata. Options are `cookies`, `localStorage`, `sessionStorage`, or `none`. Sets storage strategy. Overrides the `disableCookies` option. | `Empty String` |
| `trackingOptions` | `Object`. Type of data associated with a user. | Enable all tracking options by default. |
| `transport` | `string`. `http` or `beacon`. Network transport mechanism the SDK uses to send events. | `http` |
| `unsetParamsReferrerOnNewSession` | `boolean`. If `false`, the SDK carries the existing `referrer` and `utm_parameter` values through each new session. If set to `true`, the SDK sets the `referrer` and `utm_parameter` user properties, which include `referrer`, `referring_domain`, `utm_source`, `utm_medium`, `utm_campaign`, `utm_term`, and `utm_content`, to `null` when it instantiates a new session. Note: This option only works if `includeReferrer` or `includeUtm` is `true`. | `false` |
| `unsentKey` | `string`. localStorage key that stores unsent events. | `amplitude_unsent` |
| `unsentIdentifyKey` | `string`. localStorage key that stores unsent identifies. | `amplitude_unsent_identify` |
| `uploadBatchSize` | `number`. The maximum number of events to send to the server per request. | `100` |
| `headers` | `Object`. Headers attached to an event upload network request. The SDK merges custom header properties with this object. | `{ 'Content-Type': 'application/x-www-form-urlencoded; charset=UTF-8' }` |
| `serverZone` | `string`. `US` or `EU`. The server zone to send to. Adjusts server URL based on this config. | `US` |
| `useDynamicConfig` | `boolean`. Whether to update the API endpoint when serverZone changes. For data residency, Amplitude recommends enabling it unless you use your own proxy server. | `false` |
| `serverZoneBasedApi` | `boolean`. localStorage key that stores unsent events. | `false` |
| `sessionId` | `number`. The custom Session ID for the current session. Amplitude doesn't recommend this option unless you know what you're doing, because the Session ID of a session powers all session metrics in Amplitude. | `null` |
| `partnerId` | `number`. The partner id value. | `null` |
{% /accordion %}
#### Configure batching behavior
To support high-performance environments, the SDK sends events in batches. The SDK queues every event that the `logEvent` method logs in memory. The SDK flushes events in batches in the background. You can customize batch behavior with `eventUploadThreshold` and `eventUploadPeriodMillis`. By default, the serverUrl is `https://api.amplitude.com`. This SDK doesn't support batch mode, the [batch API](https://amplitude.com/docs/apis/analytics/batch-event-upload/) endpoint.
```js
amplitude.getInstance().init(apiKey, null, {
// Events queued in memory will flush when number of events exceed upload threshold
// Default value is 30
eventUploadThreshold: 50,
// Events queue will flush every certain milliseconds based on setting
// Default value is 30000 milliseconds
eventUploadPeriodMillis: 100000,
});
```
#### EU data residency
Starting with version 8.9.0, you can configure the server zone to send data to Amplitude's EU server after initializing the client.
The server zone configuration also supports dynamic configuration.
For earlier versions, configure the `apiEndpoint` property after initializing the client.
{% callout type="note" heading="" %}
For EU data residency, you must initialize the SDK with the API key from Amplitude EU. Your project must be set up from inside Amplitude EU.
{% /callout %}
Version 8.9.0 and higherEarlier versions
```js
// No need to call setServerUrl for sending data to Amplitude's EU servers
amplitude.getInstance().init(euApiKey, null, {
serverZone: "EU",
serverZoneBasedApi: true,
});
```
```js
amplitude.getInstance().init(euApiKey, null, {
apiEndpoint: "https://api.eu.amplitude.com",
});
```
#### Set `userID`
Set `userID` when initializing the client, or after initialization with the `setUserId` method.
{% tabs tabs="Set on initialization, Set with setUserId" %}
{% tab name="Set on initialization" %}
```js
var userId = "12345";
amplitude.getInstance().init(AMPLITUDE_API_KEY, userId); // initializes client with the given userId
```
{% /tab %}
{% tab name="Set with setUserId" %}
```js
var userId = "12345";
amplitude.getInstance().setUserId(userId);
```
There is an optional `startNewSession` parameter for `setUserId`. Set it to `true` to start a new user session.
{% /tab %}
{% /tabs %}
### Send events
#### Basic events
Events represent user interactions with your app. For example, "Button Clicked" might be an action you want to track.
```js
const event = "Button Clicked";
amplitude.getInstance().logEvent(event);
```
#### Event properties
Events can have properties that give context about the event. For example, "hover time" is a relevant property for the "Button Clicked" event.
```js
var event = "Button Clicked";
var eventProperties = {
"hover time": "100ms",
};
amplitude.getInstance().logEvent(event, eventProperties);
```
{% callout type="note" heading="Valid types and limits" %}
Valid data types for event properties are string, array, object, boolean, and number. Object keys have a 1000 character limit.
{% /callout %}
#### Arrays in event properties
Event property values can be arrays. You can query array event properties by any subset of the individual properties in the array.
```js
var event = "Button Clicked";
var eventProperties1 = {
selectedColors: ["red", "blue"],
};
amplitude.getInstance().logEvent(event, eventProperties1);
var eventProperties2 = {
selectedColors: ["red", "green"],
};
amplitude.getInstance().logEvent(event, eventProperties2);
```
### User properties
User properties help you understand your users at the time they performed some action within your app. For example, you can learn about their device details, their preferences, or language.
#### Set a user property
The Amplitude Identify object controls how you set user properties. First, create an Identify object instance, then call Identify methods on the instance, and then the client makes a call with the Identify object.
```js
new amplitude.Identify(); // does nothing, must call one of the following methods and pass to client
var identify = new amplitude.Identify();
amplitude.getInstance().identify(identify); // makes identify call to amplitude with the properties of the identify object
```
##### `set`
Set the value of a user property. You can also chain together several `set` calls.
```js
var identify1 = new amplitude.Identify().set("key1", "value1");
var identify2 = new amplitude.Identify()
.set("key2", "value2")
.set("key3", "value3");
amplitude.getInstance().identify(identify1);
amplitude.getInstance().identify(identify2);
```
##### `setOnce`
`setOnce` sets the value of a user property one time. Amplitude ignores subsequent calls using `setOnce`.
```js
var identify = new amplitude.Identify().setOnce("key1", "value1");
amplitude.getInstance().identify(identify);
```
##### `add`
Increment a user property by a number with `add`. If the user property doesn't have a value set yet, it's initialized to `0`.
```js
var identify = new amplitude.Identify().add("value1", 10);
amplitude.getInstance().identify(identify);
```
#### Set multiple user properties
You can use `setUserProperties` as a shorthand to set multiple user properties at one time.
For example, set a user's city with this code:
```js
var userProperties = {
city: "San Francisco",
};
amplitude.getInstance().setUserProperties(userProperties);
```
{% callout type="note" heading="" %}
This method is a wrapper around `Identify.set` and `identify`.
{% /callout %}
#### Arrays in user properties
User properties can be arrays. Directly set arrays or use `append` to generate an array.
```js
var values = ["value1", "value2"];
var identify = new amplitude.Identify().set("key1", values);
amplitude.getInstance().identify(identify);
```
##### `prepend` and `append`
- `append` appends a value or values to a user property array.
- `prepend` prepends a value or values to a user property array.
If the user property doesn't have a value set yet, the SDK initializes it to an empty list before adding the new values.
If the user property has an existing value and the value isn't a list, the SDK converts the value into a list and adds the new value.
### User groups
Amplitude supports assigning users to groups and performing queries, such as Count by Distinct, on those groups. If at least one member of the group has performed the specific event, then the count includes the group.
For example, you want to group your users based on what organization they're in by using an 'orgId'. Joe is in 'orgId' '10', and Sue is in 'orgId' '15'. Sue and Joe both perform a certain event. You can query their organizations in the Event Segmentation Chart.
When setting groups, define a `groupType` and `groupName`. In the previous example, 'orgId' is the `groupType` and '10' and '15' are the values for `groupName`. Another example of a `groupType` could be 'sport' with `groupName` values like 'tennis' and 'baseball'.
Setting a group also sets the `groupType:groupName` as a user property, and overwrites any existing `groupName` value set for that user's `groupType`, and the corresponding user property value. `groupType` is a string, and `groupName` can be a string or an array of strings to indicate that a user belongs to multiple groups.
{% callout type="example" heading="" %}
If Joe is in 'orgId' '10' and '16', then the `groupName` would be '["10", "16"]'. Your code might look like this:
```js
amplitude.getInstance().setGroup("orgId", ["10", "16"]);
```
{% /callout %}
You can also use `logEventWithGroups` to set event-level groups. With event-level groups, the group designation applies only to the specific event the SDK logs, and doesn't persist on the user unless you explicitly set it with `setGroup`.
```js
var eventProperties = {
key: "value",
};
amplitude
.getInstance()
.logEventWithGroups("initialize_game", eventProperties, { sport: "soccer" });
```
### Group identify
Use the Group Identify API to set or update the properties of particular groups. Keep these considerations in mind:
- Updates affect only future events, and don't update historical events.
- You can track up to 5 unique group types and 10 total groups.
The `groupIdentify` method accepts a group type string parameter and group name object parameter, and an Identify object that the SDK applies to the group.
```js
var groupType = "plan";
var groupName = "enterprise";
var identify = new amplitude.Identify().set("key1", "value1");
amplitude.getInstance().groupIdentify(groupType, groupName, identify);
```
You can supply an optional callback function as a fourth argument to `groupIdentify`.
### Track revenue
The best method of tracking revenue for a user is to use `logRevenueV2()` with the provided Revenue interface.
Revenue instances store each revenue transaction and let you define several special revenue properties that Amplitude's Event Segmentation and Revenue LTV charts use, such as `revenueType` and `productIdentifier`.
You can also add event properties to revenue events through the `eventProperties` field. Pass these Revenue instance objects into `logRevenueV2` to send them as revenue events to Amplitude.
Amplitude then automatically displays data relevant to revenue in the platform. You can track both in-app and non-in-app purchases this way.
To track revenue from a user, call `logRevenueV2()` each time a user generates revenue. Here is an example:
```js
var revenue = new amplitude.Revenue()
.setProductId("com.company.productId")
.setPrice(3.99)
.setQuantity(3);
amplitude.getInstance().logRevenueV2(revenue);
```
Calling `logRevenueV2` generates a revenue event type:
- [Amplitude] Revenue: The SDK logs this event for all revenue events, regardless of whether you enable verification.
You can't change the default names given to these client-side revenue events in the raw data, but you can change the [display name](https://amplitude.com/docs/admin/account-management/account-settings).
To learn more about tracking revenue, refer to [Track revenue](https://amplitude.com/docs/data/sources/instrument-track-revenue).
{% callout type="note" heading="" %}
Amplitude doesn't support currency conversion. Normalize all revenue data to your currency of choice before sending it to Amplitude.
{% /callout %}
| Name | Description |
| ----------------- | -------------------------------------------------------------------------------------------------------------------------------------------- |
| `productId` | Optional. String. An identifier for the product. Amplitude recommends something like the "Google Play Store product ID". Defaults to `null`. |
| `quantity` | Required. Integer. The quantity of products purchased. Note: revenue = quantity \* price. Defaults to 1. |
| `price` | Required. Double. The price of the products purchased, and this can be negative. Note: revenue = quantity \* price. Defaults to `null`. |
| `revenueType` | Optional, but required for revenue verification. String. The revenue type. For example, tax, refund, income. Defaults to `null`. |
| `eventProperties` | Optional. Object. An object of event properties to include in the revenue event. Defaults to `null`. |
## Opt users out of tracking
Call `setOptOut` to turn off logging for a given user:
```js
amplitude.getInstance().setOptOut(true);
```
While `setOptOut` is enabled, the SDK doesn't save or send events to the server. The opt out setting persists across page loads. To re-enable logging, call:
```js
amplitude.getInstance().setOptOut(false);
```
## Disable tracking specific fields
By default, the JavaScript SDK tracks some properties automatically. You can override this behavior by passing an object called `trackingOptions` when initializing the SDK,
setting the appropriate options to `false`.
| Parameter | Default Value |
| --------------------- | ------------- |
| `city` | `true` |
| `country` | `true` |
| `carrier` | `true` |
| `device_manufacturer` | `true` |
| `device_model` | `true` |
| `dma` | `true` |
| `ip_address` | `true` |
| `language` | `true` |
| `os_name` | `true` |
| `os_version` | `true` |
| `platform` | `true` |
| `region` | `true` |
| `version_name` | `true` |
{% callout type="warning" heading="" %}
The `trackingOptions` configurations prevent the SDK from tracking default properties on new projects that have no existing data, not on existing data. If you have a project with existing data that you want to stop collecting the default properties for, contact the Support team at support.amplitude.com.
Amplitude doesn't delete existing data.
{% /callout %}
## Set custom user ID
If your app has its login system that you want to track users with, you can call `setUserId` at any time:
```js
amplitude.getInstance().setUserId("USER_ID");
```
You can also add the User ID as an argument to the init call.
```js
amplitude.getInstance().init(AMPLITUDE_API_KEY, "USER_ID");
```
Don't assign users a user ID that could change, because each unique user ID represents a unique user in Amplitude. For more information, refer to
[Track unique users in Amplitude](https://amplitude.com/docs/data/sources/instrument-track-unique-users) in the Help Center.
## Logged out and anonymous users
Amplitude [merges user data](https://amplitude.com/docs/data/sources/instrument-track-unique-users), so Amplitude links any events associated with a known `userId` or `deviceId` to the existing user.
If a user logs out, Amplitude can merge that user's logged-out events to the user's record. You can change this behavior and log those events to an anonymous user instead.
To log events to an anonymous user:
1. Set the `userId` to null.
2. Generate a new `deviceId`.
Events coming from the current user or device appear as a new user in Amplitude. Note: If you do this, you can't see that the two users used the same device.
```js
amplitude.getInstance().setUserId(null); // not string 'null'
amplitude.getInstance().regenerateDeviceId();
```
## Session tracking
Events triggered within 30 minutes of each other count toward the current session.
The time of the first event marks the start time of a session, and the last triggered event marks the end time of a session.
You can change the session timeout window through the SDK configuration option field `sessionTimeout`.
### Get the session ID
In the JavaScript SDK, you can use the helper method `getSessionId` to get the value of the current `sessionId`:
```js
const sessionId = amplitude.getInstance().getSessionId();
```
## Configure HTTP headers
If you use a [domain proxy](https://developers.amplitude.com/docs/domain-proxies) that requires custom HTTP request headers, configure them with `options.headers` during initialization.
```js
amplitude.getInstance().init(AMPLITUDE_API_KEY, null, {
headers: {
"x-session-id": appToken,
"Content-Type": "application/json;charset=utf-8",
},
});
```
## Log events to multiple projects
If you want to log events to multiple Amplitude projects, you must have separate instances for each Amplitude project.
Each instance allows for independent `apiKeys`, `userIds`, `deviceIds`, and settings.
You must assign a name to each Amplitude project and instance and use that name consistently when fetching that instance to call functions.
{% callout type="note" heading="" %}
After you choose a name for that instance, you can't change it.
Amplitude associates an instance's data and settings with its name, and you must use that instance name for all future versions of your project to maintain data continuity.
Instance names don't need to match the names of your projects in the Amplitude platform, but they need to remain consistent throughout your code. You must also initialize each instance with the correct `apiKey`.
{% /callout %}
Instance names must be non-null and non-empty strings. Names are case insensitive, and you can fetch each instance by calling its name.
Each new instance has its own `apiKey`, `userId`, `deviceId`, and settings.
The following is an example of how to set up and log events to two separate projects:
```js
// existing project, existing settings, and existing API key
amplitude.getInstance().init("12345", null, { batchEvents: true });
// new project, new API key
amplitude
.getInstance("new_project")
.init("67890", null, { includeReferrer: true });
// need to reconfigure new project
amplitude.getInstance("new_project").setUserId("joe@gmail.com");
amplitude.getInstance("new_project").setUserProperties({ gender: "male" });
amplitude.getInstance("new_project").logEvent("Clicked");
var identify = new amplitude.Identify().add("karma", 1);
amplitude.getInstance().identify(identify);
amplitude.getInstance().logEvent("Viewed Home Page");
```
## Web attribution
Amplitude's JavaScript SDK doesn't ingest web attribution data by default, but setup is quick.
The SDK can automatically ingest this information if you enable attribution configuration options.
Amplitude supports automatically tracking the following through the SDK configuration options:
- The 5 standard UTM parameters from the user's browser cookie or URL parameters by using `includeUtm`.
- The referring URL and domain from `includeReferrer`.
- Google Click Identifier from URL parameters through `includeGclid`.
- Facebook Click Identifier from URL parameters through `includeFbclid`.
### Track UTM parameters
UTM parameters stand for Urchin Traffic Monitor parameters and help you analyze the effectiveness of different ad campaigns and referring sites.
UTM parameters are case sensitive, so Amplitude treats them as different values if the capitalization varies.
There are five different standard UTM parameters:
- `utm_source`: This identifies which website sent the traffic (for example: Google, Facebook).
- `utm_medium`: This identifies the link type that was used (for example: banner, button, email).
- `utm_campaign`: This identifies a specific campaign used (for example: "summer_sale").
- `utm_term`: This identifies paid search terms used (for example: product+analytics).
- `utm_content`: This identifies what brought the user to the site and is commonly used for A/B testing (for example: "banner-link", "text-link").
Here is an example URL:
`https://www.amplitude.com/?utm_source=newsletter&utm_campaign=product_analytics_playbook&utm_medium=email&utm_term=product%20analytics&utm_content=banner-link`
#### Enable through the SDK
In Amplitude, after you set the `includeUtm` option to true, the JavaScript SDK automatically pulls UTM parameters from the referring URL and includes them as user properties on all relevant events:
- `includeGclid`: Gclid (Google Click Identifier) is a globally unique tracking parameter that Google uses. When in use, Google appends a unique parameter (for example: `"?gclid=734fsdf3"`) to URLs at runtime. When you set this to true, the SDK captures `initial_gclid` and `gclid` as user properties.
- `includeFbclid`: Fbclid (Facebook Click Identifier) is a globally unique tracking parameter that Facebook uses. When in use, Facebook appends a unique parameter (for example: `"?fbclid=392foih3"`) to URLs at runtime. When you set this to `true`, the SDK captures `initial_fblid` and `fbclid` as user properties.
- `includeUtm`: If `true`, finds the standard UTM parameters from either the URL or the browser cookie and sets them as user properties. This option sets `utm_source`, `utm_medium`, `utm_campaign`, `utm_term`, and `utm_content`, and `initial_utm_source`, `initial_utm_medium`, `initial_utm_campaign`, `initial_utm_term`, and `initial_utm_content` as user properties for the user.
By default, the SDK captures UTM parameters once per session, and capture occurs when the user loads your site and the Amplitude SDK for the first time.
You can disable the once per session restriction through the `saveParamsReferrerOncePerSession` configuration option. When the SDK detects that it should start a new session,
the SDK pulls the UTM parameters that are available at the time. The SDK sets those UTM parameters as user properties, which persist for all the user's events going forward.
However, the SDK captures initial UTM parameters one time for each user through a `setOnce` operation.
### Track referrers
If you want to track how users are getting to your website, then track the referrer (the referring site).
Amplitude supports tracking these fields automatically:
- `referrer`: The last page the user was on (for example, ``).
- `referring_domain`: The domain that the user was last on (for example, `amplitude.com`).
#### Enable through the SDK
After you set the `includeReferrer` option to `true`, Amplitude captures the `referrer` and `referring_domain` for each session and sets them as user properties on relevant events:
- `includeReferrer`: When `true`, captures the `referrer` and `referring_domain` for each session as user properties, and the `initial_referrer` and `initial_referring_domain` user properties one time for each user.
The referrer is the entire URL, while the `referring_domain` is the domain name where the user came from.
Amplitude captures initial referring information one time for each user through a `setOnce` operation.
### First-touch attribution
Amplitude can capture the initial UTM parameters and referrer information for each user. Amplitude sets the first-touch attribution values when it detects a user's non-null UTM parameters for the first time.
Amplitude sets these user properties one time:
- `initial_utm_source`
- `initial_utm_medium`
- `initial_utm_campaign`
- `initial_utm_term`
- `initial_utm_content`
- `initial_referrer`
- `initial_referring_domain`
- `initial_gclid`
- `initial_fbclid`
Capture these parameters by setting the JavaScript SDK configuration options `includeReferrer`, `includeUtm`, `includeFbclid`, and `includeGclid` to `true`.
{% callout type="note" heading="" %}
Initial attribution information for users can change if Amplitude merges them with another user.
{% /callout %}
### Last-touch attribution
Amplitude captures where a user came from for each of their sessions by setting these user properties:
- `utm_source`
- `utm_medium`
- `utm_campaign`
- `utm_term`
- `utm_content`
- `referrer`
- `referring_domain`
- `gclid`
- `fbclid`
To use this, set the JavaScript SDK configuration options `includeReferrer`, `includeUtm`, `includeFbclid`, and `includeGclid` to `true`.
By default, the SDK saves values only at the start of the session, so if a user triggers some flow that causes them to land on the site again with a different set of UTM parameters within the same session,
the SDK doesn't save the second set.
### Multi-touch attribution
If you set `saveParamsReferrerOncePerSession` to `false` in your JavaScript SDK configuration, the SDK always captures new values from the user. This updates these user properties throughout a session if they change:
- `utm_source`
- `utm_medium`
- `utm_campaign`
- `utm_term`
- `utm_content`
- `referrer`
- `referring_domain`
- `gclid`
- `fbclid`
Some customers also instrument these user properties as arrays to track all the attribution parameters that the SDK detects within the same session for a single user.
### Log captured attribution values through Amplitude
This is an advanced use case.
{% callout type="note" heading="" %}
These events count toward your event quota.
{% /callout %}
If you set `logAttributionCapturedEvent` to `true` in your JavaScript SDK configuration, the SDK logs an Amplitude event whenever it captures new attribution values from the user.
**Event Name:** [Amplitude] Attribution Captured
**Event Properties:**
- `utm_source`
- `utm_medium`
- `utm_campaign`
- `utm_term`
- `utm_content`
- `referrer`
- `referring_domain`
- `gclid`
- `fbclid`
## Google Tag Manager
Amplitude's JavaScript SDK supports integration with Google Tag Manager. Refer to the [demo app](https://github.com/amplitude/GTM-Web-Demo) on GitHub for setup instructions.
## Troubleshooting and debugging
#### How to debug
Debugging in a browser can help you identify problems related to your code's implementation, and potential issues within the SDKs you're using. Here's a basic guide on how to use the browser's built-in Developer Tools (DevTools) for debugging.
##### Console
You can find JavaScript errors under *Inspect > Console*, which might have the details about the line of code and file that caused the problem. The console also lets you execute JavaScript code in real time.
- Enable debug mode by following these [instructions](#how-to-debug). With the default logger, the SDK outputs extra function context information to the developer console whenever you invoke any SDK public method, which can help with debugging.
- Amplitude supports SDK deferred initialization. The SDK dispatches events tracked before initialization after the initialization call. If you can't send events but can send the event successfully after entering `amplitude.init(API_KEY, 'USER_ID')` in the browser console, your `amplitude.init` call might not have triggered in your codebase, or you aren't using the correct amplitude instance during initialization. Check your implementation.
##### Instrumentation Explorer/Chrome Extension
The Amplitude Instrumentation Explorer is an extension available in the Google Chrome Web Store. The extension captures each Amplitude event you trigger and displays it in the extension popup. Confirm that the SDK sent the event successfully, and check the context in the event payload.
#### Common issues
The following are common issues specific to Browser SDK.
##### AD Blocker
`Ad Blocker` might lead to event dropping. The following errors indicate that `Ad Blocker` affects tracking. When you load through a script tag, an error might appear in the console/network tab while the SDK script loads. When you load with the npm package, errors might appear in the network tab when the SDK tries to send events to the server. The errors might vary depending on the browser.
- Chrome (Ubuntu, MacOS)
Console: error net::ERR_BLOCKED_BY_CLIENT
Network: status (blocked:other)
- Firefox (Ubuntu)
Console: error text doesn"t contain any blocking-specific info
Network: Transferred column contains the name of plugin Blocked by uBlock Origin
- Safari (MacOS)
Console: error contains text Content Blocker prevented frame ... from loading a resource from ...
Network: it looks like blocked requests aren't listed. Not sure if it"s possible to show them.
Amplitude recommends using a proxy server to avoid this situation.
##### Cookies related
Refer to the [cookie management](#cookie-management) for the information the SDK stores in cookies. Client behavior, like disabling cookies or using a private browser/window/tab, affects the persistence of these saved values in the cookies. If these values aren't persistent or aren't increasing by one, that could be the reason.
##### CORS
Cross-Origin Resource Sharing (CORS) is a security measure that browsers use to restrict how a web page can request resources from a different domain. CORS might cause this issue if you used `setServerURL`.
`Access to fetch at 'xxx' from origin 'xxx' has been blocked by CORS policy: Response to preflight request doesn't pass access control check: No 'Access-Control-Allow-Origin' header is present on the requested resource. If an opaque response serves your needs, set the request's mode to 'no-cors' to fetch the resource with CORS disabled.`
Cross-origin resource sharing (CORS) prevents a malicious site from reading another site's data without permission. The error message indicates that the server you're trying to access doesn't allow your origin to access the requested resource. The cause is the missing `Access-Control-Allow-Origin` header in the server's response.
- If you have control over the server, you can update the server's CORS policy. Add the `Access-Control-Allow-Origin` header to the server's responses. This change allows your origin to make requests. The value of `Access-Control-Allow-Origin` can be `*` to allow all origins, or the specific URL of your web page.
- If you don't have control over the server, you can set up a proxy server that adds the necessary CORS headers. The web page makes requests to the proxy, which then makes requests to the actual server. The proxy adds the `Access-Control-Allow-Origin` header to the response before sending it back to the web page.
If you set up an API proxy and run into configuration issues related to that on a platform you"ve selected, that"s no longer an SDK issue but an integration issue between your application and the service provider.
##### Events fired but no network requests
If you [set the logger to "Debug" level](#how-to-debug), and see track calls in the developer console, the SDK called the `track()` method. If you don't see the corresponding event in Amplitude, the Amplitude Instrumentation Explorer Chrome extension, or the network request tab of the browser, the SDK didn't send the event to Amplitude. The SDK fires events and places them in the SDK's internal queue after a successful `track()` call, but sometimes these queued events might not send successfully. This can happen when the browser cancels an in-progress HTTP request. For example, if you close the browser or leave the page.
There are two ways to address this issue:
1. If you use standard network requests, set the transport to `beacon` during initialization or set the transport to `beacon` upon page exit. `sendBeacon` doesn't work in this case because it sends events in the background, and doesn't return server responses like `4xx` or `5xx`. As a result, it doesn't retry on failure. `sendBeacon` sends only scheduled requests in the background. For more information, refer to the [sendBeacon](#use-sendbeacon) section.
2. To make track() synchronous, [add the `await` keyword](#callback) before the call.
## Advanced topics
### Dynamic configuration
Starting with version 8.9.0, you can configure your apps to use dynamic configuration.
This feature finds the best server URL automatically based on app users' location.
To use, set `useDynamicConfig` to `true`.
- If you have your own proxy server and use the `apiEndPoint` API, leave dynamic configuration off.
- If you have users in China Mainland, Amplitude recommends using dynamic configuration.
- By default, this feature returns the server URL of Amplitude's US servers. If you need to send data to Amplitude's EU servers, use `setServerZone` to set it to EU zone.
```js
amplitude.getInstance().init(euApiKey, null, {
useDynamicConfig: true,
});
```
### COPPA control
COPPA control in Amplitude's other SDKs disables tracking for IDFA, IDFV, city, location data (`location_lat` and `location_lng`), and IP address.
The JavaScript SDK has no interface for COPPA control because the SDK doesn't track `location_lat`, `location_lng`, IDFA, or IDFV. Instead, you can disable tracking for `city` and `ip_address` with `trackingOptions`.
```js
var trackingOptions = {
city: false,
ip_address: false,
};
```
### Get the device ID
Get a user's current device ID with the following code:
```js
var deviceId = amplitude.getInstance().getDeviceId(); // existing device ID
```
### Set configuration options
Configure Amplitude by passing an object as the third argument to the init:
```js
amplitude.getInstance().init(AMPLITUDE_API_KEY, null, {
// optional configuration options
saveEvents: true,
includeUtm: true,
includeReferrer: true,
});
```
### Cookie management
#### Cookies created by the SDK
On initialization, the SDK creates a cookie that begins with the prefix `amp_` and ends with the first six digits of your API key.
For example, `amplitude.getInstance().init("a2dbce0e18dfe5f8e74493843ff5c053")` creates a cookie with the key `amp_a2dbce`.
The cookie tracks this metadata for the SDK:
- A randomly generated device ID
- The current session ID
- The current user ID if a user ID is set
- The last event time
- Sequence IDs to put events and identify operations in the correct order
#### Disable cookies
Disable cookies created by the SDK with the `disableCookies` option. When you disable cookies, the JavaScript SDK defaults to using `localStorage` to store its data.
LocalStorage is a useful alternative, but can't track cookies across domains.
Because the browser restricts access to `localStorage` by subdomain, you can't track anonymous users across subdomains of your product (for example: `www.amplitude.com` versus `analytics.amplitude.com`).
#### SameSite
The JavaScript SDK defaults to setting the SameSite option on its cookies to `None`. This can be overridden with the `sameSiteCookie` option.
Amplitude recommends using `Lax` unless there are instances where you have third party sites that `POST` forms to your site.
#### HTTPOnly cookies
An HTTPOnly option isn't technologically possible for cookies that the SDK creates. The SDK sets the cookie on the client side and uses it as a client-side data store. An SDK cookie can't set the HTTPOnly flag.
#### Upgrade legacy cookies
Legacy cookies that the SDK created were larger than the newer, more compact cookies.
For users that have older cookies, the SDK only removes old cookies and starts using the new cookie format if the `cookieForceUpgrade` option is set to `true`.
If you use the SDK in multiple products, and track anonymous users across those products, you be sure to set this option on all those products.
{% callout type="note" heading="" %}
Amplitude only recommends upgrading cookies if you run into problems with oversized cookies.
{% /callout %}
### RequireJS
If you use RequireJS to load your JavaScript files, you can use it to load the Amplitude JavaScript SDK script directly instead of using the loading snippet.
If you take this approach, you lose one of the key advantages of the snippet, which lets your app start and use the Amplitude SDK without waiting for Amplitude to fully download.
```html
```
You can also define the path in your RequireJS configuration like this:
```html
```
### Cross-domain tracking (JavaScript)
You can track anonymous behavior across two different domains. Amplitude identifies anonymous users by their device IDs, which you must pass between the domains. For example:
- Site 1: `www.example.com`
- Site 2: `www.example.org`
Users who start on Site 1 and then navigate to Site 2 must have the device ID generated from Site 1 passed as a parameter to Site 2. Site 2 then needs to initialize the SDK with the device ID.
The SDK can parse the URL parameter automatically if `deviceIdFromUrlParam` is enabled.
1. From Site 1, grab the device ID from `amplitude.getInstance().options.deviceId`.
2. Pass the device ID to Site 2 through a URL parameter when the user navigates. (for example: `www.example.com?amp_device_id=device_id_from_site_1`)
3. Initialize the Amplitude SDK on Site 2 with `amplitude.init(AMPLITUDE_API_KEY, null, {deviceIdFromUrlParam: true})`.
### Tracking UTM parameters, referrer, and gclid (JavaScript)
Amplitude supports automatically tracking:
- Standard UTM parameters from the user's cookie or URL parameters when the configuration option `includeUtm` is set to true during initialization.
- The referring URL when the configuration option `includeReferrer` is set to true during initialization.
- `gclid` (Google Click ID) from URL parameters when the configuration option includeGclid is set to true during initialization.
If you enable tracking, the SDK sets the values as user properties (for example, `referrer` or `utm_source`) one time per session. This is called last touch attribution.
The SDK also saves the initial values like `initial_referrer` and `initial_utm_source` using a `setOnce` operation.
After the SDK sets these values, they never change. This is called first touch attribution.
`saveParamsReferrerOncePerSession`
By default, the SDK saves the values only at the start of the session. For example, if a user lands on your site with an initial set of UTM parameters and triggers some flow that causes them
to land on your site again with a different set of UTM parameters within the same Amplitude session, the SDK doesn't save the second set.
You can set the configuration option `saveParamsReferrerOncePerSession` to `false` to remove that restriction so that the SDK always captures new values from the user.
`unsetParamsReferrerOnNewSession`
By default, the SDK carries over existing UTM Parameters and Referrer values at the start of a new session. For example,
if a user's session expires, the SDK maps the user's Referrer and UTM Parameters to existing values.
To reset those values to null when the SDK instantiates a new session, set `unsetParamsReferrerOnNewSession` to `true`.
### Callbacks for `logEvent`, `identify`, and `redirect`
You can pass a callback function to `logEvent` and `identify`, which the SDK calls after receiving a response from the server.
This is useful if timing might cause the SDK to miss capturing an event before the browser navigates away from a webpage.
Putting the navigation in a callback to the `logEvent` method guarantees the SDK captures the event before navigation occurs. Here is a logEvent example:
```js
amplitude.getInstance().logEvent("EVENT_TYPE", null, callback_function);
```
Here is an identify example:
```js
var identify = new amplitude.Identify().set("key", "value");
amplitude.getInstance().identify(identify, callback_function);
```
The SDK passes the status and response body from the server to the callback function, which you might find useful. Here is an example of a callback function that redirects the browser to another site after a response:
```js
var callback_function = function (status, response) {
if (status === 200 && response === "success") {
// do something here
}
window.location.replace("URL_OF_OTHER_SITE");
};
```
You can also use this to track outbound links to your website. For example, you would have a link like this:
```html
Link A
```
Then, define a function that runs when the user clicks the link like this:
```js
var trackClickLinkA = function () {
amplitude.getInstance().logEvent("Clicked Link A", null, function () {
window.location = "LINK_A_URL";
});
};
```
When `optOut` is `true`, the SDK doesn't log the event, but it still calls the callback.
When `batchEvents` is `true`, if the batch requirements `eventUploadThreshold` and `eventUploadPeriodMillis` aren't met when you call `logEvent`, the SDK doesn't send a request, but it still calls the callback.
In these cases, the SDK calls the callback with an input status of 0 and a response of 'No request sent'.
### Error callbacks
You can pass a second callback to `logEvent` and identify that the SDK calls if the network request for the event fails.
This is useful to detect if a user is using an ad blocker, or if there's an error from the Amplitude server because of an issue with the event format.
You can use the error callback together with the success callback like this:
```js
var successCallback = function () {
console.log("the event was logged successfully");
};
var errorCallback = function () {
console.log("there was an error logging the event");
};
amplitude.getInstance().logEvent("event", null, successCallback, errorCallback);
```
### `init` callbacks
You can also pass a callback function to init, which the SDK calls after it finishes its asynchronous loading. The SDK passes the instance as an argument to the callback:
```js
amplitude
.getInstance()
.init(AMPLITUDE_API_KEY, "USER_ID", null, function (instance) {
console.log(instance.options.deviceId); // access Amplitude's deviceId after initialization
});
```
### Use sendBeacon
In SDK version 8.5.0 and higher, the SDK can send events using the browser's built-in navigator.sendBeacon API.
Unlike standard network requests, sendBeacon sends events in the background, even when the user closes the browser or leaves the page.
{% callout type="warning" heading="" %}
Because `sendBeacon` sends events in the background, events that `sendBeacon` dispatches don't return a server response, and the SDK can't retry them when they encounter failures like 4xx or 5xx errors. You can address these retry issues by sending one event per request, but this could increase the network load and the likelihood of throttling.
{% /callout %}
To send an event using sendBeacon, set the transport SDK option to 'beacon' in one of two ways
```js
// set transport to 'beacon' when initializing an event
amplitude
.getInstance()
.init(AMPLITUDE_API_KEY, "USER_ID", { transport: "beacon" });
// set transport to 'beacon' after initialization
amplitude.getInstance().setTransport("beacon");
// this event will be sent using navigator.sendBeacon
amplitude.getInstance().logEvent("send event with beacon");
// set transport back to the default 'http' value
amplitude.getInstance().setTransport("http");
// this event will be sent using the standard xhr mechanism
amplitude.getInstance().logEvent("send event with http");
```
#### Use sendBeacon only when exiting page
The JavaScript SDK provides a callback function that runs only when the user exits the page. It automatically switches the transport to 'beacon' for any logs sent in the callback. This callback is called `onExitPage`, and you pass it into the SDK on initialization, like so:
```js
var exitCallback = function {
amplitude.getInstance().logEvent('Logging a final event as user exits via sendBeacon');
};
amplitude.getInstance().init(AMPLITUDE_API_KEY, 'USER_ID', { onExitPage: exitCallback });
```
### Device ID lifecycle
The SDK initializes the device ID in the following order, setting the device ID to the first valid value it encounters:
1. Device id in configuration on initialization.
2. "amp_device_id" value from URL param if `configuration.deviceIdFromUrlParam` is true. Refer to [cross domain tracking](#cross-domain-tracking-javascript) for more details.
3. Device id in cookie storage. Refer to [cookie management](#cookie-management) for more details.
4. A randomly generated 22-character base64 ID. This ID is more compact than a 36-character UUID, which has the same 128-bit range.
#### When does a device ID change
A device ID changes in many scenarios:
Amplitude Analytics SDKs share an identity store with Experiment SDKs.
`setDeviceId` also updates the identity store to propagate new user info to the experiment SDK and trigger a fetch if the device ID changes.
- You call `setDeviceId()` explicitly.
- By default the SDK stores device IDs in cookies, so a device ID changes if a user clears cookies, uses another device, or uses privacy mode.
- On initialization, the SDK takes a device ID from the URL param `amp_device_id` when `deviceIdFromUrlParam` is enabled.
#### Custom device ID
You can assign a new device ID using `setDeviceId()`. When setting a custom device ID, make sure the value is sufficiently unique. Amplitude recommends using a UUID.
By default, the device ID is a randomly generated base64 ID. You can define a custom device ID by setting it as a configuration option or by calling `setDeviceId`.
```js
amplitude.getInstance().setDeviceId("DEVICE_ID");
```
#### Get device ID
You can retrieve the device ID that Amplitude uses with `Amplitude.getInstance().getDeviceId()` or `Amplitude.getInstance('YOUR-INSTANCE-NAME').getDeviceId()` if you defined a custom instance name. This method can return `null` if the SDK hasn't generated a `deviceId` yet.
```js
const deviceId = amplitude.getInstance().getDeviceId();
```
#### Share current device ID to another instance
Sometimes you have more than one Amplitude JavaScript SDK instance set up and want to share the device ID across instances.
- Method1: Initialize the other instance with device ID in configuration
```js
// Initialize an instance with default configuration
// Device Id of this instance is created by default
var instanceDev = amplitude.getInstance("amplitude-dev");
instanceDev.init("API-KEY-1");
// Initialize another instance with a different API key
// And pass the deviceId from the previous instance to the configuration
var instanceProd = amplitude.getInstance("amplitude-prod");
instanceProd.init("API-KEY-2", undefined, {
deviceId: instanceDev.getDeviceId(),
});
```
- Method2: Set device ID after initialization whenever you need it to be the same
```js
var instanceDev = amplitude.getInstance("amplitude-dev");
instanceDev.init("API-KEY-1");
var instanceProd = amplitude.getInstance("amplitude-prod");
instanceProd.init("API-KEY-2");
// Before the line blow, the device Ids of the two instances are different
instanceProd.setDeviceId(instanceDev.getDeviceId());
```
- Method3: Pass the device ID in URL param `amp_device_id`. Refer to [cross domain tracking](#cross-domain-tracking-javascript) for more details.
### Content Security Policy (CSP)
If your web app configures the strict Content Security Policy (CSP) for security concerns, adjust the policy to allow the Amplitude domains:
- When using ["Snippet"](#install), add `https://*.amplitude.com` to `script-src`.
- Add `https://*.amplitude.com` to `connect-src`.
================================================================================
# Ampli for Javascript SDK
URL: https://amplitude.com/docs/sdks/analytics/browser/ampli-for-javascript-sdk
================================================================================
# Ampli for Javascript SDK
The [Ampli Wrapper](https://amplitude.com/docs/sdks/ampli) is a generated, strongly typed API for tracking Analytics events based on your Tracking Plan in Amplitude Data. The tracking library exposes a function for every event in your team's tracking plan. The function's arguments correspond to the event's properties.
Ampli provides autocompletion for events and properties defined in Data and enforces your event schemas in code to prevent bad instrumentation.
Amplitude Data supports tracking analytics events from browser apps written in JavaScript (ES6 and higher) and TypeScript (2.1 and higher). Ampli packages the generated tracking library as a CJS module.
## Quickstart
1. [(Prerequisite) Create a Tracking Plan in Amplitude Data](https://amplitude.com/docs/data/create-tracking-plan)
Plan your events and properties in [Amplitude Data](https://data.amplitude.com/).
1. [Install the Amplitude SDK](#install-the-amplitude-sdk)
```shell
npm install amplitude-js@^8.21.0
```
2. [Install the Ampli CLI](#install-the-ampli-cli)
```shell
npm install -g @amplitude/ampli
```
3. [Pull the Ampli Wrapper into your project](#pull)
```shell
ampli pull [--path ./src/ampli]
```
4. [Initialize the Ampli Wrapper](#load)
```js
import { ampli } from "./src/ampli";
ampli.load({ client: { apiKey: AMPLITUDE_API_KEY } });
```
5. [Identify users and set user properties](#identify)
```js
ampli.identify("user-id", {
userProp: "A trait associated with this user",
});
```
6. [Track events with strongly typed methods and classes](#track)
```js
ampli.songPlayed({ songId: 'song-1' });
ampli.track(new SongPlayed({ songId: 'song-2' });
```
7. [Flush events before application exit](#flush)
```js
ampli.flush();
```
8. [Verify implementation status with CLI](#status)
```shell
ampli status [--update]
```
## Install the Amplitude SDK
If you haven't already, install the core Amplitude SDK dependencies.
{% code-group %}
```bash npm
npm install amplitude-js@^8.21.0
```
```bash yarn
yarn add amplitude-js@^8.21.0
```
{% /code-group %}
{% callout type="note" title="" %}
When you use Ampli in the browser, Amplitude recommends loading `amplitude-js@^8.21.0` as a module rather than as a JavaScript snippet.
{% /callout %}
## Install the Ampli CLI
You can install the Ampli CLI from Homebrew or NPM.
{% code-group %}
```bash brew
brew tap amplitude/ampli
brew install ampli
```
```bash npm
npm install -g @amplitude/ampli
```
{% /code-group %}
### Pull the Ampli Wrapper into your project
Run the Ampli CLI `pull` command to log in to Amplitude Data and download the strongly typed Ampli Wrapper for your tracking plan. Run Ampli CLI commands from the project root directory.
```bash
ampli pull
```
## API
Ampli generates a thin facade over the Amplitude SDK that provides convenience methods. The Ampli Wrapper also grants access to every method of the underlying Amplitude SDK through `ampli.client`. For details, refer to [Wrapping the Amplitude SDK](https://amplitude.com/docs/sdks/ampli#wrapping-the-amplitude-sdk).
### Load
Initialize Ampli in your code. The `load()` function requires an options object to configure the SDK's behavior:
| Option | Type | Required | Description |
|---|---|---|---|
| `disabled` | Boolean | No | Specifies whether the Ampli Wrapper does any work. When `true`, all calls to the Ampli Wrapper are no-ops. Useful in local or development environments. Defaults to `false`. |
| `client.instance` | AmplitudeClient | Required if `client.apiKey` isn't set | Specifies an Amplitude instance. By default, Ampli creates an instance for you. |
| `client.apiKey` | String | Required if `client.instance` isn't set | Specifies an API Key. This option overrides the default, which is the API Key configured in your tracking plan. |
| `client.options` | Amplitude.Config | No | Overrides the default configuration for the AmplitudeClient. |
### Identify
Call `identify()` to identify a user in your app and associate all future events with their identity, or to set their properties.
Just as the Ampli Wrapper creates types for events and their properties, it creates types for user properties.
The `identify()` function accepts an optional `userId`, optional user properties, and optional `options`.
For example, your tracking plan contains a user property called `role`. The property's type is a string.
```ts
ampli.identify("user-id", {
role: "admin",
});
```
The options argument lets you pass [Amplitude fields](https://amplitude.com/docs/apis/analytics/http-v2#event-array-keys) for this call, such as `deviceId`.
```ts
ampli.identify(
"user-id",
{
role: "admin",
},
{
deviceId: "my-device-id",
},
);
```
### Group
Call `setGroup()` to associate a user with their group (for example, their department or company). The `setGroup()` function accepts a required `groupType` and `groupName`.
```ts
ampli.setGroup("groupType", "groupName");
```
Amplitude supports assigning users to groups and performing queries, such as Count by Distinct, on those groups. If at least one member of the group has performed the specific event, then the count includes the group.
For example, you want to group your users based on what organization they're in by using an `orgId`. Joe is in `orgId` `10`, and Sue is in `orgId` `15`. Sue and Joe both perform a certain event. You can query their organizations in the Event Segmentation Chart.
When setting groups, define a `groupType` and `groupName`. In the previous example, `orgId` is the `groupType`, and `10` and `15` are the values for `groupName`. Another example of a `groupType` could be `sport` with `groupName` values like `tennis` and `baseball`.
Setting a group also sets the `groupType:groupName` as a user property and overwrites any existing `groupName` value set for that user's `groupType`, including the corresponding user property value. `groupType` is a string. `groupName` can be either a string or an array of strings to show that a user is in multiple groups. For example, if Joe is in `orgId` `10` and `20`, then the `groupName` is `[10, 20]`.
Your code might look like this:
```js
ampli.setGroup("orgId", ["10", "20"]);
```
### Track
To track an event, call the event's corresponding function. Every event in your tracking plan gets its own function in the Ampli Wrapper. The call is structured like this:
```js
ampli.eventName(properties: EventNameProperties, options: EventOptions, extra: MiddlewareExtra)
```
The `properties` argument passes event properties.
The `options` argument lets you pass [Amplitude fields](https://amplitude.com/docs/apis/analytics/http-v2#event-array-keys), like `price`, `quantity`, and `revenue`.
For example, in the following code, your tracking plan contains an event called `songPlayed`. The event has two required properties: `songId` and `songFavorited`. The property type for `songId` is string, and `songFavorited` is a boolean. The event also defines an Amplitude field, `deviceId`. For more information, refer to [Amplitude fields](https://amplitude.com/docs/apis/analytics/http-v2/#event-array-keys).
```js
ampli.songPlayed(
{
songId: "songId", // string,
songFavorited: true, // boolean
},
{
deviceId: "a-device-id",
},
{
myMiddleware: { myMiddlewareProp: "value to send to middleware" },
},
);
```
Ampli also generates a class for each event.
```js
const myEventObject = new SongPlayed({
songId: "songId", // string,
songFavorited: true, // boolean
});
```
Track Event objects using Ampli `track`:
```js
ampli.track(
new SongPlayed({
songId: "songId", // string,
songFavorited: true, // boolean
}),
);
```
### Flush
The Ampli wrapper queues events and sends them on an interval based on the configuration.
Call `flush()` to immediately send any pending events. The `flush()` method returns a promise you can use to ensure all pending events send before continuing. Call `flush()` before application exit.
```typescript
ampli.flush();
```
## Ampli CLI
### Pull
The `pull` command downloads the Ampli Wrapper code to your project. Run the `pull` command from the project root.
```bash
ampli pull
```
Log in to your workspace when prompted and select a source.
```bash
➜ ampli pull
Ampli project is not initialized. No existing `ampli.json` configuration found.
? Create a new Ampli project here? Yes
? Organization: Amplitude
? Workspace: My Workspace
? Source: My Source
```
For more information, refer to [`ampli pull`](https://amplitude.com/docs/sdks/ampli/ampli-cli#pull).
### Status
Verify that events are in your code with the status command:
```bash
ampli status [--update]
```
The output displays status and indicates what events are missing.
```bash
➜ ampli status
✘ Verifying event tracking implementation in source code
✔ Song Played (1 location)
✘ Song Stopped Called when a user stops playing a song.
Events Tracked: 1 missed, 2 total
```
For more information, refer to [`ampli status`](https://amplitude.com/docs/sdks/ampli/ampli-cli#status).
================================================================================
# Cookies and Consent Management (JavaScript SDK)
URL: https://amplitude.com/docs/sdks/analytics/browser/cookies-and-consent-management-javascript-sdk
================================================================================
# Cookies and Consent Management (JavaScript SDK)
{% callout type="warning" heading="Legacy JavaScript SDK" %}
This guide covers the legacy JavaScript SDK. For new implementations, use the [Browser SDK 2 cookies and consent management guide](https://amplitude.com/docs/sdks/analytics/browser/cookies-and-consent-management), which covers the current TypeScript SDK.
New customers must use the new TypeScript SDK (Browser SDK 2). Existing customers should consider migrating to Browser SDK 2 for the latest features and improvements.
{% /callout %}
This guide covers how Amplitude works with cookies, local storage, opt-in/opt-out options, and consent management (including CNIL regulations for France) when you use the legacy JavaScript SDK.
{% callout type="info" heading="Recommended migration" %}
For the most up-to-date cookies and consent management features, migrate to [Browser SDK 2](https://amplitude.com/docs/sdks/analytics/browser/browser-sdk-2) and use the [Browser SDK 2 cookies and consent management guide](https://amplitude.com/docs/sdks/analytics/browser/cookies-and-consent-management).
{% /callout %}
## Amplitude cookies
A "cookie" is a piece of data from a website that the browser stores on a user's device. Websites retrieve cookies later to access data stored for functional or technical purposes. After initialization, the Amplitude SDK creates a cookie that begins with the prefix `AMP_` and ends with the first 10 digits of your project API key. You can customize this prefix with the constant `COOKIE_PREFIX` in the SDK's [constants.js](https://github.com/amplitude/Amplitude-JavaScript/blob/35e2dd3f342614cfb27fcb6455e361595ae222d7/src/constants.js#L36) file. The SDK defines the cookie's value in [amplitude-client.js](https://github.com/amplitude/Amplitude-JavaScript/blob/03c0a890d578db1ada383cf1e6195d71275bac44/src/amplitude-client.js#L121).
For example, if you use the default value for the prefix with the following:
```js
amplitude.getInstance().init("a2dbce0e18dfe5f8e...");
```
The Amplitude Browser 2.0 SDK creates a cookie with the format `AMP_` followed by the first 10 characters of your project's API key.
In previous SDK versions, you could customize the key for this cookie at initialization with the `cookieName` option. This no longer works, but if you use older SDK versions, the cookie name may differ from the standard name.
If another cookie appears with the key `amplitude_cookie_test` followed by a random base64 suffix, the SDK uses the cookie to test whether the user has cookies enabled. The SDK removes this cookie when the test completes. For more information, refer to the SDK's [base-cookie.js](https://github.com/amplitude/Amplitude-JavaScript/blob/main/src/base-cookie.js#L97) file.
Sometimes, the SDK doesn't remove the `amplitude_test_cookie` cookie. In this case, the cookie remains in the cookie list but isn't used. You can customize the key of this cookie with the `COOKIE_TEST_PREFEX` constant in the SDK's [constants.js](https://github.com/amplitude/Amplitude-JavaScript/blob/35e2dd3f342614cfb27fcb6455e361595ae222d7/src/constants.js#L35) file.
The SDK uses the cookie to track the following metadata:
- `deviceId`: A randomly generated string.
- `userId`: When a user logs in, if your app sends this value to Amplitude, the SDK stores it in the cookie. Set this value to uniquely identify users. Amplitude encodes this value as Base64 before storing it.
- `optOut`: A flag that opts this device out of Amplitude tracking. When this flag is set, Amplitude stores no extra information about the user.
- `sessionId`: A randomly generated string for each session.
- `lastEventTime`: Time of the last event, used to decide when to expire and create a new session ID.
- `eventId`: An incrementing sequence of identifiers that distinguishes events.
- `identifyId`: An incrementing sequence of identifiers that distinguishes identify calls.
- `sequenceNumber`: A sequence number that orders events and identify calls.
When the Amplitude JavaScript SDK loads, it checks the cookie for an Amplitude `device_id` (which exists if the user is returning and generated a `device_id` in a previous visit). If found, the SDK uses that value. Otherwise (for a new user or one who recently cleared cookies), the SDK randomly generates a `device_id` and saves it to the cookie.
### Cookie size
Cookie size can vary from a minimum of 60 bytes to about 120 bytes. Because Amplitude can store two cookies (`amp_*` and `amp_*.organization.domain`), assume 120 bytes as a safe average size for Amplitude cookies **per project API key**.
### Expiration time
The Amplitude SDK has a `cookieExpiration` option that lets you set the number of days until a cookie expires. Before SDK version 7.0, the default value was 10 years. After SDK version 7.0, `cookieExpiration` defaults to one year. Most browsers limit the lifetime of cookies set through `document.cookie` to between one and seven days.
### Remove Amplitude cookies
To programmatically remove the Amplitude cookie, use the JavaScript SDK's `clearStorage()` method. This method clears all cookies and deletes any metadata stored on them.
### Deprecated cookies
The following cookie keys are deprecated in the latest SDK versions:
- `amplitude_id_.your_org_domain`: In previous versions of the Amplitude JavaScript SDK, the default cookie key was `amplitude_id`. This may appear in projects that use an SDK version earlier than 6.0.0. In that case, the cookie key is `amplitude_id_.organization.domain`.
- `amplitude_test.your_org_domain`: The Amplitude SDK uses this cookie to test more thoroughly if cookies are available. By default, the key is `amplitude_cookie_test`, and the SDK removes this cookie after the test.
## Disable cookies using LocalStorage (opt-out cookies)
The cookie contains data necessary for Amplitude to function correctly. It saves `deviceId`, `sessionId`, and the last event's timestamp. To store this information in a user's local storage instead, set `disableCookies` to `true` in the SDK's [options.js](https://github.com/amplitude/Amplitude-JavaScript/blob/4cbe557a81ca981d03e140bebed6134c49595a5e/src/options.js#L70) file.
### Data stored in local storage
Besides the information managed in the cookie, Amplitude uses local storage for:
- **Online events**: The `saveEvents` option in the SDK's [options.js](https://github.com/amplitude/Amplitude-JavaScript/blob/4cbe557a81ca981d03e140bebed6134c49595a5e/src/options.js#L103) controls this storage (defaults to `true`). Amplitude stores every event it receives and removes it after successful upload. When set to `false`, events may be lost if the user navigates to another page before upload completes.
- **Offline events**: The `savedMaxCount` option in the SDK's [options.js](https://github.com/amplitude/Amplitude-JavaScript/blob/4cbe557a81ca981d03e140bebed6134c49595a5e/src/options.js#L102) sets the number of offline events (defaults to 1000). If Amplitude logs more than 1000 events offline, the SDK removes the oldest events from storage.
- **Failed events**: The SDK stores any failed event here for retry.
Amplitude stores this data in the following keys:
- `amplitude_unsent_`: Stores unsent events. You can customize its name with the `unsentIdentifyKey` option in the SDK's [options.js](https://github.com/amplitude/Amplitude-JavaScript/blob/4cbe557a81ca981d03e140bebed6134c49595a5e/src/options.js#L126).
- `amplitude_unsent_identify_`: Stores unsent identify calls. You can customize its name with the `unsentKey` option in the SDK's [options.js](https://github.com/amplitude/Amplitude-JavaScript/blob/4cbe557a81ca981d03e140bebed6134c49595a5e/src/options.js#L125).
{% callout type="warning" heading="Local storage limitations" %}
Local Storage restricts access by subdomain. For example, if you track non-identified users across subdomains like `www.amplitude.com` and `analytics.amplitude.com`, the `device_id` value for each subdomain isn't available while browsing the other.
The Amplitude SDK supports cross-site tracking with the `deviceIdFromURLParam` option in the SDK's [options.js](https://github.com/amplitude/Amplitude-JavaScript/blob/4cbe557a81ca981d03e140bebed6134c49595a5e/src/options.js#L71). When set to `true`, the SDK captures the `amp_device_id` parameter from the URL. For more information, refer to [JavaScript SDK Cross-domain tracking](https://amplitude.com/docs/sdks/analytics/browser/browser-sdk-2#cross-domain-tracking).
{% /callout %}
Other auto-captured properties aren't affected by using LocalStorage instead of a cookie. For full detail, refer to [User property definitions](https://amplitude.com/docs/get-started/user-property-definitions).
This action disables cookie storage, but Amplitude stores the same data in the user's browser Local Storage. It isn't a valid option for a user that wants to fully opt out.
## Disable cookies and local storage / session storage (opt-out storage)
When you disable cookies and the user disables local storage and session storage, Amplitude creates a new `device_id` for that user on every visit because the SDK can't find an existing ID. If the user logs in or provides other identifying information, Amplitude's identity resolution system ties the various `device_id` values together with that user ID. The user must log in on each visit so Amplitude can merge identifiers.
## Disabling tracking (opt out tracking)
Users may want to opt out of cookies (which prevents Amplitude from storing any data in the cookie) and also opt out of tracking completely (which means Amplitude doesn't store events or records of their browsing history). The Amplitude SDK provides `optOut` to fulfill this request. To programmatically opt out of tracking, call `amplitude.setOptOut(true)`.
### "Do not track" setting on browsers (DNT flag)
Some browsers have a "Do not track" setting intended to block all tracking. Amplitude doesn't adhere to this setting. The DNT standard isn't widely supported, and the scope of what it disables isn't clear. To honor that setting, write your own code to test for the DNT flag and then set the `optOut` option in the SDK.
## Managing cookie consent
Some jurisdictions require users to consent to non-essential cookies before data collection. You're ultimately responsible for getting necessary consents and making necessary disclosures for the personal data you collect and send to Amplitude. You're also responsible for determining how you classify the Amplitude cookies in your cookie policy based on your specific use case and the jurisdictions in which you use them.
If you use the Amplitude SDK in one of these jurisdictions, don't initialize the SDK until the user consents to your use of cookies. The Amplitude functions (for example, cookie storage, local storage, and tracking events) are enabled or disabled at SDK initialization.
To support this, the JavaScript SDK offers a `deferInitialization` option (defaults to `null`). When set to `true`, this option disables the core SDK functions, including saving a cookie (or anything to local storage) and all tracking, until you explicitly enable them. The SDK instance loads without storage and tracking until you call `amplitude.getInstance().enableTracking()`.
When you call `amplitude.getInstance().enableTracking()`, the SDK sets `deferInitialization` to `false` and Amplitude creates the cookie with the options values you configured, as shown in [client.js](https://github.com/amplitude/Amplitude-JavaScript/blob/03c0a890d578db1ada383cf1e6195d71275bac44/src/amplitude-client.js#L2060):
```js
/**
* Enable tracking through logging events and dropping a cookie
* Intended to be used with the deferInitialization configuration flag
* This will drop a cookie and reset initialization deferred
* @public
*/
AmplitudeClient.prototype.enableTracking = function enableTracking() {
// This will call init (which drops the cookie) and will run any pending tasks
this._initializationDeferred = false;
f(this);
this.runQueuedFunctions();
};
/**
* Saves deviceId, userId, event meta data to amplitude cookie
* @private
*/
var _saveCookieData = function _saveCookieData(scope) {
const cookieData = {
deviceId: scope.options.deviceId,
userId: scope.options.userId,
optOut: scope.options.optOut,
sessionId: scope._sessionId,
lastEventTime: scope._lastEventTime,
eventId: scope._eventId,
identifyId: scope._identifyId,
sequenceNumber: scope._sequenceNumber,
};
if (scope._useOldCookie) {
scope.cookieStorage.set(
scope.options.cookieName + scope._storageSuffix,
cookieData,
);
} else {
scope._metadataStorage.save(cookieData);
}
};
```
This doesn't affect users who already have an Amplitude cookie, as shown in [amplitude-client.js](https://github.com/amplitude/Amplitude-JavaScript/blob/03c0a890d578db1ada383cf1e6195d71275bac44/src/amplitude-client.js#L140). At some point, the user provided consent, which is all Amplitude needs to create the cookie legitimately. To opt that user out of tracking, you must remove any Amplitude cookies that already exist for that user.
The presence of an Amplitude Analytics cookie determines whether Amplitude tracks a user's events. For users who have one, consider the following:
1. If you manually set `cookieExpiration` to a short lifespan, you may need to run `amplitude.getInstance().enableTracking()` when the Amplitude Analytics cookie expires or when the user logs in.
2. If the user removes all cookies, they see the consent banner again the next time they visit your app. Because no Amplitude Analytics cookie exists yet, the flow proceeds as described in the [Managing cookie consent](#managing-cookie-consent) section, and the initialization of storage and tracking options waits when you use `deferInitialization = true`.
3. If the user consented to the Amplitude Analytics cookie in the past and that consent has expired for any reason (website cookie deletion, consent tracking expired), Amplitude prompts the user for consent again. If the user declines, you **must** explicitly remove the Amplitude Analytics cookie. Otherwise, the SDK continues to collect the user's information against their will.
## Getting the SDK initialization options per project
From any site that uses the Amplitude JavaScript SDK, you can find which initialization options are set. Run the following command from the JavaScript console in the browser you use to access the site:
```js
amplitude.getInstance().options;
```
The console displays each option alongside its value. For example, on amplitude.com you may see the following.
### API options in Amplitude Event Explorer Chrome extension
If you use the Amplitude Event Explorer Chrome extension, you can access the initialization options values in the "API Options" tab after selecting the project you're interested in.
If the Amplitude object instance isn't stored in the `window` object, this information isn't available from the console or the Chrome extension. This usually happens when you use Node.js instead of the JavaScript SDK.
The error in the console appears like this.
### Storage options explained
This table gives a brief overview of each storage-related option.
| Option | Default Value | Definition |
| ---------------------- | ---------------------------------------- | ------------------------------------------------------------------------------------------------------------------------------------------------------------------------------------------------------------------------------------------------------------ |
| `cookieExpiration` | 365 | The number of days after which the Amplitude cookie expires. The default 12 months supports GDPR compliance. |
| `cookieForceUpgrade` | False | Forces SDK pre-v6.0.0 instances to adopt SDK post-v6.0.0 compatible cookie formats. |
| `deferInitialization` | Null | When `true`, disables the core functions of the SDK, including saving a cookie and all logging, until you explicitly enable them by calling `amplitude.getInstance().enableTracking()`. |
| `deviceIdFromUrlParam` | False | When `true`, the SDK parses device ID values from the URL parameter `amp_device_id` if available. This option supports cross-domain tracking. Device IDs defined in the configuration options during init take priority over device IDs from URL parameters. |
| `disableCookie` | False | Disables Amplitude cookies altogether. |
| `domain` | The top domain of the current page's URL | Sets a custom domain for the Amplitude cookie. To include subdomains, add a preceding period, for example, `.amplitude.com`. |
| `optOut` | False | Disables tracking for the current user. |
| `sameSiteCookie` | None | Sets the SameSite flag on the Amplitude cookie. Decides cookie privacy policy. |
| `saveEvents` | True | When `true`, the SDK saves events to local storage and removes them after successful upload. Without saving events, the SDK may lose them if the user navigates to another page before upload completes. |
| `savedMaxCount` | 1000 | Maximum number of events to save in Local Storage. If the SDK logs more events while offline, it removes the oldest events. |
| `secureCookie` | False | When `true`, the SDK sets the Amplitude cookie with the Secure flag. The Secure flag lets the browser send this cookie only on encrypted HTTPS transmissions. This ensures that your cookie isn't visible to an attacker in a man-in-the-middle attack. |
| `unsentIdentifyKey` | amplitude_unsent_identify | `localStorage` key that stores unsent identify calls. |
| `unsetKey` | amplitude_unsent | `localStorage` key that stores unsent events. |
## Abstraction layer for storage
You can find the storage abstraction layer, available options, and stored metadata in Amplitude's GitHub:
- [constants.js](https://github.com/amplitude/Amplitude-JavaScript/blob/master/src/constants.js)
- [options.js](https://github.com/amplitude/Amplitude-JavaScript/blob/master/src/options.js)
- [cookiestorage.js](https://github.com/amplitude/Amplitude-JavaScript/blob/master/src/cookiestorage.js)
- [cookie.js](https://github.com/amplitude/Amplitude-JavaScript/blob/master/src/cookie.js)
- [base-cookie.js](https://github.com/amplitude/Amplitude-JavaScript/blob/master/src/base-cookie.js)
- [localstorage.js](https://github.com/amplitude/Amplitude-JavaScript/blob/master/src/localstorage.js)
- [metadata-storage.js](https://github.com/amplitude/Amplitude-JavaScript/blob/master/src/metadata-storage.js)
The SDK sets the options at initialization. For cookie and metadata storage, this happens in the Init method for the Amplitude client:
- [amplitude-client.js](https://github.com/amplitude/Amplitude-JavaScript/blob/master/src/amplitude-client.js)
```js
this.options.apiKey = apiKey;
this._storageSuffix =
"_" +
apiKey +
(this._instanceName === Constants.DEFAULT_INSTANCE
? ""
: "_" + this._instanceName);
this._storageSuffixV5 = apiKey.slice(0, 6);
this._oldCookieName = this.options.cookieName + this._storageSuffix;
this._unsentKey = this.options.unsentKey + this._storageSuffix;
this._unsentIdentifyKey = this.options.unsentIdentifyKey + this._storageSuffix;
this._cookieName = Constants.COOKIE_PREFIX + "_" + this._storageSuffixV5;
this.cookieStorage.options({
expirationDays: this.options.cookieExpiration,
domain: this.options.domain,
secure: this.options.secureCookie,
sameSite: this.options.sameSiteCookie,
});
this._metadataStorage = new MetadataStorage({
storageKey: this._cookieName,
disableCookies: this.options.disableCookies,
expirationDays: this.options.cookieExpiration,
domain: this.options.domain,
secure: this.options.secureCookie,
sameSite: this.options.sameSiteCookie,
storage: this.options.storage,
});
const hasOldCookie = !!this.cookieStorage.get(this._oldCookieName);
const hasNewCookie = !!this._metadataStorage.load();
this._useOldCookie =
!hasNewCookie && hasOldCookie && !this.options.cookieForceUpgrade;
const hasCookie = hasNewCookie || hasOldCookie;
```
## Frequently asked questions
{% accordion title="Are Amplitude's cookies first-party or third-party cookies?" %}
Amplitude uses first-party cookies. From a technical standpoint, there's no difference between first-party and third-party cookies. The distinction relates to:
1. The context of a particular visit.
2. Who creates the cookie.
Every cookie has an owner, which is the domain defined in the cookie:
- **First-party cookies** come from a website that a user views directly. When a user lands on a website (for example, fit.amplitude.com), this site creates a cookie that the browser saves on the user's computer.
Amplitude works this way. When a customer adds the Amplitude JS SDK to their website, the customer (through their website) directly creates the cookie stored on the visitor's computer.
- **Third-party cookies** come from a different source than the website being visited. Imagine you're visiting fit.amplitude.com, and the site uses YouTube videos for virtual non-live classes. In this case, YouTube sets the cookie saved on the user's computer.
The website owner embeds code, provided by YouTube, so the videos play directly on fit.amplitude.com. When that YouTube code executes in the browser or the video loads, YouTube can track the player and put data in its cookies. This cookie qualifies as a third-party cookie because a different domain than fit.amplitude.com / amplitude.com creates it.
{% /accordion %}
{% accordion title="Will Google Chrome's plan to remove third party cookies affect Amplitude?" %}
No. As stated previously, Amplitude isn't a third-party cookie. Amplitude customers add Amplitude to their website or bundle themselves, and Amplitude sets the cookie in their own bundled code through `document.cookie`, so Amplitude has the privileges of a first-party cookie.
{% /accordion %}
{% accordion title="Why aren't Amplitude cookies marked as `HttpOnly`?" %}
The HttpOnly option exists so that `document.cookie` can't read cookies (because those cookies are only for client-server communication). Amplitude's cookies serve the opposite purpose: Amplitude needs to persist data specifically in the browser and to rest in `document.cookies`. Amplitude can't read from their server because Amplitude is client-side code.
If you're concerned that this renders the Amplitude cookie vulnerable to authentication information theft, you shouldn't be. Amplitude stores no authentication information in that cookie, so there's no danger of an XSS attack. The worst an attacker could do is steal Amplitude's cookie and take that user's device ID and user ID, which shouldn't be PII to begin with.
If this is still a serious concern for you, then you should probably disable Amplitude's cookies.
{% /accordion %}
{% accordion title="Why aren't Amplitude's cookies marked as secure?" %}
The Secure flag lets the browser send the cookie only on encrypted HTTPS transmissions. This ensures that your cookie isn't visible to an attacker in a man-in-the-middle attack. Amplitude has no authentication or sensitive information in that cookie, so Amplitude isn't in danger of an XSS attack. The worst an attacker could do is steal Amplitude's cookie and take that user's device ID and user ID.
For these reasons, Amplitude doesn't consider this a security vulnerability.
{% /accordion %}
{% accordion title="Will cookies cause unsent events to send to a project with a different API key?" %}
No. SDKs later than version 4.0.0 scope events stored in the unsent keys (local storage) by API key. If a product changes the project (or its API key) it sends events to, those old events don't reach the new project.
In SDK versions earlier than 4.0.0, the events didn't consider the API key when queued for retry. If the product still uses an old SDK version, old unsent events remaining in local storage reach the new project when the connection with Amplitude runs again. To mitigate this problem when you can't upgrade to a newer SDK version, use an instance name for the project instead of the default project. Use this to instantiate the Amplitude client: `amplitude.getInstance('ProjectName').init("API_KEY")`, and use this to log any event: `amplitude.getInstance(ProjectName).logEvent()`.
{% /accordion %}
{% accordion title="How do you integrate with third-party Consent Management Platforms?" %}
Websites and applications can use a consent management platform (CMP) to manage legal consent from users about collecting and processing their personal data through cookies and other trackers operating on the domain, as required by applicable privacy laws such as GDPR, CCPA, and ePrivacy. Examples of these tools include OneTrust, Axeptio, and Responsum.
Currently, Amplitude doesn't have a default integration with any of these tools. You must configure your CMP to pass the consent outcome to the Amplitude SDK so that any end user who hasn't provided consent or who has revoked consent (depending on the end user's jurisdiction) is opted out of tracking by the Amplitude SDK. The SDK as implemented on the customer's site or application must receive that signal to execute the `amplitude.getInstance().enableTracking()` method while using the SDK deferred initialization as described in [Managing cookie consent](#managing-cookie-consent).
{% /accordion %}
{% accordion title="Can I use OneTrust with Amplitude to stay GDPR compliant?" %}
Yes, you can use Amplitude with a CMP like OneTrust in a GDPR-compliant manner. Amplitude can't direct you on how to classify the Amplitude SDK or cookies. Instead, your privacy and legal teams should make this assessment based on the data you're collecting. Most customers, including in the EU, classify Amplitude cookies as Performance/Analytics cookies.
Customers may also implement through a server-side integration, bypassing Amplitude's cookies from the SDK. Customers who integrate through a server-side integration are still responsible for getting necessary consents and making necessary disclosures for the personal data they collect and send to Amplitude.
{% /accordion %}
{% accordion title="When a user opts out, how can I opt them in again?" %}
Besides the `amplitude.getInstance().enableTracking()` method discussed earlier, after a user opts out, you can opt them in programmatically by calling `amplitude.setOptOut(false)`. This sets the `optOut` option to `false`, resets the cookie with the new options, and enables tracking. You can find the following code in the Amplitude client:
```js
/**
* Sets whether to opt current user out of tracking.
* @public
* @param {boolean} enable - if true then no events will be logged or sent.
* @example: amplitude.setOptOut(true);
*/
AmplitudeClient.prototype.setOptOut = function setOptOut(enable) {
if (this._shouldDeferCall()) {
return this._q.push(
["setOptOut"].concat(Array.prototype.slice.call(arguments, 0)),
);
}
if (!utils.validateInput(enable, "enable", "boolean")) {
return;
}
try {
this.options.optOut = enable;
_saveCookieData(this);
} catch (e) {
utils.log.error(e);
}
};
```
{% /accordion %}
## CNIL France - Frequently asked questions
{% callout type="warning" heading="CNIL France FAQs" %}
CNIL FAQs aren't intended as legal or regulatory advice and don't constitute any warranty or contractual commitment from Amplitude. Amplitude encourages customers to seek independent legal advice on legal and regulatory obligations related to this subject matter.
{% /callout %}
{% accordion title="CNIL France - What is the CNIL cookie exemption?" %}
The CNIL (Commission Nationale Informatique & Libertés) is the French Data Protection Agency. As a general rule, the CNIL requires user consent before a website, mobile application, or other connected device can use cookies. The CNIL allows a limited exemption for cookies that collect only anonymous, aggregated statistical data used to measure website traffic or performance. You can't combine data collected from these cookies with other data or use it to identify users.
{% /accordion %}
{% accordion title="CNIL France - What does the CNIL cookie exemption really mean?" %}
The CNIL maintains a list of services that can run under the exemption. Any use of an analytics service under the CNIL exemption is subject to the following limitations:
1. Analytics cookies can ONLY be placed without asking for user consent if they collect ONLY anonymous statistical data for audience measurement (overall traffic, page views).
2. This doesn't mean a customer can collect ALL data about a user for analysis.
3. Under the exemption, customers can't use or create "user" analyses.
{% /accordion %}
{% accordion title="CNIL France - What does the CNIL exemption mean for Amplitude and our cookies?" %}
The CNIL allows a limited exemption for the requirement that companies obtain user consent for any non-essential cookies. In general, this exemption applies to analytics cookies for the limited purpose of audience measurement of an app or site, and it's limited to anonymous tracers.
A customer's use of an analytics service under the exemption is therefore very limited. Without the CNIL cookie exemption, customers might only collect and measure part of their traffic. The power of the limited data set in Amplitude (for example, the data set with just the users that opt in or consent) is more valuable than the limited data collected under the exemption, because:
- Audience measurement (page views, overall sessions) doesn't help customers make better decisions; behavioral analytics guide actions and learning.
- Amplitude doesn't need 100% of traffic to derive meaningful insights.
- Most exempted tools don't have the analytics capabilities of Amplitude.
Besides using the SDKs, customers can send data to Amplitude server-side. This doesn't require customers to obtain consent for a separate Amplitude SDK cookie. Customers who integrate through a server-side integration are still responsible for getting necessary consents and making necessary disclosures for the personal data they collect and send to Amplitude.
{% /accordion %}
{% accordion title="CNIL France - 13-month cookie limit" %}
The Amplitude SDK has a [`cookieExpiration` option](#expiration-time) that lets customers set the number of days a cookie lives. It defaults to 1 year as of the current version. Most browsers limit the lifetime of cookies set through `document.cookie` to between 1 and 7 days by default.
{% /accordion %}
{% accordion title="CNIL France - 25-month data retention max" %}
Use [Amplitude's Time to Live](https://amplitude.com/docs/data/time-to-live) functionality to set a retention schedule for event data.
{% /accordion %}
{% accordion title="CNIL France - Purpose strictly limited to the sole measurement of the site's or application's audience" %}
On the requirement of having a purpose strictly limited to the sole measurement of the site's or application's audience (performance measurement, detection of browsing problems, optimization of technical performance or its ergonomics, estimation of the power of the servers required, analysis of contents consulted), for the exclusive account of the publisher, Amplitude customers fully control the data they choose to send to the Amplitude platform. Customers can send only Amplitude events related to audience measurement and page views.
{% /accordion %}
{% accordion title="CNIL France - Only serve to produce anonymous statistical data" %}
Before you start using Amplitude to produce anonymous statistical data:
- [Contact Amplitude](https://amplitude.zendesk.com/hc/en-us/requests/new) to:
- Request that the SDK drop IP addresses for projects that contain end users that haven't provided consent.
- Discuss disabling Amplitude's User Look-Up and the ability to view user streams for projects that contain data for end users that haven't provided consent.
- Discuss the most effective configuration options for your use case.
- Ensure you don't send `deviceID` to Amplitude for end users that haven't provided consent.
- For end users that haven't provided consent, set a `userID` that's randomly generated or hashed.
- Consider disabling the ability to filter end users at the individual level by hiding user properties such as `userID`, `deviceID`, and `Amplitude ID`. Refer to [Transformations](https://amplitude.com/docs/data/transformations) for more information.
- Consider disabling user downloads. Refer to [Managing Projects](https://amplitude.com/docs/admin/account-management/manage-orgs-projects) for more information.
{% /accordion %}
{% accordion title="CNIL France - Compliant with GDPR" %}
Amplitude's privacy program is based on privacy-by-design principles. Amplitude's privacy program complies with relevant domestic and international privacy regulations and laws for processing personal data, including GDPR.
Amplitude offers customers the choice of hosting their data in the US-West based AWS environment or the EU based AWS environment. To ensure that Amplitude's customers can respond to and comply with end-user data deletion requests required by global privacy laws such as GDPR, Amplitude built an API endpoint that lets customers programmatically submit requests to delete all data for a set of known Amplitude IDs or User IDs. For more details, refer to the [User Privacy API](https://amplitude.com/docs/apis/analytics/user-privacy) developer documentation.
You can complete Data Subject Access Requests (DSARs) through the [DSAR API](https://amplitude.com/docs/apis/analytics/ccpa-dsar), which makes it easy to retrieve all data about a single user.
For more information on Amplitude's stance on privacy and security, refer to the [Amplitude trust page](https://amplitude.com/trust).
{% /accordion %}
{% accordion title="CNIL France - Cookies must not lead to a cross-checking of the data with other processing or that data be passed on to third parties." %}
Amplitude doesn't export data unless the customer chooses to export data to third-party products. Customers shouldn't use Amplitude to export data related to end users that haven't provided consent to third-party products.
On request, Amplitude can disable its cohort syncing and data streaming capabilities for orgs that contain only data for end users that haven't provided consent.
{% /accordion %}
{% accordion title="CNIL France - Cookies must not allow the global follow-up" %}
The CNIL exemption states that cookies must not allow the global follow-up of the navigation of the person using different applications or browsing on different websites. The exemption excludes any solution that uses the same identifier across multiple sites (for example, through cookies placed on a third-party domain loaded by multiple sites) to cross-reference, duplicate, or measure a unified reach for content.
To comply with this requirement, customers shouldn't use Amplitude's [cross-domain tracking](https://amplitude.com/docs/sdks/analytics/browser/browser-sdk-2#cross-domain-tracking) and should use [separate platform instrumentation](https://amplitude.com/docs/get-started/cross-platform-vs-separate-platform) for any projects with data from end users that haven't provided consent. By default, Amplitude doesn't use cross-domain tracking for customers.
{% /accordion %}
{% accordion title="CNIL France - The data is collected, processed and stored independently for each publisher" %}
In Amplitude, customer data is logically separated and stored in encrypted form in Amplitude's AWS environment.
{% /accordion %}
{% accordion title="CNIL France - The trackers are completely independent of each other and of any other tracker" %}
The cookie used by the Amplitude SDK is a [first-party cookie](#frequently-asked-questions). The customer collects any data the cookie collects as the controller of the data. Amplitude only processes the customer's data as a processor or service provider and doesn't use customer data for its own purposes.
{% /accordion %}
================================================================================
# Android
URL: https://amplitude.com/docs/sdks/analytics/android
================================================================================
# Android
The Kotlin Android SDK lets you send events to Amplitude.
## Configure the SDK
{% accordion title="Configuration Options" %}
| Name | Description | Default Value |
| --- | --- | --- |
| `deviceId` | `String?`. The device ID to use for this device. If you don't provide a device ID, the SDK generates one automatically. | `null` |
| `flushIntervalMillis` | `Int`. The amount of time the SDK waits before it uploads unsent events to the server or reaches the `flushQueueSize` threshold. The value is in milliseconds. | `30000` |
| `flushQueueSize` | `Int`. The SDK uploads events when the unsent event count exceeds this threshold or when it reaches the `flushIntervalMillis` interval. | `30` |
| `flushMaxRetries` | `Int`. Maximum retry times. | `5` |
| `minIdLength` | `Int`. The minimum length for user id or device id. | `5` |
| `partnerId` | `Int`. The partner id for partner integration. | `null` |
| `identifyBatchIntervalMillis` | `Long`. The amount of time the SDK batches intercepted identify events. The value is in milliseconds. | `30000` |
| `flushEventsOnClose` | `Boolean`. Flushing of unsent events on app close. | `true` |
| `callback` | `EventCallBack`. Callback function after event sent. | `null` |
| `optOut` | `Boolean`. Opt the user out of tracking. | `false` |
| `trackingSessionEvents` | `Boolean`. Deprecated. Automatic tracking of "Start Session" and "End Session" events that count toward event volume. | `false` |
| `defaultTracking` | `DefaultTrackingOptions`. Options to control the default events tracking. | Refer to [Tracking default events](#tracking-default-events) |
| `minTimeBetweenSessionsMillis` | `Long`. The amount of time for session timeout. The value is in milliseconds. | `300000` |
| `serverUrl` | `String`. The server url events upload to. | `https://api2.amplitude.com/2/httpapi` |
| `serverZone` | `ServerZone.US` or `ServerZone.EU`. The server zone to send to. The SDK adjusts the server URL based on this configuration. | `ServerZone.US` |
| `useBatch` | `Boolean` Whether to use batch api. | `false` |
| `useAdvertisingIdForDeviceId` | `Boolean`. Whether to use advertising id as device id. For the required module and permission, refer to the [advertiser ID documentation](https://amplitude.com/docs/sdks/analytics/android/android-kotlin-sdk#advertiser-id). | `false` |
| `useAppSetIdForDeviceId` | `Boolean`. Whether to use app set id as device id. For the required module and permission, refer to the [app set ID documentation](https://amplitude.com/docs/sdks/analytics/android/android-kotlin-sdk#app-set-id). | `false` |
| `trackingOptions` | `TrackingOptions`. Options to control the values tracked in SDK. | `enable` |
| `enableCoppaControl` | `Boolean`. Whether to enable COPPA control for tracking options. | `false` |
| `instanceName` | `String`. The name of the instance. Instances with the same name share storage and identity. For isolated storage and identity, use a unique `instanceName` for each instance. | `$default_instance` |
| `migrateLegacyData` | `Boolean`. Available in `1.9.0`+. Whether to migrate [maintenance Android SDK](https://amplitude.com/docs/sdks/analytics/android/android-sdk) data (events, user/device ID). For more information, refer to [`RemnantDataMigration.kt`](https://github.com/amplitude/Amplitude-Kotlin/blob/main/android/src/main/java/com/amplitude/android/migration/RemnantDataMigration.kt#L9-L16). | `true` |
| `offline` | `Boolean | AndroidNetworkConnectivityCheckerPlugin.Disabled`. Whether the SDK has a network connection. | `false` |
| `storageProvider` | `StorageProvider`. Implements `StorageProvider` interface to store events. | `AndroidStorageProvider` |
| `identifyInterceptStorageProvider` | `StorageProvider`. Implements `StorageProvider` interface for identify event interception and volume optimization. | `AndroidStorageProvider` |
| `identityStorageProvider` | `IdentityStorageProvider`. Implements `IdentityStorageProvider` to store user id and device id. | `FileIdentityStorageProvider` |
| `loggerProvider` | `LoggerProvider`. Implements `LoggerProvider` interface to emit log messages to your chosen destination. | `AndroidLoggerProvider` |
| `newDeviceIdPerInstall` | Whether to generate a different device id on each app install, regardless of device. This is a legacy configuration that maintains compatibility with the old Android SDK. It works the same as `useAdvertisingIdForDeviceId`. | `false` |
| `locationListening` | Whether to enable Android location service. | `true` |
{% /accordion %}
### Configure batching behavior
To support high-performance environments, the SDK sends events in batches. The SDK queues every event that the `track` method logs in memory, then flushes events in batches in the background. To customize batch behavior, set `flushQueueSize` and `flushIntervalMillis`. By default, `serverUrl` is `https://api2.amplitude.com/2/httpapi`. To send large batches of data at a time, set `useBatch` to `true`. Setting `useBatch` to `true` directs `setServerUrl` to the batch event upload API at `https://api2.amplitude.com/batch`. Both regular mode and batch mode use the same event upload threshold and flush time intervals.
{% code-group %}
```kotlin Kotlin
import com.amplitude.android.Amplitude
val amplitude = Amplitude(
Configuration(
apiKey = AMPLITUDE_API_KEY,
context = applicationContext,
flushIntervalMillis = 50000,
flushQueueSize = 20,
)
)
```
```java Java
import com.amplitude.android.Amplitude;
Configuration configuration = new Configuration(AMPLITUDE_API_KEY, getApplicationContext());
configuration.setFlushIntervalMillis(1000);
configuration.setFlushQueueSize(10);
Amplitude amplitude = new Amplitude(configuration);
```
{% /code-group %}
================================================================================
# Android-Kotlin SDK
URL: https://amplitude.com/docs/sdks/analytics/android/android-kotlin-sdk
================================================================================
# Android-Kotlin SDK
The Kotlin Android SDK lets you send events to Amplitude.
{% accordion title="Recent features" %}
- Frustration Analytics (v1.22.0+): Automatically detect and track rage clicks and dead clicks to identify areas of user frustration in your app. Configure tracking for both Android Views and Jetpack Compose, with options to [ignore specific elements](#ignore-specific-elements-from-frustration-analytics). Refer to [Track frustration interactions](#track-frustration-interactions).
- Network Tracking Plugin (v1.21.0+): Track network requests and responses through OkHttp, including request/response sizes, status codes, and timing information. Requires manual integration as an OkHttp interceptor. Refer to [Network Tracking Plugin](#network-tracking-plugin).
- Enhanced Jetpack Compose support (v1.21.3+): Full autocapture support for all clickable Compose elements with improved element identification. Refer to [Track element interactions](#track-element-interactions).
- Element Interactions Autocapture (v1.17.0+): Track user interactions with clickable UI elements in both Android Views and Jetpack Compose automatically. Refer to [Track element interactions](#track-element-interactions).
- Fragment Autocapture (v1.18.0+): Automatically capture fragment views with detailed fragment properties including class, identifier, and tag. Refer to [Track screen views](#track-screen-views).
- Advanced Identify operations: Full support for user property operations including `clearAll()` to remove all user properties. Refer to [Identify](#identify).
{% callout type="note" heading="Location tracking default change" %}
As of v1.20.7, the SDK disables location tracking by default. Set the `locationListening` option to `true` to track location data. Refer to [Location tracking](#location-tracking).
{% /callout %}
{% /accordion %}
## System requirements
The Android Kotlin SDK supports Android API level 21 (Android 5.0 Lollipop) and higher.
## Install the SDK
Amplitude recommends using Android Studio as an IDE and Gradle to manage dependencies.
{% tabs tabs="Gradle, Maven" %}
{% tab name="Gradle" %}
If you use Gradle in your project, add the following dependency to `build.gradle`, and sync your project with the updated file.
```groovy
dependencies {
implementation 'com.amplitude:analytics-android:1.+'
}
```
{% /tab %}
{% tab name="Maven" %}
If you use Maven in your project, the .jar is available on Maven Central with the following configuration in `pom.xml`.
```xml
com.amplitudeanalytics-android[1.0,2.0]
```
{% /tab %}
{% /tabs %}
## Configure the SDK
{% accordion title="Configuration options" %}
| Name | Description | Default Value |
| ---------------------------------------------------------------------------------- | ------------------------------------------------------------------------------------------------------------------------------------------------------------------------------------------------------------------------------------------------------------------------------------------------------------------------ | ------------------------------------------------------------------------------------------------------------------------------------------------- |
| `deviceId` | `String?`. The device ID to use for this device. If no deviceID is provided, the SDK generates one automatically. Learn more in [Device ID lifecycle](#device-id-lifecycle). | `null` |
| `flushIntervalMillis` | `Int`. The amount of time the SDK waits before attempting to upload unsent events to the server or reach the `flushQueueSize` threshold. The value is in milliseconds. | `30000` |
| `flushQueueSize` | `Int`. The SDK attempts to upload after the unsent event count exceeds the event upload threshold or reaches the `flushIntervalMillis` interval. | `30` |
| `flushMaxRetries` | `Int`. Maximum retry times. | `5` |
| `minIdLength` | `Int?`. The minimum length for user id or device id. When unset, the server enforces a minimum of 5 characters. | `null` |
| `partnerId` | `String?`. The partner id for partner integration. | `null` |
| `identifyBatchIntervalMillis` | `Long`. The amount of time the SDK waits before batching intercepted identify events. The value is in milliseconds. | `30000` |
| `flushEventsOnClose` | `Boolean`. Flushing of unsent events on app close. | `true` |
| `callback` | `EventCallBack`. Callback function after event sent. | `null` |
| `optOut` | `Boolean`. Opt the user out of tracking. | `false` |
| ~`trackingSessionEvents`~ (Deprecated. Use [`autocapture`](#autocapture) instead.) | `Boolean`. Automatic tracking of "Start Session" and "End Session" events that count toward event volume. | `true` |
| ~`defaultTracking`~ (Deprecated. Use [`autocapture`](#autocapture) instead.) | `DefaultTrackingOptions`. Enable tracking of default events for sessions, app lifecycles, screen views, and deep links. | `DefaultTrackingOptions(sessions = true)` |
| `autocapture` | `Set`. A `Set` of Options to enable tracking of default events for sessions, application lifecycles, screen and fragment views, deep links, and element interactions. | If the parameter isn't set, `AutocaptureOption.SESSIONS` is added to the `Set` by default. For more information, refer to [Autocapture](#autocapture). |
| `interactionsOptions` | `InteractionsOptions`. Configuration for granular control over frustration interaction tracking types (rage clicks and dead clicks). | `InteractionsOptions(rageClick = RageClickOptions(enabled = true), deadClick = DeadClickOptions(enabled = true))` |
| `minTimeBetweenSessionsMillis` | `Long`. The amount of time for session timeout. The value is in milliseconds. | `300000` |
| `sessionId` | `Long?`. Initial session ID to use. If not set, session management handles ID generation automatically. | `null` |
| `serverUrl` | `String`. The server url events upload to. | `https://api2.amplitude.com/2/httpapi` |
| `serverZone` | `ServerZone.US` or `ServerZone.EU`. The server zone to send to. The SDK adjusts the server URL based on this config. | `ServerZone.US` |
| `httpClient` | `HttpClientInterface?`. Custom HTTP client implementation for event uploads. Implement the `HttpClientInterface` to use your own HTTP client. | `null` |
| `useBatch` | `Boolean` Whether to use batch API. | `false` |
| `useAdvertisingIdForDeviceId` | `Boolean`. Whether to use advertising id as device id. For more information, refer to [Advertiser ID](#advertiser-id) for required module and permission. | `false` |
| `useAppSetIdForDeviceId` | `Boolean`. Whether to use app set id as device id. For more information, refer to [Application ID](#app-set-id) for required module and permission. | `false` |
| `trackingOptions` | `TrackingOptions`. Options to control the values tracked in SDK. | `enable` |
| `enableCoppaControl` | `Boolean`. Whether to enable COPPA control for tracking options. | `false` |
| `instanceName` | `String`. The name of the instance. Instances with the same name share storage and identity. For isolated storage and identity, use a unique `instanceName` for each instance. | `$default_instance` |
| `migrateLegacyData` | `Boolean`. Available in `1.9.0`+. Whether to migrate [maintenance Android SDK](https://amplitude.com/docs/sdks/analytics/android/android-sdk) data (events, user/device ID). For more information, refer to the [Amplitude-Kotlin RemnantDataMigration source](https://github.com/amplitude/Amplitude-Kotlin/blob/main/android/src/main/java/com/amplitude/android/migration/RemnantDataMigration.kt#L9-L16). | `true` |
| `offline` | `Boolean \| AndroidNetworkConnectivityCheckerPlugin.Disabled`. Whether the SDK is connected to network. For more information, refer to [Offline mode](#offline-mode). | `false` |
| `storageProvider` | `StorageProvider`. Implements `StorageProvider` interface to store events. | `AndroidStorageProvider` |
| `identifyInterceptStorageProvider` | `StorageProvider`. Implements `StorageProvider` interface for identify event interception and volume optimization. | `AndroidStorageProvider` |
| `identityStorageProvider` | `IdentityStorageProvider`. Implements `IdentityStorageProvider` to store user id and device id. | `FileIdentityStorageProvider` |
| `loggerProvider` | `LoggerProvider`. Implements the `LoggerProvider` interface to emit log messages to the destination you choose. | `AndroidLoggerProvider` |
| `newDeviceIdPerInstall` | Whether to generate a different device id every time the app is installed, regardless of devices. This legacy configuration exists to keep compatibility with the old Android SDK. It works the same as `useAdvertisingIdForDeviceId`. | `false` |
| `locationListening` | `Boolean`. Whether to enable Android location service. For more information, refer to [Location tracking](#location-tracking). | `false` |
| `enableAutocaptureRemoteConfig` | `Boolean`. Whether to enable remote configuration for autocapture options. | `true` |
| `enableDiagnostics` | `Boolean`. Whether to send SDK diagnostic information to Amplitude to help improve the SDK. | `true` |
| `enableRequestBodyCompression` | `Boolean`. Whether to gzip the request body. Only applies when you set a custom `serverUrl`; the SDK's default endpoints always compress request bodies. | `false` |
{% /accordion %}
### Configure batching behavior
To support high-performance environments, the SDK sends events in batches. The SDK queues every event logged by the `track` method in memory and flushes them in batches in the background. Customize batch behavior with `flushQueueSize` and `flushIntervalMillis`. By default, `serverUrl` is `https://api2.amplitude.com/2/httpapi`. To send large batches of data at a time, set `useBatch` to `true` to set `setServerUrl` to the batch event upload API `https://api2.amplitude.com/batch`. Both regular mode and batch mode use the same event upload threshold and flush time intervals.
{% code-group %}
```kotlin Kotlin
import com.amplitude.android.Amplitude
val amplitude = Amplitude(AMPLITUDE_API_KEY, applicationContext) {
flushIntervalMillis = 50000
flushQueueSize = 20
}
```
```java Java
import com.amplitude.android.Amplitude;
Configuration configuration = new Configuration(AMPLITUDE_API_KEY, getApplicationContext());
configuration.setFlushIntervalMillis(1000);
configuration.setFlushQueueSize(10);
Amplitude amplitude = new Amplitude(configuration);
```
{% /code-group %}
### EU data residency
Configure the server zone when initializing the client to send data to Amplitude's EU servers. The SDK sends data based on the server zone if you set it.
{% callout type="note" heading="" %}
For EU data residency, set up the project inside Amplitude EU. Initialize the SDK with the API key from Amplitude EU.
{% /callout %}
{% code-group %}
```kotlin Kotlin
import com.amplitude.android.Amplitude
val amplitude = Amplitude(AMPLITUDE_API_KEY, applicationContext) {
serverZone = ServerZone.EU
}
```
```java Java
import com.amplitude.android.Amplitude;
Configuration configuration = new Configuration(AMPLITUDE_API_KEY, getApplicationContext());
configuration.setServerZone(ServerZone.EU);
Amplitude amplitude = new Amplitude(configuration);
```
{% /code-group %}
### Custom HTTP client
The SDK uses `HttpURLConnection` by default for network requests. To use a custom HTTP client, implement `HttpClientInterface` and pass it to the `httpClient` configuration option.
#### OkHttp with gzip compression
The sample app demonstrates how to create a custom OkHttp client with gzip compression for event uploads:
- [GzipRequestInterceptor](https://github.com/amplitude/Amplitude-Kotlin/blob/main/samples/kotlin-android-app/src/main/java/com/amplitude/android/sample/GzipRequestInterceptor.kt) - OkHttp interceptor that compresses request bodies.
- [CustomOkHttpClient](https://github.com/amplitude/Amplitude-Kotlin/blob/main/samples/kotlin-android-app/src/main/java/com/amplitude/android/sample/CustomOkHttpClient.kt) - `HttpClientInterface` implementation using OkHttp.
To use the custom client:
{% code-group %}
```kotlin Kotlin
val httpClient = CustomOkHttpClient()
val amplitude = Amplitude(AMPLITUDE_API_KEY, applicationContext) {
this.httpClient = httpClient
}
httpClient.initialize(amplitude.configuration)
```
```java Java
CustomOkHttpClient httpClient = new CustomOkHttpClient();
Configuration configuration = new Configuration(AMPLITUDE_API_KEY, getApplicationContext());
configuration.setHttpClient(httpClient);
Amplitude amplitude = new Amplitude(configuration);
httpClient.initialize(configuration);
```
{% /code-group %}
{% callout type="note" heading="" %}
The SDK's default HTTP client already compresses request bodies using gzip. Use a custom OkHttp client when you need additional features like custom timeouts, certificate pinning, or logging interceptors.
{% /callout %}
## Track
Events represent how users interact with your application. For example, "Song Played" may be an action you want to note.
```kotlin
amplitude.track("Song Played")
```
You can also optionally include event properties.
```kotlin
amplitude.track(
"Song Played",
mutableMapOf("title" to "Happy Birthday")
)
```
For more complex events you can [create and track a `BaseEvent` object](https://github.com/amplitude/Amplitude-Kotlin/blob/8c3c39ce1f79485a0ce716bbf01de464a9afe9a8/core/src/main/java/com/amplitude/core/Amplitude.kt#L112).
```kotlin
var event = BaseEvent()
event.eventType = "Song Played"
event.eventProperties = mutableMapOf("title" to "Happy Birthday")
event.groups = mutableMapOf("test-group-type" to "test-group-value")
event.insertId = 1234
amplitude.track(event)
```
## Identify
{% callout type="note" heading="" %}
Starting in release v1.7.0, the SDK batches `identify` events that contain only `set` operations. This batching reduces the number of sent events and doesn't affect how `set` operations run. Use the `identifyBatchIntervalMillis` configuration setting to manage the interval at which the SDK flushes batched identify intercepts.
{% /callout %}
Identify sets the user properties of a particular user without sending any event. The SDK supports the operations `set`, `setOnce`, `unset`, `add`, `append`, `prepend`, `preInsert`, `postInsert`, `remove`, and `clearAll` on individual user properties. Use the Identify interface to declare the operations. You can chain multiple operations in a single Identify object, then pass the Identify object to the Amplitude client to send to the server.
{% callout type="note" heading="" %}
If you send the Identify call after the event, the results of operations appear immediately in the dashboard user's profile area, but they don't appear in chart results until the SDK sends another event after the Identify call. The identify call only affects events going forward.
{% /callout %}
Use the identify methods to handle a user's identity. Proper use of these methods connects events to the correct user as they move across devices, browsers, and other platforms. Send an identify call containing those user property operations to the Amplitude server to tie a user's events to specific user properties.
```kotlin
val identify = Identify()
identify.set("color", "green")
amplitude.identify(identify)
```
### Identify operations
The `Identify` object supports the following operations:
| Operation | Description |
| ------------ | ------------------------------------------------------------------------------------------------ |
| `set` | Sets the value of a user property. Overwrites existing values. |
| `setOnce` | Sets the value of a user property only once. Subsequent calls don't overwrite the initial value. |
| `add` | Adds a numeric value to a numeric user property. |
| `append` | Appends a value to a user property array. |
| `prepend` | Prepends a value to a user property array. |
| `preInsert` | Adds a value to the beginning of a user property array if it doesn't already exist in the array. |
| `postInsert` | Adds a value to the end of a user property array if it doesn't already exist in the array. |
| `remove` | Removes a value from a user property array. |
| `unset` | Removes a user property. |
| `clearAll` | Clears all user properties. |
{% code-group %}
```kotlin Kotlin
val identify = Identify()
identify
.set("color", "green")
.setOnce("initial_source", "organic")
.add("login_count", 1)
.append("visited_pages", "home")
.prepend("notifications", "new_feature")
.unset("temporary_property")
amplitude.identify(identify)
```
```java Java
Identify identify = new Identify();
identify
.set("color", "green")
.setOnce("initial_source", "organic")
.add("login_count", 1)
.append("visited_pages", "home")
.prepend("notifications", "new_feature")
.unset("temporary_property");
amplitude.identify(identify);
```
{% /code-group %}
### Clear all user properties
Use `clearAll()` to clear all user properties for the current user. This operation is irreversible.
{% callout type="warning" heading="Use with caution" %}
The `clearAll()` operation removes all user properties. This action is permanent. You can't undo it.
{% /callout %}
{% code-group %}
```kotlin Kotlin
val identify = Identify()
identify.clearAll()
amplitude.identify(identify)
```
```java Java
Identify identify = new Identify();
identify.clearAll();
amplitude.identify(identify);
```
{% /code-group %}
## Autocapture
Starting from release v1.18.0, the SDK can track more events without manual instrumentation. Configure the SDK to track the following events automatically:
- Sessions.
- App lifecycles.
- Screen views.
- Deep links.
- Element interactions.
- Frustration interactions:
- Rage clicks.
- Dead clicks.
{% accordion title="Autocapture options" %}
| Name | Type | Enabled by default | Description |
| ---------------------- | ------------------- | ------------------ | -------------------------------------------------------------------------------------------------------------------------------------------------------------------------------------------------------------------------------------------------------------------------------------------------------------------------------------------------------------------------------------------------------------------------------------------------------------- |
| `SESSIONS` | `AutocaptureOption` | Yes | Enables session tracking. When the option is set, Amplitude tracks session start and session end events. Otherwise, Amplitude doesn't track session events. When you don't set this option, Amplitude tracks `sessionId` only. Refer to [Track sessions](#track-sessions) for more information. |
| `APP_LIFECYCLES` | `AutocaptureOption` | No | Enables application lifecycle events tracking. If the option is set, Amplitude tracks application installed, application updated, application opened, and application backgrounded events. Tracked event properties include: `[Amplitude] Version`, `[Amplitude] Build`, `[Amplitude] Previous Version`, `[Amplitude] Previous Build`, `[Amplitude] From Background`. Refer to [Track application lifecycles](#track-application-lifecycles) for more information. |
| `SCREEN_VIEWS` | `AutocaptureOption` | No | Enables screen and fragment views tracking. If the option is set, Amplitude tracks screen viewed and fragment viewed events. Tracked event properties include: `[Amplitude] Screen Name`, `[Amplitude] Fragment Class`, `[Amplitude] Fragment Identifier`, `[Amplitude] Fragment Tag`. Refer to [Track screen views](#track-screen-views) for more information. |
| `DEEP_LINKS` | `AutocaptureOption` | No | Enables deep link tracking. If the option is set, Amplitude tracks deep link opened events. Tracked event properties include: `[Amplitude] Link URL`, `[Amplitude] Link Referrer`. Refer to [Track deep links](#track-deep-links) for more information. |
| `ELEMENT_INTERACTIONS` | `AutocaptureOption` | No | Enables element interaction tracking. If the option is set, Amplitude tracks user interactions with clickable elements. Tracked event properties include: `[Amplitude] Action`, `[Amplitude] Target Class`, `[Amplitude] Target Resource`, `[Amplitude] Target Tag`, `[Amplitude] Target Source`, `[Amplitude] Hierarchy`, `[Amplitude] Screen Name`. Refer to [Track element interactions](#track-element-interactions) for more information. |
| `FRUSTRATION_INTERACTIONS` | `AutocaptureOption` | No | Enables frustration interaction tracking. When you enable the option, Amplitude tracks frustration interactions (rage clicks and dead clicks) with clickable UI elements. Rage clicks generate the `[Amplitude] Rage Click` event, and dead clicks generate the `[Amplitude] Dead Click` event. Refer to [Track frustration interactions](#track-frustration-interactions) for more information. |
{% /accordion %}
Configure Amplitude to start tracking Autocapture events. Otherwise, omit the configuration to keep only session tracking enabled.
{% tabs tabs="Kotlin, Java" %}
{% tab name="Kotlin" %}
The `autocapture` configuration accepts a `Set` of `AutocaptureOption` values. To create the Autocapture options, use the `autocaptureOptions` helper function and add the options to the set with a unary plus sign (`+`) before each option.
```kotlin
import com.amplitude.android.Amplitude
val amplitude = Amplitude(AMPLITUDE_API_KEY, applicationContext) {
autocapture = autocaptureOptions {
+sessions // or `+AutocaptureOption.SESSIONS`
+appLifecycles // or `+AutocaptureOption.APP_LIFECYCLES`
+deepLinks // or `+AutocaptureOption.DEEP_LINKS`
+screenViews // or `+AutocaptureOption.SCREEN_VIEWS`
+elementInteractions // or `+AutocaptureOption.ELEMENT_INTERACTIONS`
+frustrationInteractions // or `+AutocaptureOption.FRUSTRATION_INTERACTIONS`
}
}
```
To enable all autocapture options, use `AutocaptureOption.ALL` or the `addAll()` method:
```kotlin
import com.amplitude.android.Amplitude
import com.amplitude.android.AutocaptureOption
// Using AutocaptureOption.ALL constant
val amplitude = Amplitude(AMPLITUDE_API_KEY, applicationContext) {
autocapture = AutocaptureOption.ALL
}
// Or using addAll() method with builder
val amplitude = Amplitude(AMPLITUDE_API_KEY, applicationContext) {
autocapture = autocaptureOptions {
addAll()
}
}
```
By default, if you don't explicitly set the `autocapture` configuration during initialization, `configuration.autocapture` automatically includes `AutocaptureOption.SESSIONS`.
To prevent automatic session event capture, set `autocapture` without the `AutocaptureOption.SESSIONS` option.
```kotlin
import com.amplitude.android.Amplitude
val amplitude = Amplitude(AMPLITUDE_API_KEY, applicationContext) {
autocapture = setOf(AutocaptureOption.APP_LIFECYCLES) // or use `setOf()` to disable autocapture.
}
```
{% /tab %}
{% tab name="Java" %}
The `autocapture` configuration accepts a `Set` of `AutocaptureOption` values.
```java
import com.amplitude.android.Amplitude;
import java.util.Arrays;
Configuration configuration = new Configuration(AMPLITUDE_API_KEY, getApplicationContext());
configuration.getAutocapture().addAll(Arrays.asList(
AutocaptureOption.SESSIONS,
AutocaptureOption.APP_LIFECYCLES,
AutocaptureOption.DEEP_LINKS,
AutocaptureOption.SCREEN_VIEWS,
AutocaptureOption.ELEMENT_INTERACTIONS,
AutocaptureOption.FRUSTRATION_INTERACTIONS
));
Amplitude amplitude = new Amplitude(configuration);
```
To enable all autocapture options, use `AutocaptureOption.ALL`:
```java
import com.amplitude.android.Amplitude;
import com.amplitude.android.AutocaptureOption;
Configuration configuration = new Configuration(AMPLITUDE_API_KEY, getApplicationContext());
configuration.getAutocapture().addAll(AutocaptureOption.ALL);
Amplitude amplitude = new Amplitude(configuration);
```
By default, if you don't explicitly set the `autocapture` configuration during `Configuration` initialization, `configuration.getAutocapture()` automatically includes `AutocaptureOption.SESSIONS`.
To prevent automatic session event capture, remove the `AutocaptureOption.SESSIONS` option from `autocapture`.
```java
import com.amplitude.android.Amplitude;
Configuration configuration = new Configuration(AMPLITUDE_API_KEY, getApplicationContext());
configuration.getAutocapture().remove(AutocaptureOption.SESSIONS);
Amplitude amplitude = new Amplitude(configuration);
```
{% /tab %}
{% /tabs %}
### Track sessions
Amplitude enables session tracking by default. Include `AutocaptureOption.SESSIONS` in the `autocapture` configuration to explicitly configure the SDK to track session events, or to enable session event tracking along with other Autocapture configurations.
{% code-group %}
```kotlin Kotlin
import com.amplitude.android.Amplitude
val amplitude = Amplitude(AMPLITUDE_API_KEY, applicationContext) {
autocapture = autocaptureOptions {
+sessions // or `+AutocaptureOption.SESSIONS`
}
}
```
```java Java
import com.amplitude.android.Amplitude;
Configuration configuration = new Configuration(AMPLITUDE_API_KEY, getApplicationContext());
// `AutocaptureOption.SESSION` is automatically set in `configuration.autocapture`.
Amplitude amplitude = new Amplitude(configuration);
```
{% /code-group %}
For more information about session tracking, refer to [User sessions](#user-sessions).
### Track application lifecycles
Enable application lifecycle event tracking by including `AutocaptureOption.APP_LIFECYCLES` in the `autocapture` configuration. Refer to the following code sample.
{% code-group %}
```kotlin Kotlin
import com.amplitude.android.Amplitude
val amplitude = Amplitude(AMPLITUDE_API_KEY, applicationContext) {
autocapture = autocaptureOptions {
+appLifecycles // or `+AutocaptureOption.APP_LIFECYCLES`
}
}
```
```java Java
import com.amplitude.android.Amplitude;
Configuration configuration = new Configuration(AMPLITUDE_API_KEY, getApplicationContext());
configuration.getAutocapture().add(AutocaptureOption.APP_LIFECYCLES);
Amplitude amplitude = new Amplitude(configuration);
```
{% /code-group %}
After you enable this setting, Amplitude tracks the following events:
- `[Amplitude] Application Installed`: fires when a user opens the application for the first time right after installation.
- `[Amplitude] Application Updated`: fires when a user opens the application after updating the application.
- `[Amplitude] Application Opened`: fires when a user launches or foregrounds the application after the first open.
- `[Amplitude] Application Backgrounded`: fires when a user backgrounds the application.
### Track screen views
Enable screen and fragment view event tracking by including `AutocaptureOption.SCREEN_VIEWS` in the `autocapture` configuration. Refer to the following code sample.
{% code-group %}
```kotlin Kotlin
import com.amplitude.android.Amplitude
val amplitude = Amplitude(AMPLITUDE_API_KEY, applicationContext) {
autocapture = autocaptureOptions {
+screenViews // or `+AutocaptureOption.SCREEN_VIEWS`
}
}
```
```java Java
import com.amplitude.android.Amplitude;
Configuration configuration = new Configuration(AMPLITUDE_API_KEY, getApplicationContext());
configuration.getAutocapture().add(AutocaptureOption.SCREEN_VIEWS);
Amplitude amplitude = new Amplitude(configuration);
```
{% /code-group %}
After you enable this setting, Amplitude tracks both `[Amplitude] Screen Viewed` and `[Amplitude] Fragment Viewed` events. Both events include a screen name property. For `[Amplitude] Fragment Viewed` events, Amplitude captures additional fragment-specific properties.
{% accordion title="Event properties descriptions" %}
| Event property | Description |
| --------------------------------- | ------------------------------------------------------------------------------------------------------------------- |
| `[Amplitude] Screen Name` | The activity title, activity label, activity name, activity class name, or application name (in order of priority). |
| `[Amplitude] Fragment Class` | The fully qualified class name of the viewed fragment. |
| `[Amplitude] Fragment Identifier` | The resource ID of the fragment as defined in the layout XML. |
| `[Amplitude] Fragment Tag` | The unique identifier assigned to the fragment during a transaction. |
{% /accordion %}
### Track deep links
Enable deep link event tracking by including `AutocaptureOption.DEEP_LINKS` in the `autocapture` configuration. Refer to the following code sample.
{% code-group %}
```kotlin Kotlin
import com.amplitude.android.Amplitude
val amplitude = Amplitude(AMPLITUDE_API_KEY, applicationContext) {
autocapture = autocaptureOptions {
+deepLinks // or `+AutocaptureOption.DEEP_LINKS`
}
}
```
```java Java
import com.amplitude.android.Amplitude;
Configuration configuration = new Configuration(AMPLITUDE_API_KEY, getApplicationContext());
configuration.getAutocapture().add(AutocaptureOption.DEEP_LINKS);
Amplitude amplitude = new Amplitude(configuration);
```
{% /code-group %}
After you enable this setting, Amplitude tracks the `[Amplitude] Deep Link Opened` event with the URL and referrer information.
#### Handle deep links in single-task activities
If your activity uses `singleTop`, `singleTask`, or `singleInstance` launch mode, Android delivers deep links that arrive while the activity is already running to `onNewIntent()` instead of creating a new activity. In this case, call `setIntent()` to update the activity's intent so Amplitude can track the deep link.
{% code-group %}
```kotlin Kotlin
override fun onNewIntent(intent: Intent) {
super.onNewIntent(intent)
setIntent(intent) // Required for Amplitude to track the deep link
}
```
```java Java
@Override
protected void onNewIntent(Intent intent) {
super.onNewIntent(intent);
setIntent(intent); // Required for Amplitude to track the deep link
}
```
{% /code-group %}
{% callout type="note" heading="" %}
Without calling `setIntent()`, `getIntent()` continues to return the original intent that started the activity, and Amplitude doesn't detect the new deep link.
{% /callout %}
### Track element interactions
Amplitude can track user interactions with clickable elements, with support for both classic Android Views and Jetpack Compose. To enable this option, include `AutocaptureOption.ELEMENT_INTERACTIONS` in the `autocapture` configuration.
{% code-group %}
```kotlin Kotlin
import com.amplitude.android.Amplitude
val amplitude = Amplitude(AMPLITUDE_API_KEY, applicationContext) {
autocapture = autocaptureOptions {
+elementInteractions // or `+AutocaptureOption.ELEMENT_INTERACTIONS`
}
}
```
```java Java
import com.amplitude.android.Amplitude;
Configuration configuration = new Configuration(AMPLITUDE_API_KEY, getApplicationContext());
configuration.getAutocapture().add(AutocaptureOption.ELEMENT_INTERACTIONS);
Amplitude amplitude = new Amplitude(configuration);
```
{% /code-group %}
When you enable this setting, Amplitude tracks the `[Amplitude] Element Interacted` event whenever a user interacts with an element in the application.
{% accordion title="Event properties descriptions" %}
| Event property | Description |
| ----------------------------- | ----------------------------------------------------------------------------------------------------------------------------------------------------------------------------------------- |
| `[Amplitude] Action` | The action that triggered the event. Defaults to `touch`. |
| `[Amplitude] Target Class` | The canonical name of the target view class. |
| `[Amplitude] Target Resource` | The resource entry name for the target view identifier within the context the view is running in. |
| `[Amplitude] Target Tag` | The tag of the target view if the value is of primitive type, or the `Modifier.testTag` of the target `@Composable` function if provided. This property is optional for Compose elements. |
| `[Amplitude] Target Text` | The text of the target view if the view is a `Button` instance. |
| `[Amplitude] Target Source` | The underlying framework of the target element, either `Android Views` or `Jetpack Compose`. |
| `[Amplitude] Hierarchy` | A nested hierarchy of the target view's class inheritance, from the most specific to the most general. |
| `[Amplitude] Screen Name` | Refer to [Track screen views](#track-screen-views). |
{% /accordion %}
{% callout type="info" heading="Support for Jetpack Compose" %}
Amplitude tracks user interactions with all clickable UI elements implemented in Jetpack Compose. `Modifier.testTag` is optional. Add it to `@Composable` functions to provide additional identification in the `[Amplitude] Target Tag` property. If no `testTag` is provided, Amplitude tracks the element with other available properties.
#### Use testTag for better element identification
While `testTag` is optional, Amplitude recommends that you identify specific Compose views that users clicked. The `testTag` property provides several benefits:
- Precise element identification: helps distinguish between similar UI elements (like multiple buttons or cards) in your analytics data.
- Stable tracking: provides a consistent identifier that doesn't change when you update or modify the UI structure or styling.
- Easier analysis: enables easier filtering and analysis of interactions with specific elements in Amplitude charts.
- Cross-platform consistency: helps you maintain consistent element naming across different platforms.
```kotlin
// Example: Adding testTag for better identification
Button(
onClick = { /* handle click */ },
modifier = Modifier.testTag("login_button")
) {
Text("Log In")
}
Card(
onClick = { /* handle click */ },
modifier = Modifier.testTag("product_card_${product.id}")
) {
// Card content
}
```
When a user clicks these elements, the `[Amplitude] Target Tag` property contains the `testTag` value, making it easy to identify which specific element the user interacted with in your analytics data.
{% /callout %}
### Track frustration interactions
Amplitude can track frustration interactions (Rage Clicks and Dead Clicks) with clickable UI elements in both Android Views and Jetpack Compose. To enable this option, include `AutocaptureOption.FRUSTRATION_INTERACTIONS` in the `autocapture` configuration.
{% code-group %}
```kotlin Kotlin
import com.amplitude.android.Amplitude
val amplitude = Amplitude(AMPLITUDE_API_KEY, applicationContext) {
autocapture = autocaptureOptions {
+frustrationInteractions // or `+AutocaptureOption.FRUSTRATION_INTERACTIONS`
}
}
```
```java Java
import com.amplitude.android.Amplitude;
Configuration configuration = new Configuration(AMPLITUDE_API_KEY, getApplicationContext());
configuration.getAutocapture().add(AutocaptureOption.FRUSTRATION_INTERACTIONS);
Amplitude amplitude = new Amplitude(configuration);
```
{% /code-group %}
A rage click occurs when a user clicks the same element 4 or more times within 1 second, with each click no more than 50 device-independent pixels apart.
When a Rage Click occurs, Amplitude tracks the `[Amplitude] Rage Click` event.
{% accordion title="Event properties descriptions" %}
| Event property | Description |
| --- | --- |
| `[Amplitude] Begin Time` | The timestamp when the interaction began in ISO 8601 format. |
| `[Amplitude] End Time` | The timestamp when the interaction ended in ISO 8601 format. |
| `[Amplitude] Duration` | The duration of the interaction in milliseconds. |
| `[Amplitude] Click Count` | The number of clicks that occurred. |
| `[Amplitude] Clicks` | The array of clicks that occurred. |
| `[Amplitude] Clicks[].X` | The x-coordinate of the click from the top-left corner of the screen. |
| `[Amplitude] Clicks[].Y` | The y-coordinate of the click from the top-left corner of the screen. |
| `[Amplitude] Clicks[].Time` | The timestamp of the click in ISO 8601 format. |
| `[Amplitude] Action` | The action that triggered the event. Defaults to `touch`. |
| `[Amplitude] Target Class` | The canonical name of the target view class. |
| `[Amplitude] Target Resource` | The resource entry name for the target view identifier within the context the view is running in. |
| `[Amplitude] Target Tag` | The tag of the target view if the value is of primitive type, or the `Modifier.testTag` of the target `@Composable` function if provided. |
| `[Amplitude] Target Text` | The text of the target view if the view is a `Button` instance. |
| `[Amplitude] Target Source` | The underlying framework of the target element, either `Android Views` or `Jetpack Compose`. |
| `[Amplitude] Hierarchy` | A nested hierarchy of the target view's class inheritance, from the most specific to the most general. |
| `[Amplitude] Screen Name` | Refer to [Track screen views](#track-screen-views). |
{% /accordion %}
A dead click is a user interaction on an interactive element that produces no visible change in the following 3 seconds.
When a Dead Click occurs, Amplitude tracks the `[Amplitude] Dead Click` event.
{% accordion title="Event properties descriptions" %}
| Event property | Description |
| --- | --- |
| `[Amplitude] X` | The x-coordinate of the click from the top-left corner of the screen. |
| `[Amplitude] Y` | The y-coordinate of the click from the top-left corner of the screen. |
| `[Amplitude] Action` | The action that triggered the event. Defaults to `touch`. |
| `[Amplitude] Target Class` | The canonical name of the target view class. |
| `[Amplitude] Target Resource` | The resource entry name for the target view identifier within the context the view is running in. |
| `[Amplitude] Target Tag` | The tag of the target view if the value is of primitive type, or the `Modifier.testTag` of the target `@Composable` function if provided. |
| `[Amplitude] Target Text` | The text of the target view if the view is a `Button` instance. |
| `[Amplitude] Target Source` | The underlying framework of the target element, either `Android Views` or `Jetpack Compose`. |
| `[Amplitude] Hierarchy` | A nested hierarchy of the target view's class inheritance, from the most specific to the most general. |
| `[Amplitude] Screen Name` | Refer to [Track screen views](#track-screen-views). |
{% /accordion %}
### Configure frustration interaction types
Enabling `FRUSTRATION_INTERACTIONS` tracks both rage clicks and dead clicks. Use the `interactionsOptions` parameter to enable or disable each type individually.
{% code-group %}
```kotlin Kotlin
import com.amplitude.android.Amplitude
import com.amplitude.android.InteractionsOptions
import com.amplitude.android.RageClickOptions
import com.amplitude.android.DeadClickOptions
val amplitude = Amplitude(AMPLITUDE_API_KEY, applicationContext) {
autocapture = autocaptureOptions {
+frustrationInteractions
}
interactionsOptions = InteractionsOptions(
rageClick = RageClickOptions(enabled = true),
deadClick = DeadClickOptions(enabled = false)
)
}
```
```java Java
import com.amplitude.android.Amplitude;
import com.amplitude.android.InteractionsOptions;
import com.amplitude.android.RageClickOptions;
import com.amplitude.android.DeadClickOptions;
Configuration configuration = new Configuration(AMPLITUDE_API_KEY, getApplicationContext());
configuration.getAutocapture().add(AutocaptureOption.FRUSTRATION_INTERACTIONS);
configuration.setInteractionsOptions(
new InteractionsOptions(
new RageClickOptions(true),
new DeadClickOptions(false)
)
);
Amplitude amplitude = new Amplitude(configuration);
```
{% /code-group %}
{% callout type="note" title="Dead clicks require Session Replay" %}
To track dead clicks, enable both Session Replay and frustration interactions.
{% /callout %}
### Ignore specific elements from frustration analytics
Some UI elements generate expected rapid clicks or don't provide meaningful frustration signals. Use the ignore APIs to exclude these elements from frustration analytics while still tracking regular interaction events.
Common use cases:
- Navigation elements: back buttons, close buttons, and drawer toggles.
- Multi-click elements: increment/decrement buttons and like/favorite buttons.
- Loading indicators: progress bars, spinners, and loading buttons.
- Decorative elements: non-functional UI components.
#### Android Views
Use `FrustrationAnalyticsUtils` to ignore frustration analytics for Android Views:
{% code-group %}
```kotlin Kotlin
import com.amplitude.android.FrustrationAnalyticsUtils
// Ignore all frustration analytics for this view
val backButton = findViewById