The cumulative exposures graph: Divergent lines
This article compares divergent lines with similar slopes against divergent lines with varying slopes. Divergent lines start from a common point and spread apart over time.
Divergent lines with similar slopes
Sometimes your cumulative exposure graph shows divergent lines with similar slopes. This happens when your experiment starts before all variants are ready.
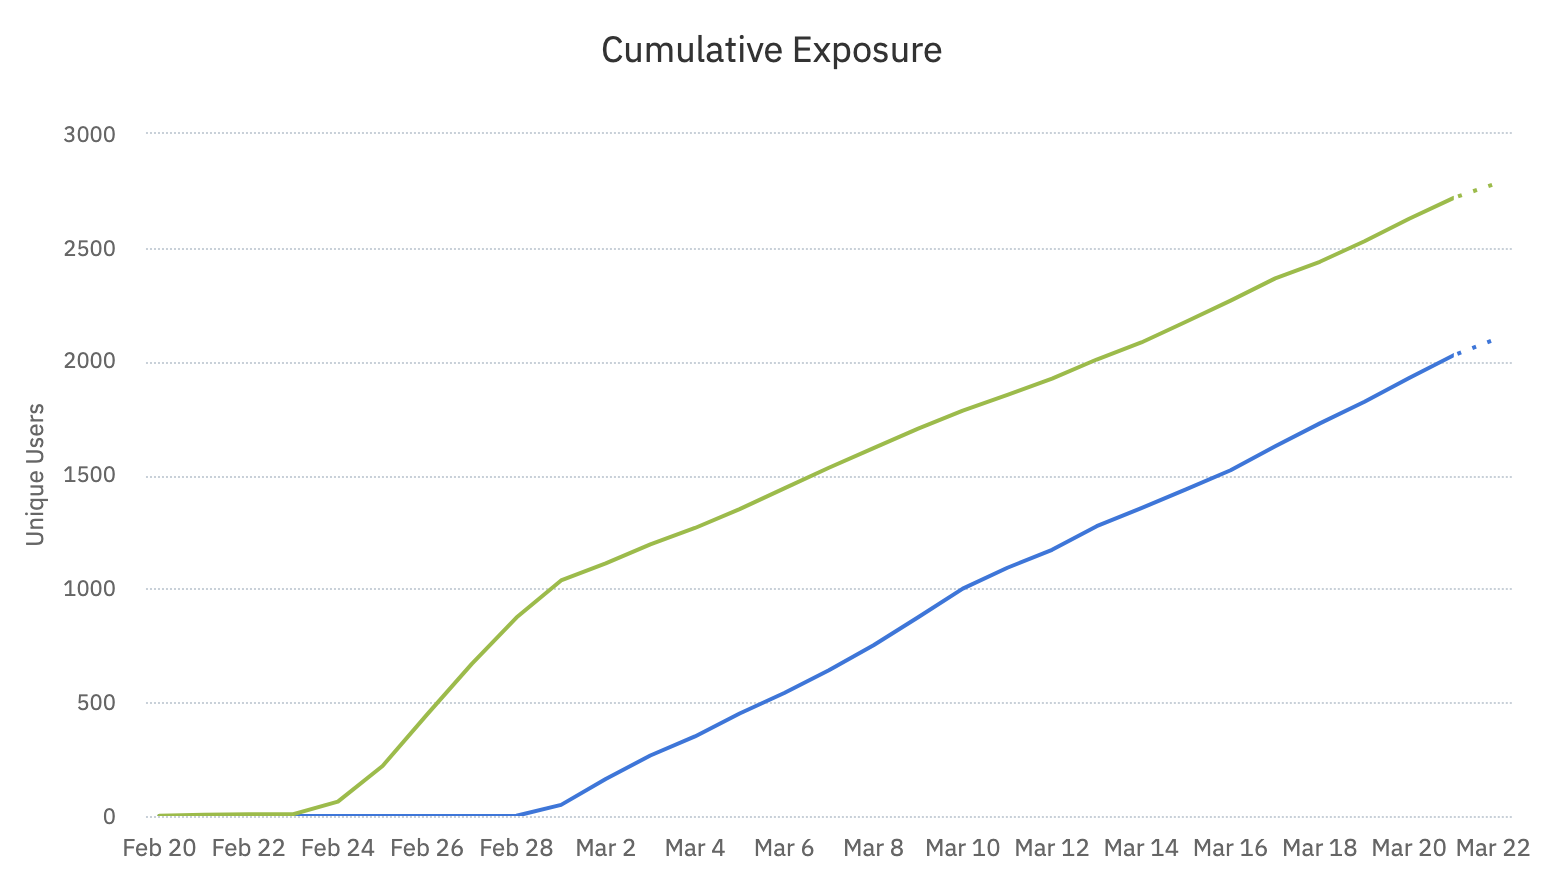
In this example, the two variants began receiving traffic on two separate days, February 23 and February 28, producing a pair of staggered lines on the graph.
Don't begin an experiment until all variants are ready to receive traffic. Adding a new variant after the experiment is underway presents a misleading picture of the results, because the variants weren't subject to the same conditions for the same length of time.
The novelty effect
Another potential issue is the novelty effect: the newness of a treatment can sway experiment results. In the example above, users exposed to the green variant had more time to adjust to the new experience. Users exposed to the green variant also had more opportunities to trigger the primary metric, especially if it's an unbounded time metric, making the comparison between variants unequal.
A central requirement of experimentation is to ensure the only difference between treatment and control is the feature you're testing. This way, you know any differences you find result from causation, not correlation.
Divergent lines with different slopes
Your cumulative exposures graph can show divergent lines with different slopes for several reasons. If you're using a custom exposure event, users can receive old, cached variants of your experiment when they keep triggering the exposure event without triggering the assignment event.
For example, Amplitude can assign a user to the control variant without triggering the exposure event. If you later set the traffic allocation for the control variant to 0%, that user can return and trigger the exposure event without triggering a new assignment event. Amplitude counts that user as a control exposure.
This reasoning also applies to experiments with sticky bucketing on.

In this example, on March 15, the user rolled out their experiment to 100% for the control variant. Because the experiment uses sticky bucketing, the graph still shows the number of "on" users increasing after the user set the traffic allocation to 0%. This happens because Amplitude allocates variants when the SDK or API requests them, so the variant can stick to the user even if the user never receives it.
Sticky bucketing and traffic allocation
When you select sticky bucketing and change the traffic allocation, you don't get the target traffic allocation. Instead, you get a weighted average between the two allocations, because users who already have buckets stay in their buckets. You have to wait to get close to the target traffic allocation.
If your experiment has sticky bucketing turned on and you plan to roll out a variant after it ends, delete the appropriate branch in the code and remove the feature flag. If you don't want to make a code deployment, you can also turn off sticky bucketing.
Was this helpful?