How filters work in a Funnel Analysis chart
Applying filters in a funnel analysis has certain nuances:
Applying filters in the Segmentation Module
In a funnel chart, any filters applied through the Segmentation Module apply only to the first event. You can, however, add filters to individual steps directly in the Events module.
Amplitude only counts users as entering the funnel if they trigger an event that meets the conditions of the filters applied to the first event.
Applying group-by filters
You can apply a group-by filter in the Segmentation Module, for up to two properties. The group-by filter applies only to the first event, similar to the other filters in the Segmentation Module.
If you look at the Unique Users metric and users can complete the steps of your funnel multiple times, the group-by filter takes the first occurrence of the event and buckets the user for the value on that event.
If "holding property constant" applies at the same time, Amplitude counts each property value / user pair as a separate user, so the user appears once for each property value they have.
You can also use the group-by filter for an event (limit of one event group-by per funnel). The results show how users with a certain event or user property converted through the other steps in the funnel. This helps you understand which property value potentially has the greatest or smallest impact on conversion.
For example, look at this Funnel Analysis chart:
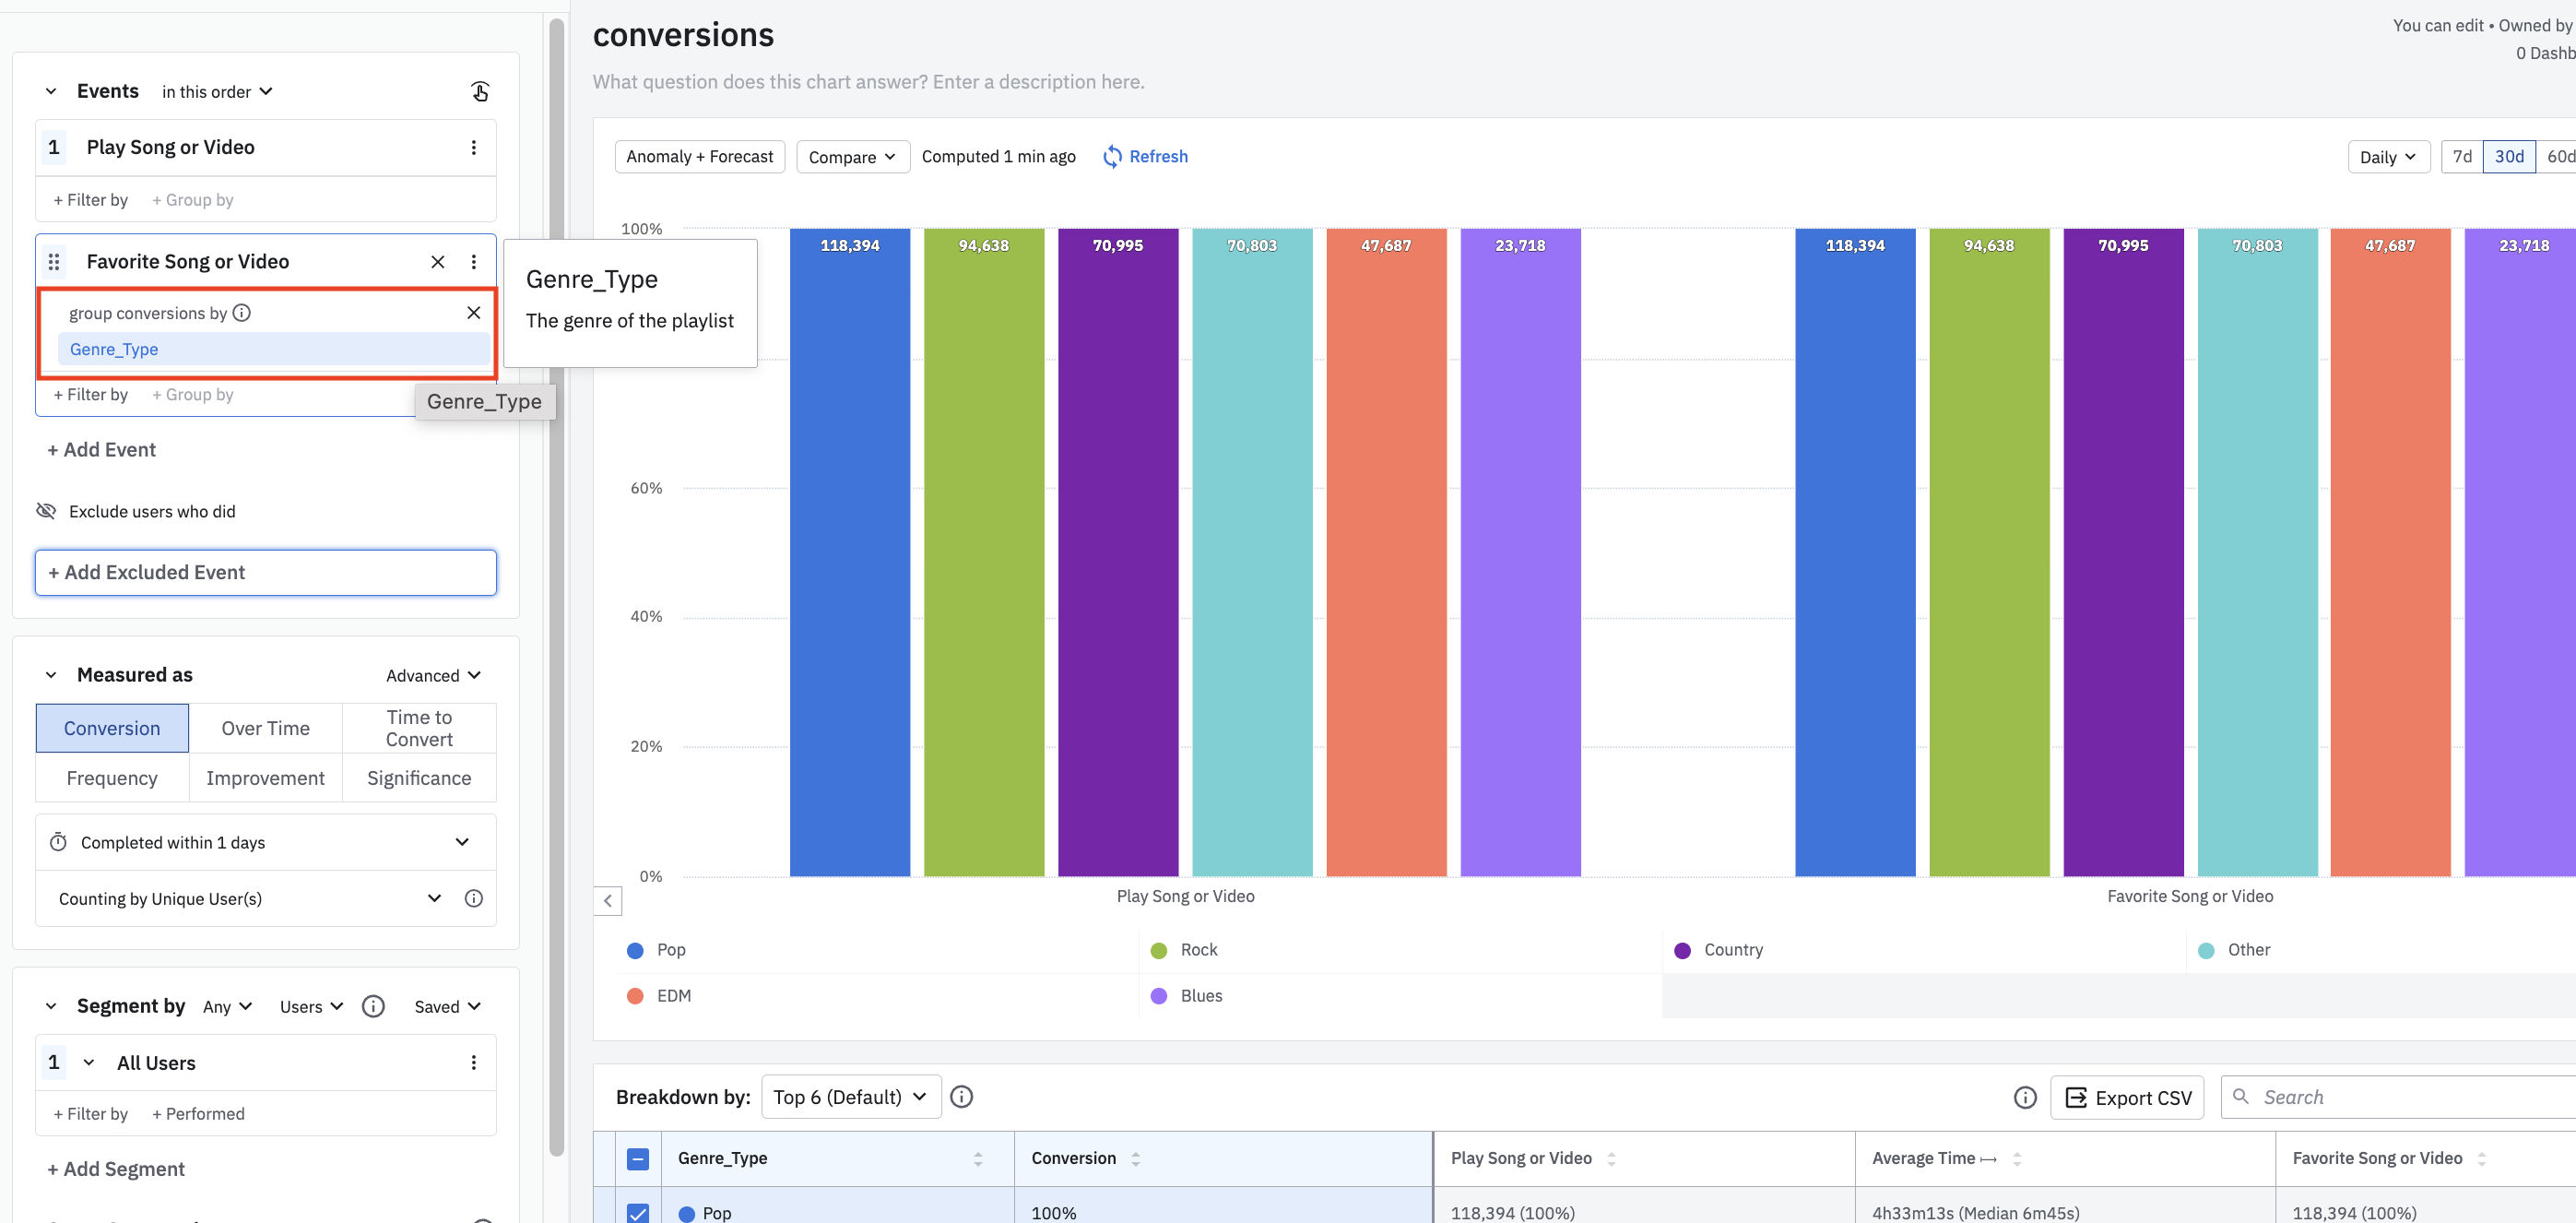
The Group-by here looks at users' property values for Genre_Type at the time their Favorite Song or Video events trigger, and shows how they converted through the remaining events of the funnel.
For example, a user that has a Pop property value for Genre_Type at the time their Favorite Song or Video event triggered shows up under the Pop property bar for the Play Song or Video event as well.
If users in your funnel can complete the steps multiple times, this method takes the first occurrence of each event and buckets the user for the value on that event.
This three-step funnel groups by Step 2's event property, item_id:
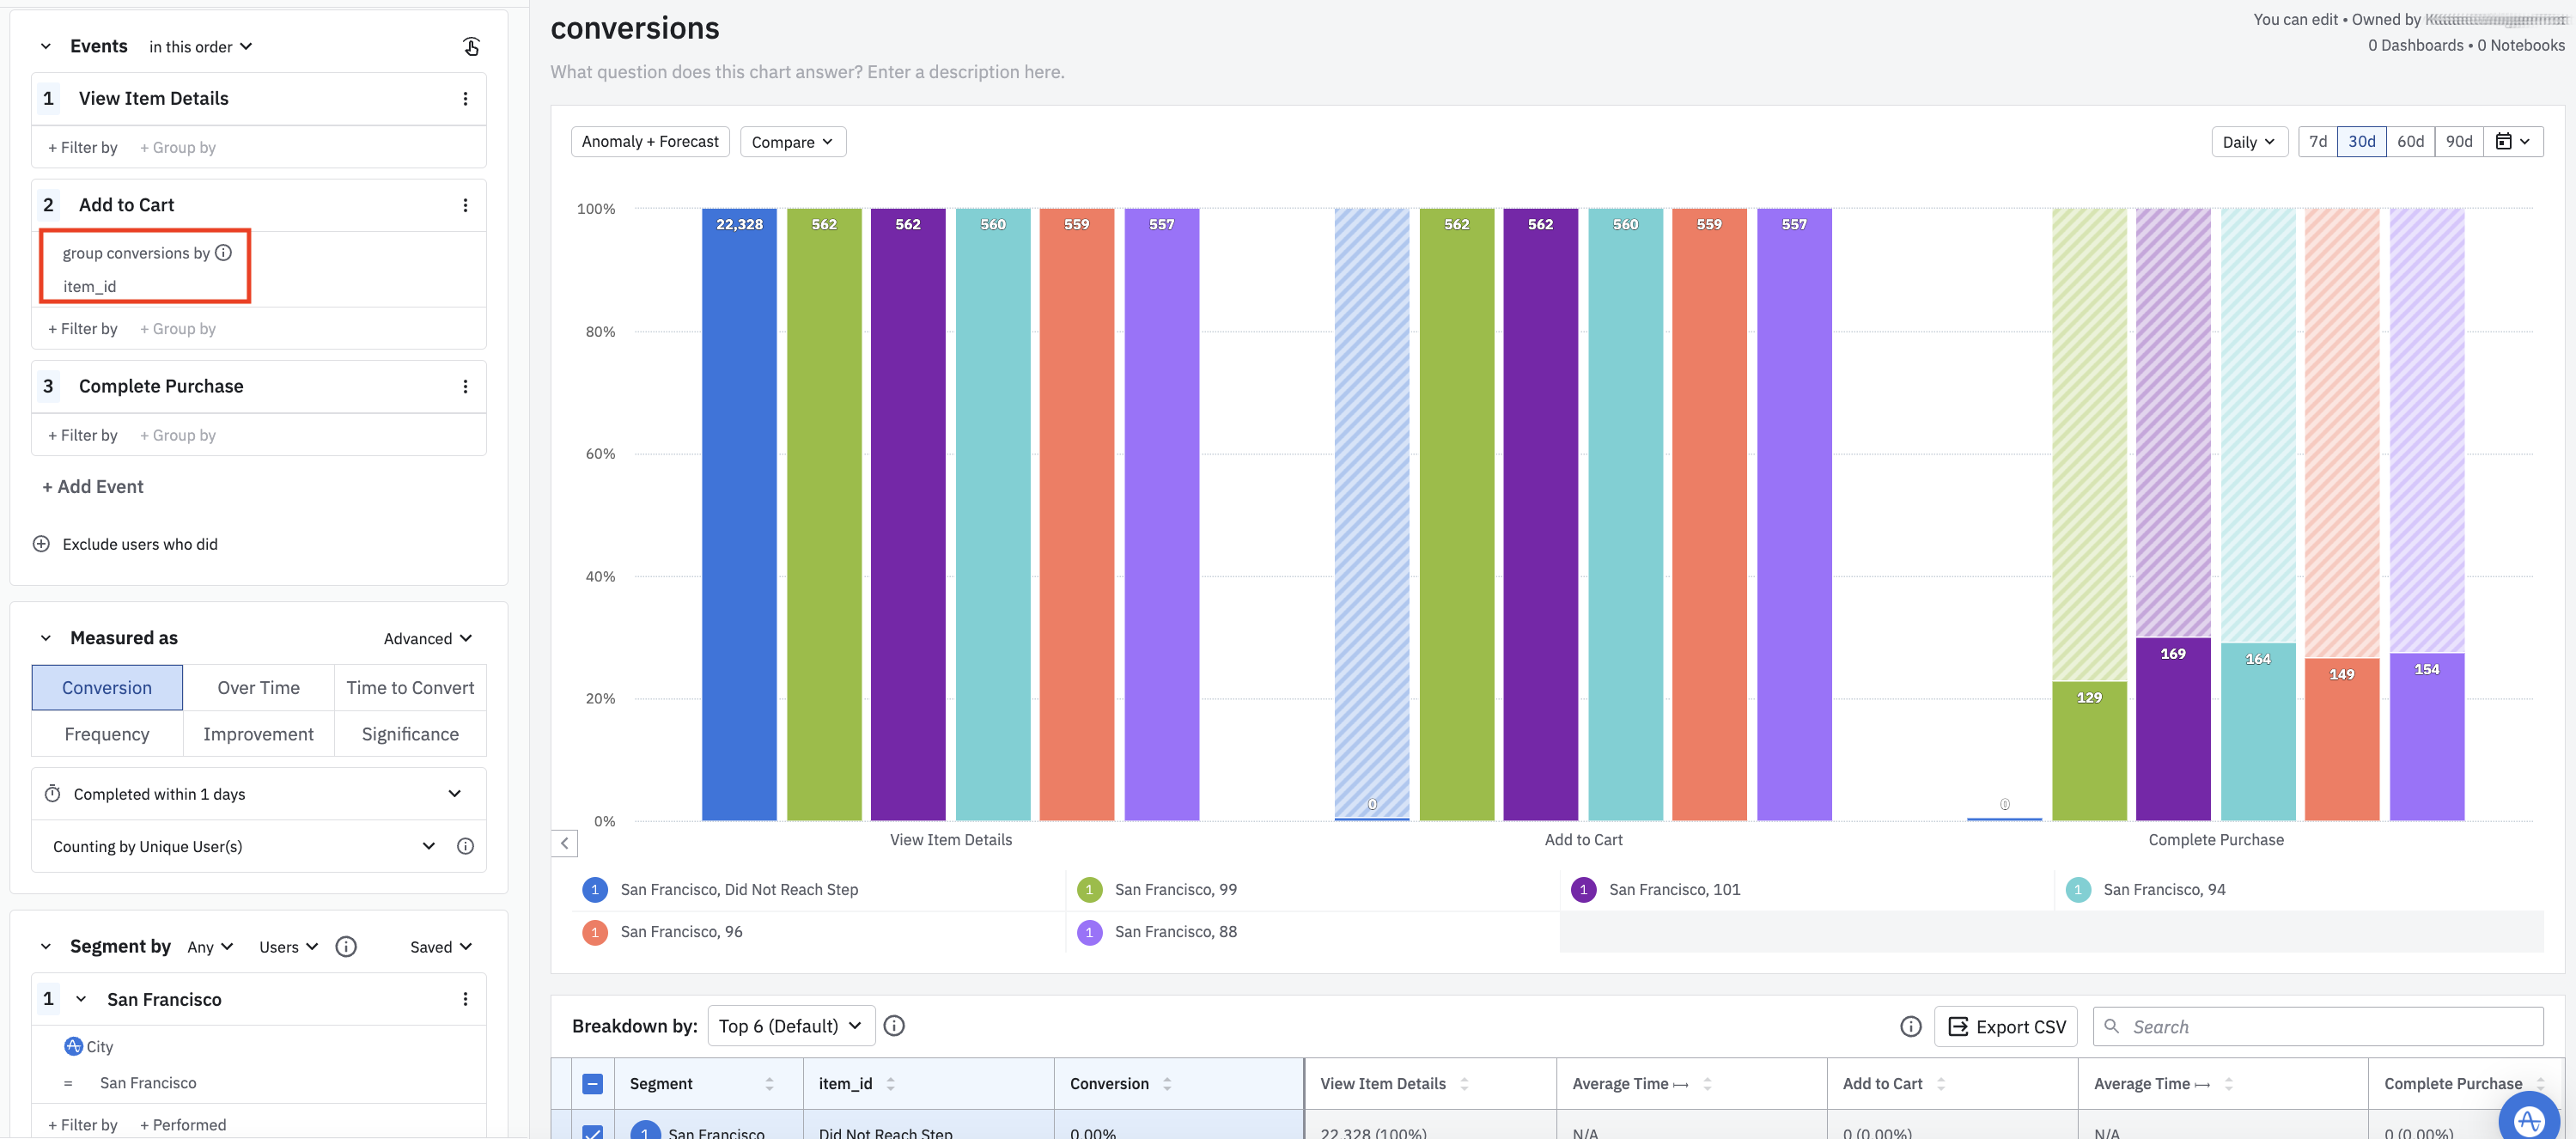
The graph shows the conversion distribution of users who triggered the Step 2 (Add Item to Cart) event, broken out by each item_id value.
If you choose to group by a step other than the first, you also see a segment of users who didn't reach that segmented step (the blue-shaded segment for 'did not reach step' in this example).
Was this helpful?