

Truly understanding our customers and their problems is the most important role of a product manager. After we ship a feature, my most pressing question is, “are people using it and how?!” I want to know whether we made the right assumptions and built the thing people wanted.
This is a question that vanity metrics like Daily Active Users and Sessions cannot answer. Really understanding the impact of my decisions on my product’s users requires a deeper layer of analysis – a .
Customer centric teams are keenly aware of . Customer centric teams have:
- a complete understanding of their user’s challenges
- insight into what features their customers use and what they don’t
- knowledge of how customers get the most value out of their products
They use in their day-to-day to inform their product decisions and strategy.
What is behavioral analytics and why is it so vital?
is the data that tells you how your customers behave in mobile applications or on websites. It goes beyond basic metrics like monthly active users or pageviews. Behavioral data reveals how engagement with your product impacts retention, conversion, revenue, and the outcomes you care about.
is necessary to increase engagement, retention, lifetime value, conversion rates, and ultimately, revenue.
And the building blocks of behavioral analysis is events. Events represent any action a user can perform in your product (like opening the app, creating an account, viewing a video) or any activity associated with the user (like making a purchase).
Sending optimal event data to your analytics platform is the single most important step toward understanding how your users are engaging with your product. If you’re too hasty in instrumenting your analytics you may never get the full value of your data.
Follow these 10 steps to start off analyzing user behavior the right way.
Step 1: Define your business and analytics goals.
What are you and your team working towards? What is your overall goal? Think of the . Once you have your overarching goal established, how can you work towards this? Establish the key performance metrics (KPIs) that you are focused on improving in order to achieve your goal.
Let’s say your business objective is to increase revenue. Your KPIs may be:
- Increase onboarding conversion
- Increase retention for paying customers
- Increase checkout funnel conversion
It is important to define these before you starting thinking about your data taxonomy so that you can ensure you are sending the right events to the right project in order track your KPIs
Step 2: Map out the critical paths that align with your goals.
Critical paths are a sequence of actions a user takes that align with your product’s purpose. An example for an e-commerce product could be:
Search → Browse Products → Add to Cart → Checkout → Order Confirmation
For a gaming product, a critical path may begin when a user opens the app, is prompted to register, and then taken through a game tutorial.

Example: Suppose you have a gaming app. A critical path in the onboarding flow for the app could be broken down into four distinct events: user opens app >> user registers >> user verifies account >> user completes tutorial
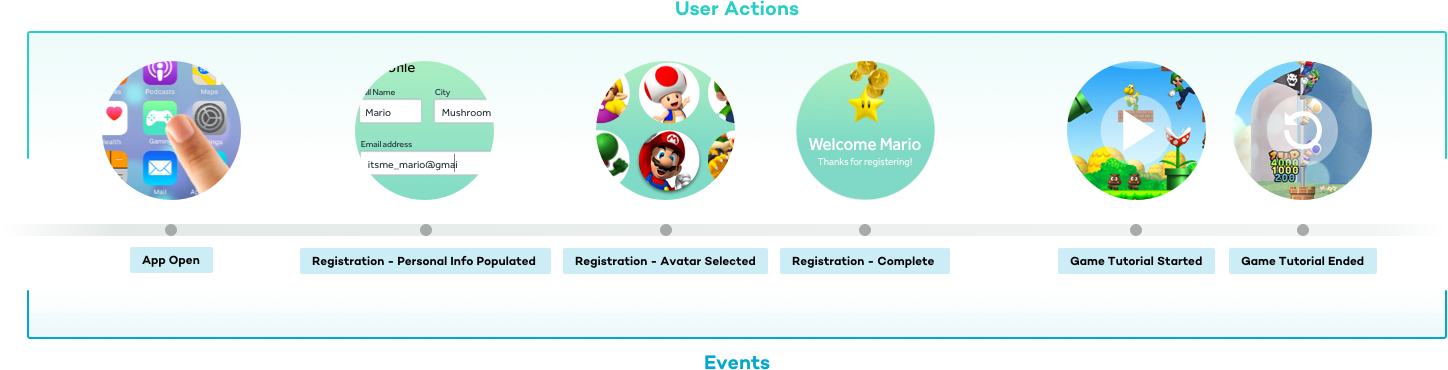
You can break this onboarding process or path into a series of events: ‘App Open’, ‘Registration – Personal Info Populated’, ‘Registration – Avatar Selected’, ‘Registration – Complete’, ‘Game Tutorial – Started’, and ‘Game Tutorial – Watched’.
When starting out, make sure to track only the events that are essential to answering your business and analytics goals. If you need to, you can always add more events later.
Step 3: Organize your event taxonomy.
Behind every great is a great event taxonomy – the way you organize this collection of events and properties you’re using to define the actions people can take within your product. Think of the event taxonomy as the foundation for all future analysis you’ll do with your analytics platform. It’s crucial to get right.
If you are not using a product analytics platform (like Amplitude) to organize your event taxonomy, you will likely use a spreadsheet like the one below to keep track of all the names of , , and
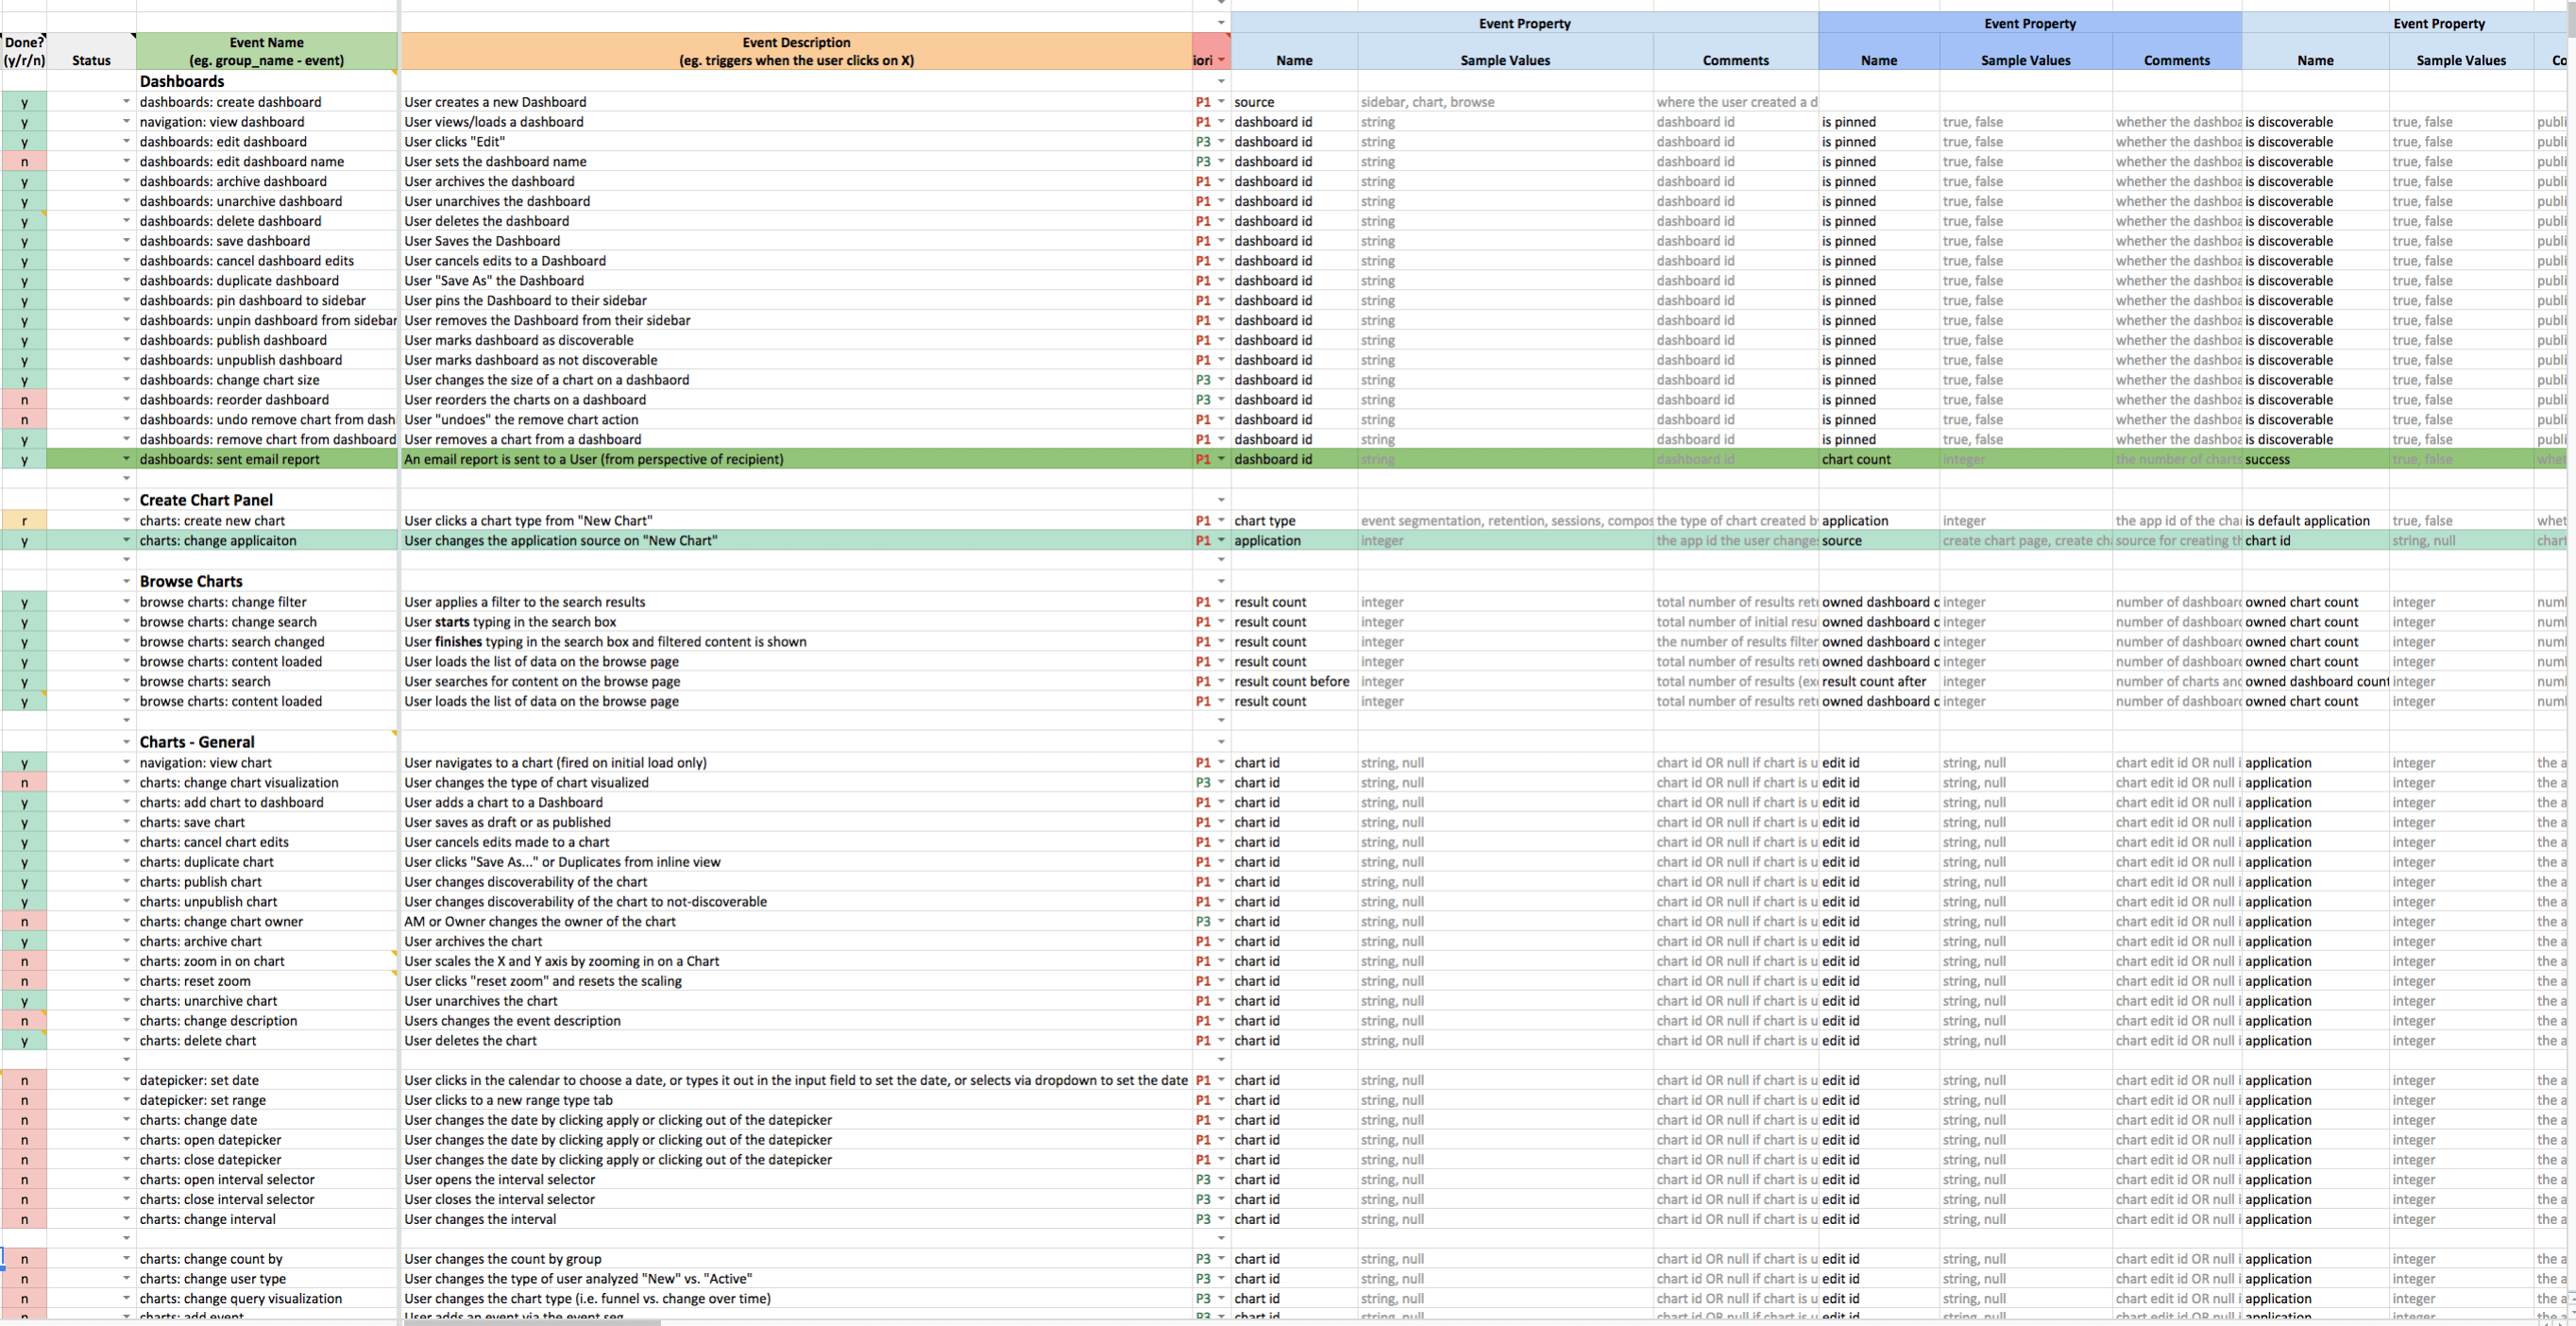
.
that makes it easy to lay out your event taxonomy and addresses common pain points around data clarity and integrity.
Step 4: Understand how users are being identified.
Most analytics platforms require you to configure some kind of identifier–a username or email, for example–in their mobile SDKs or HTTP API for keeping track of unique users. This lets you match data from multiple devices and sessions to one user. Because of this, it’s important to make sure the is set to something that will not change.
Another important thing to note. Most analytics platforms count unique users when they ‘see’ a new device or a new user ID (if the user is signed in). A challenge arises when a device ‘anonymously’ logs an event that was actually performed by a user already in the system. Amplitude by using the ‘amplitude_ID’ identifier.
Step 5: Decide if you need cross-platform behavior analytics.
If your product exists on multiple platforms, for instance mobile and web, or in-store POS and native app, should you tie all your data together or keep it separate?
The answer to this question depends on your product itself. If you’re expecting user behavior to be different across platforms, you’ll want to know how each platform performs independently of the others so cross-platform instrumentation probably won’t be a priority.
If you want to understand user behavior as a whole across the entire user’s journey, make sure that your analytics solution can do . Grocery shopping app is an excellent example of a product that utilizes cross-platform tracking because they want to know how people are using their product across mobile and web.
For more information on deciding cross-platform instrumentation vs. separate platform instrumentation, .
Step 6: Establish the ‘Minimum Viable Instrumentation’.
Once you’ve spent some time thinking about how to set up your analytics and organizing your events (aka step 1 through 5), it’s time to start accessing some basic app metrics. You should now integrate your analytics solution’s mobile SDK and/or HTTP API and assign your user IDs.
Step 7: Track your events.
Start tracking the events and critical paths you brainstormed in Step 2. You don’t necessarily have to track every action possible in your app, but do make sure to track events that are key steps in onboarding, conversion, and retention.
Our customer success team created a with detailed information on each of these steps.
Step 8: Set user properties and event properties.
Assigning user properties and event properties can give you deeper insight into the behaviors your customers are exhibiting as they engage with the app.
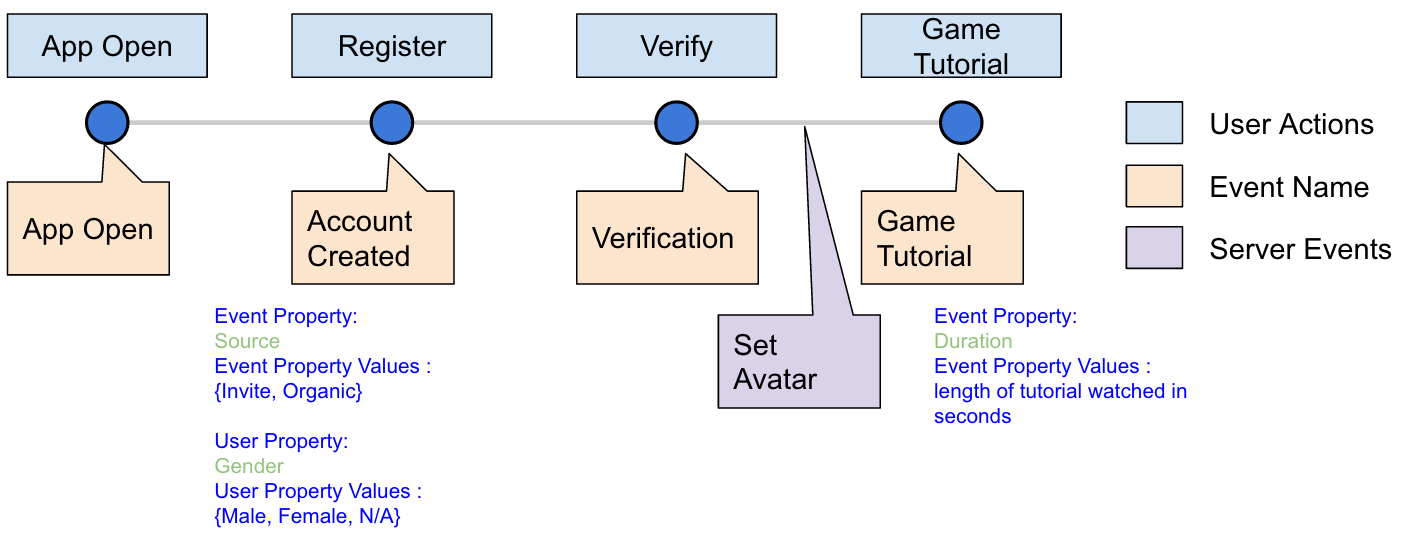
A user property describes attributes of an individual person using your app (e.g. age, gender, location). An event property describes a property of an event (e.g. how long someone performs the event).
Example: Going back to our gaming app example, here are some examples of user and event properties that we can set up for our onboarding flow.
Step 9: Verify user behavior events are being tracked properly.
How do you know if you’ve instrumented everything correctly? Use a test device to progress through the app. If you can view your analytics in real-time, you should be able to see your device firing events at each step. Be sure to check out these .
Once your test data works, it’s time to start sending live data.
Step 10: Start digging into user behavior.
Instrumenting your user behavior events is a huge accomplishment. It is a meaningful investment in giving your team access to the data they need to measure the impact of product decisions.
When you are fully instrumented, it’s time to start putting all this data to use.
- create ,
- view your critical paths and ,
- calculate over time,
- run experiments,
- measure the impact of new feature releases,
- and so many more insights.