Template Gallery
Kickstart your analysis journey with customizable insight templates
Featured Dashboard Templates

Kyle Poyar
Operating Partner @ |
Feature Monetization Dashboard by Kyle Poyar from OpenView

Elena Verna
Growth @
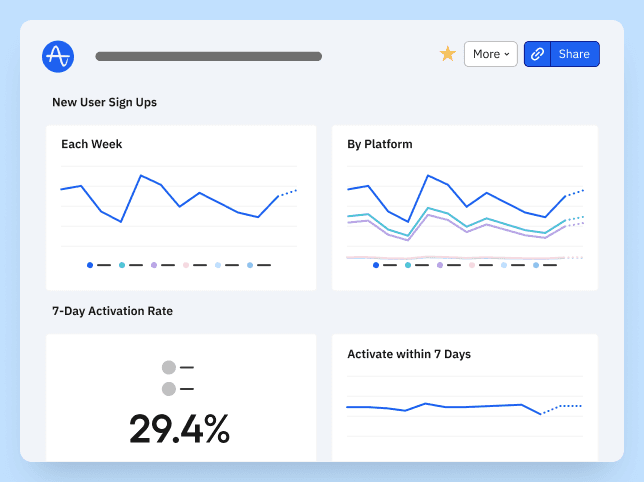
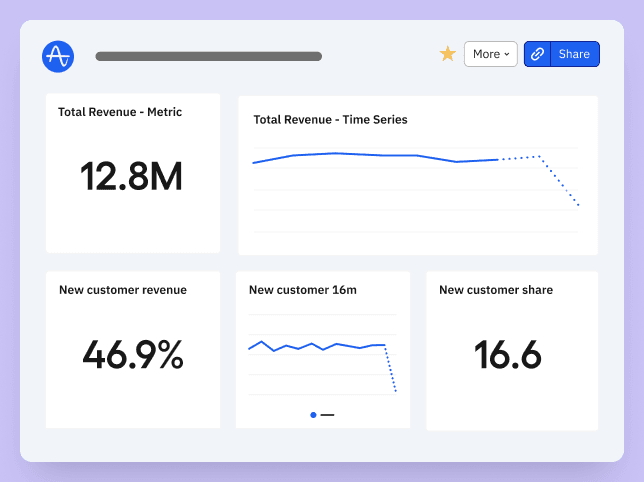
Main Topline Activation KPI Dashboard by Elena Verna

Olga Berezovsky
Head of Data & Analytics
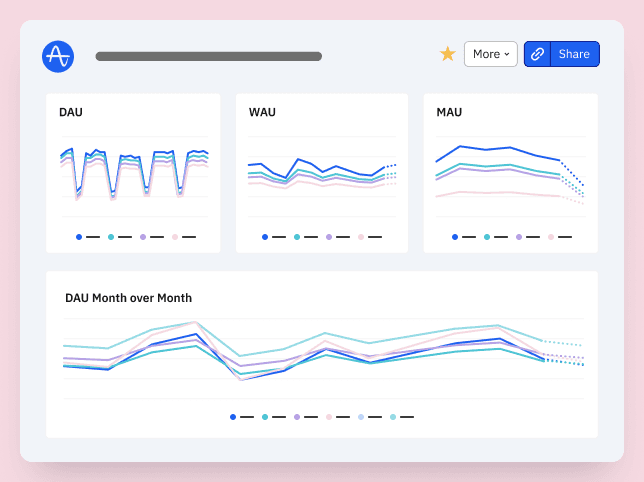
Mobile Subscription App Engagement and Retention Dashboard by Olga Berezovsky from MyFitnessPal

Drew Teller
Head of Growth at Labelbox
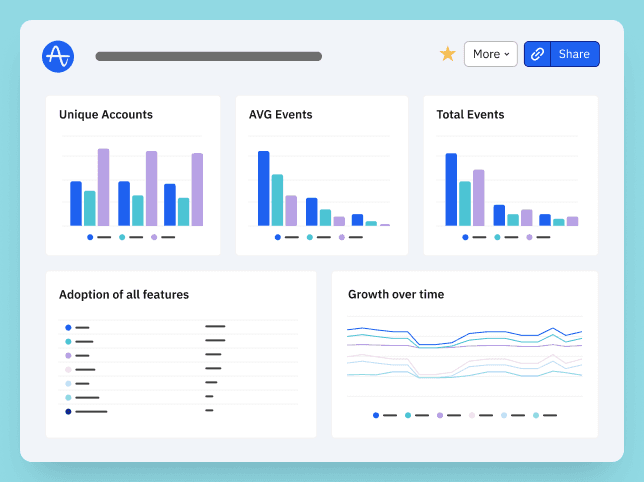
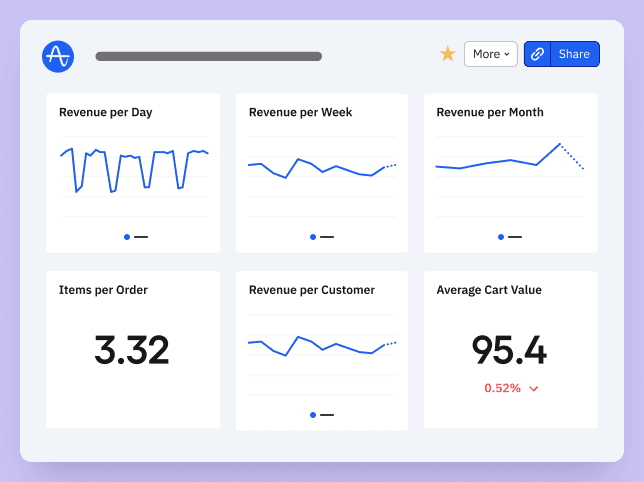
Growth Dashboard by Drew Teller
by Amplitude
Twilio Segment Ecommerce Dashboard

Timo Dechau
Founder & Data Engineer @ Deepskydata
E-commerce Monetization Dashboard

Ruben Lozano
B2B SaaS Marketing Specialist
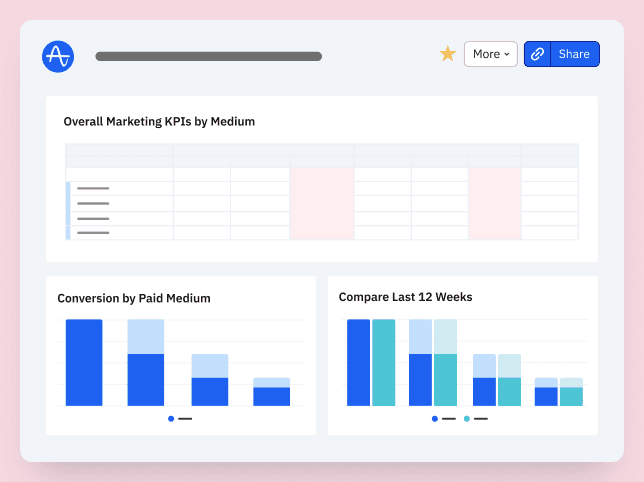
Growth Marketing Overview Dashboard by Ruben Lozano

Ben Williams
Advisor (PLG / Product / Growth) @ The Product-Led Geek
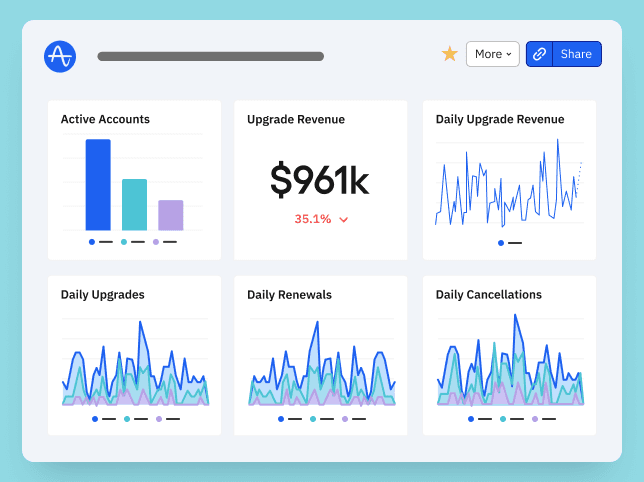
The Product-Led Geek Monetisation Dashboard by Ben Williams


Twilio Segment Templates

Twilio Segment Product KPI Dashboard
by Amplitude

Twilio Segment Fintech Dashboard
by Amplitude
Twilio Segment Ecommerce Dashboard
by Amplitude
Twilio Segment Media Dashboard
by Amplitude
Acquisition Templates
Main Topline Activation KPI Dashboard by Elena Verna
Elena Verna
Growth @
Growth Dashboard by Drew Teller
Drew Teller
Head of Growth at Labelbox
Cost Acquisition Cost Dashboard Template
by Amplitude

Customer Acquisition Dashboard Template
by Amplitude
B2B SaaS Templates
Product-Led Growth Template Dashboard by Leah Tharin

Leah Tharin
Interim Product & Growth Executive, Board Member
The Product-Led Geek Monetisation Dashboard by Ben Williams
Ben Williams
Advisor (PLG / Product / Growth) @ The Product-Led Geek

ARR SaaS Dashboard Template
by Amplitude

B2B Marketing Dashboard Template
by Amplitude
eCommerce Templates
Twilio Segment Ecommerce Dashboard
by Amplitude
Ecommerce Core Metric Tree Dashboard by Timo Dechau
Timo Dechau
Founder & Data Engineer @ Deepskydata
Dr. Bart's A/B Experiment Dashboard Template

Bart Jaworski
Senior Product Manager at The Stepstone Group

Cart Abandonment Dashboard Template
by Amplitude
Engagement Templates
Mobile Subscription App Engagement and Retention Dashboard by Olga Berezovsky from MyFitnessPal
Olga Berezovsky
Head of Data & Analytics

User Engagement KPI Dashboard Template
by Amplitude

User Engagement Frequency Chart
by Amplitude

Feature Value Conversion Rate Chart
by Amplitude
FinTech Templates
Twilio Segment Product KPI Dashboard
by Amplitude
Twilio Segment Fintech Dashboard
by Amplitude
Twilio Segment Media Dashboard
by Amplitude
Revenuecat Dashboard Template
by Amplitude
Funnel Analysis Templates

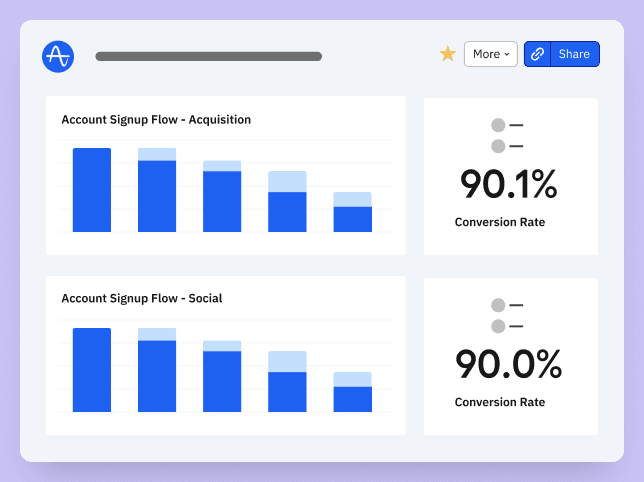
Funnel Analysis Dashboard Template Example
by Amplitude

Conversion Funnel Dashboard Template
by Amplitude

Marketing Funnel Dashboard Template
by Amplitude

Product Funnel Dashboard Template
by Amplitude
Marketing Analytics Templates

Marketing Analytics Dashboard
by Amplitude
Growth Marketing Overview Dashboard by Ruben Lozano
Ruben Lozano
B2B SaaS Marketing Specialist

Brand Awareness Dashboard Template
by Amplitude

Campaign Performance Dashboard Template
by Amplitude
Media Templates
Affiliate Marketing Dashboard Template
by Amplitude
Content Marketing Dashboard Template
by Amplitude
Event Marketing Dashboard Template
by Amplitude
Influencer Marketing Dashboard Template
by Amplitude
Product KPIs Templates

Product Analytics KPI Dashboard Template Example
by Amplitude
Product-Led Growth Template Dashboard by Leah Tharin
Leah Tharin
Interim Product & Growth Executive, Board Member

Product Analytics Dashboard Template
by Amplitude

Product Engagement Dashboard Template
by Amplitude
Retention Templates
Mobile Subscription App Engagement and Retention Dashboard by Olga Berezovsky from MyFitnessPal
Olga Berezovsky
Head of Data & Analytics
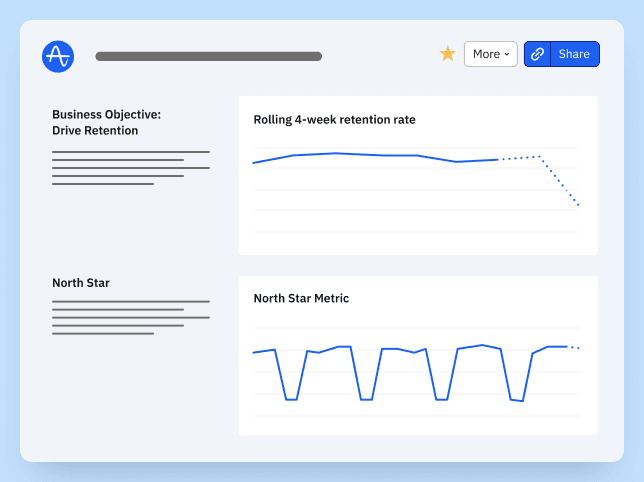
North Star framework Dashboard for SaaS companies

Dan Schmidt
Co-founder @
Churn Dashboard Template
by Amplitude
Cohort Analysis Dashboard Template
by Amplitude
Session Engagement Templates

Session Engagement Dashboard
by Amplitude

User Journey Dashboard Template
by Amplitude

Website Funnel Analytics Template
by Amplitude

Daily Session Count Analysis Chart
by Amplitude
User Activity Templates

User Activity Dashboard Template
by Amplitude
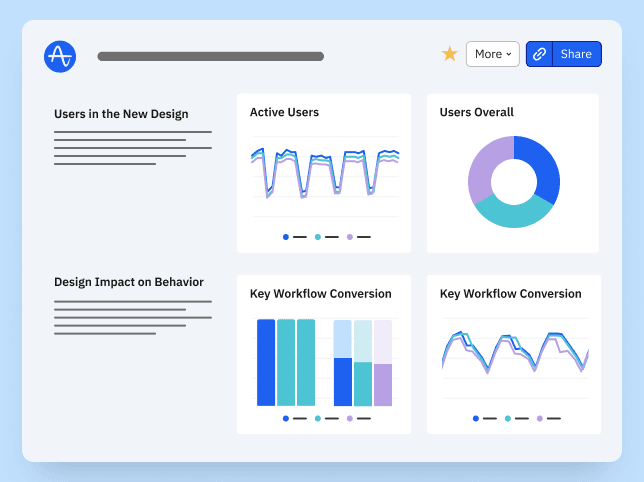
UX Release Dashboard by Will Newton

Will Newton
Product Design Leader @ Amplitude
Twilio Segment User Activity Dashboard
by Amplitude

User Behavior Dashboard Template
by Amplitude
Web KPIs Templates
Website KPI Dashboard
by Amplitude
Google Ads Analytics Dashboard Template
by Amplitude

Paid Search Dashboard Template
by Amplitude

PPC Dashboard Template
by Amplitude