Sequential testing for statistical inference
This article helps you:
Familiarize yourself with the statistical testing method used by Amplitude Experiment
Experiment uses a sequential testing method of statistical inference. With sequential testing, results are valid whenever you view them. You can decide to end an experiment early based on observations made to that point. The number of observations you’ll need to make an informed decision is, on average, much lower than the number you’d need with T-tests or similar procedures. You can experiment rapidly, incorporating what you learn into your product and escalating the pace of your experimentation program.
Sequential testing has several advantages over T-tests. Primarily, you don’t need to know the number of observations necessary to achieve significance before you start the experiment. You can use both sequential testing and T-tests for binary metrics and continuous metrics. If you have concerns related to long tailed distributions affecting the Central Limit Theorem assumption, read this article about outliers.
Given enough time, the statistical power of sequential testing method is 1. If there is an effect size to be detected, this approach can detect it.
This article explains the basics of sequential testing, how it fits into Amplitude Experiment, and how you can make it work for you.
Hypothesis testing in Amplitude Experiment
When you run an A/B test, Experiment conducts an hypothesis test using a randomized control trial. In this trial, users are randomly assigned to either a treatment variant or the control. The control represents your product in its current state, while each treatment includes a set of potential changes to your current baseline product. With a predetermined metric, Experiment compares the performance of these two populations using a test statistic.
In a hypothesis test, you’re looking for performance differences between the control and your treatment variants. Amplitude Experiment tests the null hypothesis
$$ H_0:\ \delta = 0 $$
where
$$ \delta = \mu_{\text{treatment}} - \mu_{\text{control}} $$
states there’s no difference between treatment’s mean and control’s mean.
For example, you want to measure the conversion rate of a treatment variant. The null hypothesis posits that the conversion rates of your treatment variants and your control are the same.
The alternative hypothesis states that there is a difference between the treatment and control. Experiment’s statistical model uses sequential testing to look for any difference between treatments and control.
There are many different sequential testing options. Amplitude Experiment uses a family of sequential tests called mixture sequential probability ratio test (mSPRT). The weight function, H, is the mixing distribution. The following mixture of likelihood ratios against the null hypothesis is such that:

Frequently asked questions about sequential testing
For average totals and sum of property, Experiment waits until it has at least 100 exposures each for the treatment and control.Why hasn’t the p-value or confidence interval changed, even though the number of exposures is greater than 0?
For uniques, Experiment waits until there are at least 25 conversions and 100 exposures each for the treatment and control. After those thresholds, it starts computing the p-values and confidence intervals. For average totals and sum of property, Experiment waits until it has at least 100 exposures each for the treatment and control.Why don’t I see any confidence interval on the Confidence Interval Over Time chart?
What are we estimating when we choose Uniques?
What are we estimating when we choose Average Totals?
What are we estimating when we choose Average Sum of Property?
What is absolute lift?
What is relative lift?
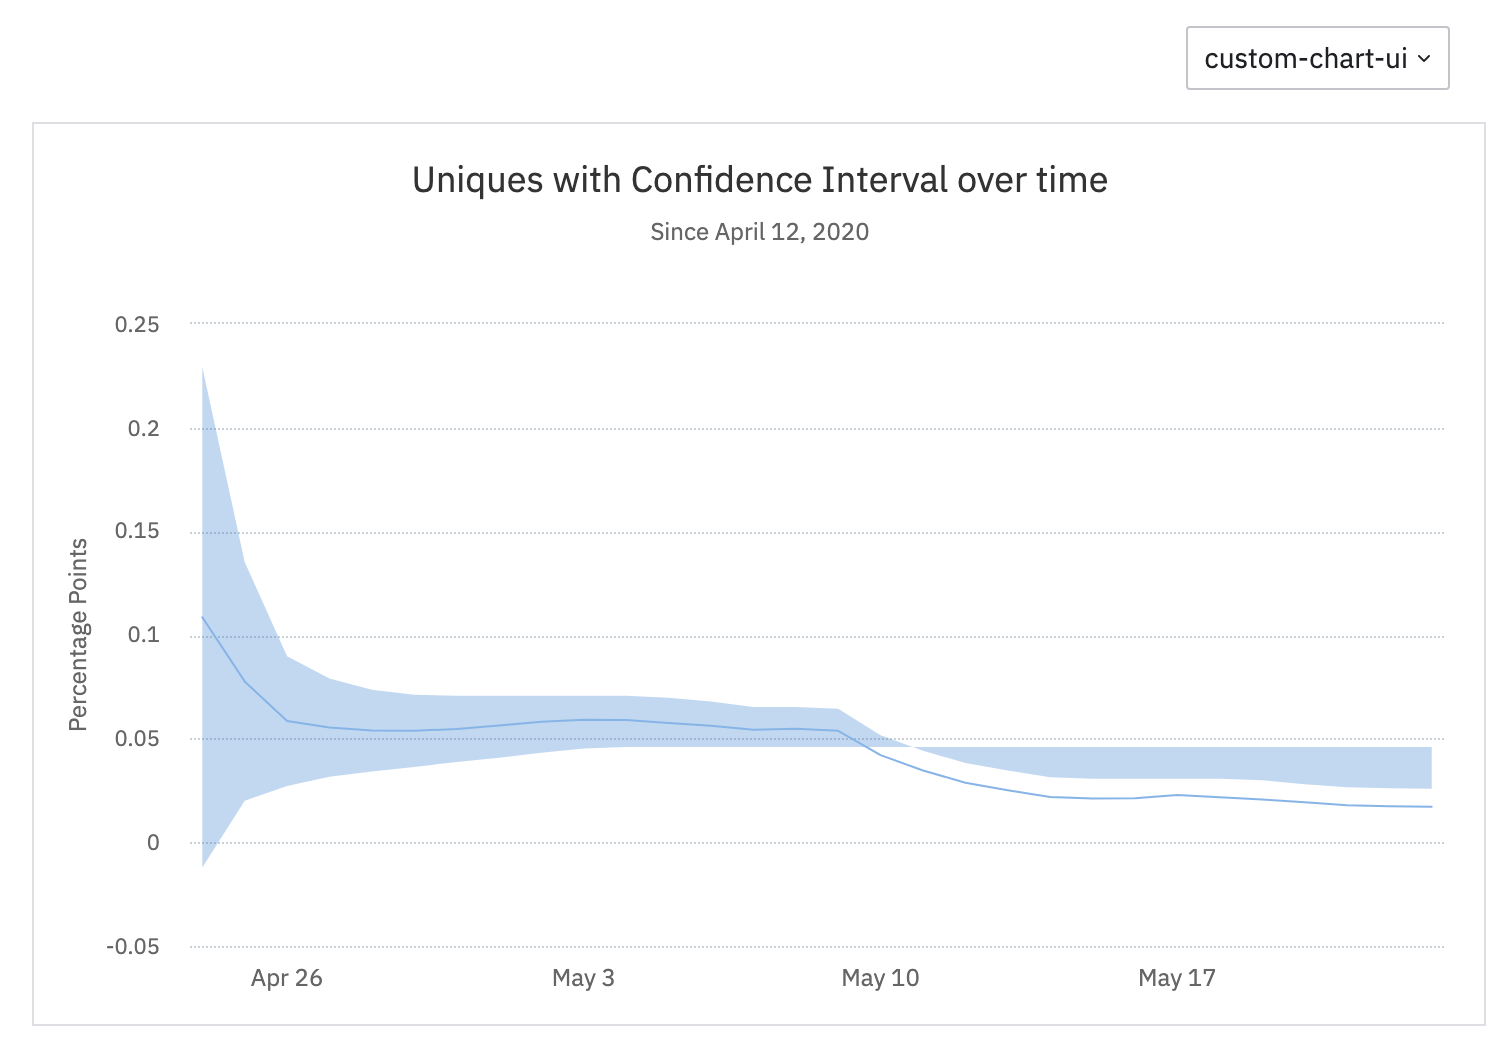
Experiment’s approach incorporates symmetric time variation, which occurs when both the treatment and control maintain their absolute difference over time and their means vary in sync. An option for you is to choose a different starting date (or date range) where the absolute lift is more stable and the allocation is static. This may also happen if there is novelty effect or a drift in lift over time. Sequential testing allows for a flexible sample size. Whenever there is a large time delay between exposure and conversion for your test metrics, don't stop the test before considering the impact of exposed users who haven't yet had time to convert. To do this, you could:Why does absolute lift exit the confidence interval?

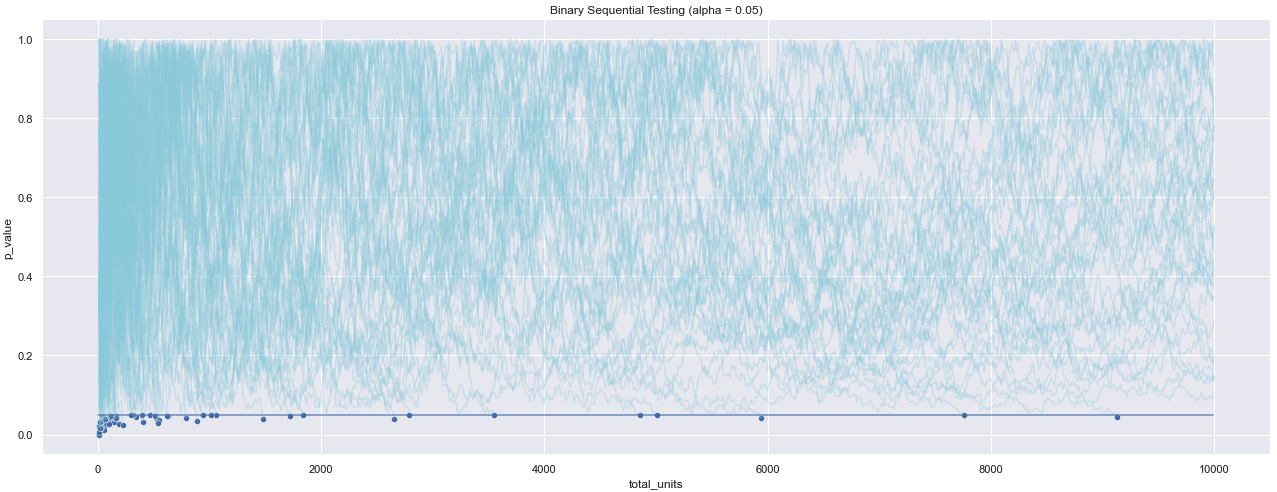
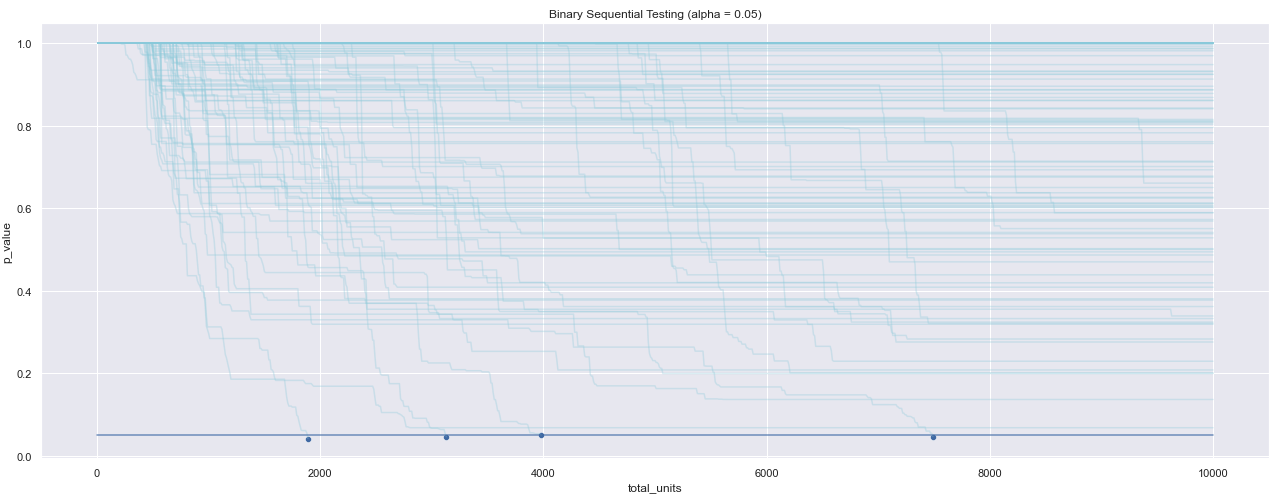
Below is a visualization of p-values over time in a simulation of 100 A/A tests for a particular configuration (alpha=0.05, beta=0.2). As a T-test was run on data coming in, results are reviewed at regular intervals. Whenever the p-value falls below alpha, the test is stopped and you conclude that it has reached statistical significance. In this example, the p-values fluctuate, even before the end of the test when it reaches 10,000 visitors. By reviewing results early, you inflate the number of false positives. The table below summarizes the number of rejections recorded for different configurations of the experiment when a T-test is run. In the table, the baseline is the conversion rate of the control variant, and delta_true is the absolute difference between the treatment and the control. Because this is an A/A test, there is no difference. With alpha set to 0.05, the number of rejections far exceeds that of the threshold set for Type 1 error. If you peek at the results, num_reject should never be higher than 5. Compare that to a sequential testing approach. In this example, there are, again, 100 A/A tests, and alpha is set to 0.05. Peeking at your results on a regular interval and the p-value goes below alpha. You can conclude that the test has reached statistical significance. As a result of using this statistical method, the number of false positives stays below this threshold: With always-valid results, you can end your test any time the p-value goes below the threshold. From 100 trials where alpha = 0.05, the number of those that fall below that threshold is 4, so Type 1 errors are still controlled. The table below summarizes the number of rejections for different configurations of the experiment when you run a sequential test with mSPRT: Using the same basic configurations as before, the number of rejections (out of 100 trials) is within the predetermined threshold of alpha = 0.05. With alpha set to 0.05, only 5% of the experiments yield false positives, as opposed to 30-50% when using a T-test.How does sequential testing compare to a T-test?

alpha
beta
baseline
delta_true
num_reject
0
0.05
0.2
0.01
0.0
0
1
0.05
0.2
0.05
0.0
0
2
0.05
0.2
0.10
0.0
1
3
0.05
0.2
0.20
0.0
0

alpha
beta
baseline
delta_true
num_reject
0
0.05
0.2
0.01
0.0
0
1
0.05
0.2
0.05
0.0
0
2
0.05
0.2
0.10
0.0
1
3
0.05
0.2
0.20
0.0
0
July 23rd, 2024
Need help? Contact Support
Visit Amplitude.com
Have a look at the Amplitude Blog
Learn more at Amplitude Academy
© 2026 Amplitude, Inc. All rights reserved. Amplitude is a registered trademark of Amplitude, Inc.