Interpret your analysis, part 1
This article helps you:
Understand what your Event Segmentation analysis is telling you
AMPLITUDE ACADEMY
Understand User Behavior with the Event Segmentation Chart
Use Amplitude's Event Segmentation chart to learn what drives user behavior.
Learn Event SegmentationAmplitude's Event Segmentation chart helps you understand what specific groups of users are doing in your product. For example, in an event segmentation analysis, you can:
- Identify the top events fired over a selected time
- Compare event totals to each other
- View which users fire certain events
Before you begin
Familiarize yourself with the basics of building charts in Amplitude, as well as how to create an Event Segmentation chart.
Interpret your Event Segmentation chart
Event Segmentation is Amplitude's most commonly used chart. This article explores these features and explain how you can best put it to use to generate insights on user behavior.
Breakdown table
Below the chart, there's a breakdown table. By default, Amplitude includes all top values or events in this table, which update automatically when Amplitude receives new top values or events. You can turn this off by first deselecting the segments and then explicitly selecting the values and events you want to keep.
Change your chart view
Whichever metric you choose, you have several options for displaying results on the chart.
- The default setting is a basic line chart. These are useful for looking at the trend of one event for one user category over time.
- Stacked area charts are useful when you’re looking at data that breaks down into discrete buckets, like when you’re analyzing multiple events.
- Bar charts are good for situations when you want to show a distribution of data points, or compare metric values across different segments of your data. Bar charts make it easy to see which values are highest or most common, and how specific groups compare against the rest.
- A stacked bar chart shows how broad categories or buckets divide into smaller ones, as well as the relationship each of those smaller parts has to the overall total.
- A Pie chart displays each result as a percentage of the total.
- KPI displays a grid with the current total values, or average values over a time range you select.
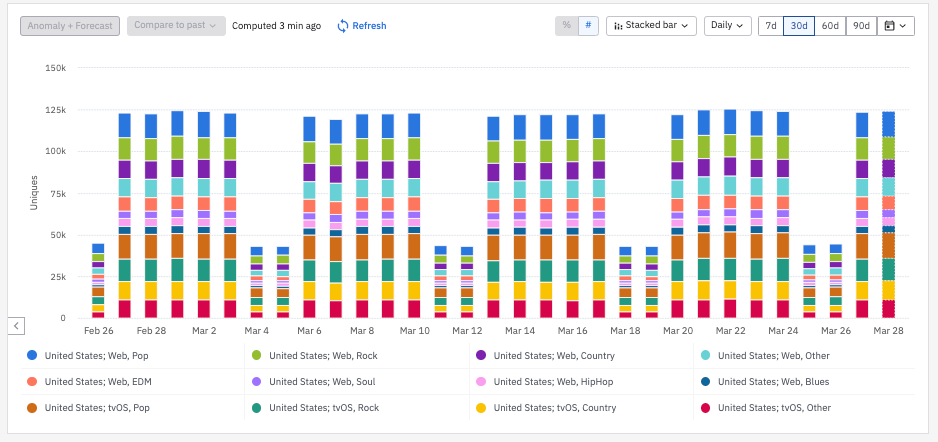
If your analysis uses multiple group-by conditions, the resulting visualization might turn out confusing and hard to interpret.
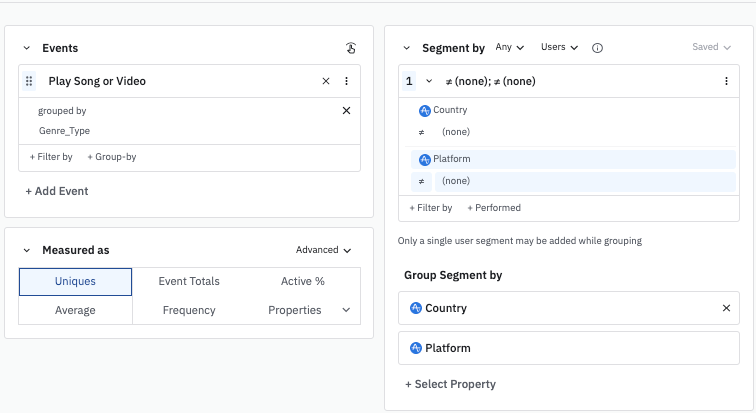
For example, here the control panel groups the Play Song or Video event by Genre_Type, with segmentation by Country and Platform.

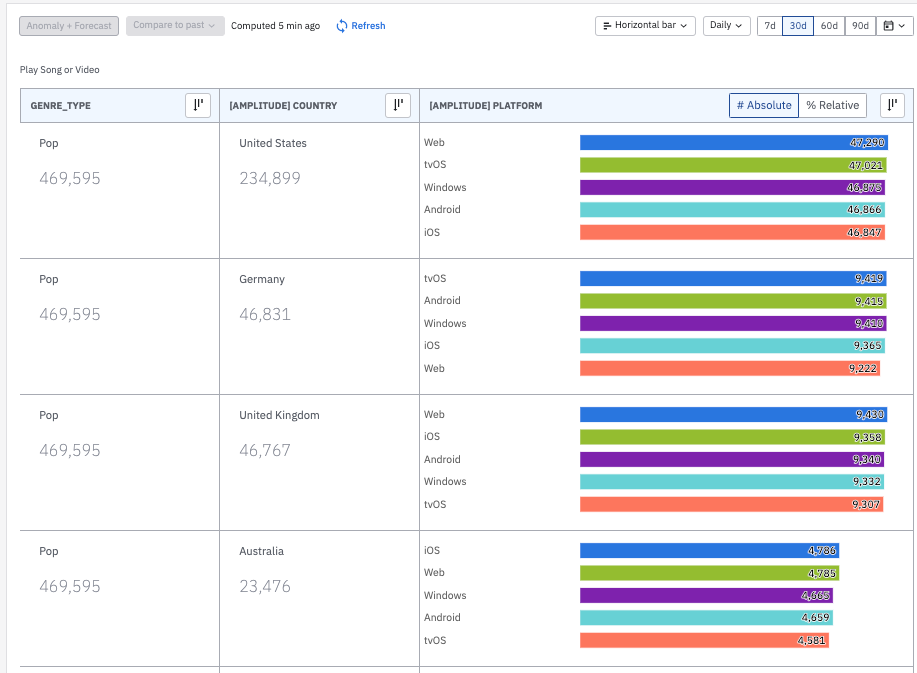
While it’s not specifically a chart type, the group by visualization will clarify your data in these circumstances. With more than one group by or segmentation, the resulting chart is difficult to understand.

- Instead of a temporal or “bucket-based” chart, the horizontal bar chart generates a table view, breaking out the group by events and segmentation properties into separate columns. This makes it easier to digest and cross-reference the data. In the below example, users in the United States who played Pop songs were more likely to be doing so from a Web platform—but not by much:

See this Help Center article for more information on the syntax and limitations of group-by conditions.
Switch between absolute totals and relative percentages
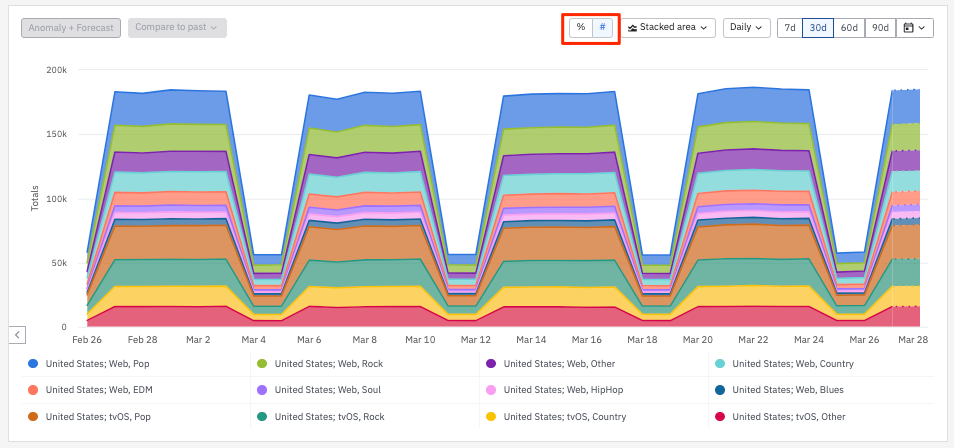
When using stacked area charts and stacked bar charts, you can choose to view your analysis in terms of relative percentages instead of absolute totals.

# Absolute will display the overall user volume, whereas % Relative gives you the series value divided by the sum of all the series values.
Note
UNIQUES metric for each event. The % Relative will then be available after you choose the formula option.Be aware that this method will count unique users per event. One user could then be counted more than once if they trigger multiple events within the same time window. This is why the microscope's sum of unique users may be higher than the number of unique users overall.
Learn more
Next, learn about the advanced features of segmentation analysis in Amplitude, including averages, windows, and cumulative totals.
October 16th, 2025
Need help? Contact Support
Visit Amplitude.com
Have a look at the Amplitude Blog
Learn more at Amplitude Academy
© 2026 Amplitude, Inc. All rights reserved. Amplitude is a registered trademark of Amplitude, Inc.