Interpret your analysis, part 2: Advanced features
This article helps you:
Use the features of the Measured As Module to customize your analysis
AMPLITUDE ACADEMY
Understand User Behavior with the Event Segmentation Chart
Use Amplitude's Event Segmentation chart to learn what drives user behavior.
Learn Event SegmentationThis article explores some more advanced features available to you as you interpret your event segmentation analyses. For a primer on the basics, review part one.
Rolling averages
Rolling averages will display the unweighted mean, which works to smooth out a chart. This is useful if you have cyclical users—for example, people who use your product during the week, but not on weekends.
To apply a rolling average to your chart, click Advanced and select Rolling Average from the drop-down list.
Note
This chart displays the daily event totals, without a rolling average. Notice the sharp peaks and valleys in the line.
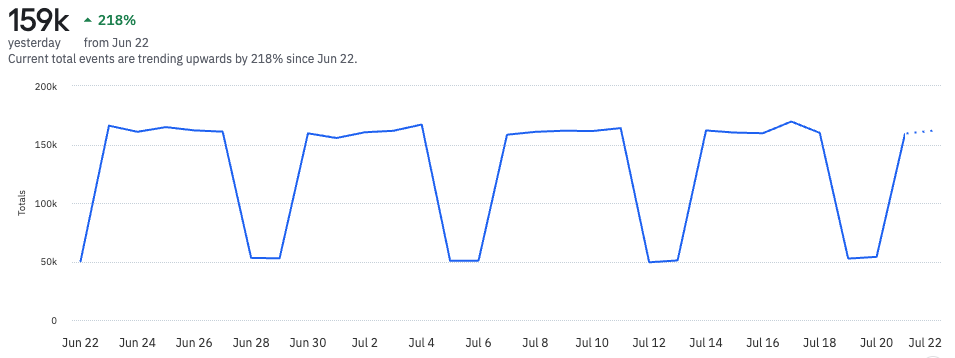
But when you add a rolling average of seven days, those fluctuations disappear. That’s because each data point is now an average of the previous seven days’ worth of data.
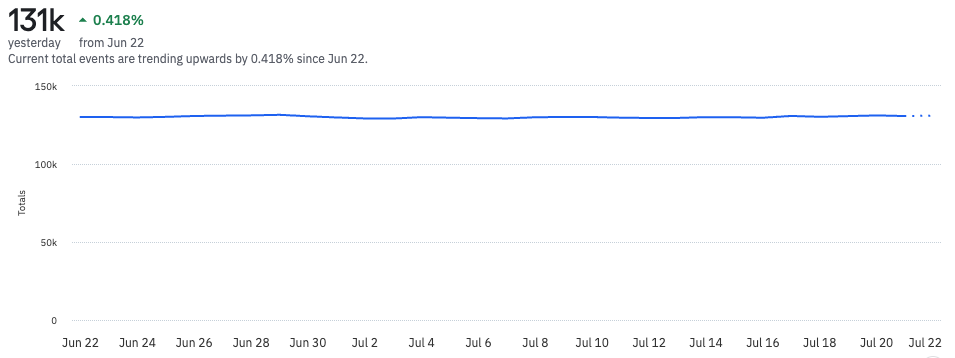
Bear in mind that each day’s data is included in that day’s data point:
- When looking at the current day, Amplitude uses a dotted line to show data collection for today isn’t finished. Use an Offset in the date picker to exclude the current day from your analysis.
- Also, with aseven-day rolling average, the first six days of your selected time period fetch data from outside the selected time period. For example, in an analysis covering the month of February, the result for February 6th averages data over January 31st to February 6th.
Rolling windows
A rolling window is another method of smoothing out your data. It will display the aggregate last N days of information in a single data point. This is useful if you want to view aggregated metrics—such as your 7-day active user count—on a daily basis.
This differs from the rolling average, in that a rolling window doesn't average your data over the selected time frame. Instead, it sums the data.
To apply a rolling window to your chart, click Advanced and select Rolling Window from the drop-down list.
Note
This chart displays event totals without a rolling window.

Below, the the event totals display with a rolling window of seven days. Each day represents a sum of the previous seven days worth of events.
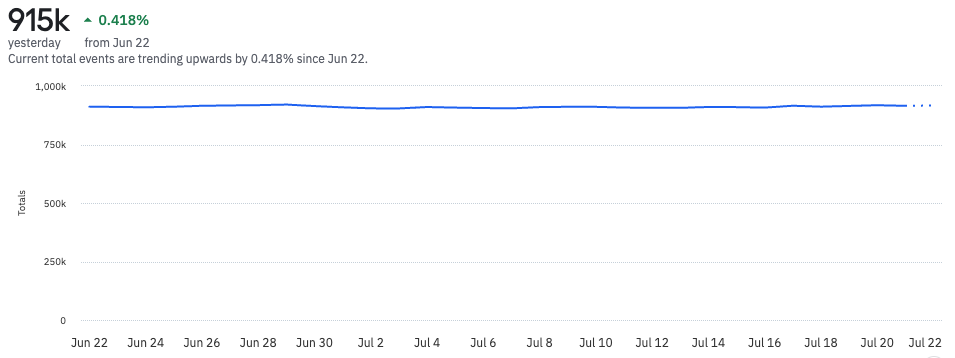
As with a rolling average, when using a seven-day rolling window, the first six days of your selected time frame will fetch data from outside the selected time period. For example, in an analysis covering the month of February, the result for February 6th would average data over January 31st to February 6th.
Cohort filtering
When you select a rolling window, you can specify if aggregation happens before or after Amplitude filters results according to the cohort or cohorts you select.
- before cohort filter: Amplitude aggregates the event data, then applies the cohort and filters the results.
- after cohort filter: Amplitude applies the cohort and filters the results, then aggregrates the resulting event data.
Cumulative sum
Cumulative sum displays a running total of events in a single data point. For example, you might want to show a running total of revenue generated by purchase events. Cumulative sum helps you do that.
To apply a cumulative sum to your chart, click Advanced and select Cumulative from the drop-down list.
Note
This chart shows a running total of purchases using the Complete Purchase event. The April 19th data point represents a sum of purchases on all the preceding days of the selected time frame. Here, that means April 5th to April 19th.
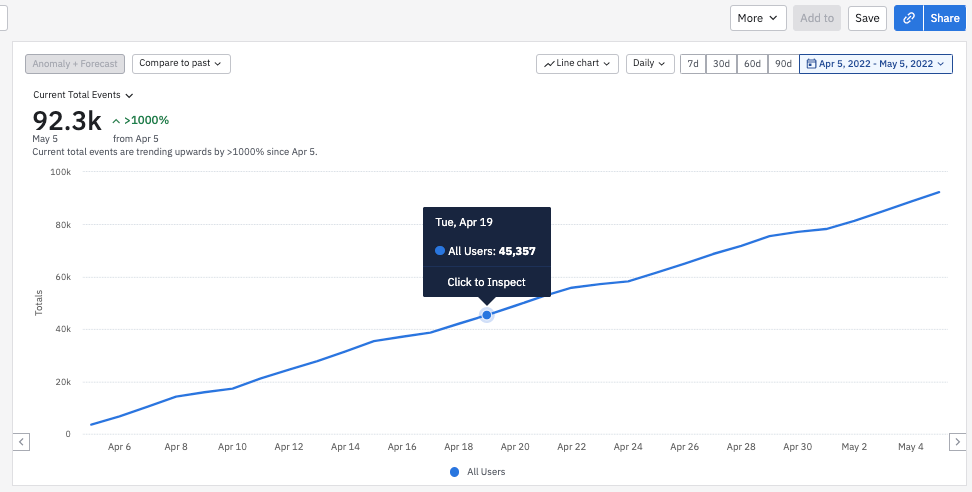
Using cumulative sum with uniques generate a count of unique users for each data point, with duplicates removed.
For example:
- On April 5th, User A triggered
Complete Purchase. - On April 11th, User A and User B triggered
Complete Purchase. - On April 19th, User C and User D triggered
Complete Purchase.
On the data point for April 19th, a total count of four will be returned because four unique users fired this event from April 5th to April 19th.
Real-time segmentation
View segmentation data in real time. However, there are some caveats:
- You can only segment one day's worth of data for real-time.
- The event times are rounded down.
- Charts are cached every five minutes for everyone.
Period-over-period comparison (compare to past)
Using Compare to past, you can compare the results of the current time range with the previous day, or the same day from previous week, month, quarter, or year.
For example, you want to compare completed purchases for the current week to last week.
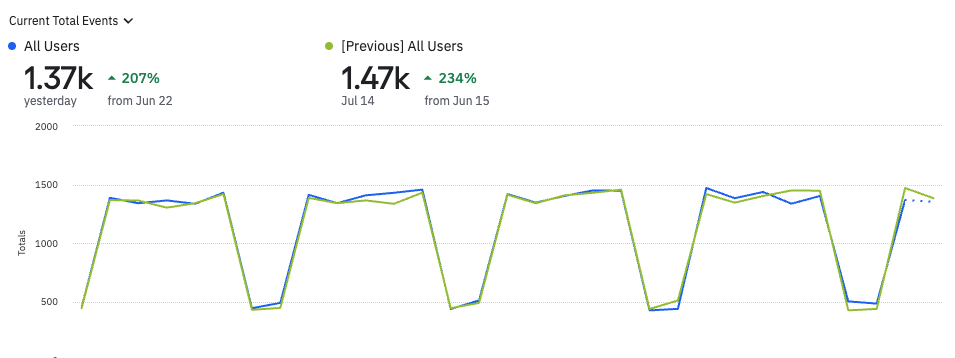
The blue segment shows you the current period and the green segment shows you your data for last week.
Since the period-over-period comparison interval is configurable, you can choose what dates you actually want to compare. You can also toggle to view the percentage change between values instead.
Period-over-period for custom formulas
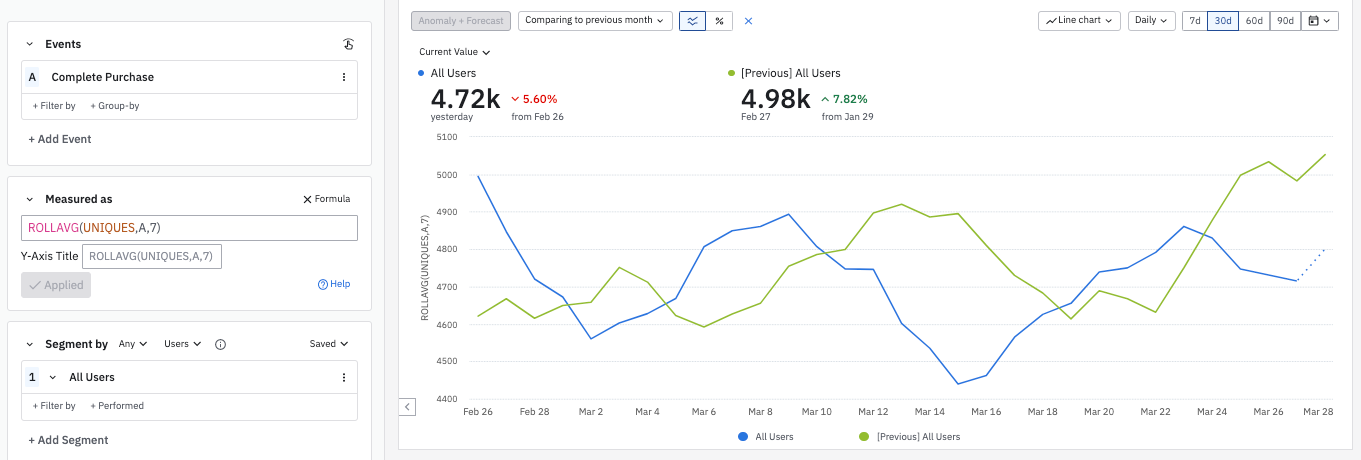
You can also use the period-over-period comparison with the custom formula metric. For example, you can compare your current rolling average with that of the previous month:
October 16th, 2025
Need help? Contact Support
Visit Amplitude.com
Have a look at the Amplitude Blog
Learn more at Amplitude Academy
© 2026 Amplitude, Inc. All rights reserved. Amplitude is a registered trademark of Amplitude, Inc.