Use session metrics to evaluate content paths
This article helps you:
Use legacy metrics to enhance your analyses
Sometimes considered "legacy metrics," session metrics, like bounce rate or exit rate—are helpful diagnostic tools for obtaining a deeper understanding of the performance of campaigns or content items.

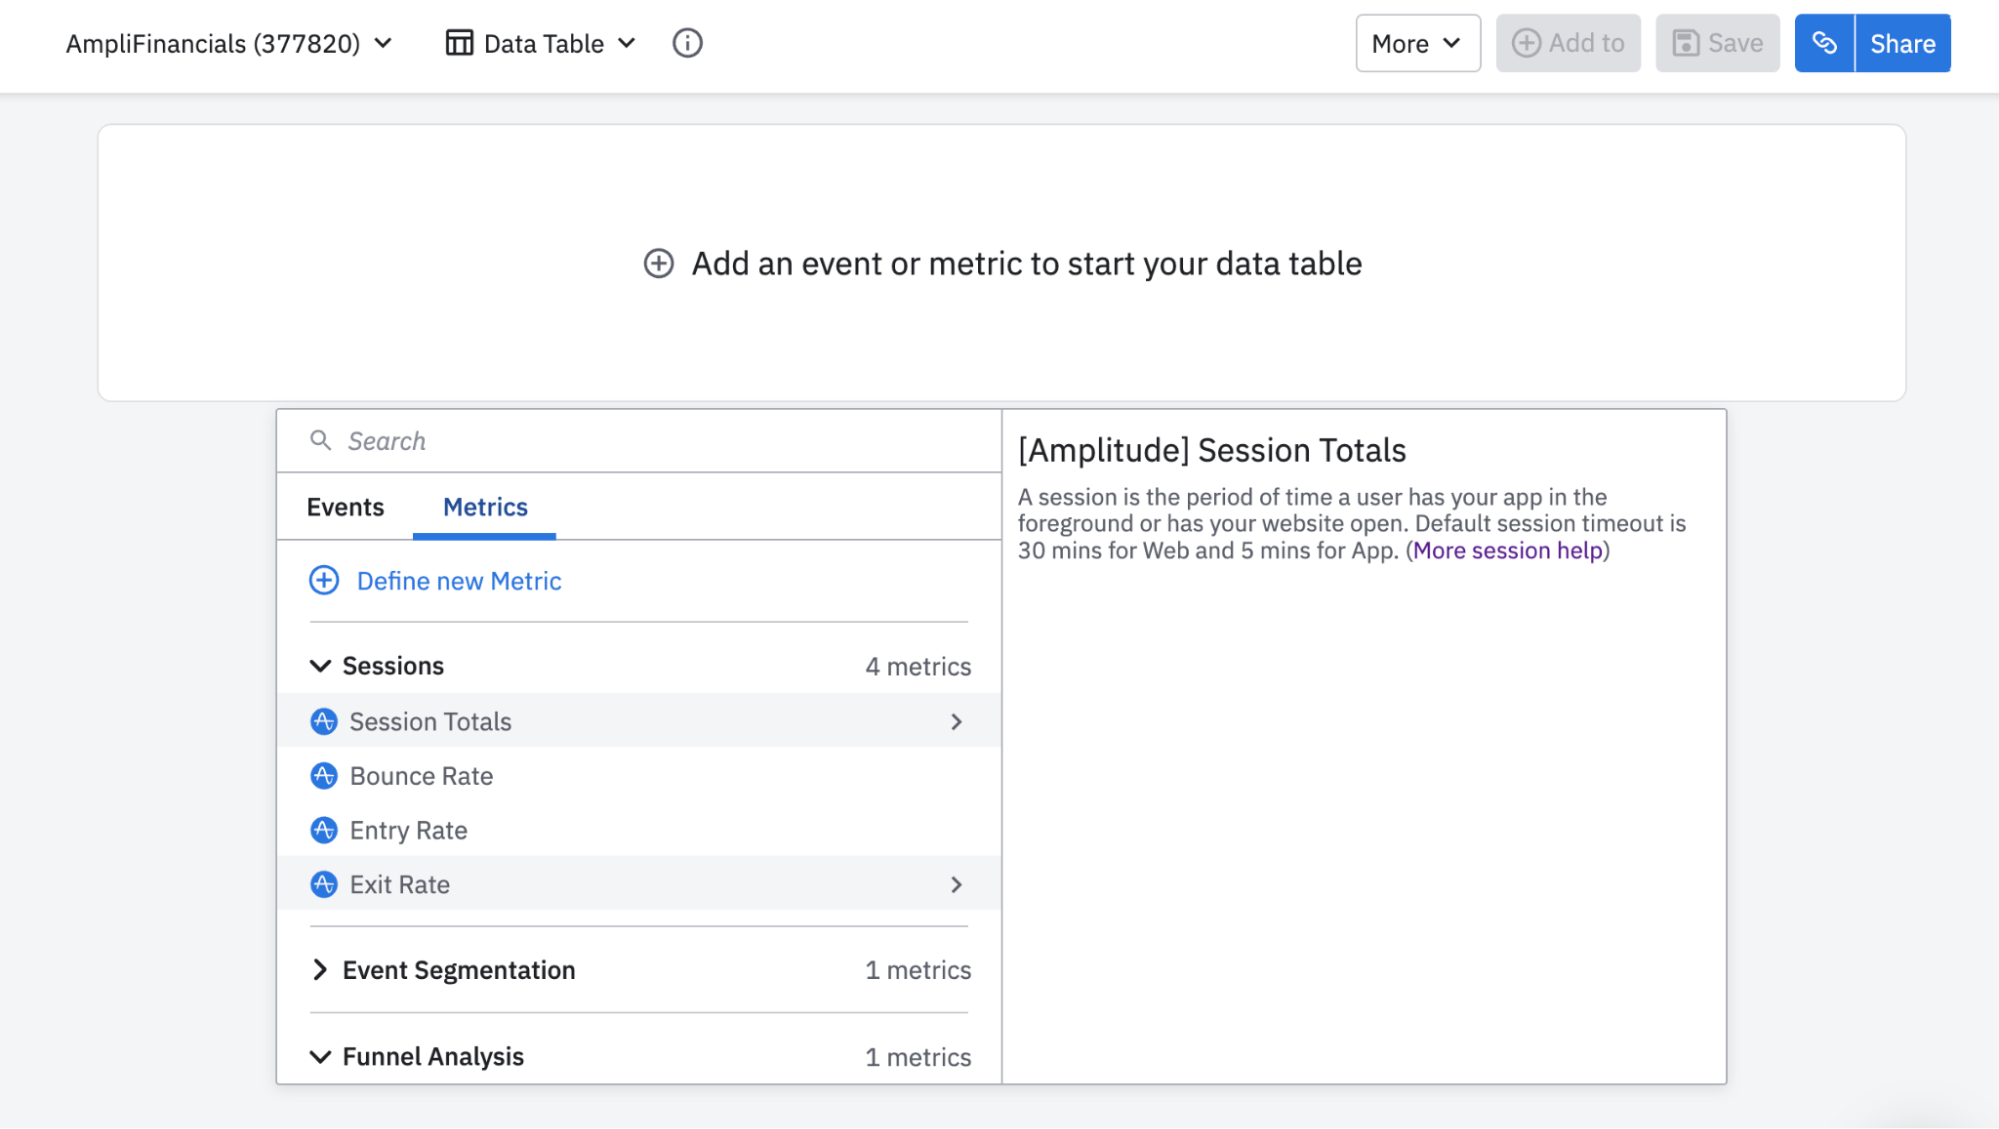
In Amplitude Analytics, you can find session metrics in the Data Tables charts, on the Metrics tab. Other than session totals, session metrics—bounce rate, exit rate, entry rate, entries, and exits—aren't available as standalone metrics in Amplitude Analytics. Instead, Amplitude calculates these session metrics from the group-by you select, and will only include active events in the computation. Amplitude Analytics uses the group-by to decide how many values are present, and the sequence to be used for calculation.
Note
Select a good group-by property
The most common properties to select for your group-by are page- or screen-level properties that change as a user interacts with your app or site. These work well because they're likely to vary between most of the relevant events, and are set frequently enough to signal a bounce when needed.
Note
Example: Group-bys and session metrics
Amplitude uses the number of values of your group-by property to decide whether to classify a session as a specific metric, such as bounce, entry, or exit.
Here are three example sessions:
Session 1
- Event:
Page View
Page= A - Event:
Click
Name= 1A
Type= Ad - Event:
Page View
Page= B
Session 2
-
Event:
Page View
Page= B
Name= 1A
Type= Ad -
Event:
Click
Name= 1B
Type= Ad
Session 3
- Event:
Buy
Amt= $15
Prod= 1
A Page View event is either a default event captured through the Browser SDK, specified in the settings in Amplitude’s Marketing Space, or defined in a Data Tables analysis as a bounce rate metric.
Bounce
A bounce is a session where the user triggers only one Page View event. This is also known as a single-page session.
Amplitude calculates the bounce rate as a percentage based on the following formula:
count of single-page sessions / the **total** number of sessions
Amplitude calculates bounce rates with a group-by by:
count of single-page sessions grouped by the first **non-null** property value /
the total number of sessions grouped by the first **non-null** property value
To decide if the example sessions above are a bounce:
- Regardless of the group-by property, like
PageorName, Session 1 would not be counted as a bounce because it contains more than onePage Viewevent. - Session 2 only contains one
Page Viewevent. If you grouped by theNameevent property, Amplitude Analytics will classify this session as a bounce. It would be grouped by theNamevalue of "1A" since it appears first in the session, and the bounce rate would be 1 / 2 (50 percent). - Regardless of the group-by property, Session 3 would not be counted as a bounce because it does not contain any
Page Viewevents.
Entry and exit
Session Entries are defined by the first non-null value for the group by's property within the session. Session Exits are defined by the last non-null value for the group by's property within the session.
The entry and exit rates are then calculated as a percentage using the following formula:
the number of entries or exits / the **total** number of sessions
Note
Example, for the same sessions above:
- If you group by the
Nameevent property, both the entry and exit rates are grouped under "1A" because it's the first property value ofName. The entry rate would be 2 / 3 (66.66 percent) and the exit rate 1 / 3, or 33.33 percent. - If you group by the
Pageevent property, the entry and exit rates are grouped by “B.” The entry rate would be 1 / 3, or roughly 33.33 percent. The exit rate would be 2 / 3 (66.66 percent).
Differences between session totals and PROPCOUNT(session IDs)
It's common to want to compare results of one Amplitude chart versus another, but not all chart analyses are interchangeable.
For example, you can't compare the results of a session totals query in a Session Metrics chart versus the PROPCOUNT(session IDs) formula in the Event Segmentation chart.
These two analyses can't be compared because of the following differences in their logic:
| Session totals query in Session Metrics chart | PROPCOUNT(session IDs) formula in an Event Segmentation chart |
|---|---|
| Measures an exact total | Measures an estimate of distinct property values |
| Measurement counts unique pairings of user IDs and session IDs | Does not count unique pairings of user IDs and session IDs, and have different results when multiple users have the same session ID |
| Session IDs aren't tracked for custom session definitions, so they cannot be counted with the PROPCOUNT(session IDs) formula |
May 30th, 2024
Need help? Contact Support
Visit Amplitude.com
Have a look at the Amplitude Blog
Learn more at Amplitude Academy
© 2026 Amplitude, Inc. All rights reserved. Amplitude is a registered trademark of Amplitude, Inc.