Understand the paths users take, and why they convert
This article helps you:
Analyze conversions between the key transition points in your product
AMPLITUDE ACADEMY
Discover User Paths with Journeys
Learn how to discover and confirm paths users take within your product by using the Journeys chart.
Learn Journey AnalysisAmplitude’s Journeys chart incorporates the power of the legacy Journeys, and Pathfinder Users charts to generate a complete, 360-degree analysis of how your users convert—or fail to convert—between key transitions in your product. It allows you to inspect your users’ product journeys in two ways:
- By the total number of unique users who took a particular path.
- By the total number of times they opted for that path.
Uniques versus totals
- When counting uniques, Amplitude counts the first conversion per user in the given time range.
- When counting totals, Amplitude counts every conversion in the time range.
Within a Journeys chart, you can:
- Start with Pathfinder for a high level exploration of paths your customers take and drill in on a particular branch based on a starting event, ending event, or between two events. This is a helpful starting point if you don’t necessarily know what you want to see.
- Dive deeper with Journey Map to compare all your customer paths against each other and understand the details: analyze paths by frequency, similarity, or average time to complete; easily see where paths branch out at the most detailed level; or compare converted vs. dropped-off paths.
A common use case for Journeys is to bridge the gap between your ideal customer journey—which you can generate in a funnel chart—and the customer journeys your users are actually taking, as shown in a Journey Map or a Pathfinder analysis.
Read the article Understand and use the Journeys visualizations for more information on the Pathfinder and Journey Map visualizations.
Create a Journeys chart
A Journeys chart lets you analyze paths that:
- include specific events
- exclude specific events by property
- expand events by property
- measure paths within a specific conversion window
- analyze by a single segment
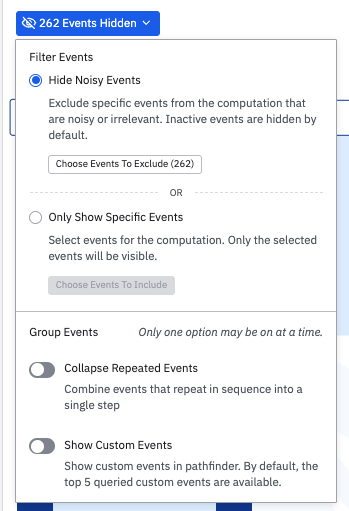
You can also hide noisy events, only show specific events, collapse repeated events, and view custom events. Any settings you change while viewing one visualization carry over to the others.
Finally, in any Journeys visualization, you can remove an event, expand an event by property, filter by sequences that include the event and property pair, or create a cohort from an event. Just click the event and select the option you want from the menu that appears.
To create a new Journeys chart, follow these steps:
-
Click Create > Chart > Journeys.
-
In the Paths module, use the dropdown to specify whether you want to build a path starting with a specific event, ending with a specific event, or a path between two specific events.
-
Click + Add Event and add your desired event.
-
In the Filter by paths, expand by property module, click:
- + Add event to filter to narrow your results so that they only include paths in which your specified event appears;
- + Add event to exclude to hide specified event and property values from the results;
- + Add event to expand to group by an event and view property values separately (this is essentially the same as applying a group-by condition).
-
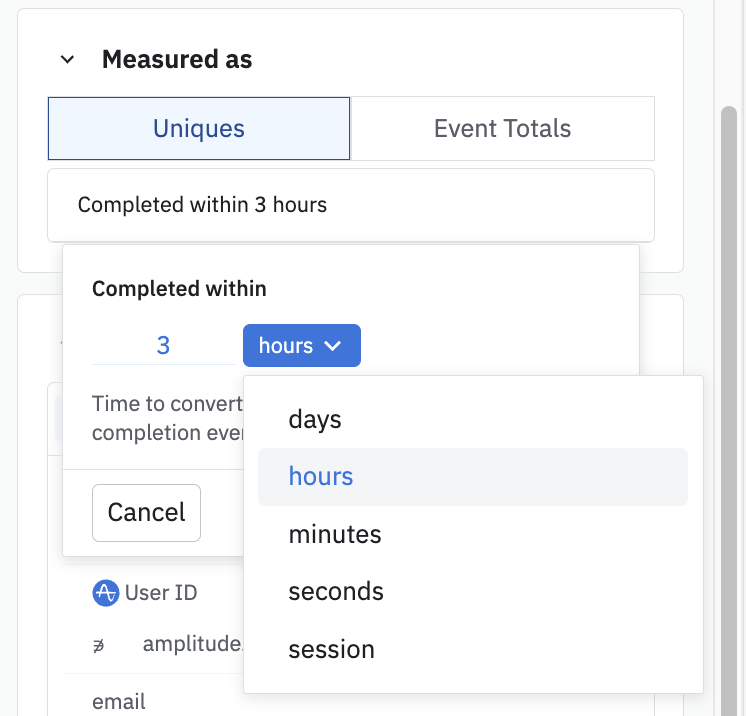
In the Measured As module, specify whether you want this chart to measure by uniques or event totals.
-
In the Segment by module, specify the users you’d like to include in this analysis.
-
In the chart area, click + More Events to load more events into the the chart. By default, Amplitude loads the top five events by number of users.
-
Your chart appears. If you want to hide noisy events, show only specific events, show custom events, or collapse repeated events, click the Filter Events dropdown and make your selections.
Note

Any changes you make to settings in this procedure populate across all Journeys visualizations, which you can read more about here.
How the conversion window works in a Journeys chart
Like any other Amplitude chart, Journeys requires a length of time to use as the basis for your analysis. In a Journeys chart, this is the conversion window.

Conversion windows can use clock time or sessions to define the window. When you set the window to a unit of clock time, your chart includes event paths that users completed within that length of time, no matter how many sessions it took.
When you set the window to one session, your chart includes event paths that users completed within a single session, no matter how much time elapsed (as long as it doesn't exceed the length of time covered by the chart).
For information about Journeys visualizations, see Understand and use the Journeys visualizations.
April 1st, 2025
Need help? Contact Support
Visit Amplitude.com
Have a look at the Amplitude Blog
Learn more at Amplitude Academy
© 2026 Amplitude, Inc. All rights reserved. Amplitude is a registered trademark of Amplitude, Inc.