Build a usage interval analysis
This article helps you:
Discover how long it takes users to trigger your product's critical event
A usage interval analysis is related to a retention analysis, but it works a little differently. While a simple retention analysis measures the amount of time between a starting event and a return event, a usage interval analysis considers return events only. It’s intended to show you how long users go between triggering your product’s most important event—its critical event.
For more details on usage interval analyses and what they mean, see our Help Center article on interpreting your retention analysis.

To build a usage interval analysis, follow these steps:
- In the Measured As module, click Usage Interval.
- In the Events Module, select the return event. This should be your product’s critical event.
- If desired, add properties to your return event by clicking on + Filter by, selecting the property name, and specifying the property value you’re interested in.
Note
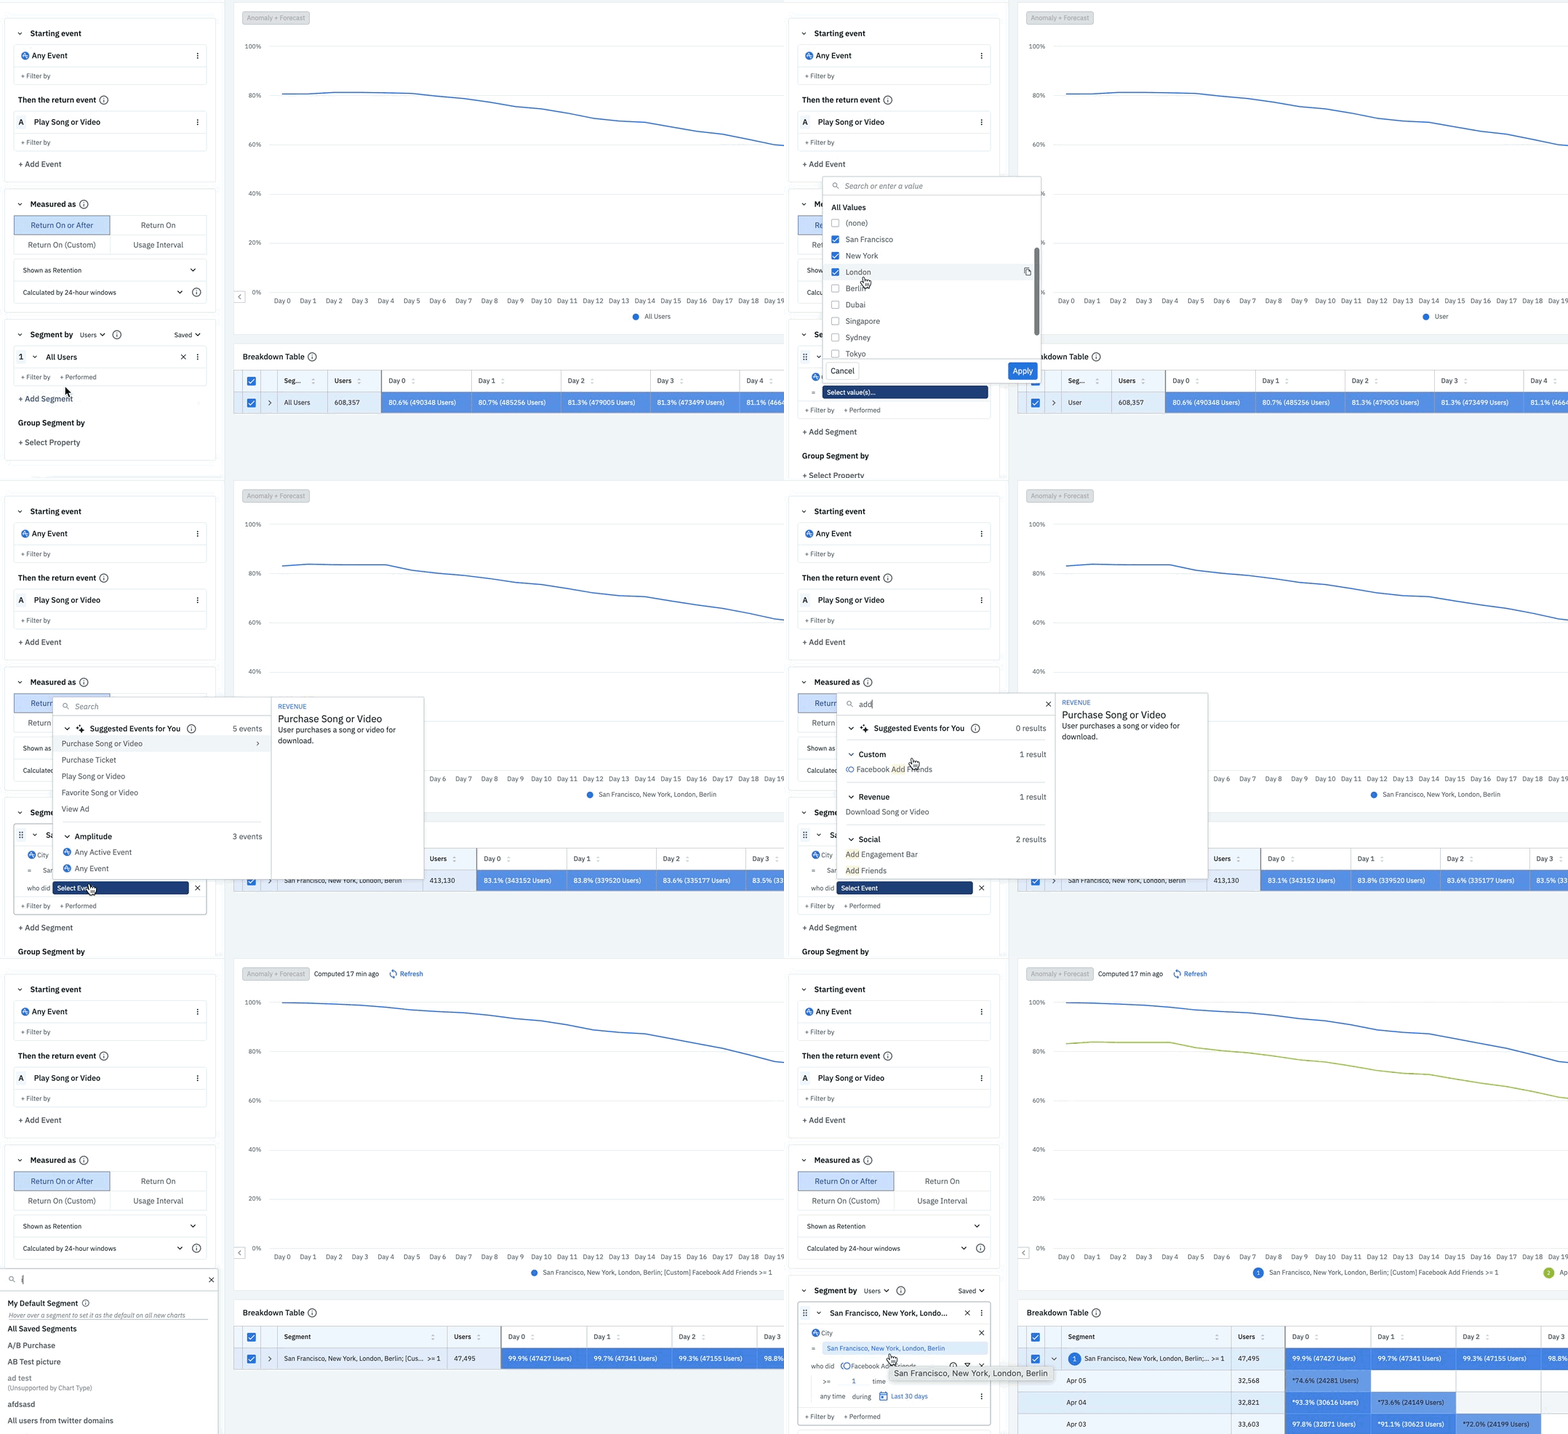
- In the Segmentation Module, identify the user segment you want to include in this analysis. You can import a previously-saved segment by clicking the Saved dropdown and selecting the one you want from the list. Otherwise, Amplitude begins from the assumption that your analysis will target all users.
- If you do not want to import a previously-saved user segment, you can start building your own by adding properties. To do so, click + Filter by, choose the property you want to include, and specify the property value you’re interested in.
- You can narrow your focus even further by telling Amplitude you only want to include users who have already performed certain actions. To do so, click + Performed and choose the event you’re interested in.
- If desired, add another user segment by clicking + Add Segment, and repeating steps 4 and 5.
You should now see your usage interval analysis, along with a tabular view of your results.
But what does it mean? For the answer to that, check out our Help Center article on interpreting your usage interval analysis.
May 29th, 2024
Need help? Contact Support
Visit Amplitude.com
Have a look at the Amplitude Blog
Learn more at Amplitude Academy
© 2026 Amplitude, Inc. All rights reserved. Amplitude is a registered trademark of Amplitude, Inc.