Dig deeper into experimentation data with Experiment Results
This article helps you:
Extend the analytic power of A/B tests you create in Amplitude Experiment
Experiment results lets you delve into the data that was collected from your experiments. Experiment results can incorporate data and information from non-Amplitude feature-flagging platforms and use that external data within Amplitude's native planning, tracking, and analysis tools. This data is incorporated into Amplitude's A/B tracking data which is generated through Experiment.
Before you begin
Before using Experiment Results, ensure you’ve instrumented the metric events that are relevant to your experiment. Without metric events, you can't create the success metrics and goals that Experiment Results needs to compare each variant in its analysis.
Additionally, make sure you’ve instrumented the necessary exposure events, which represent the delivery of a variant to a user participating in the experiment.
You may also find information in the Experiment Results FAQ article page.
Analyze an A/B test using Experiment Results
To create an A/B test and view the results
-
Navigate to Create > Chart > Experiment Results.
-
In the Metrics module, click Add Metric or Define single-use metric to define your primary metric.
-
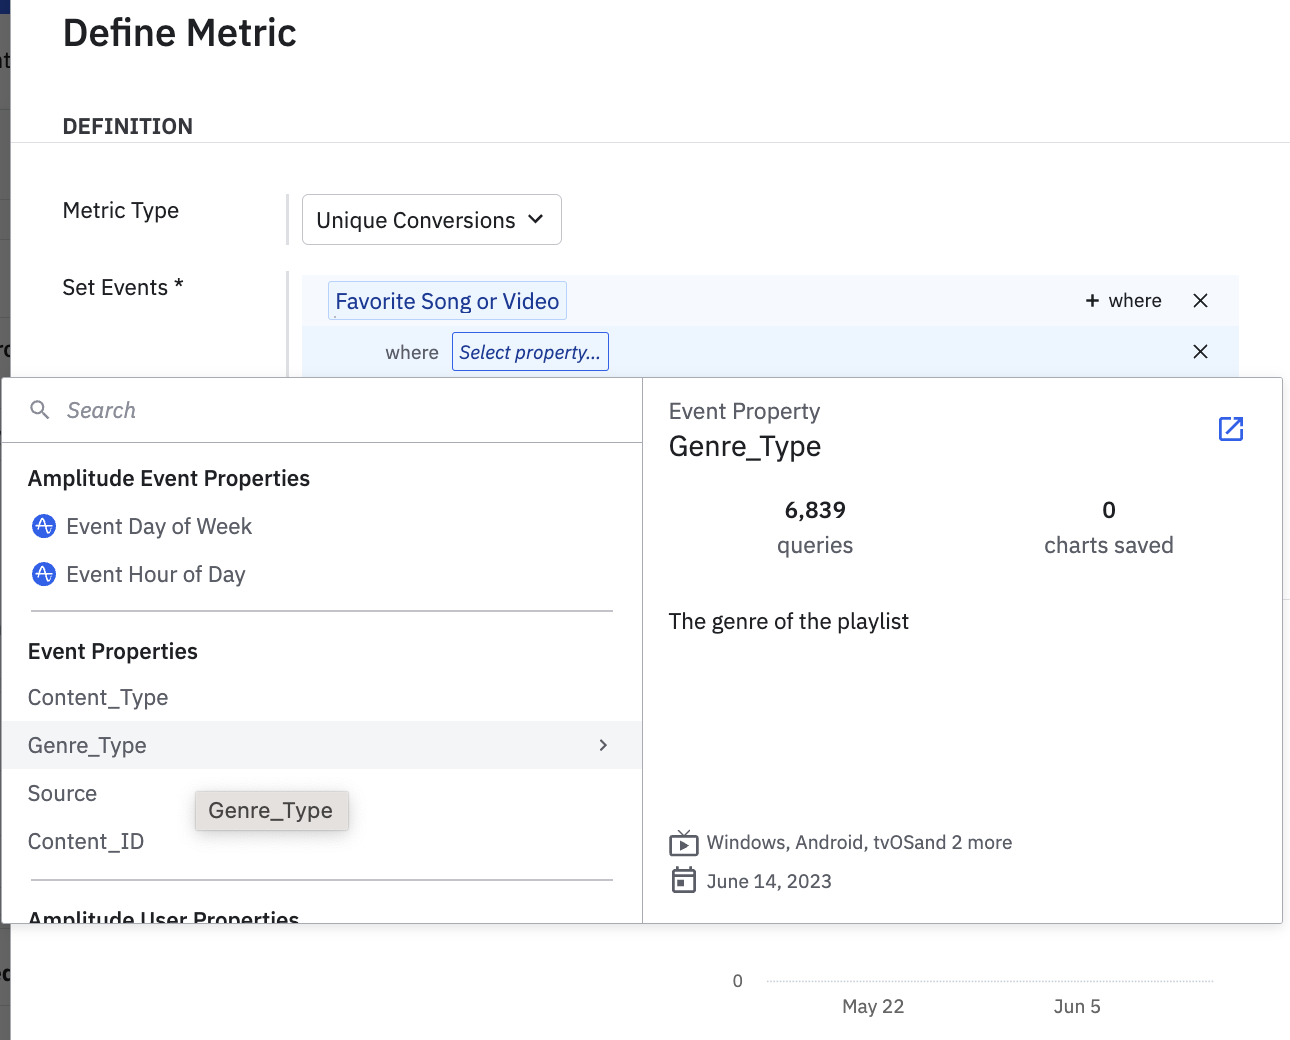
If adding a single-use metric, use the drop-down menu to specify the metric type. You can choose one of:
- Unique conversions
- Event totals
- Sum of property value
- Average of property value
- Funnel conversion
- Formula
Note
The Retention metric has been deprecated and is no longer available.The first four are available for individual event metric analyses, while funnel conversion allows you to define a multi-step journey that users must complete for the conversion to count. The Formula metric allows you to define a formula centered around a selected event or events.
Note
Any of the above metrics can be used as a custom metric during the design phase in Amplitude Experiment. -
Specify the event to use for this metric. You can also filter the event using a Where clause.
-
When you’re finished, click Done.

Optionally, click Add Metric or Define single-use metric in the Secondary Metrics module to add a second, subordinate metric to the analysis. You can add multiple secondary metrics as necessary.
-
Click Add Event in the Exposure module to define your experiment’s exposure event. The exposure event is the event users must trigger to become part of the experiment.
-
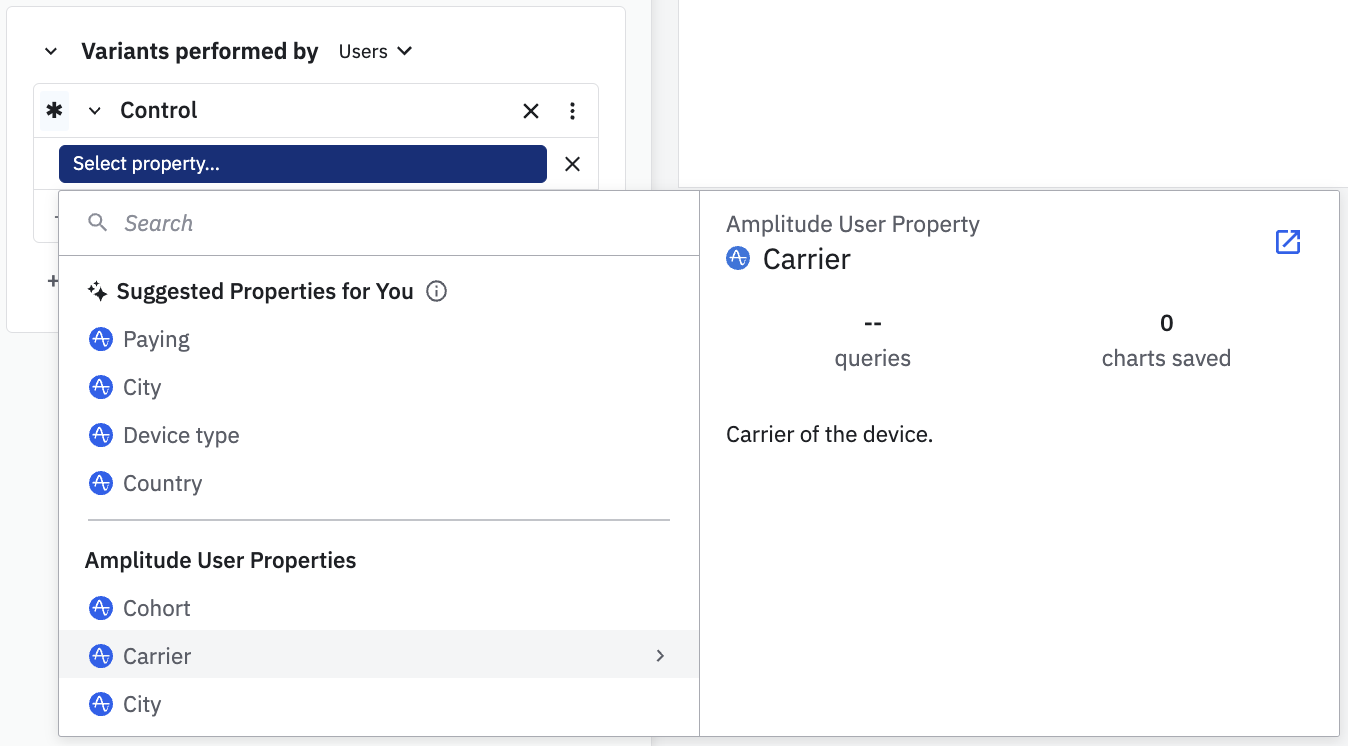
In the Variants performed by module, click Add Experiment Variant to add your variants. All experiments require at least one variant, known as the control.

Choose the properties and values that defines your variant and click Apply.
- Click Add Experiment Variant to add additional variants to reflect the experiment setup in your feature flagging system.
Amplitude calculates your statistical results as they're available and displays them in the Results area. The described results let you modify your experiment's statistical settings, such as from the default Sequential test to a T-test.
Interpret your results
While the specifics may vary depending on the metric types you’re using, four charts depict your results:
- Confidence interval of absolute performance over time: This chart is for sequential testing only. It can help you identify when the experiment reaches statistical significance; which occurs when the confidence interval no longer includes zero.
- Cumulative exposure: This chart details the number of users who receive your experiment over time. The x-axis displays the first date of a user's exposure, and the y-axis displays a cumulative, running total of users exposed to the experiment.
- Performance by variant: The title of this chart is the metric you're focused on. The chart shows the number of users who did each step of a funnel, or the means of each variant if the metric isn't a funnel.
- Mean over time (cumulative or non-cumulative): On the x-axis, find the date the user was first exposed. On the y-axis is the mean of the selected metric. Click the dropdown under the metric table to select a metric. Amplitude selects the recommendation metric by default for each variant. This chart is like the conversion over time chart except that it also works for non-conversion metrics. From this chart, you can understand if there is any seasonality, novelty effects, or trends over time. Usually, the mean for days near the start of the experiment is larger than the mean for days near the end of the experiment because users at the start of the experiment have had more time to do the metric. This is less of a concern if you use the exposure attribution window. You can look at the cumulative or the non-cumulative view of this chart. The cumulative view can help smooth out some daily noise and make it easier to interpret the chart.
These charts are also helpful when learning from your end-to-end experiment.
Note
Group By
There are more resources on group by in experiment here and here.
July 9th, 2024
Need help? Contact Support
Visit Amplitude.com
Have a look at the Amplitude Blog
Learn more at Amplitude Academy
© 2026 Amplitude, Inc. All rights reserved. Amplitude is a registered trademark of Amplitude, Inc.