Group-bys: How Amplitude prunes and orders chart results
This article helps you:
Understand when and why Amplitude Analytics truncates group-by query results
Understand how Amplitude Analytics prioritizes group-by results
AMPLITUDE ACADEMY
Getting Started with Amplitude Analytics
Learn the most fundamental features of Amplitude Analytics, including cohorts.
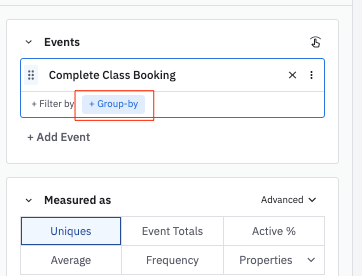
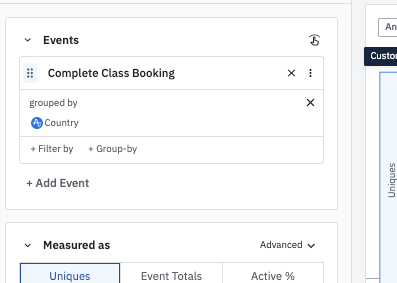
Learn Amplitude AnalyticsIn its basic form, Amplitude's group-by feature is a tool for categorizing events for aggregation.

For example, when you want to count the number of events by country, use a group-by:

Group-by result limits
For performance purposes, Amplitude sets a maximum limit on the number of groups a query result can return. When a query exceeds, Amplitude keeps the top groups and prunes the remainder from the query result.
Amplitude may impose the following limits:
- Single group-by: 100 results
- Double group-by: 500 results
For more information, review Limits.
Group ordering
This table shows how Amplitude prioritizes group-bys for display in the Breakdown Table
| Metric | Order |
|---|---|
| Uniques | Number of unique users |
| Totals | Total number of events |
| % Active | Number of unique users |
| Average | Total number of events |
| Frequency | Number of unique users |
| Distribution of Property Value | Total number of events |
| Sum of Property Value | Sum of property values |
| Average of Property Value | Sum of property values |
| Distinct Property Values Per User | Total number of (user, property value) pairs |
| Formulas: Percentile | Total number of events |
| Formulas: Frequency Percentile | Total number of events |
| Formulas: Property Count | Number of unique properties |
| Formulas: Property Count Average | Total number of (user, property) pairs |
| Formulas: Default | Number of unique users |
Formulas with group ordering
For formulas without a group-by, this ordering is only used if every metric in the formula uses the same ordering. Otherwise, Amplitude uses the default formulas ordering.
For formulas with a group-by, Amplitude ranks the groups by the largest overall values per group summed across all formulas in a single expression.
Note
Group-by in Experiment
Experiment group-bys
In Experiment end to end and experiment results, Amplitude limits the number of group-by groups returned to 10 per metric. Amplitude sorts the rows by the sum of exposures across all variants. Some rows may show (none) which means the property is missing. For more information, review FAQ: Unexpected values in user counts. The group-by applies to the exposure event.
In multiple hypothesis testing Amplitude doesn't correct for using a group-by because it doesn't know how many hypothesis tests you plan to do in the analysis. You could look at one group-by value or you could look at 10 group-by values.
Group-bys provide a more exploratory analysis, and if you adjust for multiple hypothesis testings it will increase the difficulty in reaching statistical significance. If you think you have a false positive, try to split your experiment into to date ranges. Conduct all the hypothesis testing you want on one dataset, then try to reproduce those results on the second date range. Think of this like doing a train-test split. This is when you are training a machine learning model where you tune the hyperparameter on the training set and evaluate the model on the unseen test set to get an unbiased error estimate.
Limitations
We do not support group by and CUPED together. If you select these options, the non-group by value will have CUPED applied but the group by values will not have CUPED applied.
If the value of the property you group-by changes between the exposure event and the metric event, you may notice a conversion rate higher than 100%. For example, if you group-by Country and view the row Country = Spain, the denominator is unique number of exposures in Spain and the numerator is people who did the metric event in Spain.
As a result, you may notice conversion rates greater than 100% since someone can do a metric event in Spain but never do the exposure event in Spain. They would count toward the numerator but not the denominator.
The opposite is also true where the numerator gets undercounted instead of overcounted. If you group-by Platform and look at the Platform = Web row and the exposure event has Platform = Web and the metric event has Platform != Web, those metric events aren't counted in the numerator.
October 16th, 2025
Need help? Contact Support
Visit Amplitude.com
Have a look at the Amplitude Blog
Learn more at Amplitude Academy
© 2026 Amplitude, Inc. All rights reserved. Amplitude is a registered trademark of Amplitude, Inc.