Insights: Spot anomalies in your metrics quickly with alerts
This article helps you:
Set up and manage alerts to monitor the performance of your important project metrics
Send alerts directly to a Slack channel
Amplitude's alerts feature uses Prophet, an advanced data mining and machine learning technique that automatically detects any anomalies in your product data, and instantly brings these hidden trends to your attention. It does this by first identifying expected values, and the confidence intervals around them, and then analyzing the trend of the data and combining it with the weekly trend of the data.
Before you begin
There are a few details about alerts you should be aware of:
- You can set alerts for multiple events and user segments at the same time.
- If you use a group-by on a property, your alert tracks metrics against the top 1,000 segments only.
- Custom alerts are available in Event Segmentation and Funnel Analysis charts, and only on those set to a daily or hourly frequency.
- A Funnel Analysis must measure conversion over time with percentage to support alerts.
- In an Event Segmentation chart, if you need to track weekly or monthly KPIs, use a 7-day or 30-day rolling window. Amplitude doesn't support alerts for the Frequency and Formula tabs, or for the bar chart visualization. Some custom formulas are supported, as long as they produce a chart with an X-axis time series.
- Only chart owners can set alerts. If someone else created a chart you want to receive alerts for make a copy and save it before setting up an alert. Additionally, any changes you make to a chart apply to the alert tracking it.
Set an alert
There are three types of alerts in Amplitude: automatic, custom, and smart.
Amplitude creates an automatic alert for every event you instrument. This helps you track all events for anomalies and unexpected trends. This happens automatically, there is nothing for you to do in setting up an automatic alert.
Amplitude monitors an event for anomalies when it reaches a volume of 100 or more events per day in at least 15 of the last 30 days. Amplitude considers an anomaly to have occurred when an event's value falls outside of the 99% confidence interval of historical data. Amplitude uses 120 training days for automatic monitors.
Automatic event monitoring applies only to individual events. The Amplitude-defined Any Event doesn't qualify for anomaly monitoring.
To subscribe to automatic alerts and receive emails when Amplitude detects an anomaly, navigate to Settings > Projects, find the project you want to monitor, and open the Automatic Monitors tab. Switch the Not Subscribed toggle to Subscribed.
To set a custom or smart alert for a chart you own, follow these steps:
-
Navigate to the chart you want to set an alert for. Save the chart before you set an alert for it.
-
Select Set Alert from the bell icon and select either a smart alert or a custom alert:
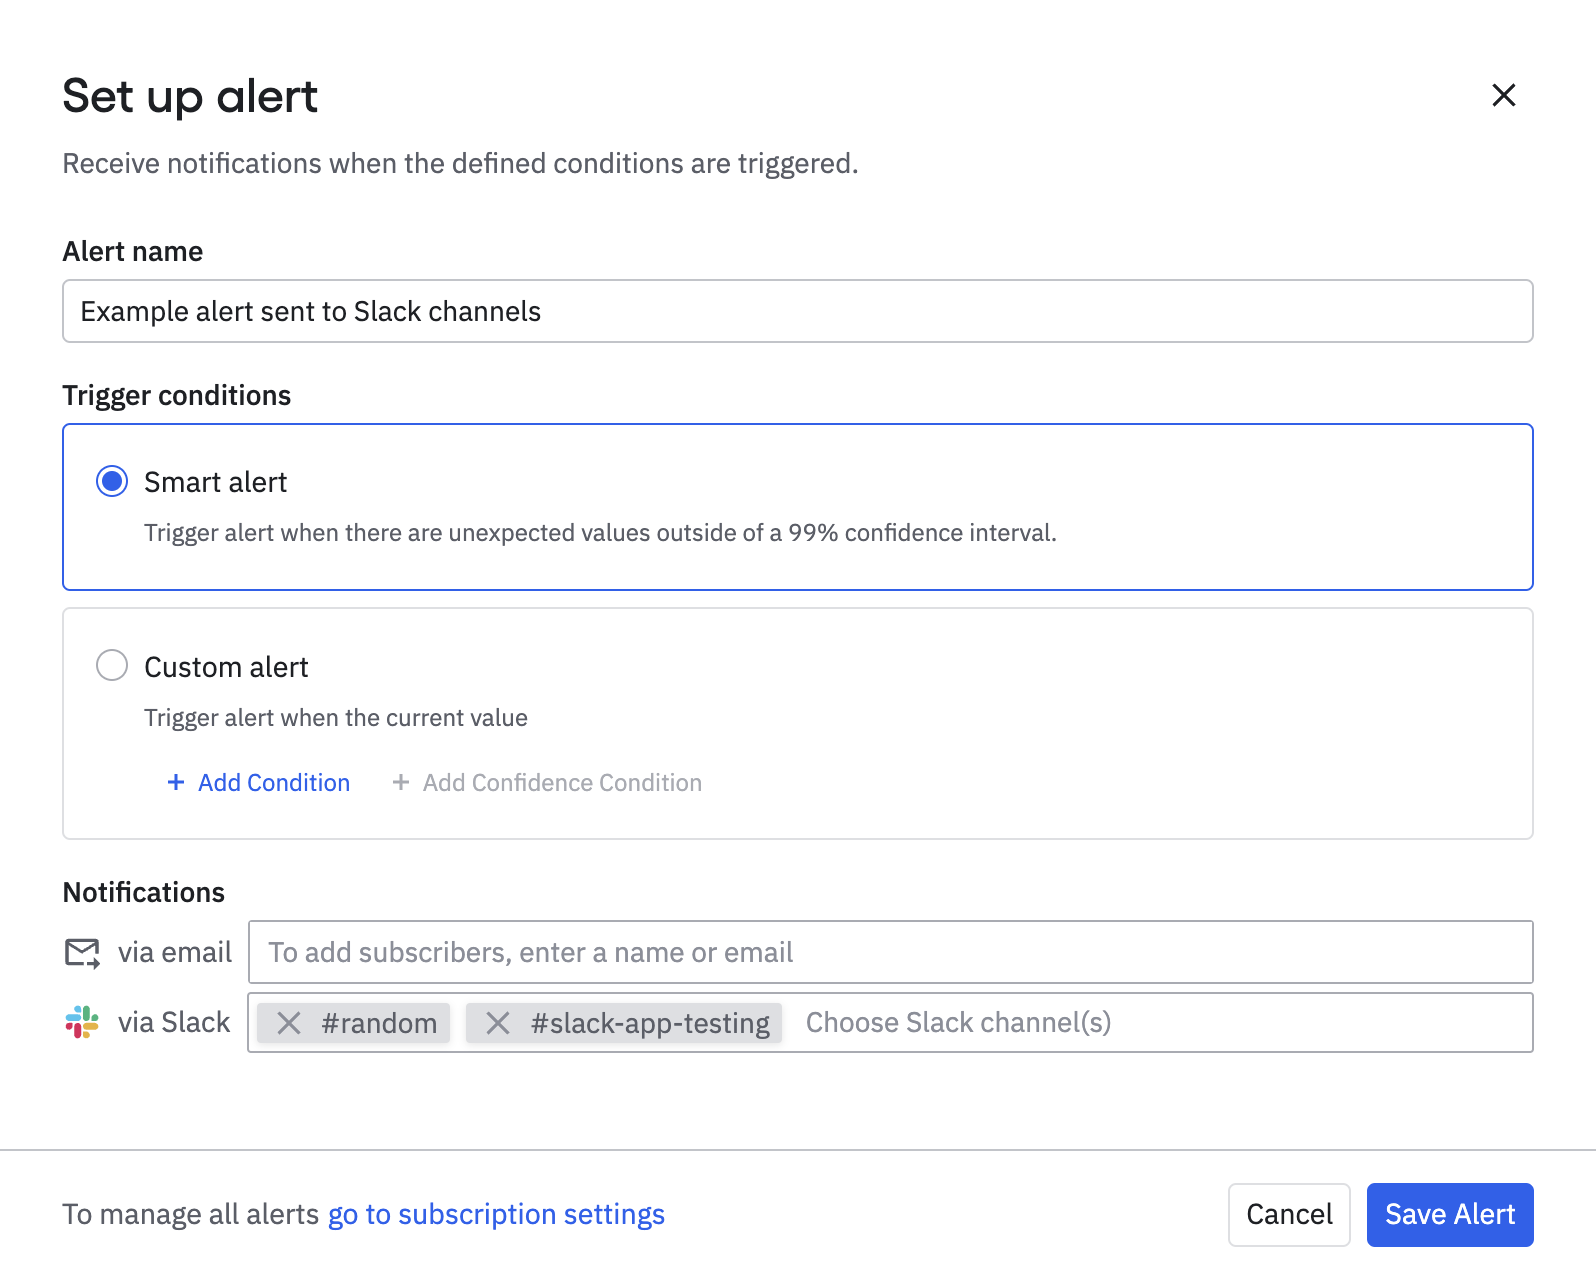
- A smart alert looks for unexpected changes outside of a 99% confidence interval.
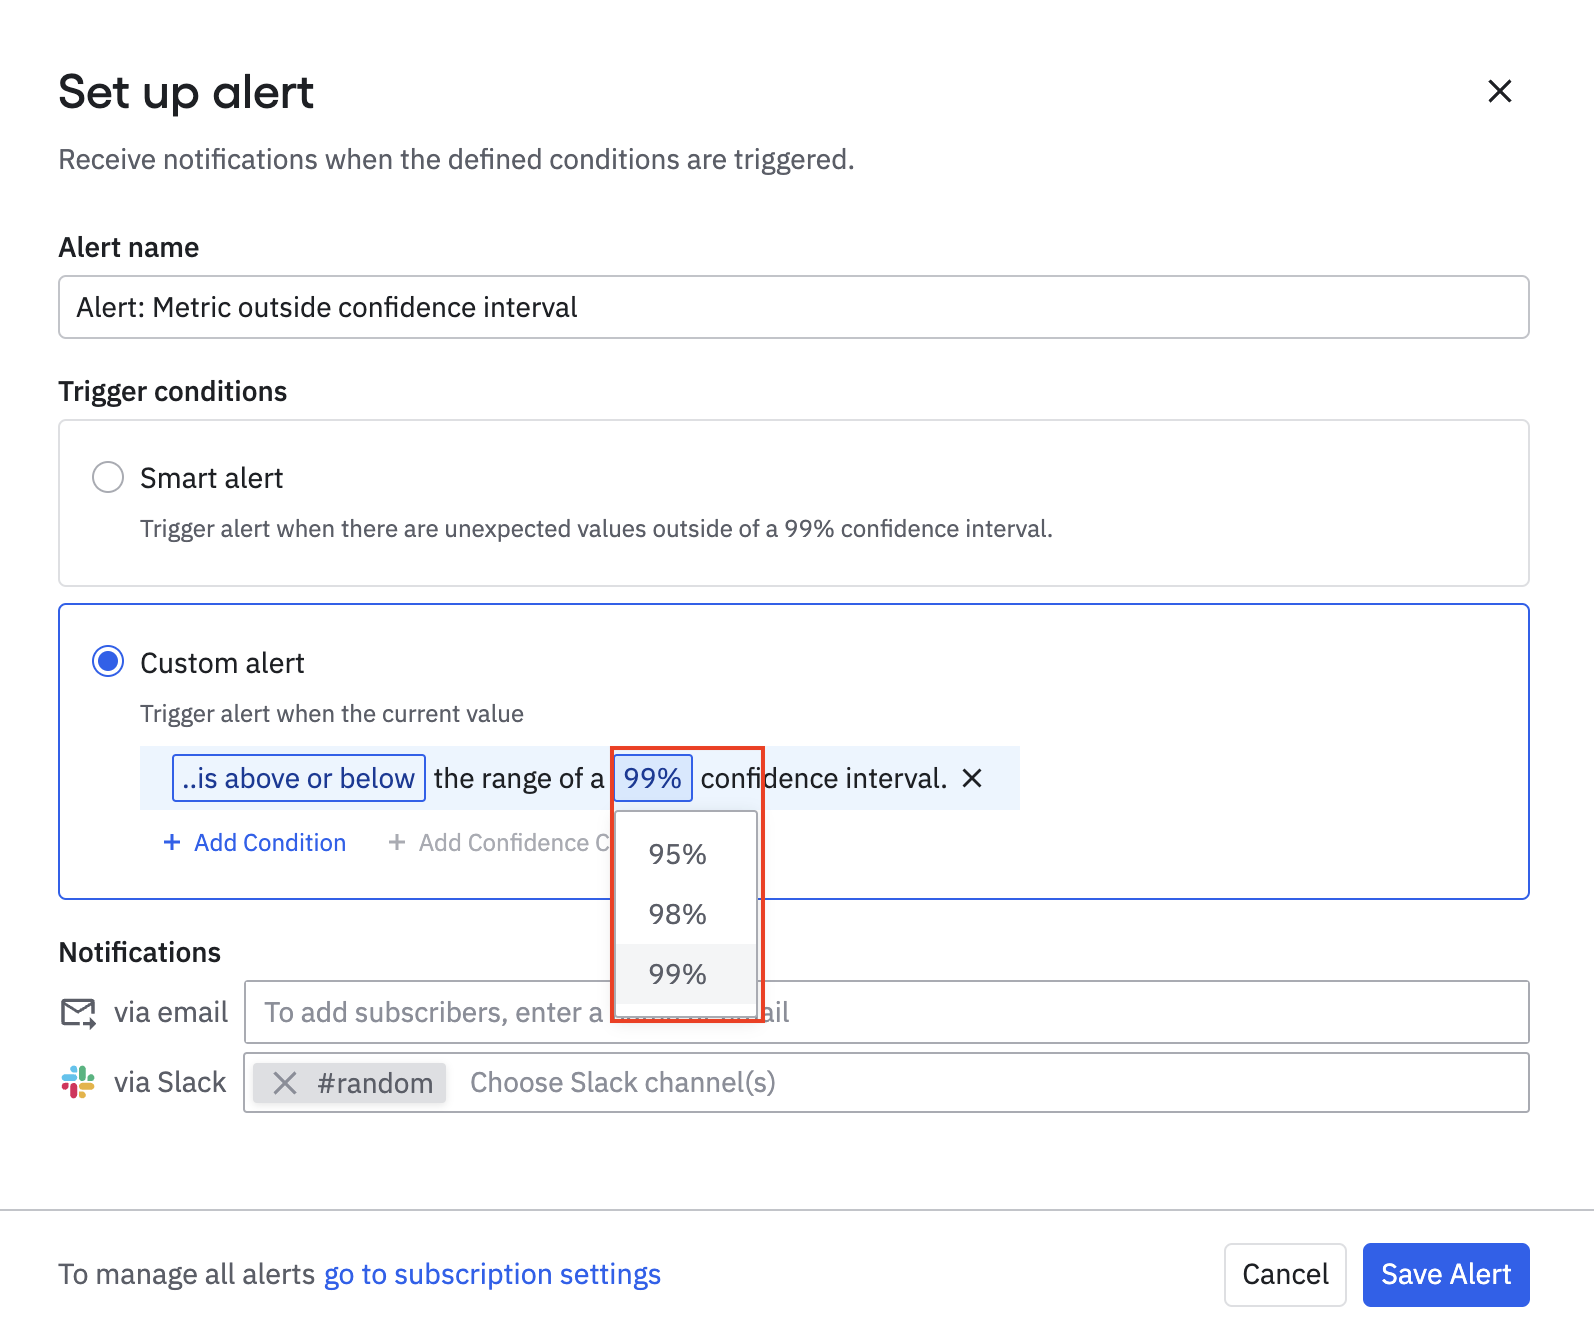
- A custom alert allows you to be more specific about the conditions under which you receive a custom alert: whether it's above or below a specific value, or whether it differs from a previous value by a specified amount. You can also set a custom alert based on confidence interval.
-
If you set up a custom alert, specify your alert conditions (these relate to the chart's current value either exceeding or falling below a specific value, or to changes in the confidence interval). If you are setting up a smart alert, skip this step.
-
Add the emails of everyone who should receive this alert, and click Set Alert.
For custom or smart alert, the training days are 120 for daily interval charts and 14 for hourly interval charts.
Confidence intervals and statistical significance in custom alerts
When you set up a custom alert, choose to receive alerts when the value breaches significance thresholds of 95%, 98%, or 99%. Amplitude determines these confidence intervals by taking your historical data and identifying where 95%, 98%, and 99% of all data points fall.

The higher the required significance, the less "noisy" your alerts are. In charts, the blue band represents the range of the confidence interval. A 95% confidence interval has a narrower band than a 99% confidence interval, because the 99% confidence interval captures more historical data points.
View and manage alerts
To see a list of a project's recently triggered alerts, click Notifications in the top right corner of the screen, and navigate to the Alerts tab. Use the project switcher on the left to change to a new project.
To see a list of all existing alerts for a project, click Manage Custom Alerts. Open Custom Monitors to update custom alerts, or Automatic Monitors for smart alerts. Click an individual alert to update it.
Alert emails
When an alert triggers, Amplitude sends an email to everyone subscribed to receive them by 8:00 AM in the project's timezone for daily metrics. For hourly metrics, the alert notification sends in the hour period after Amplitude detects the anomaly. For example, if your metric dips significantly at 1:15 PM, Amplitude’s alerting service identifies that anomaly at 2:00 PM, and sends you a notification by 3:00 PM at the latest.
Click a chart in the email to go directly to that chart in Amplitude. A side-panel that reiterates the issue Amplitude alerted you about.
The charts sent in alert emails may have a server_upload_time filter to show the value of the data point at the exact time the alert triggered. Depending on the data point, the value in the alert email may be different than the data point's end of day or final value.
Slack notifications
You can also set up an alert to post to one or more Slack channels.
When you configure or modify an alert, you can select Slack channels in the Notification section at the bottom of the modal.

If you haven't set up the Slack integration, connect your Amplitude account by clicking the Connect to Slack button:

September 11th, 2024
Need help? Contact Support
Visit Amplitude.com
Have a look at the Amplitude Blog
Learn more at Amplitude Academy
© 2026 Amplitude, Inc. All rights reserved. Amplitude is a registered trademark of Amplitude, Inc.