Microscope: Explore individual data points in your charts
Microscope inspects the users behind a single data point in a chart. Hover over a data point to open a menu where you can view the user list, view user streams and paths, watch session replays, create a cohort, and drill into the point. The available options depend on your Amplitude plan. Use Microscope when you want to identify which users produced a specific value in a chart instead of only the aggregate number.
Availability and limitations
- Microscope streams only highlight events selected in the chart's Events Module that occur during the date range selected.
- View Groups and Download Groups are only available to customers who have the Accounts add-on.
- Custom formula charts don't support Microscope. If you use custom formulas in Event Segmentation or Data Table charts, Microscope functionality isn't available for those data points.
Distributions
For distributions, Amplitude provides the Probability density function (PDF) and Cumulative distribution function (CDF). Use PDF and CDF when comparing distributions with different sample sizes. Amplitude normalizes them, making the comparison fair.When comparing by counts, taller bars in one distribution may reflect a larger sample size rather than a more likely value, which can mislead your analysis. Use a normalized histogram to avoid this.
The CDF also approximates other percentiles. For example, in the time to convert chart, Amplitude shows a vertical dashed line for the median. To find the approximate 75th percentile, find the smallest bin with a CDF >= 75%. Use smaller bin widths for a better approximation.
Use Microscope
To open the Microscope menu, click a data point in any supported chart.
From here, depending on the chart type, you can:
- Zoom In on a data point by going down to the next time interval granularity, for example when you click a data point in a weekly chart and zoom in, the chart updates to daily granularity, and the time period in the date picker update to be the same as the time period of the original data point.
- Filter By to quickly drill down and focus on the series.
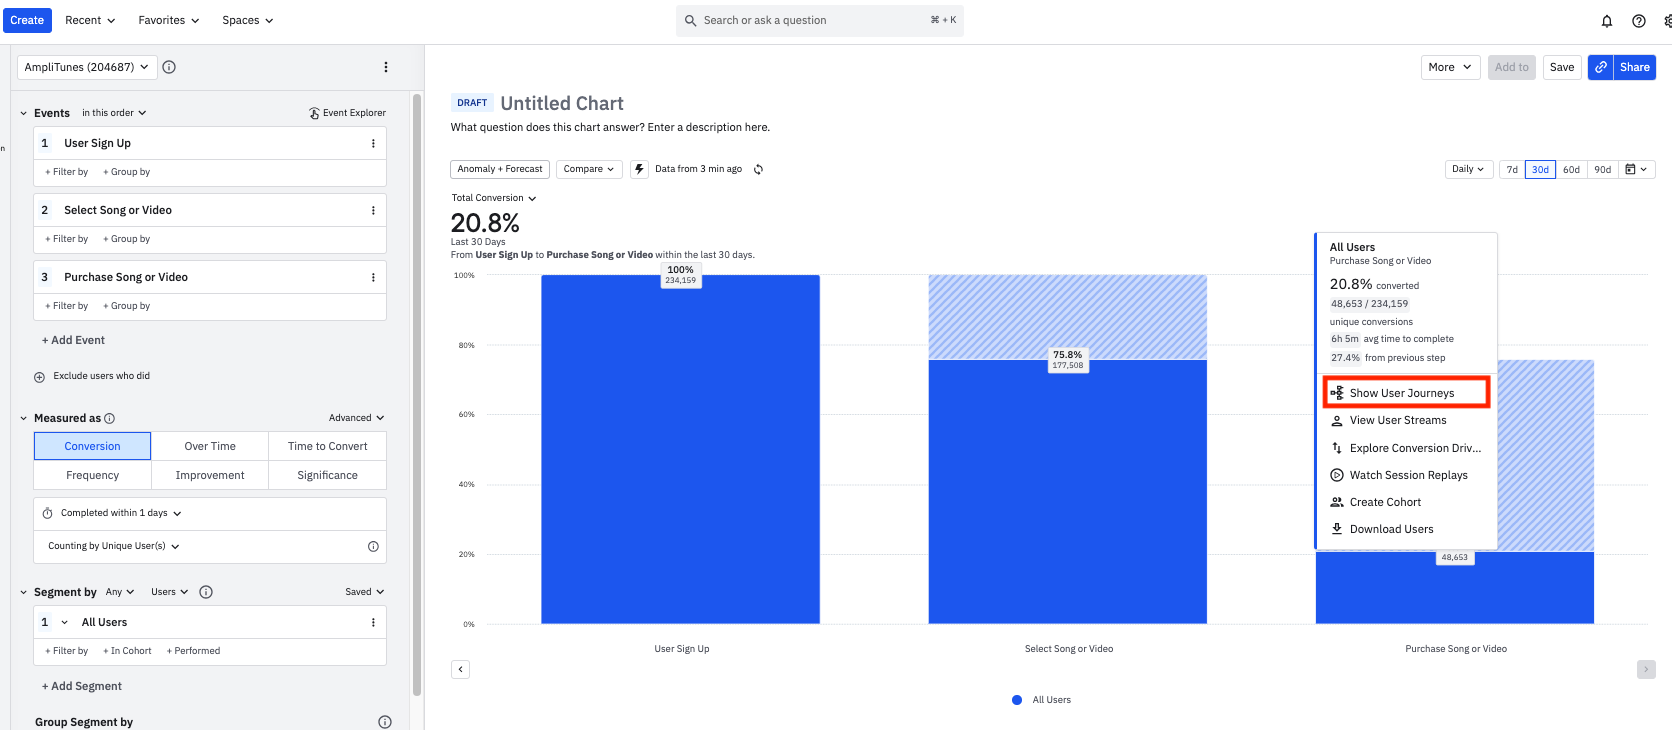
- Show User Journeys to create a Journeys chart based on the users in that data point.
- View User Streams to view individual streams from users in that data point.
- Watch Session Replays of those user sessions.
- Exclude or remove distracting or irrelevant series from the analysis.
- Create a cohort of the users that make up the selected data point, which you can then further analyze by applying this cohort to other charts in Amplitude. When you apply a group in the Segmentation Module, you can also create a group cohort from here.
- View a list of all the users in the selected data point. Click a user ID to open that user's profile in the User Activity tab. If you are a customer with account-level reporting, you can also use Microscope to view the groups in a data point. Click any group to view a list of users in that group, in the User Activity tab.
- Download all the users (up to 1 million) that make up the selected data point, in the form of a .CSV file. This file also contains each user's most-recently sent user property values.
- Add users to... a Feature Flag, Feature Experiment, Web Experiment, Guide, or Survey.
group_id: The unique ID of a particular group name (much like Amplitude ID). When Amplitude sees a new group value or group name, Amplitude assigns a uniquegroup_idto the unique group name.group_name: The group property value (like the user ID). For example, if your count-by was for the groupCompany, then thegroup_namecould beAmplitude. You set thegroup_namevalues.first_time: The Unix timestamp denoting when Amplitude first saw that group.creator_amplitude_id: Theamplitude_idthat sent the event creating the group.
Additionally, you can show user paths, view user streams, and explore conversion drivers. Read more about them below.
Show user paths
This option runs a Pathfinder Users report based on user activity for the selected data point. This is useful for when you want to quickly see the top event paths users take after a specific event or on a particular day.For example, you can view users who dropped off after a specific event or step in a Funnel Analysis chart and see what were the top paths the dropped off users performed, instead of successfully completing the funnel.The maximum date range for Show User Paths is 30 days.
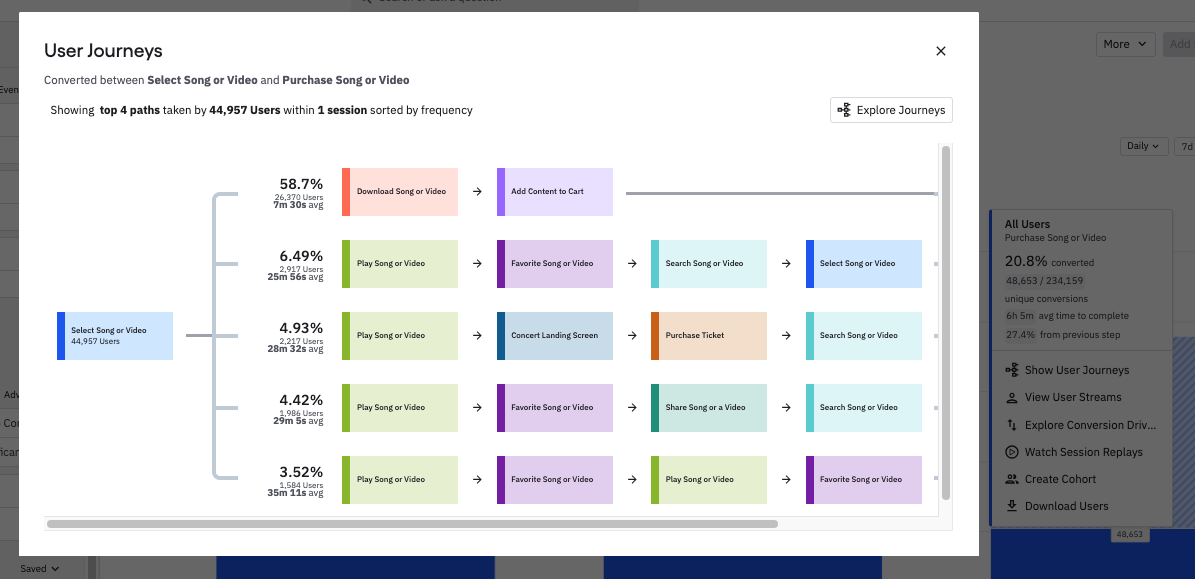
To analyze what users are doing instead of triggering the Purchase Song or Video event in the funnel chart below, click the drop-off data point for the Purchase Song or Video event and use Microscope's Show User Journeys feature to view the top event paths users take after the Select Song or Video event:
By showing user paths, it becomes clear that after triggering the Select Song or Video event, many users trigger either the Download Song or Video event or the Play Song or Video event. Now you can hypothesize ways to improve the product's purchase flow, like sending users an in-app message to purchase a subscription at exactly the right moment.
Pathfinder and Journey maps don't support Microscope actions such as View user streams and Create cohort for drop-off user paths.
View user streams
When using Microscope in an Event Segmentation chart, you can view individual user streams in aggregate by selecting View User Streams. All a user's events within the date range of the data point are visible here, as well as:- Up to 25 events before the beginning of the time range.
- Up to 50 events after the start of the time range.
If you select a specific event, Microscope highlights it in the user's stream. You can also choose to show certain event properties as well. Click a user ID or any event in a user's stream to view their profile in the User Activity tab.
Event names with a sparkle icon indicate that Amplitude has generated a name to provide more context around the action a user is taking. These are Autocapture events ingested as Page Viewed, Element Clicked, and Element Changed, but Amplitude uses property information to make them more valuable in the event stream. Click any of them to understand their ingested name and properties.
View Session Replay from a user's event stream
If you are a Growth or an Enterprise customer with the Session Replay add-on, you can launch a session replay from Microscope in the following Amplitude charts: Event Segmentation, Funnel Analysis, Journeys, Experiment, and User Sessions.
While using Microscope in a supported chart, click on View User Streams. Check the Streams with session replays box in the modal that appears. Then click Play Session in the event stream to play the events directly below it. Check out more about the Session Replay feature, and learn about restrictions in the supported charts, in this help center article. Alternatively, you can click Watch Session Replay.
Explore conversion drivers
In a funnel chart, click into any step after the initial event to enable the Explore Conversion Drivers feature. This allows you to explore events triggered between funnel steps for converted and dropped-off users.
For more information, go to Amplitude's conversion drivers feature.Create a guide or survey from Microscope
On a chart, click a data point to launch Microscope. Select Guide these users or Survey these users to create a guide or survey targeted to that set of users. Amplitude then:
- Creates a cohort based on the chart criteria and data.
- Creates and launches a new guide or survey, with the cohort added to targeting.
Was this helpful?