Build charts in Amplitude: Add user segments
This article helps you:
Add user segments to your charts
Understand how user properties shape your analyses
Use conditions to fine-tune your analyses
AMPLITUDE ACADEMY
Getting Started with Amplitude Analytics
Learn the most fundamental features of Amplitude Analytics, including cohorts.
Learn Amplitude Analytics
Note
Events, as important as they are, are only half of the equation. You’ll also need to specify the users whose behavior you’re interested in analyzing.
Amplitude’s Segmentation Module lets you create groups of users to analyze. These groups are called segments, and they can be as broad as your entire user base, or very narrowly tailored to match a highly-specific set of user properties.
Note
Also, be sure to see our Help Center article on the advanced features available through the Segmentation Module.
Create a user segment
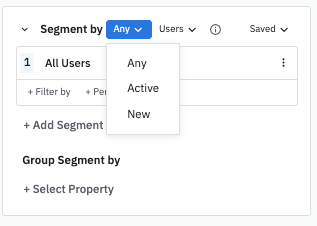
The first step is deciding which category of users your segment will draw from—any users, active users, or new users.
Note

If you select Any Users, your analysis will include all users who have triggered the events you’re interested in. This is the broadest possible choice.
You can narrow the focus a bit by selecting Active Users. Amplitude defines an active user as one who has logged at least one event during a specified time range. When you choose this option, Amplitude will look at events triggered by any user who was active during the days, weeks, or months covered by your analysis.
Even more specific is the New User option. A new user is defined as a user who logs an event in Amplitude for the first time. When you opt for this selection, Amplitude will look at events triggered by these users during the interval—days, weeks, or months—in which the user was new.
For example: If a user was new on July 17, and you set your analysis interval to Daily, only the events that were triggered on that same day—July 17—will appear on the chart, regardless of whether that user also triggered events the next day.
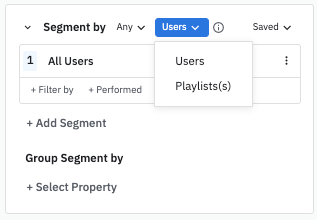
You can use Accounts to select any of the custom groups you have instrumented in place of Users.

Once you've decided how to measure your users, use Filter by and Performed clauses to define your user segments.
You have now created your first user segment.
Filters
Add more segments
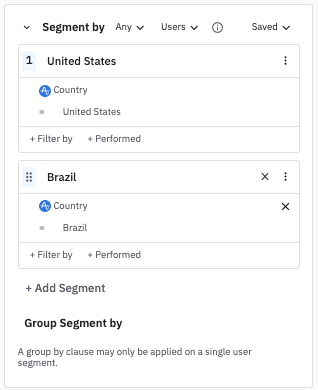
Amplitude doesn’t limit your analysis to a single segment. To add additional segments, click + Add Segment. Here, there are two segments to compare: one that includes users in the United States, and one that includes users in Brazil.

Group by user property
The Segmentation Module also includes a Group Segment by function.
If you have only one event in your analysis, it doesn’t matter if you use group by in the Events Module or Group Segment by in the Segmentation Module. But if your analysis includes more than one event, adding a Group Segment by condition in the Segmentation Module will apply that condition to all the events in your analysis. If you don’t want that, then apply a group-by condition in the Events Module, on an event-by-event basis.
Note
Your chart will display the top five segments by the measurement selected. You can add or remove segments to the chart via the data table below it. In the example below, the analysis groups by device family. The graph shows the number of daily active users in the last 30 days, grouped by the device family they used.
Note
Save a user segment
Once you’ve created a user segment, you can save it for re-use in another analysis. Saved user segments are globally available for other team members to use.
To save a user segments, click Saved. Next, click Save Segment and follow the prompts in the window that follows.
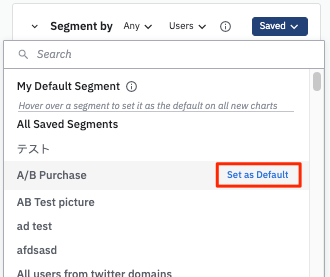
You can also search for previously-saved segments through the Saved dropdown. Select the one you need from the list to load it.
To make a segment your default segment—in other words, the one Amplitude automatically loads when you create a new chart—click Set as default next to the segment's name.

October 16th, 2025
Need help? Contact Support
Visit Amplitude.com
Have a look at the Amplitude Blog
Learn more at Amplitude Academy
© 2026 Amplitude, Inc. All rights reserved. Amplitude is a registered trademark of Amplitude, Inc.