Historical Count, part 1: Track user behavior for different instances of each user action
This article helps you:
Pinpoint the Nth instance of a user action
Identify customer based on the number of times they've performed a critical action
Have you ever noticed that conversion and retention rates can sometimes be very different for a user who has, for example, made one in-app purchase versus those who have made two or three?
With Historical Count, you can easily capture each Nth instance of any user action (up to the fifth). This will help you quickly pinpoint and resolve areas of friction for first-time users, so that you can boost your overall North Star metric.
You can also use it to identify your best customers based on the number of times they’ve taken a critical action in your product, like completing a purchase in an e-commerce platform or playing a song in a music streaming app.
For example, if your product is a music streaming platform, Historical Count could highlight the usage differences between users who have performed the Play Song event for the first time and those who've triggered it multiple times.
Note
Before you begin
Before you get started using the Historical Count feature, there are some things you should know. If you're new to Amplitude, you'll need to complete the instrumentation process for your events to appear in any Amplitude charts. We recommend you start exploring the Event Segmentation chart first.
Other important things to note about this feature:
- The following operators are supported:
=(is),≠(is not),<(less),≤(less or equal),>(greater),≥(greater or equal). - Only one Historical Count property can be selected at a time.
- Historical Count is an event property available on the Event Segmentation, Funnel Analysis, Pathfinder, and Retention Analysis charts.
- In a funnel analysis, Historical Count works only on funnels set to in this order.
- You can apply an Historical Count filter only to the first event in the Pathfinder and Retention Analysis charts.
- However, you can apply it to multiple events when doing event segmentation and funnel analyses.
- Historical Count is also available in behavioral cohorts, with limitations:
- You can't use "Any Event" or "Any Active Event" with Historical Count in dynamic cohorts.
- If you create a cohort using "Any Event where Historical Count = 1", it becomes a static cohort.
This article is part 1 of a series on Historical Count. Be sure to read the next Help Center articles in the series:
- Historical Count, part 2: Order of operations
- Historical Count, part 3: Funnel analyses and behavioral cohorts
How Amplitude defines Historical Count
Generally speaking, Historical Count can tell you if it's a user's first time triggering a specified event, or their fifth. But there are some constraints to be aware of here.
Amplitude's definition of Nth time is itself time-limited, to include a period of up to one year before the beginning of the date range of your analysis.
For example, let's say a user performed the Play Song event for the first time on February 20th, 2019, and then did so again a month later, on March 20th, 2019. In order to include the user's true first performance of the Play Song event, your chart's date range must begin no later than February 19th, 2020. If your chart covers the period of, say, March 1st, 2020 to March 31st, 2020, Amplitude will then treat the event performed on March 20th, 2019 as the user's first interaction with the Play Song event.
Apply a Historical Count filter
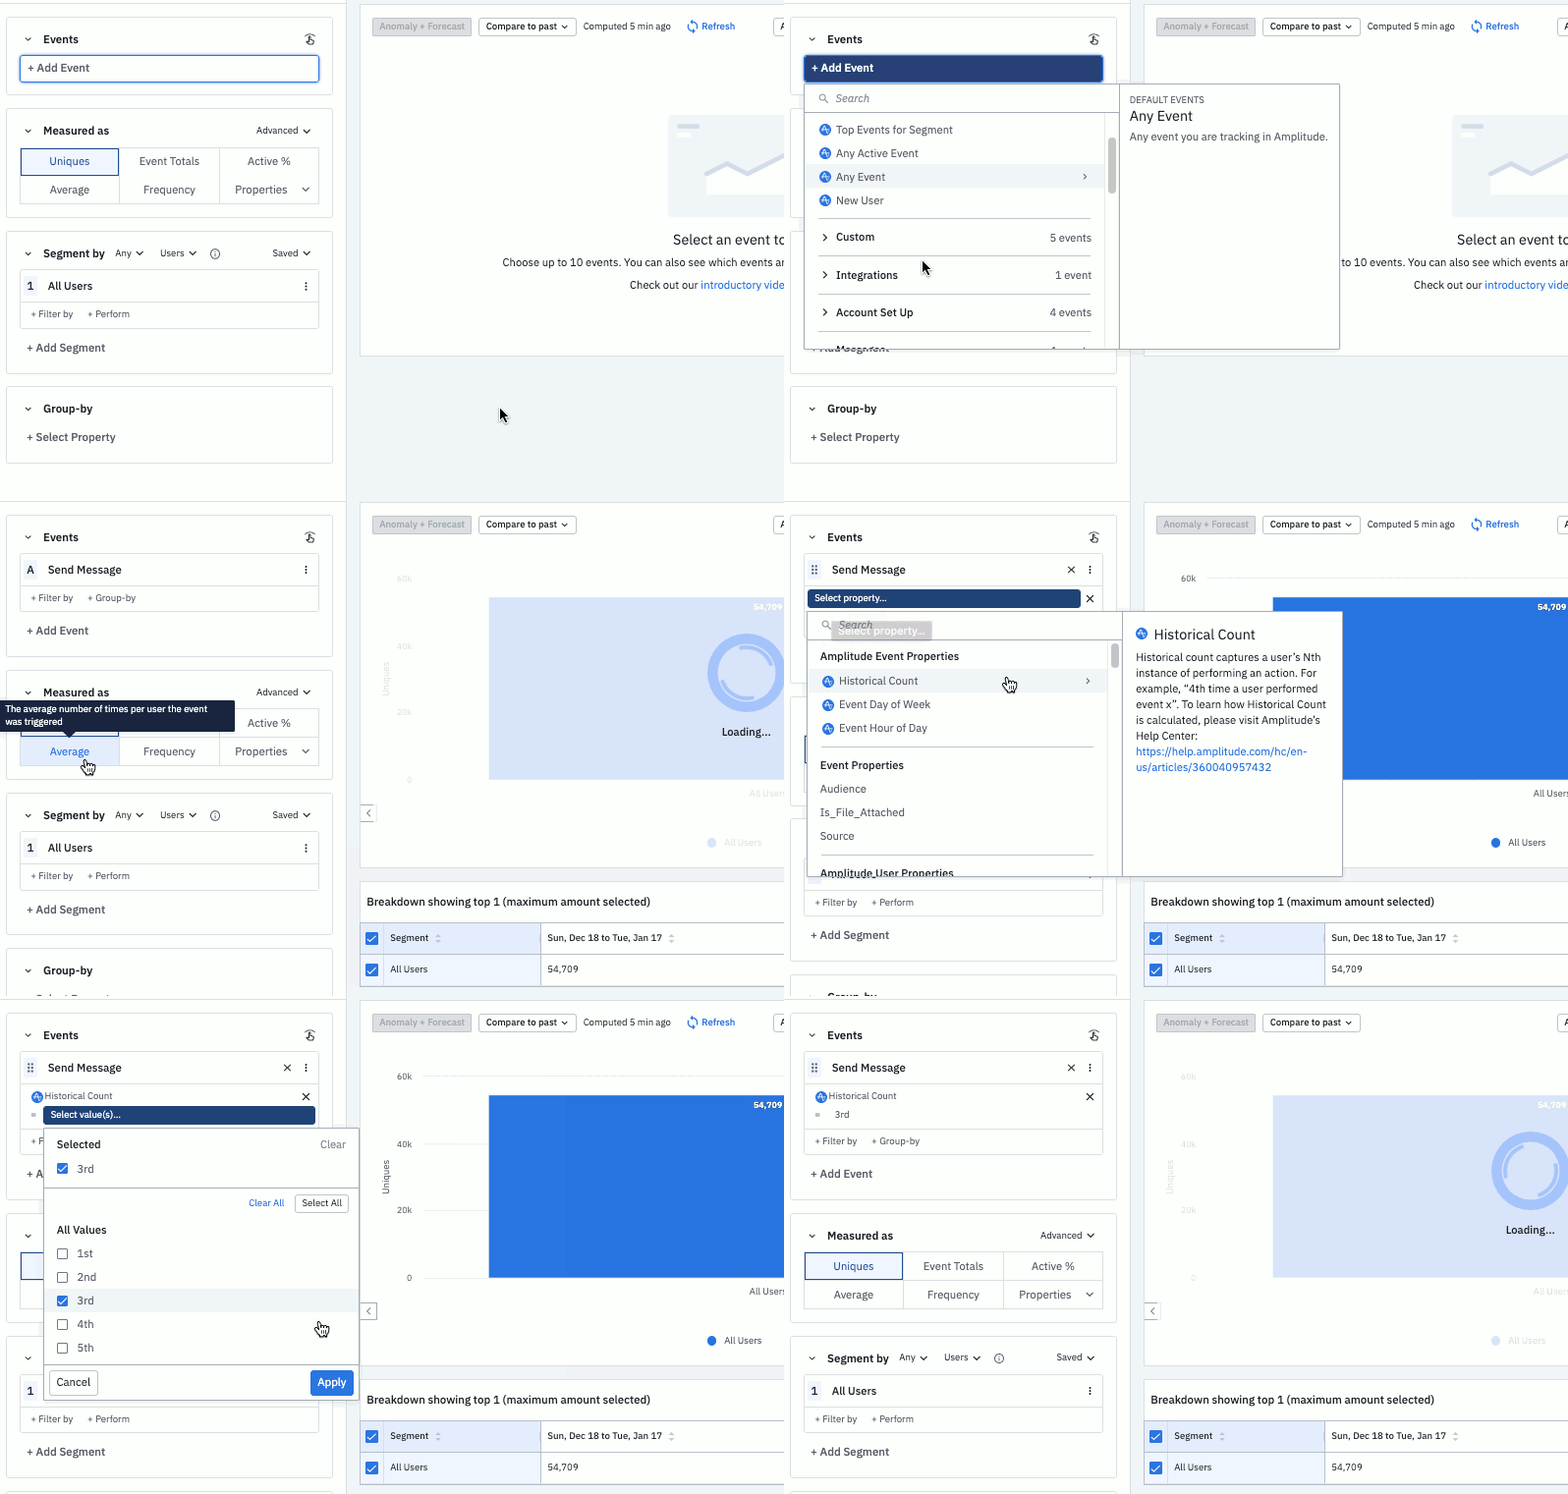
To apply a Historical Count filter, follow these steps:
- In your Events Module, choose the event you're interested in. Then click + Filter by.
- Scroll down to Amplitude Event Properties and select Historical Count.
- Choose the correct operator and specify the N-value (first through fifth) that you're interested in.

In the example above, the chart will include users who performed the Send Message event, with a Historical Count of three.
Continue to the second article in the Historical Count series: Historical Count, part 2: Order of operations.
June 6th, 2024
Need help? Contact Support
Visit Amplitude.com
Have a look at the Amplitude Blog
Learn more at Amplitude Academy
© 2026 Amplitude, Inc. All rights reserved. Amplitude is a registered trademark of Amplitude, Inc.