Track changes in your cohort populations over time
Amplitude's cohort population over time chart shows how the size of your behavioral cohorts changes. As you release new features and launch new campaigns, understanding how your customers respond is a critical part of iteration. Cohort population over time displays these trends.
Cohort population over time is part of Amplitude's Behavioral Cohorts feature.To view changes in a cohort population over time, navigate to the Cohort Details page and scroll below the cohort definition:
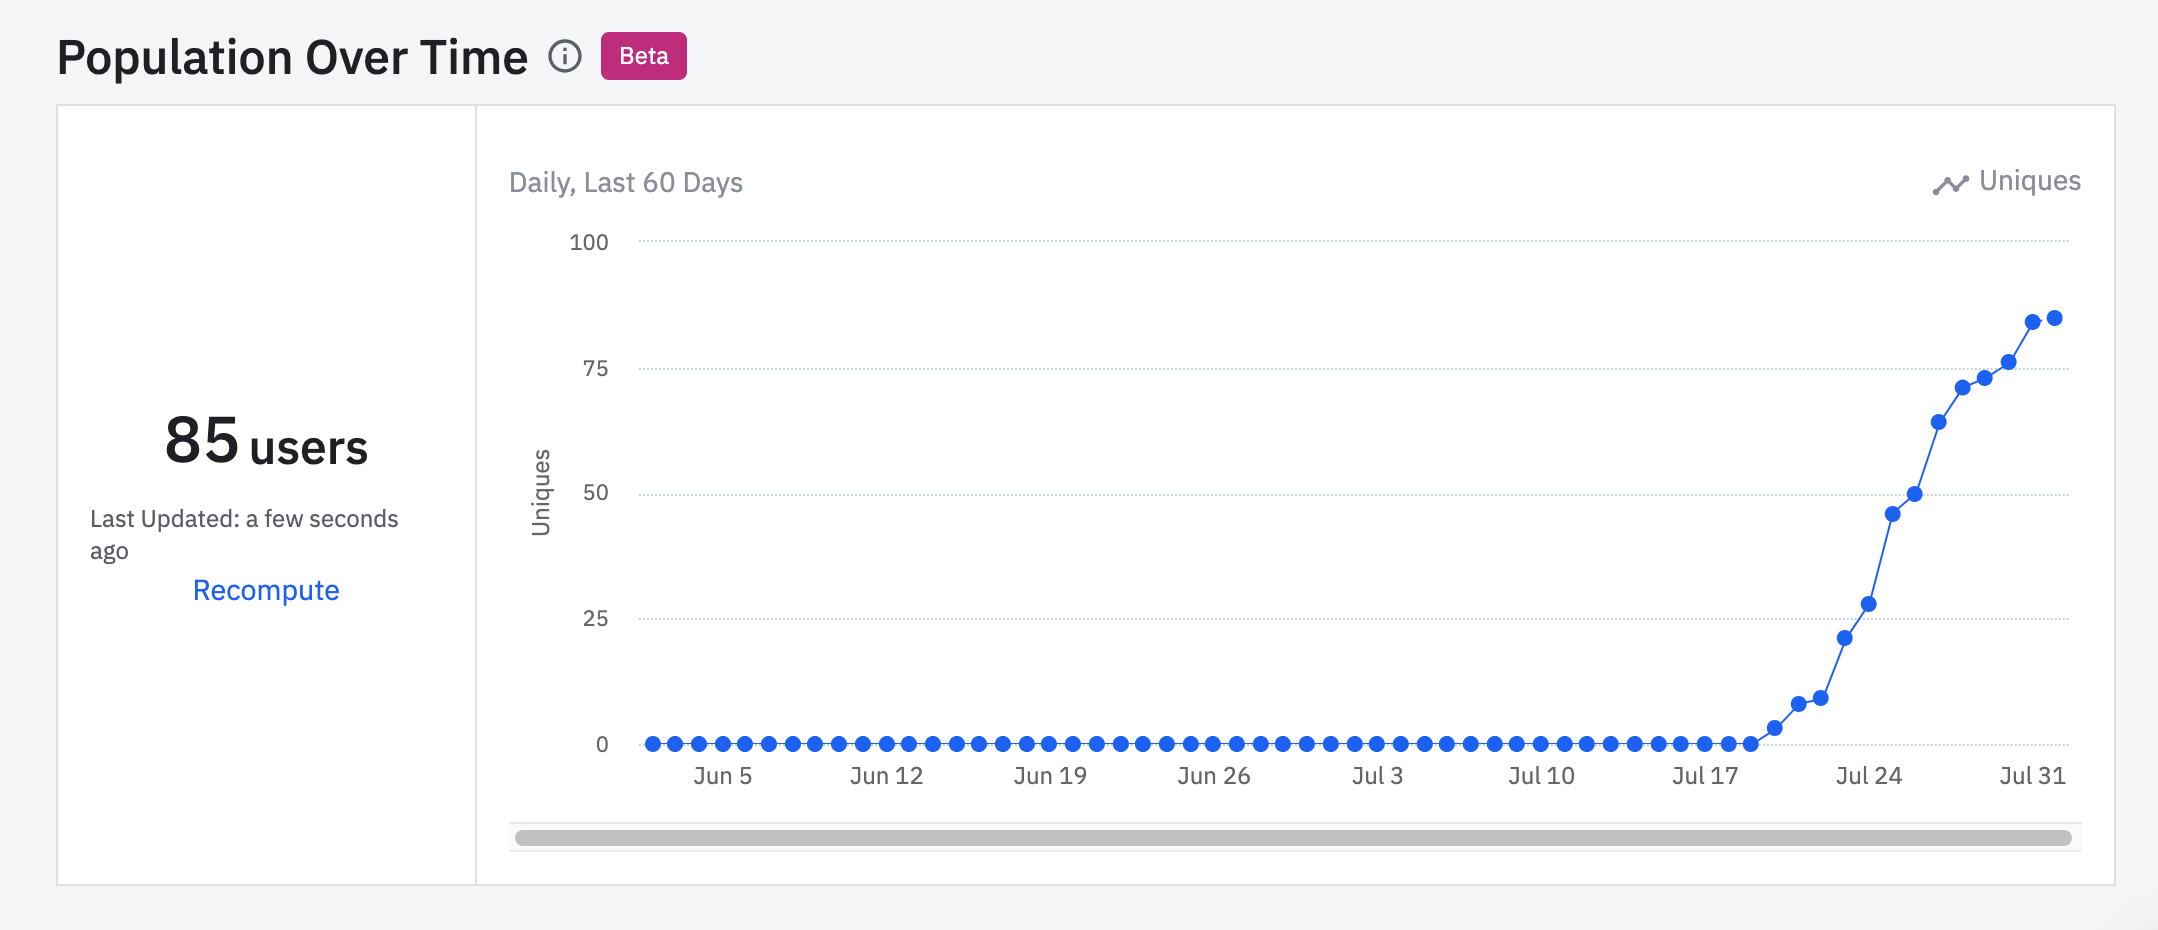
Cohort population over time shows the number of users who meet a cohort definition on each day over a predefined time.
Let’s say you want to define a behavioral cohort of power users as those who have triggered at least 50 active events in the past 30 days: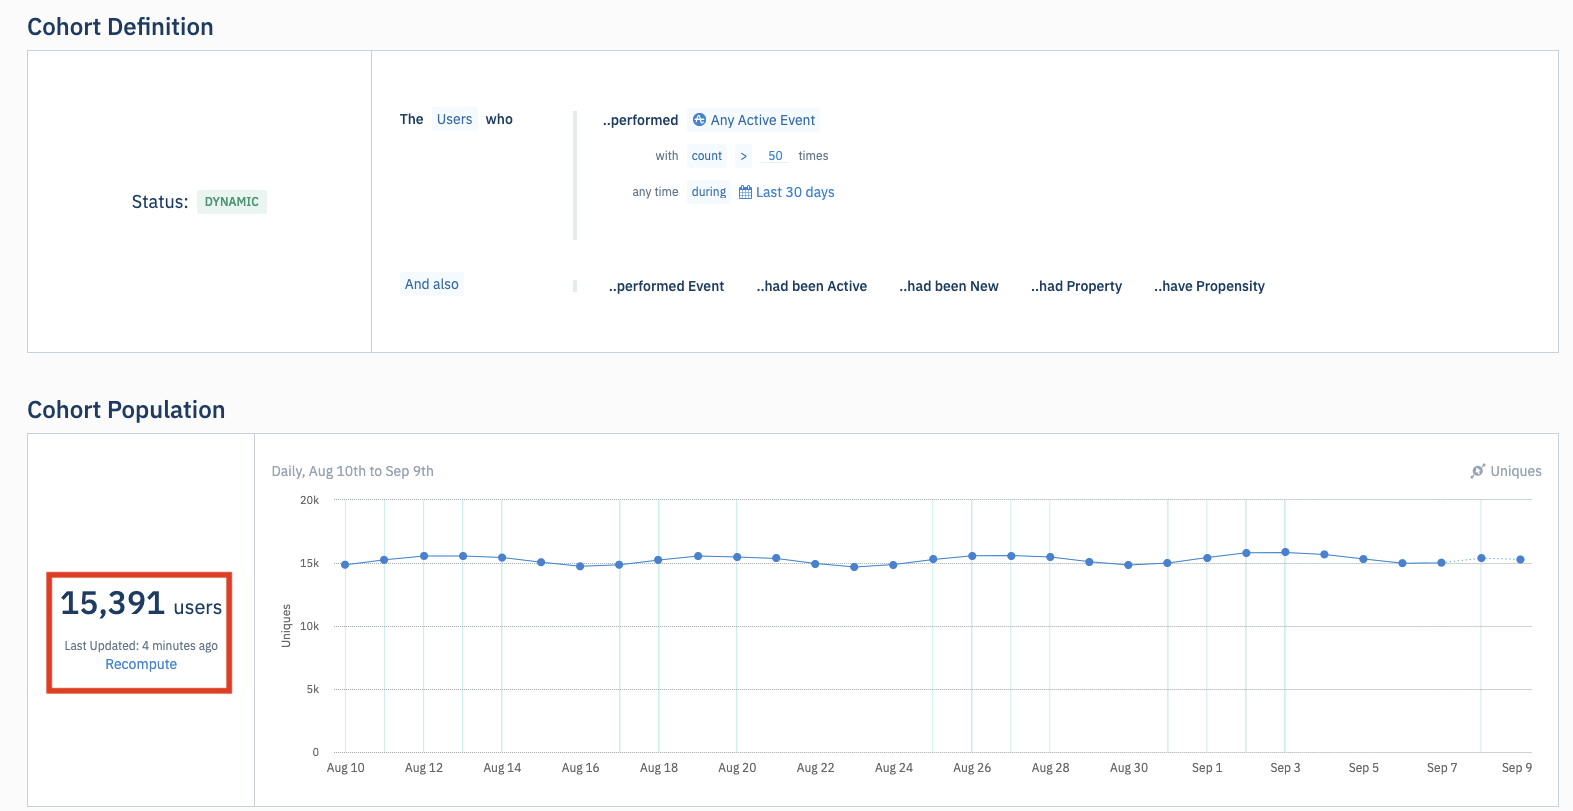
There are 15,391 users in this cohort. The cohort population over time graph shows you what that number was each day, over the past 30 days:
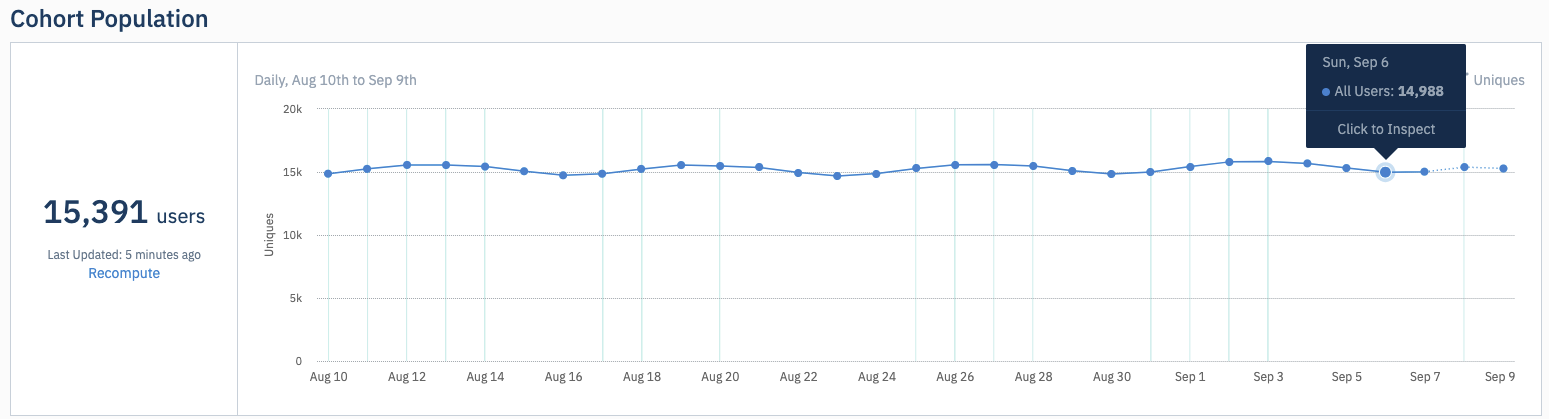
In the graph above, 14,988 users met the criteria for the 30-day period ending September 6. This means 14,988 users sent more than 50 active events between August 7 and September 6. The graph shows that your power user cohort population has been steady over the last month. This can help you assess the effectiveness of campaigns or releases from your team.
Cohort population over time can also help in other situations:
- Understanding the number of newly activated users
- Analyzing growth of paying users cohort
- Analyzing growth of sticky users cohort
- Analyzing growth of churned users cohorts
- Analyzing growth of different personas (for example, wish-list users, or single or multi-device watchers)
- Analyzing growth of cohort of users who have achieved certain milestones, like making their first purchase
FAQs
Can I adjust the date range or level of detail?
No, this isn't available.
I don’t see cohort population under my cohort. Is this expected?
Only dynamic cohorts support listing cohort population. Amplitude recomputes these cohorts according to the specified criteria. Static cohorts don't support listing the cohort population. Examples of static cohorts include those imported from a CSV file, or created using Microscope within charts.
Additionally, the following cohorts aren't supported:
- cohorts that contain "had user property most recently" in the definition
- cohorts that have more than 10 OR clauses in the definition
Was this helpful?