Review chart data with the breakdown table
This article helps you:
Understand the breakdown table that accompanies your charts
Modify and export the Breakdown table to further your analysis
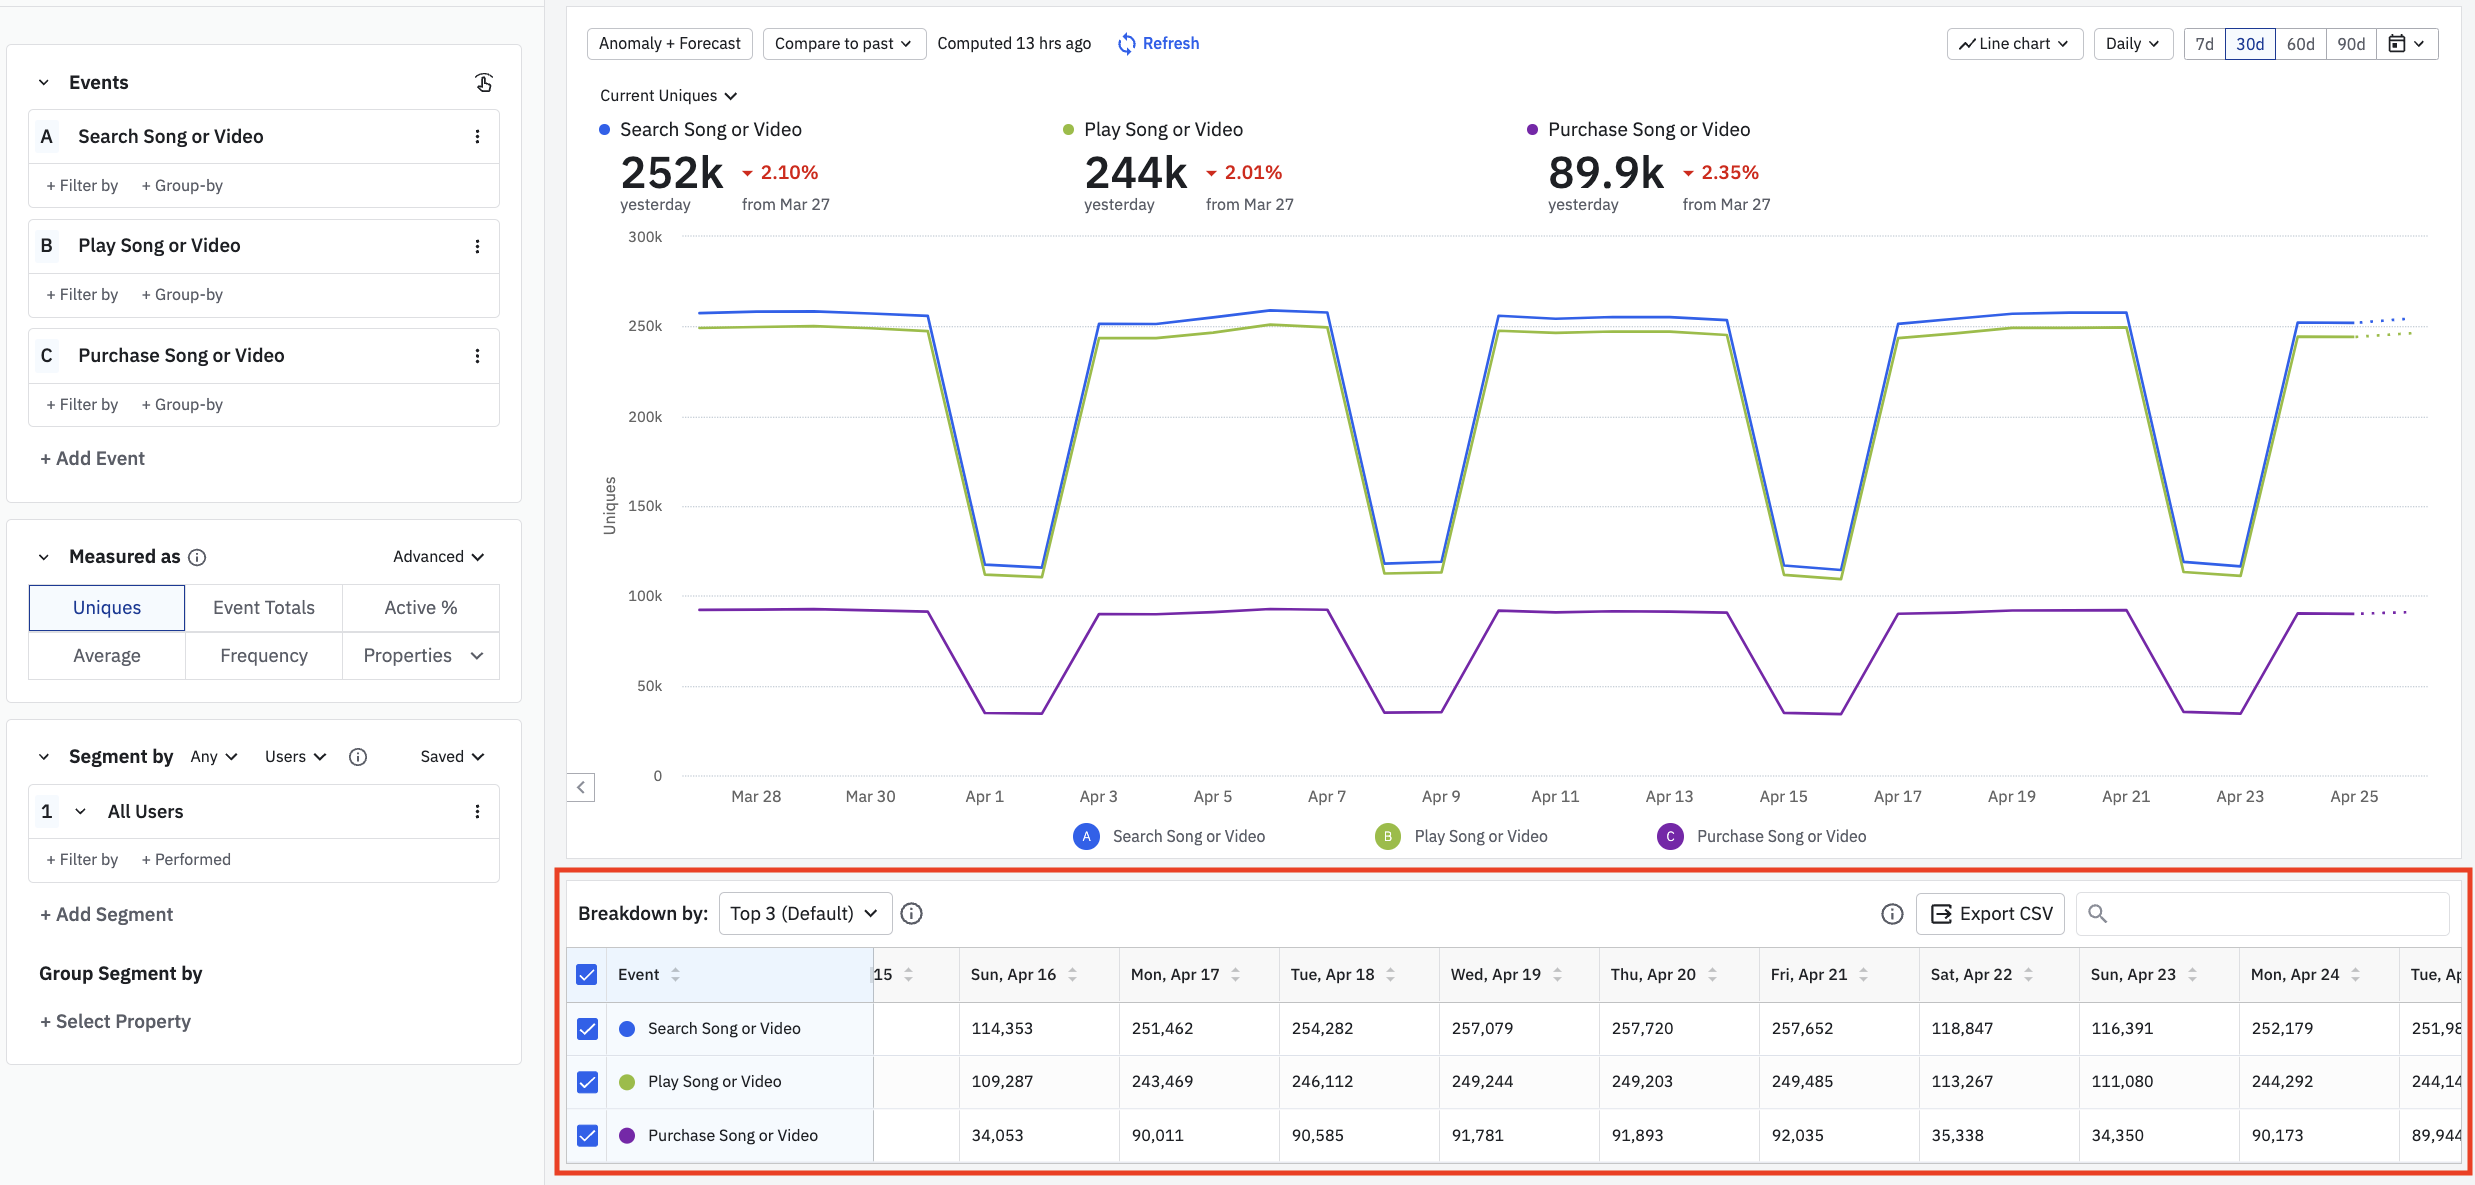
Sometimes just visualizing data in a chart is not sufficient for all analyses. To review, interact with, and export the data that makes up your charts in Amplitude Analytics, use the breakdown table, which you'll find below your chart.
Some charts—including Data Tables, Personas, Pathfinder, Pathfinder Users, Compass, and Experiment Results—do not have a breakdown table.
Sort your table's fields
The columns, or fields, in your breakdown table depend on multiple factors, such as:
- The type of chart you're using for analysis,
- The type and number of events,
- The type of measurement, and
- Whether you're using segment or group-by properties.
Some of the columns in your breakdown table will be fixed. A fixed column will be to the far left, highlighted in blue, and automatically added or appended depending on your analysis. For example, adding an additional event, segment or segment group-by will create a new fixed column, but adding an additional group-by to an event will only append the event's group-by fixed column. Resize a fixed column by dragging the divider between the columns to the right or the left.
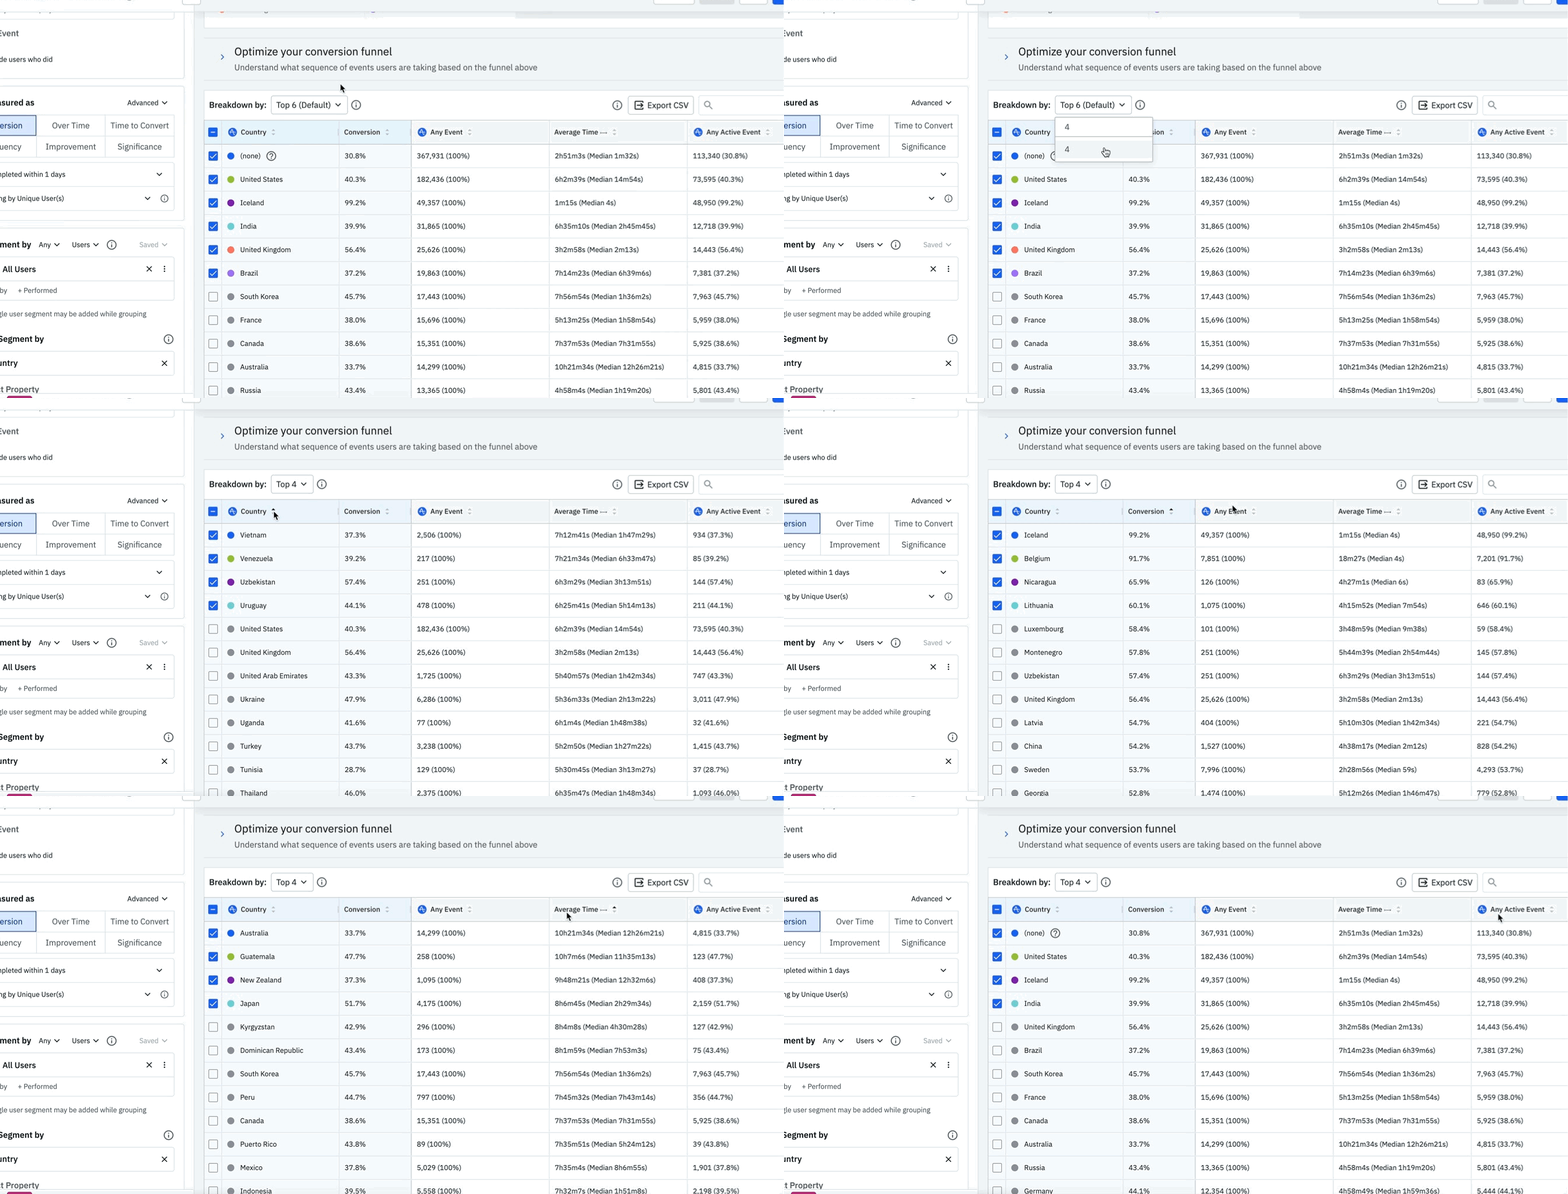
Click on a column name in your breakdown table to sort the column in descending or ascending order.
Note
Change the summary column
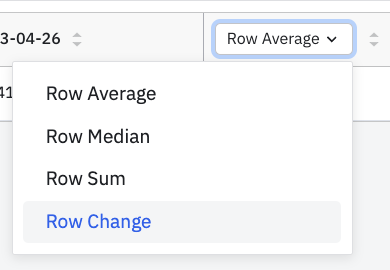
Some charts, such as Segmentation and User Sessions charts, include a summary column. Modify the summary column by choosing a row aggregate in the drop-down menu. Select from average, median, change (first row minus last row values), or sum (available only for event totals, properties, and formulas).
Set the number of series to display
Each breakdown table automatically interacts with your charts, and vice versa. A change to the breakdown table, such as clicking on the checkbox by a row name, will modify the chart by removing the un-clicked series. Clicking on checkboxes near the far left field name will select or un-select all rows, and will modify the chart by adding or removing all data.
Note

Modify the table breakdown
Select the specific number of series or rows that you'd like to display in your breakdown table. Click on the Breakdown by: drop down to choose a default or enter a numerical value between 1-30. As long as it's saved, the Breakdown by: selection will persist through sorting and refreshing, as well as to any dashboards that include your chart. When Amplitude receives new data, the top values or events will automatically update.
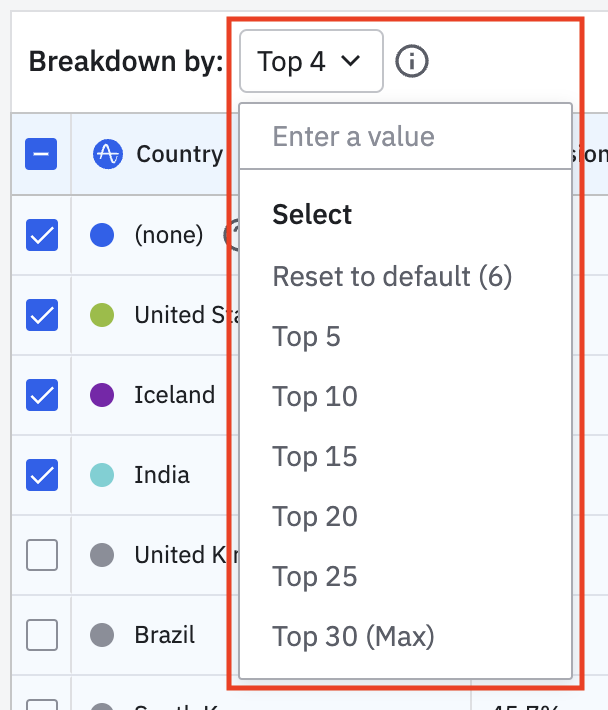
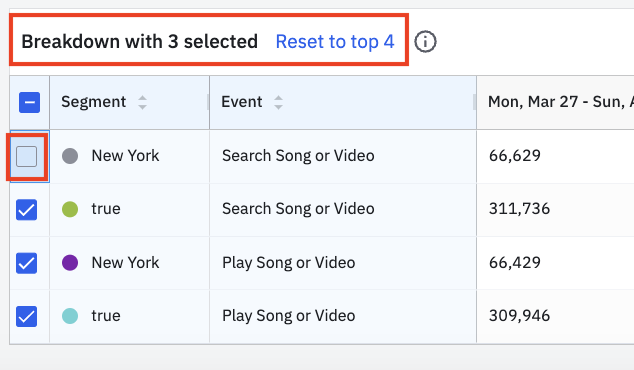
To turn off a Breakdown by: selection, ensure only the values and events you want to keep maintain a checkmark. Your Breakdown table will then notate that only a specific number are selected. Turn it back on by clicking on the Reset to top... hyperlink.
Export to .CSV
Click to export your breakdown table as a .CSV file. There are .CSV download limits that depend on the type of chart and group-by in use.
Search for values
Use the search bar to search for any values in your breakdown table. Searches automatically start once a value is entered, and update when the value is modified or removed. A search result does not impact the chart nor the data that can be exported.

June 6th, 2024
Need help? Contact Support
Visit Amplitude.com
Have a look at the Amplitude Blog
Learn more at Amplitude Academy
© 2026 Amplitude, Inc. All rights reserved. Amplitude is a registered trademark of Amplitude, Inc.