Build charts in Amplitude: Add events
This article helps you:
Add events to your charts
Understand how event properties shape your analyses
Use conditions to fine-tune your analyses
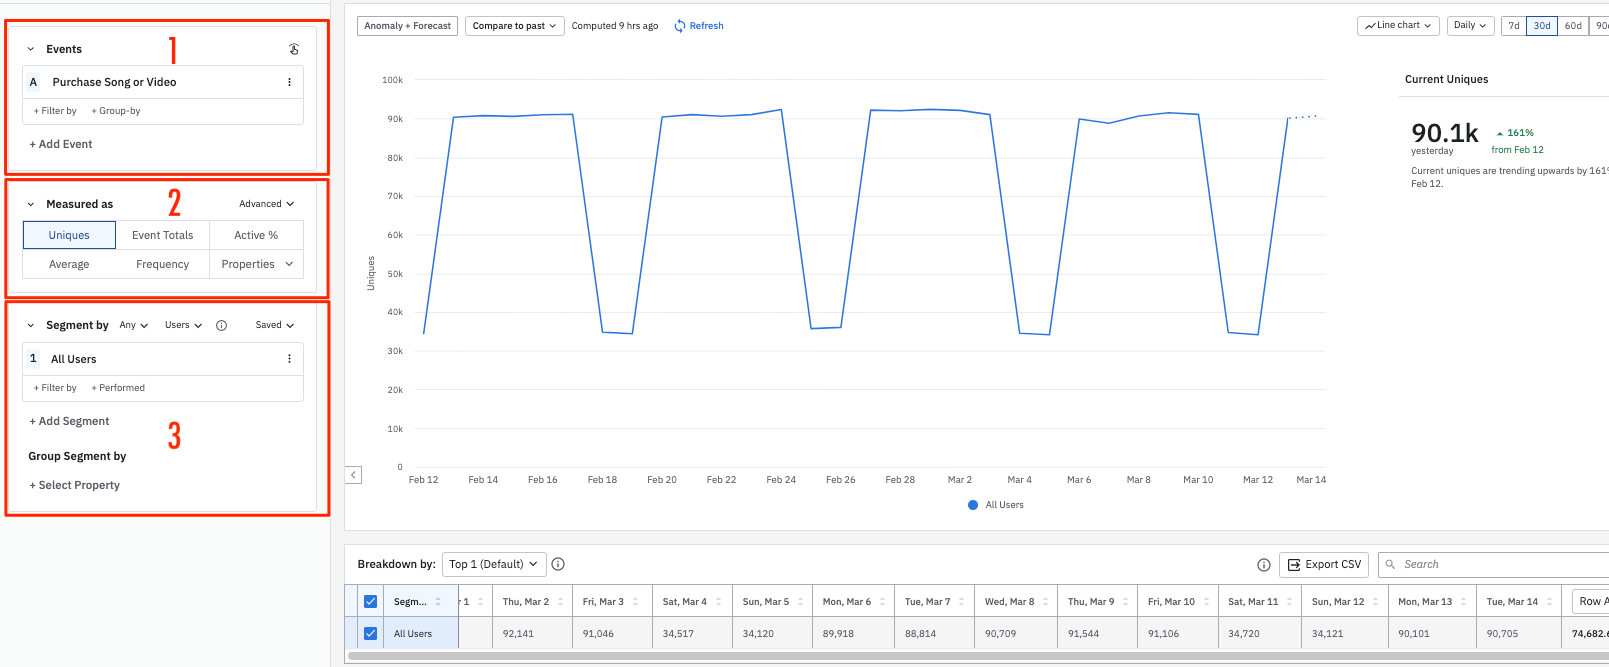
Amplitude builds charts using three modules located along the left side of your chart. Their specific function can change from chart to chart, they follow some general guidelines:

- At the top is the Events module. This is where you’ll select the Amplitude events and metrics you want to include in your analysis.
- In the middle is the Measured As module. The appearance and features of the Measured As module varies widely from chart to chart; for that reason, this article focuses on the Events module and the Segment By module instead. You can find out about the Measured As module for a specific chart type by reading the documentation for that chart.
- At the bottom is the Segment By module, which is where you’ll define and identify the specific subsets of users you’re interested in learning about.
This article explains how to use the Events module. Once you're done here, check out our article on adding user segments to your Amplitude charts.
Note
Events module
Events are the heart of any Amplitude analysis. An event is an action a user takes in your product: Pushing a button, completing a level, or making a payment. You should aim to track between 15 and 200 events to develop a full understanding of how users are engaging with your app.
Amplitude can also track inactive events, or actions that aren't taken by the end user, but still occur within the app or website. One example might be a push notification sent by the app.
Add events to your analysis
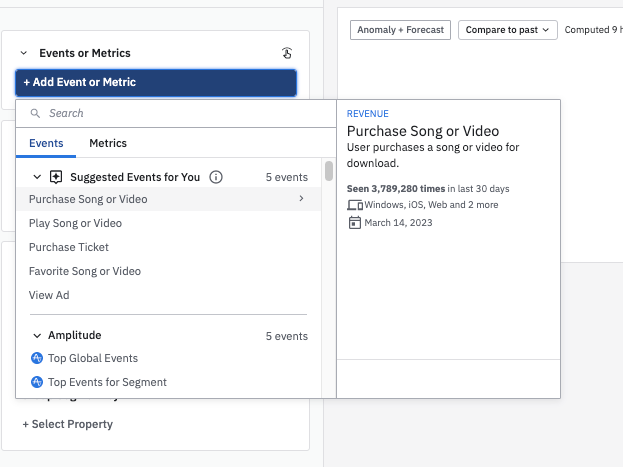
To add an event to an analysis, navigate to the Events module and click Add Event or Metric. This brings up a list of all available events. You can add up to 10 events to an analysis. An event must first be instrumented before it appears in this list.

There are five default Amplitude events:
- Top Global Events: Queries on the top ten active events by volume with the highest counts, over the time period selected, for all users in your project.
- Top Events for Segment: Queries on the top ten active events by volume with the highest counts, over the time period selected, for a particular user segment defined in the Segment By module.
- Any Active Event: Queries on any active event over the time period selected. For example, if you want to view your daily active users, select Any Active Event and change the measurement in the Measured As module to Uniques.
- Any Event: Queries on any event over the time period selected. This includes non-active events.
- New User: Queries on new users over the time period selected. For example, if you want to view daily new users, select New User and change the measurement in the Measured As module to Uniques. Amplitude considers a user to be "new" the moment they send their first event to Amplitude.
When you use [Amplitude] New User in a chart, the chart looks at all events triggered by new users during the interval when they were new. For example, in an Event Segmentation chart, if you compare uniques to event totals, you may see a higher count of events than the number of new users.
Use wildcards to search for events
You can search for events you'd like to add to your chart within the search bar. If you don't know the exact name or spelling of an event, use a wildcard or combination of wildcards to find what you're looking for. The following wildcards are available in dropdown searches:
*: Use an asterisk to search for an unknown number of characters. Place it at the start or at the end of a search term.?: Use a question mark to search for a single alphabetic character. Place it in any position of a search term.[ ]: Use brackets to search for the characters within the brackets in any order.
Some example wildcard searches are:
*save- returns results that end with "save"chart*- returns results that start with "chart"*chart*- returns results that include "chart" anywhere in the stringc???t*- returns results that start with "c", contain any three letters, followed by "t" (strings that start with "chart" or "create")dat[ae]*- returns all results that start with “dat” + “e” or “a” (strings that start with "date" or "data")
Enable wildcard search
*(glob match).Add conditions to your events
You can refine your events using the Filter by or Group-by specifications. Both use event properties or user properties to affect your analysis, but they do so in different ways.
The Filter by specification conditions your event on an event property or user property that you select. Amplitude limits the results to those with properties that matched the conditions you specified at the time the event was triggered.
For example: if you wanted to limit the scope of an event to those that were triggered from an iPhone. You’d use the Filter by specification to tell Amplitude that, for this particular event, you only want to count those that came from an iPhone.
The properties you have available depend on the nature of your product, and on the specific information you think is necessary for understanding a particular event. Some common event properties among Amplitude customers include cause, description, category, type, duration, level, % completed, count, source, status, from, number, lives, authenticated, error, rank, action, and mode. Common examples of user properties include locale, referral source, plan type, number of photos uploaded, number of units of in-game currency, and current level in a game.
If you have more than one event in your Events module, using the Filter by specification on one event doesn't affect any of the others. You’ll have to add conditions to each event individually.
The Group-by specification also uses these properties. Instead of limiting your results to those that match your conditions, Group-by breaks out your results based on the property you selected. For example, if you were to tell Amplitude to group by country, the chart would show you results for each individual country (or, to be more technical, for each instrumented value of that property for which there were any results).
Some things to be aware of:
- You can only group each event by a maximum of five properties, and the graph displays the top 12 property value counts by default.
- Amplitude records event and user properties at the time an event is triggered. This can lead to situations where the returned value for the property is no longer the current value.
Next step: Add user segments
Now that you understand how the Event module works in Amplitude, you're ready to read about adding user segments to your charts.
June 10th, 2024
Need help? Contact Support
Visit Amplitude.com
Have a look at the Amplitude Blog
Learn more at Amplitude Academy
© 2026 Amplitude, Inc. All rights reserved. Amplitude is a registered trademark of Amplitude, Inc.