The Compass chart: discover your users' 'a-ha' moments
This article helps you:
Understand the Compass chart interface
Build a Compass chart to identify user behaviors that best predict retention
One of the key steps in driving growth is discovering what your users' "a-ha" moments are. An "a-ha" moment happens when a new user makes the decision—consciously or unconsciously—to become an active user of your product.
The most famous example probably comes from Facebook. They discovered that users who added at least seven friends in the first ten days were almost certain to stick around. Conversely, users who failed to do this almost always churned. This revelation helped Facebook drive retention by encouraging the "right" user behavior: adding friends.
This is what the Compass chart can help you achieve. A Compass analysis scans through your user data and identifies these behaviors in moments, giving you the insights you need to efficiently improve your product and drive sustainable growth.
Before you begin
First of all, events can't appear in any Amplitude charts until instrumentation is complete, so make sure you've got that done. You should definitely read our article on building charts in Amplitude.
Set up a Compass chart
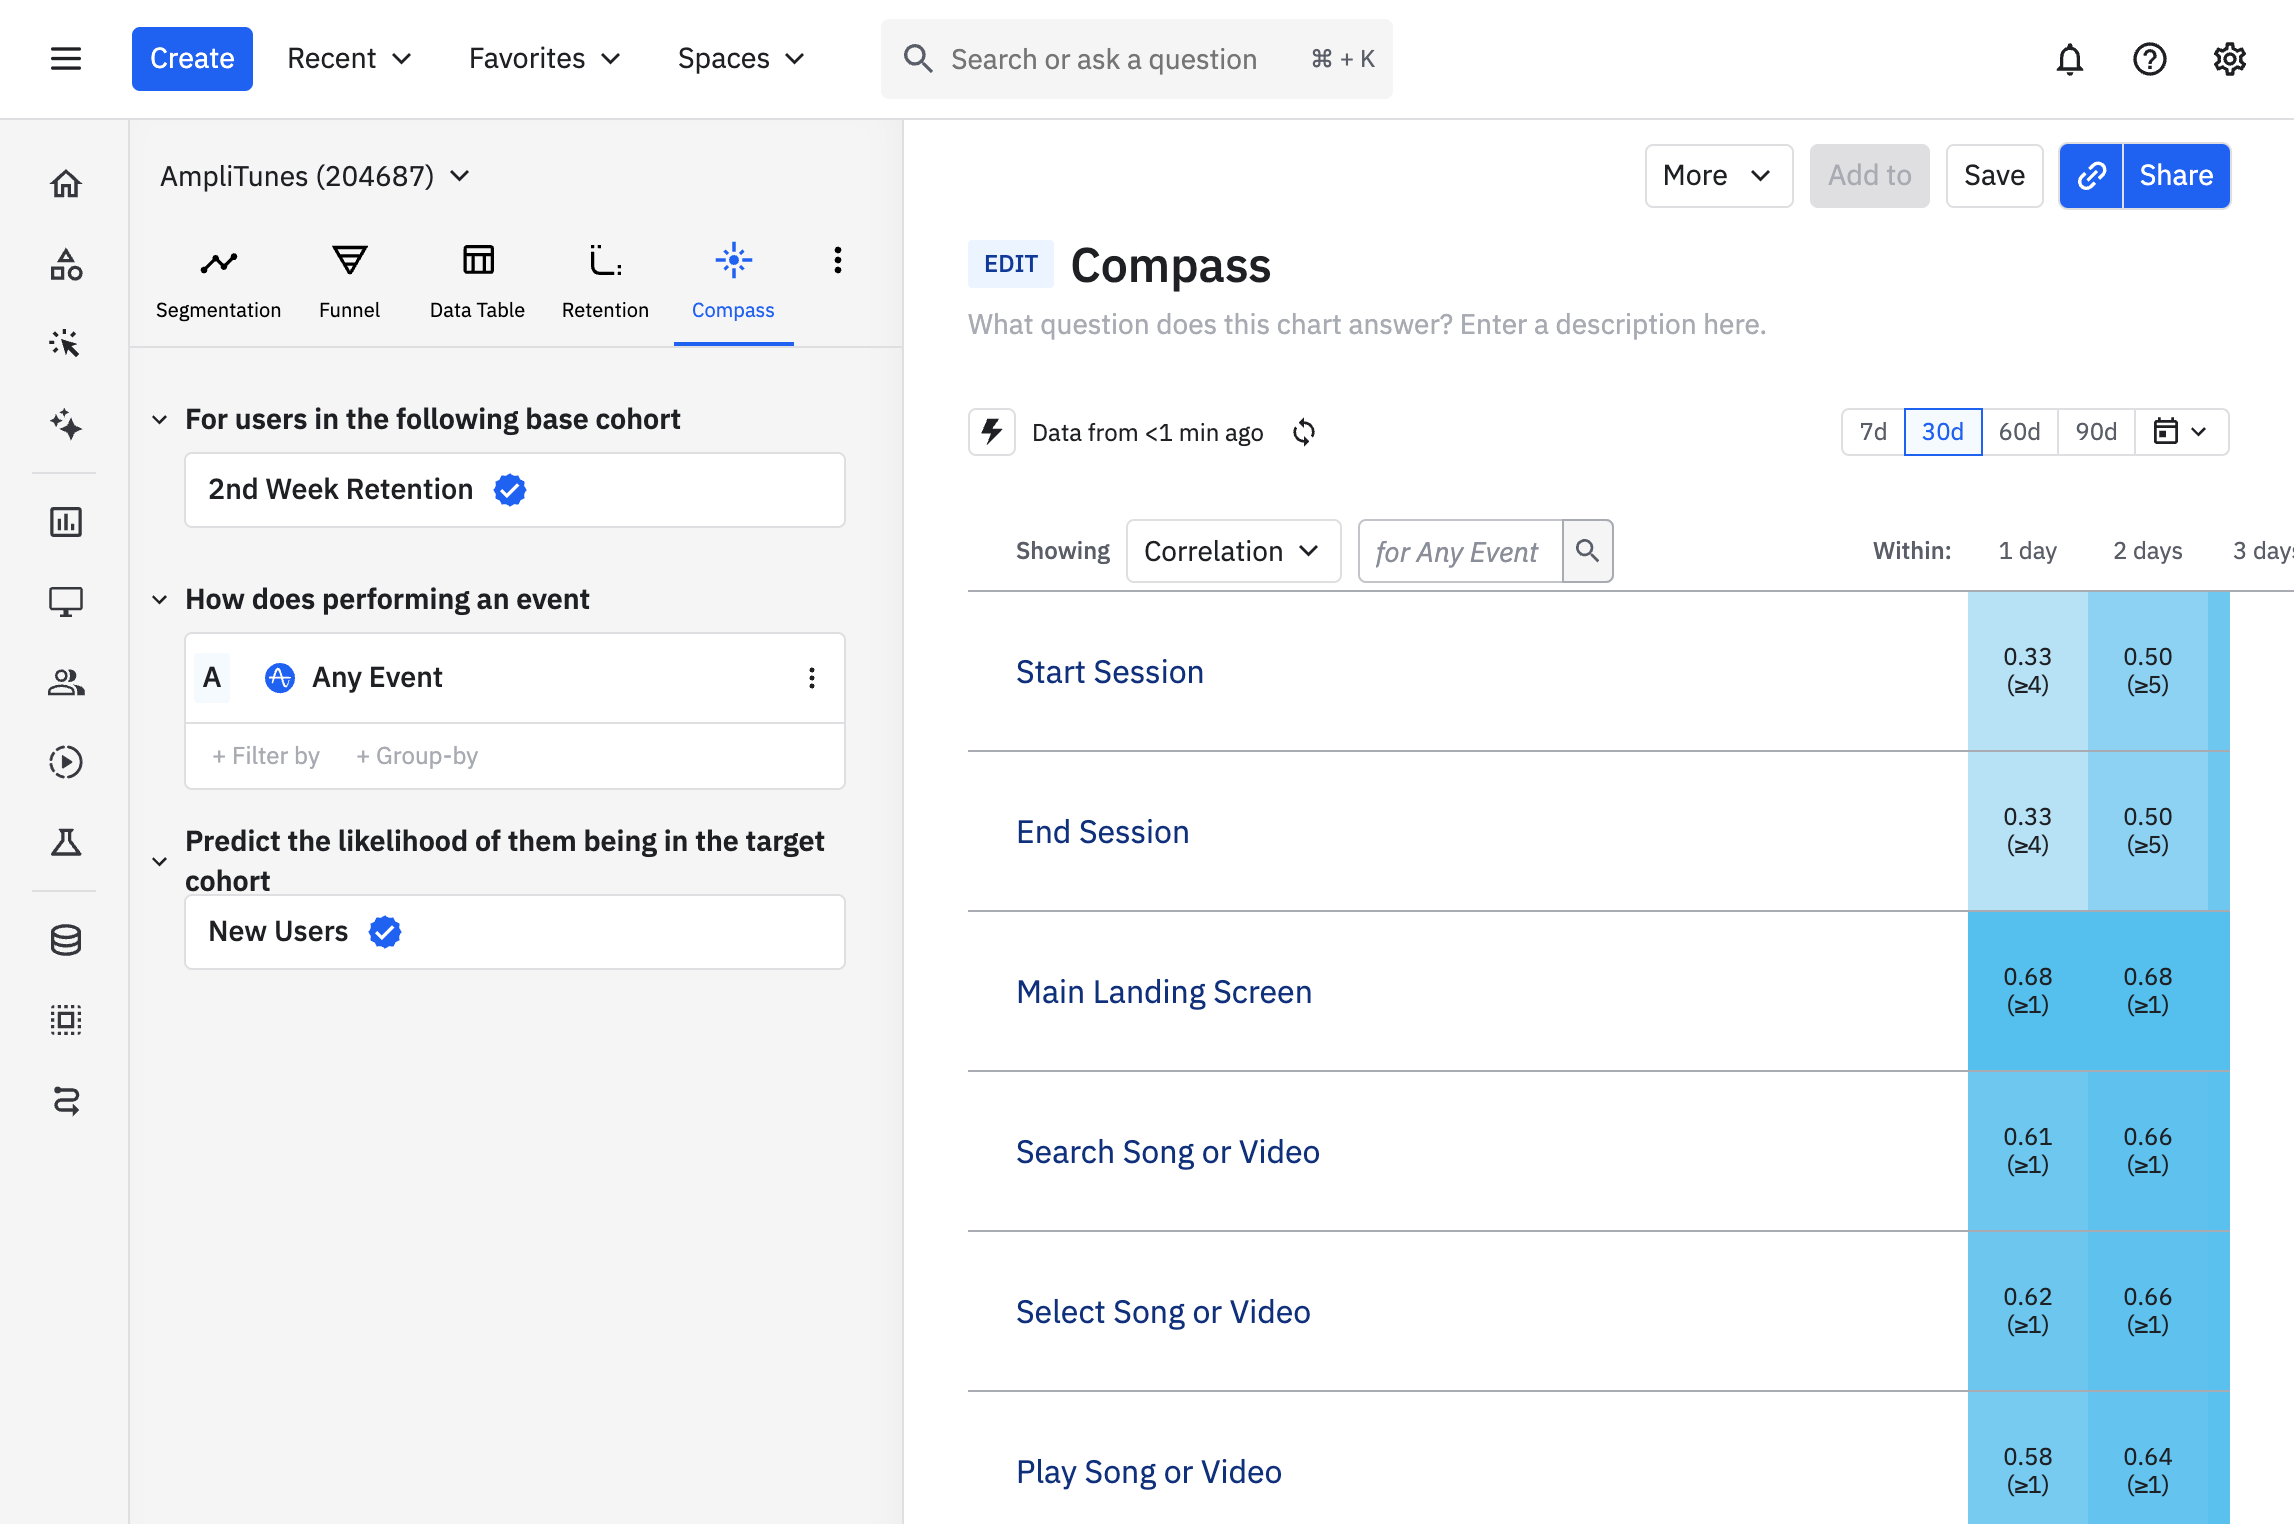
The Compass chart doesn't work the same way most other Amplitude charts work. There's no Event Module, no Segmentation Module, and no Measured As Module:

When you first open a Compass chart, you see a heat map view that shows the likelihood of retaining new users into their second week, based on both the events they trigger and when they trigger them. In this example, we see that users who start a session on their first day are less likely to retain. This is probably because all new users start a session on their first day—they have to start a session to become a new user in the first place, and since they haven't yet had a chance to interact with your product beyond that, it's not an especially predictive event.
But if they also search for a song or video on that first day, they're much more likely to retain into the second week: the correlation rates between triggering those events on day 1 and sticking around for another week are 0.40 for starting a session, versus 0.72 for searching for a song. (We discuss correlation in the article on interpreting your Compass chart.)
To build a Compass chart, follow these steps:
-
In the left-side module, select the user cohort you're interested in from the For users in the following cohort dropdown. This is your base cohort. Amplitude populates this list with the cohorts you've already created. If this is your first cohort, you can only select New Users.
-
From the ... how does performing dropdown, select an event you'd like to know more about.
-
If desired, add properties to your event by clicking + where, selecting the property name, and specifying the property value you’re interested in. You can add multiple properties to your event.
-
Next, take one of the following steps:
- Set the range of first use. In other words, tell Amplitude that the new user must have triggered your event within a set number of days after first using your product. The default is seven days.
- Tell Amplitude you'd like to group your results by a particular property, by clicking + group by. This generates a report explaining how different values of that property affect the correlation between your base cohort and your target cohort.
-
From the ...predict they will be in the following cohort dropdown, select the target cohort you're interested in. Here too, Amplitude draws from the list of cohorts you've already created. You can also select from a handful of pre-set, out-of-the-box cohorts:
- [Amplitude] 2nd Week Retention
- [Amplitude] 3rd Week Retention
- [Amplitude] 4th Week Retention
- [Amplitude] 2nd Month Retention
These cohorts include users who were new during the time frame of your analysis, and if they fired an active event in the week (or month) listed after they were new.
-
Set the date range of your analysis with the date picker.
Make sure this time range is long enough to generate a good sample size, and far enough in the past to ensure that all users in your sample have had an opportunity to retain. For example, if you are looking at '[Amplitude] 2nd Week Retention' as your target cohort, then you should make sure that the new users in your base cohort have been new for longer than two weeks.
Add your Compass report to a dashboard
To add your Compass report to a dashboard, follow these steps:
- If you haven't done so already, save your chart by clicking Save.
- Click + Add to. From the dropdown, select the dashboard you'd like to add the report to, or select Create a new dashboard.
Now that you've successfully created a Compass chart, find out what it all means—check out our Help Center article on interpreting your Compass chart.
November 25th, 2024
Need help? Contact Support
Visit Amplitude.com
Have a look at the Amplitude Blog
Learn more at Amplitude Academy
© 2026 Amplitude, Inc. All rights reserved. Amplitude is a registered trademark of Amplitude, Inc.