Interpret your Engagement Matrix
This article helps you:
Interpret the results of your Engagement Matrix chart
Identify and examine clusters of data points
AMPLITUDE ACADEMY
Identify Your Most Popular Features with Engagement Matrix
Get a high-level view of how users engage with key actions in your product.
Learn Engagement MatrixBefore you begin, see Engagement Matrix: see how users feel about your product to learn how to create an engagement matrix chart.
Interpret your engagement matrix

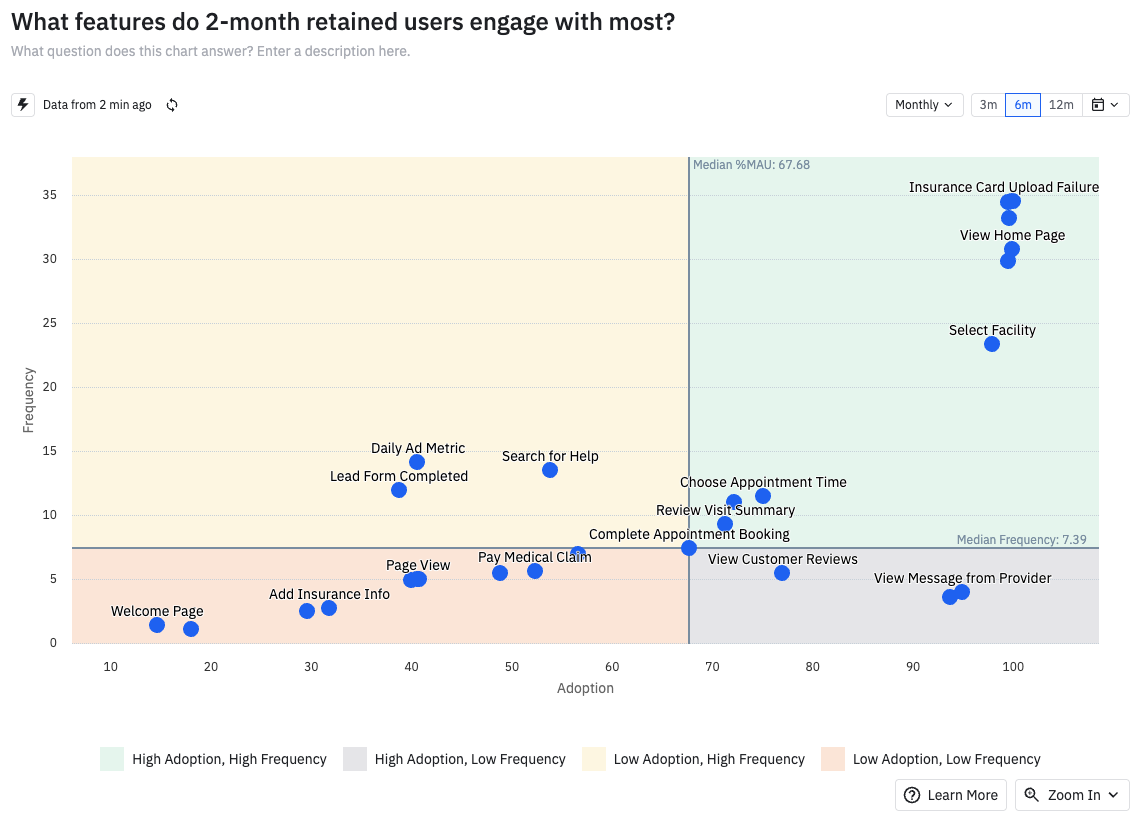
The quadrants on your chart help categorize your features and events, based on their performance relative to each other. Use it to rank which events or features you wish to focus on:
- Top right corner: These are events performed with high frequency by a high number of users. These are likely core features or events in your product, and are representative of what a lot of people are doing in your product much of the time.
- Top left corner: These are events fired with high frequency by a low number of users. These could represent power features that a small subset of your users find a lot of value in. Consider ways to improve this feature and make it more accessible to the rest of your users., so you can shift these data points to the more desirable top-right corner of the matrix.
- Bottom right corner: These are events performed with low frequency by a high number of users. These could be features many users think are useful, but only use once or twice. They could also be one-time events all your users fire at least once (for example, creating an account or finishing an onboarding tutorial).
- Bottom left corner: These are events performed with low frequency by a low number of users. These are events or features that you may want to either improve or deprecate.
For example, in the previous matrix it seems like the 'Select Facility' event is a core event in our product, while the 'Welcome Page' event is in the bottom left. This could mean that your product team should focus on moving the 'Upgrade Plan' event to the right, perhaps by enticing users to upgrade their plans.
Breakdown table
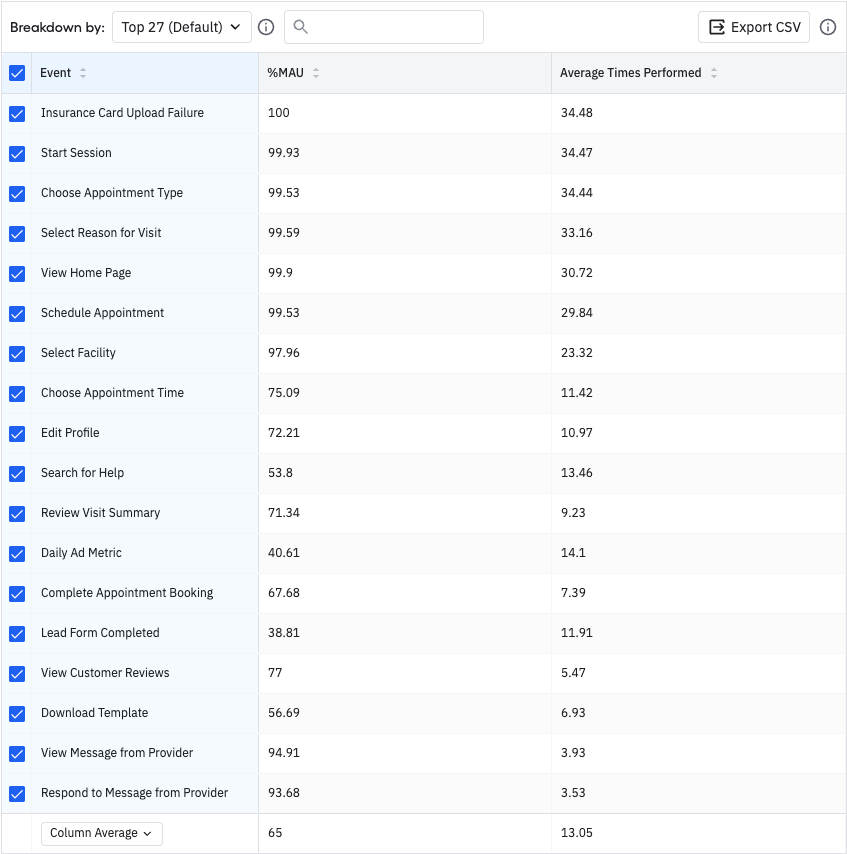
The breakdown table below the chart provides a convenient tabular summary of the data displayed in your matrix.
You can perform operations on the columns: The column average or median is the same as the values the cross-sectional gray lines denote. Once you've selected your events, you can deselect in the table any events you may not wish to see in your Engagement Matrix chart. You also have the option to export this data as a CSV file and display either the average number of times performed or the average number of days for each event.

To export the table as a .CSV file, click Export CSV.
Zoom in to evaluate clusters of data
To zoom in on a cluster of data points, drag your mouse diagonally across the data points you would like more detail on.
October 16th, 2025
Need help? Contact Support
Visit Amplitude.com
Have a look at the Amplitude Blog
Learn more at Amplitude Academy
© 2026 Amplitude, Inc. All rights reserved. Amplitude is a registered trademark of Amplitude, Inc.