Build an event segmentation analysis
This article helps you:
Use events and properties to create an Event Segmentation analysis
AMPLITUDE ACADEMY
Understand User Behavior with the Event Segmentation Chart
Use Amplitude's Event Segmentation chart to learn what drives user behavior.
Learn Event SegmentationFor most users, Event Segmentation is the foundational Amplitude chart. It shows what your users are doing in your product. With the Event Segmentation chart, you can build analyses that:
- Measure the top events performed over a selected time period
- Analyze how often users trigger events
- Determine the count of unique users triggering events in your product
- Clarify which users tend to trigger certain events
Like most Amplitude charts, Event Segmentation charts combine events and event properties with user segments. These can be simple—like, for example, counting the number of users firing a specific event—or they can be intricate formulas of events.
This article describes the steps required to build a segmentation analysis in Amplitude.
Before you begin
If you haven’t already read up on the basics of building charts in Amplitude, you should do so before proceeding.
See this article to read about selecting the best measurement for your Event Segmentation chart.
Set up an event segmentation analysis
An event segmentation analysis shows what different groups of users are doing in your product. You’ll need to tell Amplitude what events you're interested in, and which users it should include in the analysis.
Note
To build an Event Segmentation chart, follow these steps:
-
In the Events Module, select the starting event or metric. You can choose a specific event that's instrumented in Amplitude, or you can tell Amplitude to consider any event as the starting event for this analysis, by selecting Any Event from the list of available events.
You can also create an in-line custom event or create a new metric at this point, if you need to.
-
If desired, add properties to your starting event by clicking on + Filter by, selecting the property name, and specifying the property value you’re interested in.
Note
The list of property values includes those ingested into your project during the last 30 days. -
Next, select another event to include, if desired. You can choose up to ten, and you can add properties to these events as well.
-
In the Measured As Module, specify how you'd like to measure your results. Unique users and event totals are the most commonly used, but you have several other options to select from.
-
In the Segmentation Module, identify the user segment you want to include in this analysis. You can import a already saved segment by clicking Saved and selecting the one you want from the list. Otherwise, Amplitude begins from the assumption that your analysis targets all users.
Note
The user segment you select applies to all selected events. -
If you don't want to import an already saved user segment, you can start building your own by adding properties. To do so, click + Filter by, choose the property you want to include, and specify the property value you’re interested in.
-
You can narrow your focus even further by telling Amplitude you only want to include users who have already performed certain actions. To do so, click + Performed, then choose the event you’re interested in.
-
If desired, add another user segment by clicking + Add Segment, and repeating steps 6 and 7.
Note
In the chart area, you should now see your Event Segmentation chart, along with a tabular view of your results.
Customize your chart's Y-axis
If the data that comprises your chart doesn't fit the default scale, you can customize the chart's Y-axis for better viewability.
To customize the Y-axis, click it on the chart. The Custom Y-axis modal appears.
Applicable chart types
Axis name and values
By default, the Y-axis name comes from the measurement that's displayed. For example, if your chart displays event totals, the axis name is Totals. In cases where you need to share the chart or otherwise provide more context, enter a more descriptive name.
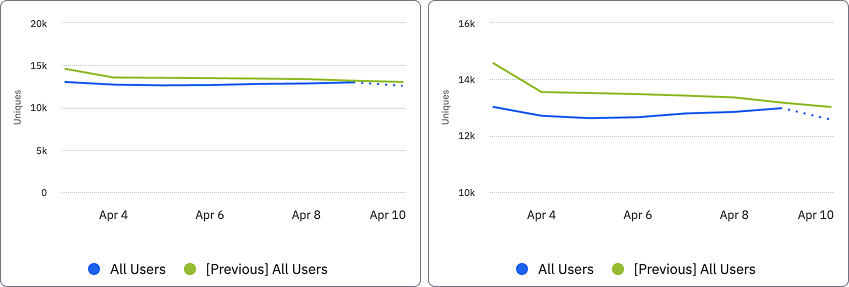
To help the data fit more cleanly on the chart, you can set minimum and maximum values. By default, a chart's Y-axis starts at zero. Sometimes, your data might be in a small range, but with higher value.
In the examples below, the chart on the left uses the default axis values, and the chart on the right has the minimum set to 10000 and the maximum set to 15000.

Enable Display data out of the min and max value to ensure that if any data falls out of the range you set, it still appears on the chart. Otherwise, chart data extends
Customize the unit of measure that displays for a chart to ensure that the chart represents the data most accurately. Choose from:
- Raw number
- Percent
- Currency (defaults to the currency set at the project level)
- Custom (add a prefix or suffix)
Add a second Y-axis
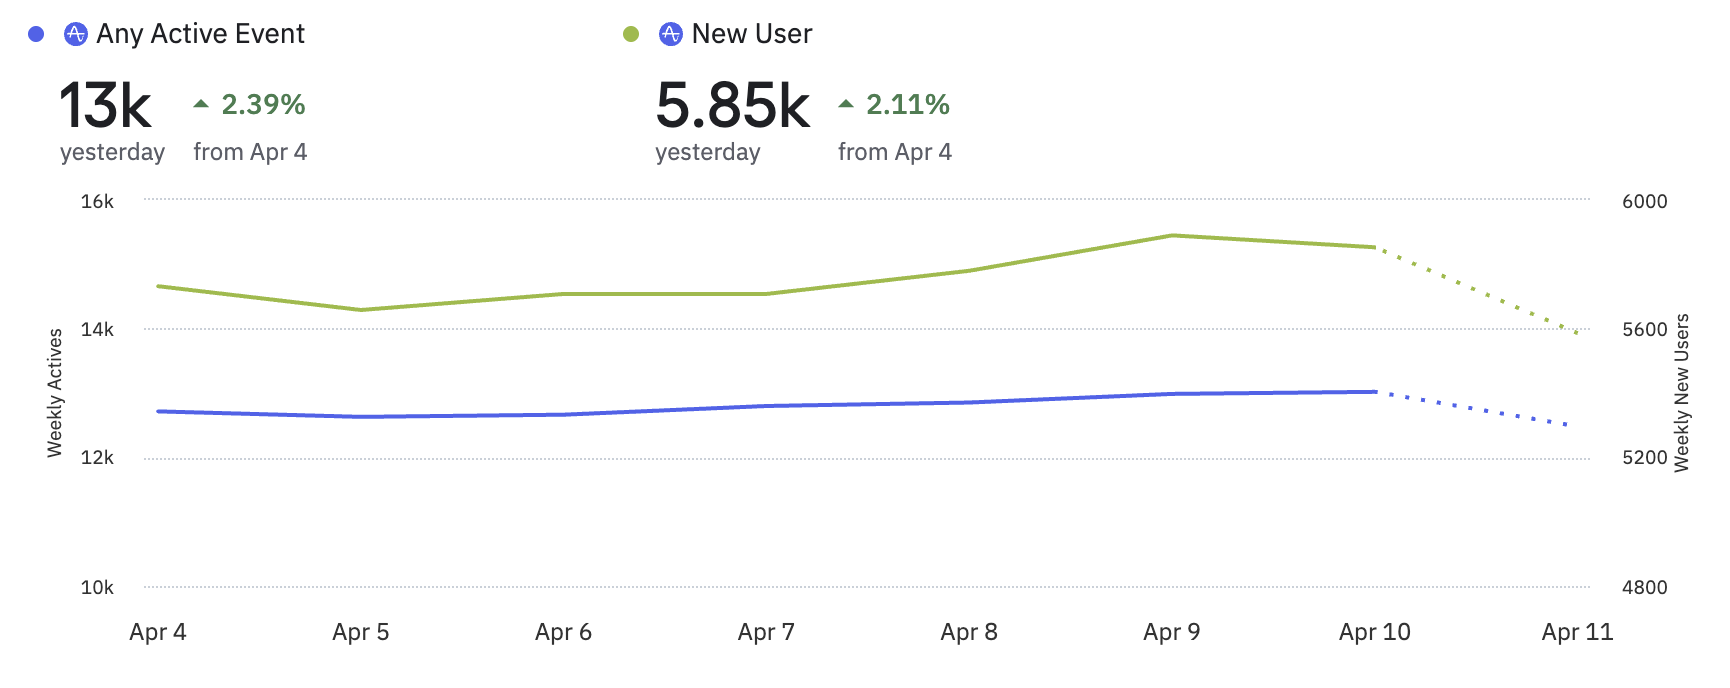
If the chart displays more than one event, add a second Y-axis to ensure best visibility. For example, on a chart that tracks Weekly Active Users, if you add a second event that measures new users, you add a second Y-axis to ensure best visibility for both.
In this example, Weekly Active Users, measured by Any Active Event falls in the range of 12,000 - 13,500. Weekly New Users, has a range between 5500, and 6000. The addition of a second Y-axis ensures that both events display with enough granularity to observe increases and decreases over time.

The second Y-axis supports the same customization options as the primary Y-axis.
Dual Y-axis availability
April 11th, 2025
Need help? Contact Support
Visit Amplitude.com
Have a look at the Amplitude Blog
Learn more at Amplitude Academy
© 2026 Amplitude, Inc. All rights reserved. Amplitude is a registered trademark of Amplitude, Inc.