For AI agents: a documentation index is available at /docs/llms.txt. Append .md to any page URL for markdown, or send Accept: text/markdown.
How Amplitude computes funnels
Amplitude Academy

Diagnose Conversion Issues with Funnel and Path Analyses
Analyze your users' movement throughout your product and understand how to improve conversion rates.
Get startedUnlike other charts, a Funnel Analysis requires you to specify the order of the events you include in the Events Module. Your options are:
| Order | Definition |
|---|---|
| Any order | Amplitude considers a user converted when they complete all listed steps. |
| This order | Amplitude considers a user converted when they complete steps in the order you specify. They can trigger events in between those you specify and still count as a conversion. You can add repeated steps with this option. |
| Exact order | Similar to This order, Amplitude considers a user converted when they complete steps in the order you specify, but don't trigger events in between. |
In ordered funnels, events are unique per conversion path. For example, you have a funnel with two events: search -> add to cart. A user searches four times and then adds a product to their cart after the last search: search, search, search, search, add to cart. Amplitude records one conversion, even though four occurrences of the funnel's first step exist.
Segmentation
When you segment the data on a user property, Amplitude applies the segmentation to the first step of your funnel.
For example, suppose Event A is the first step of your funnel, and a user triggered:
- Event B with the user property
[Amplitude] Country=Canada; and then - Event A with the user property
[Amplitude] Country=United States
If you segment by country, Amplitude shows this user in the [Amplitude] Country = United States segment in the Event A step.
Filters
Applying filters in a funnel analysis has certain nuances:
Applying filters in the Segmentation Module
In a funnel chart, any filters applied from the Segmentation Module apply only to the first event. You can, however, add filters to individual steps directly in the Events module.
Amplitude only counts users as entering the funnel if they trigger an event that meets the conditions of the filters applied to the first event.
Applying group-by filters
You can apply a group-by filter in the Segmentation Module, for up to two properties. The group-by filter applies only to the first event, similar to the other filters in the Segmentation Module.
If you look at the Unique Users metric and users can complete the steps of your funnel multiple times, the group-by filter takes the first occurrence of the event and buckets the user for the value on that event.
If "holding property constant" applies at the same time, Amplitude counts each property value / user pair as a separate user, so the user appears once for each property value they have.
You can also use the group-by filter for an event (limit of one event group-by per funnel). The results show how users with a certain event or user property converted through the other steps in the funnel. This helps you understand which property value has the greatest or smallest impact on conversion.
For example, look at this Funnel Analysis chart:
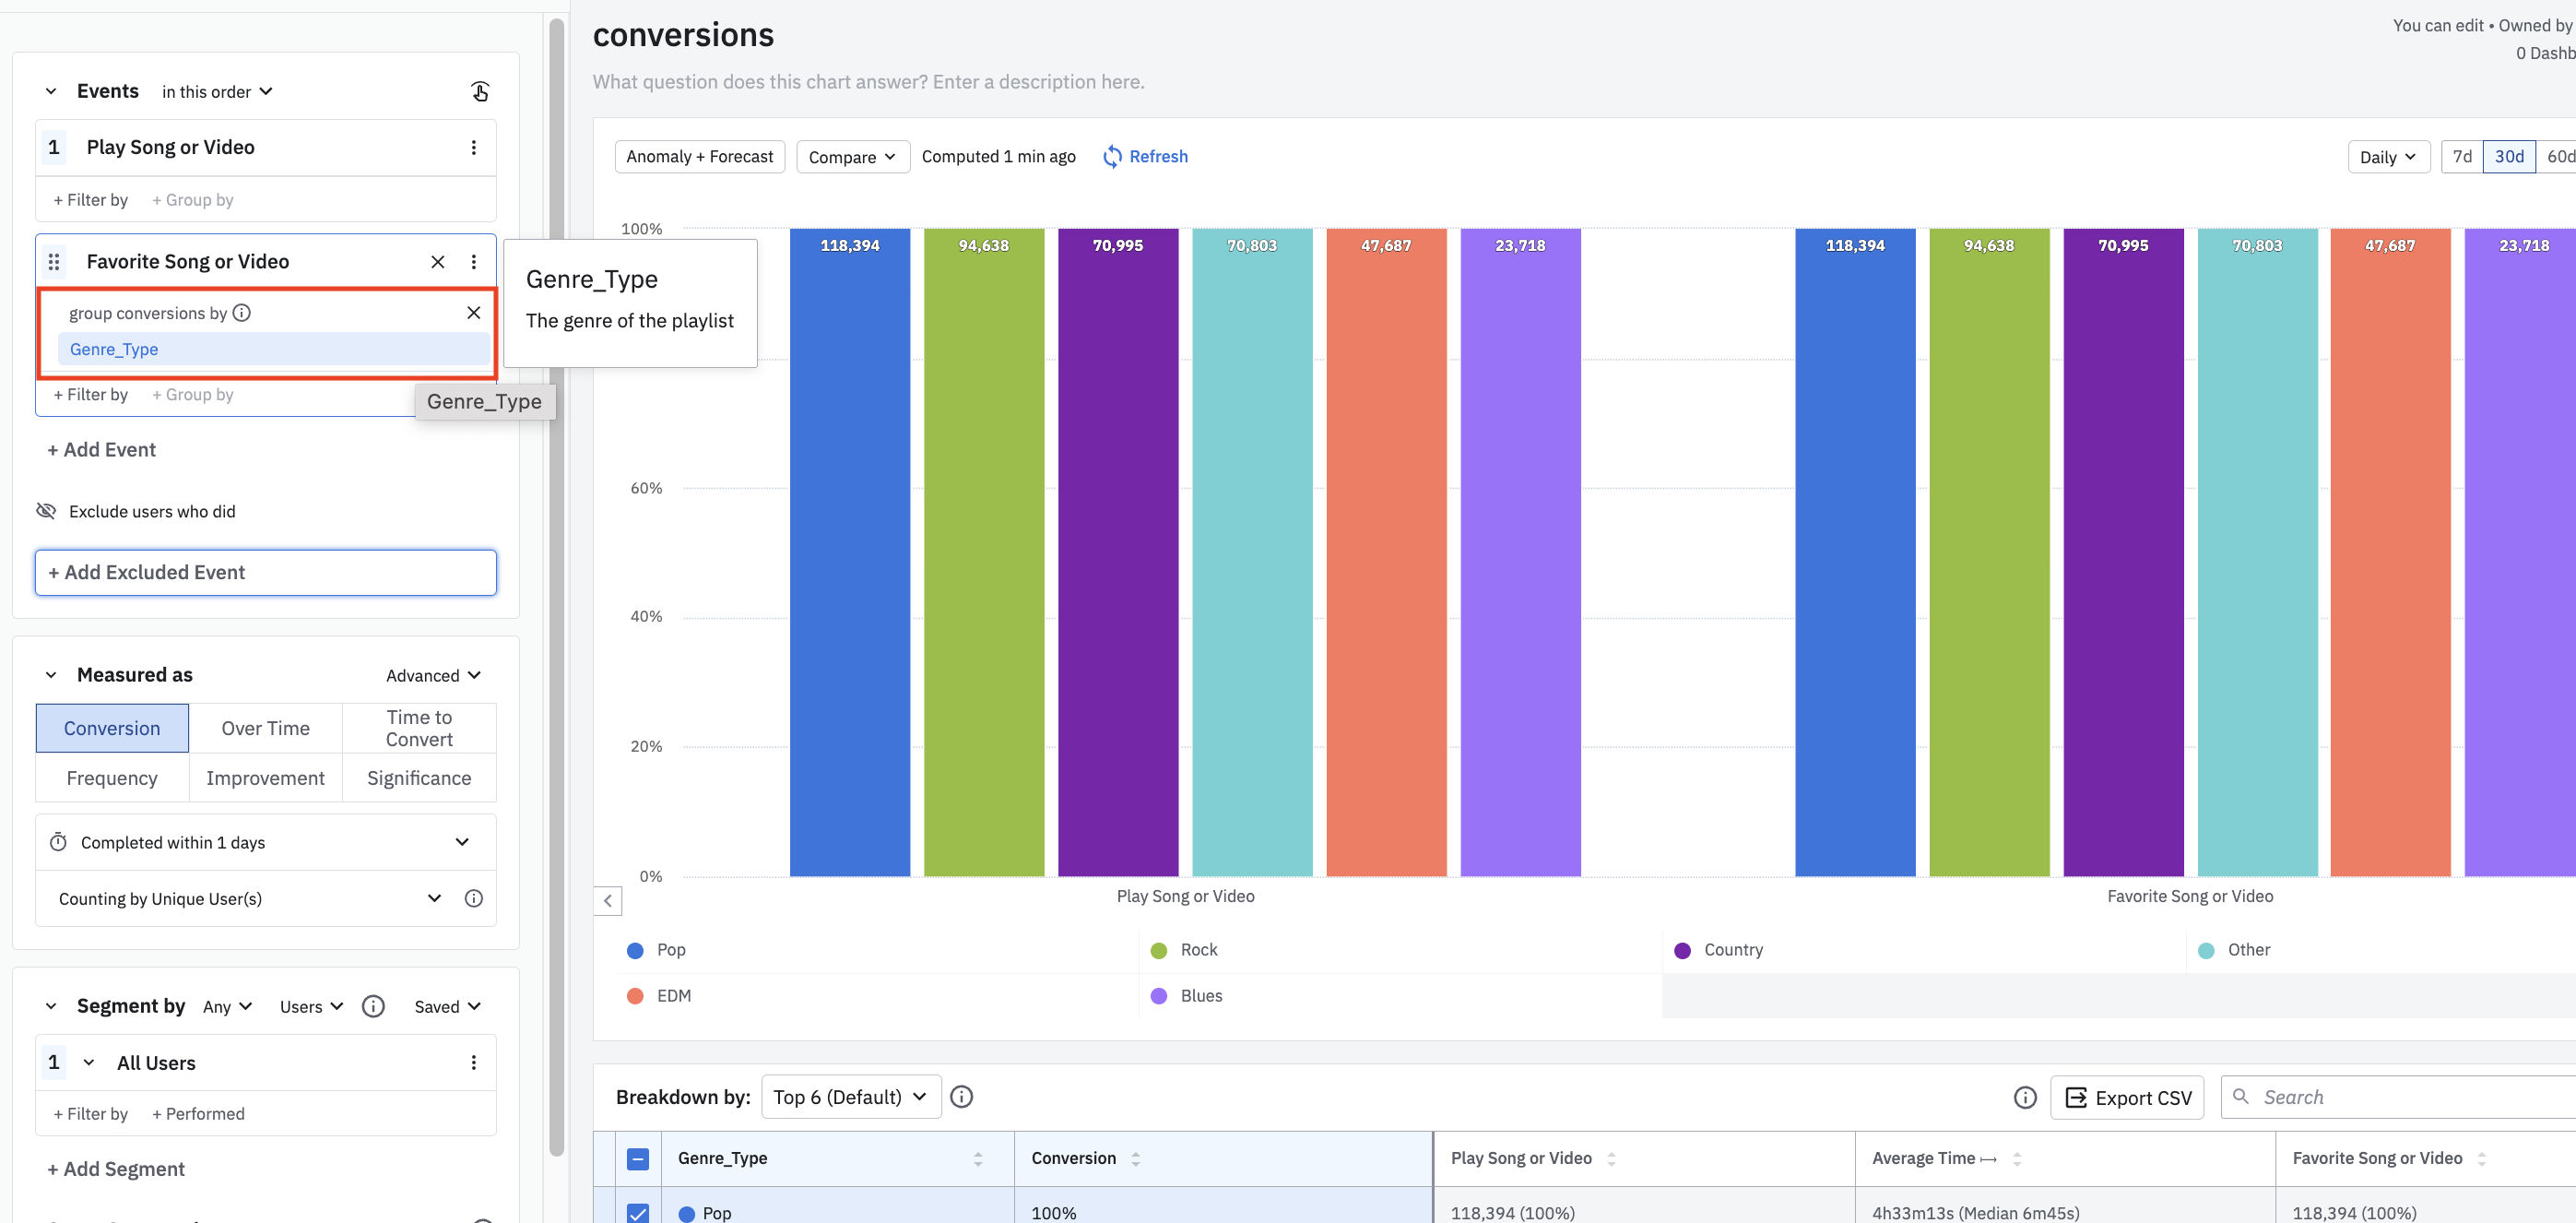
The Group-by here looks at users' property values for Genre_Type at the time their Favorite Song or Video events trigger, and shows how they converted through the remaining events of the funnel.
For example, a user that has a Pop property value for Genre_Type at the time their Favorite Song or Video event triggered shows up under the Pop property bar for the Play Song or Video event as well.
If users in your funnel can complete the steps multiple times, this method takes the first occurrence of each event and buckets the user for the value on that event.
This three-step funnel groups by Step 2's event property, item_id:
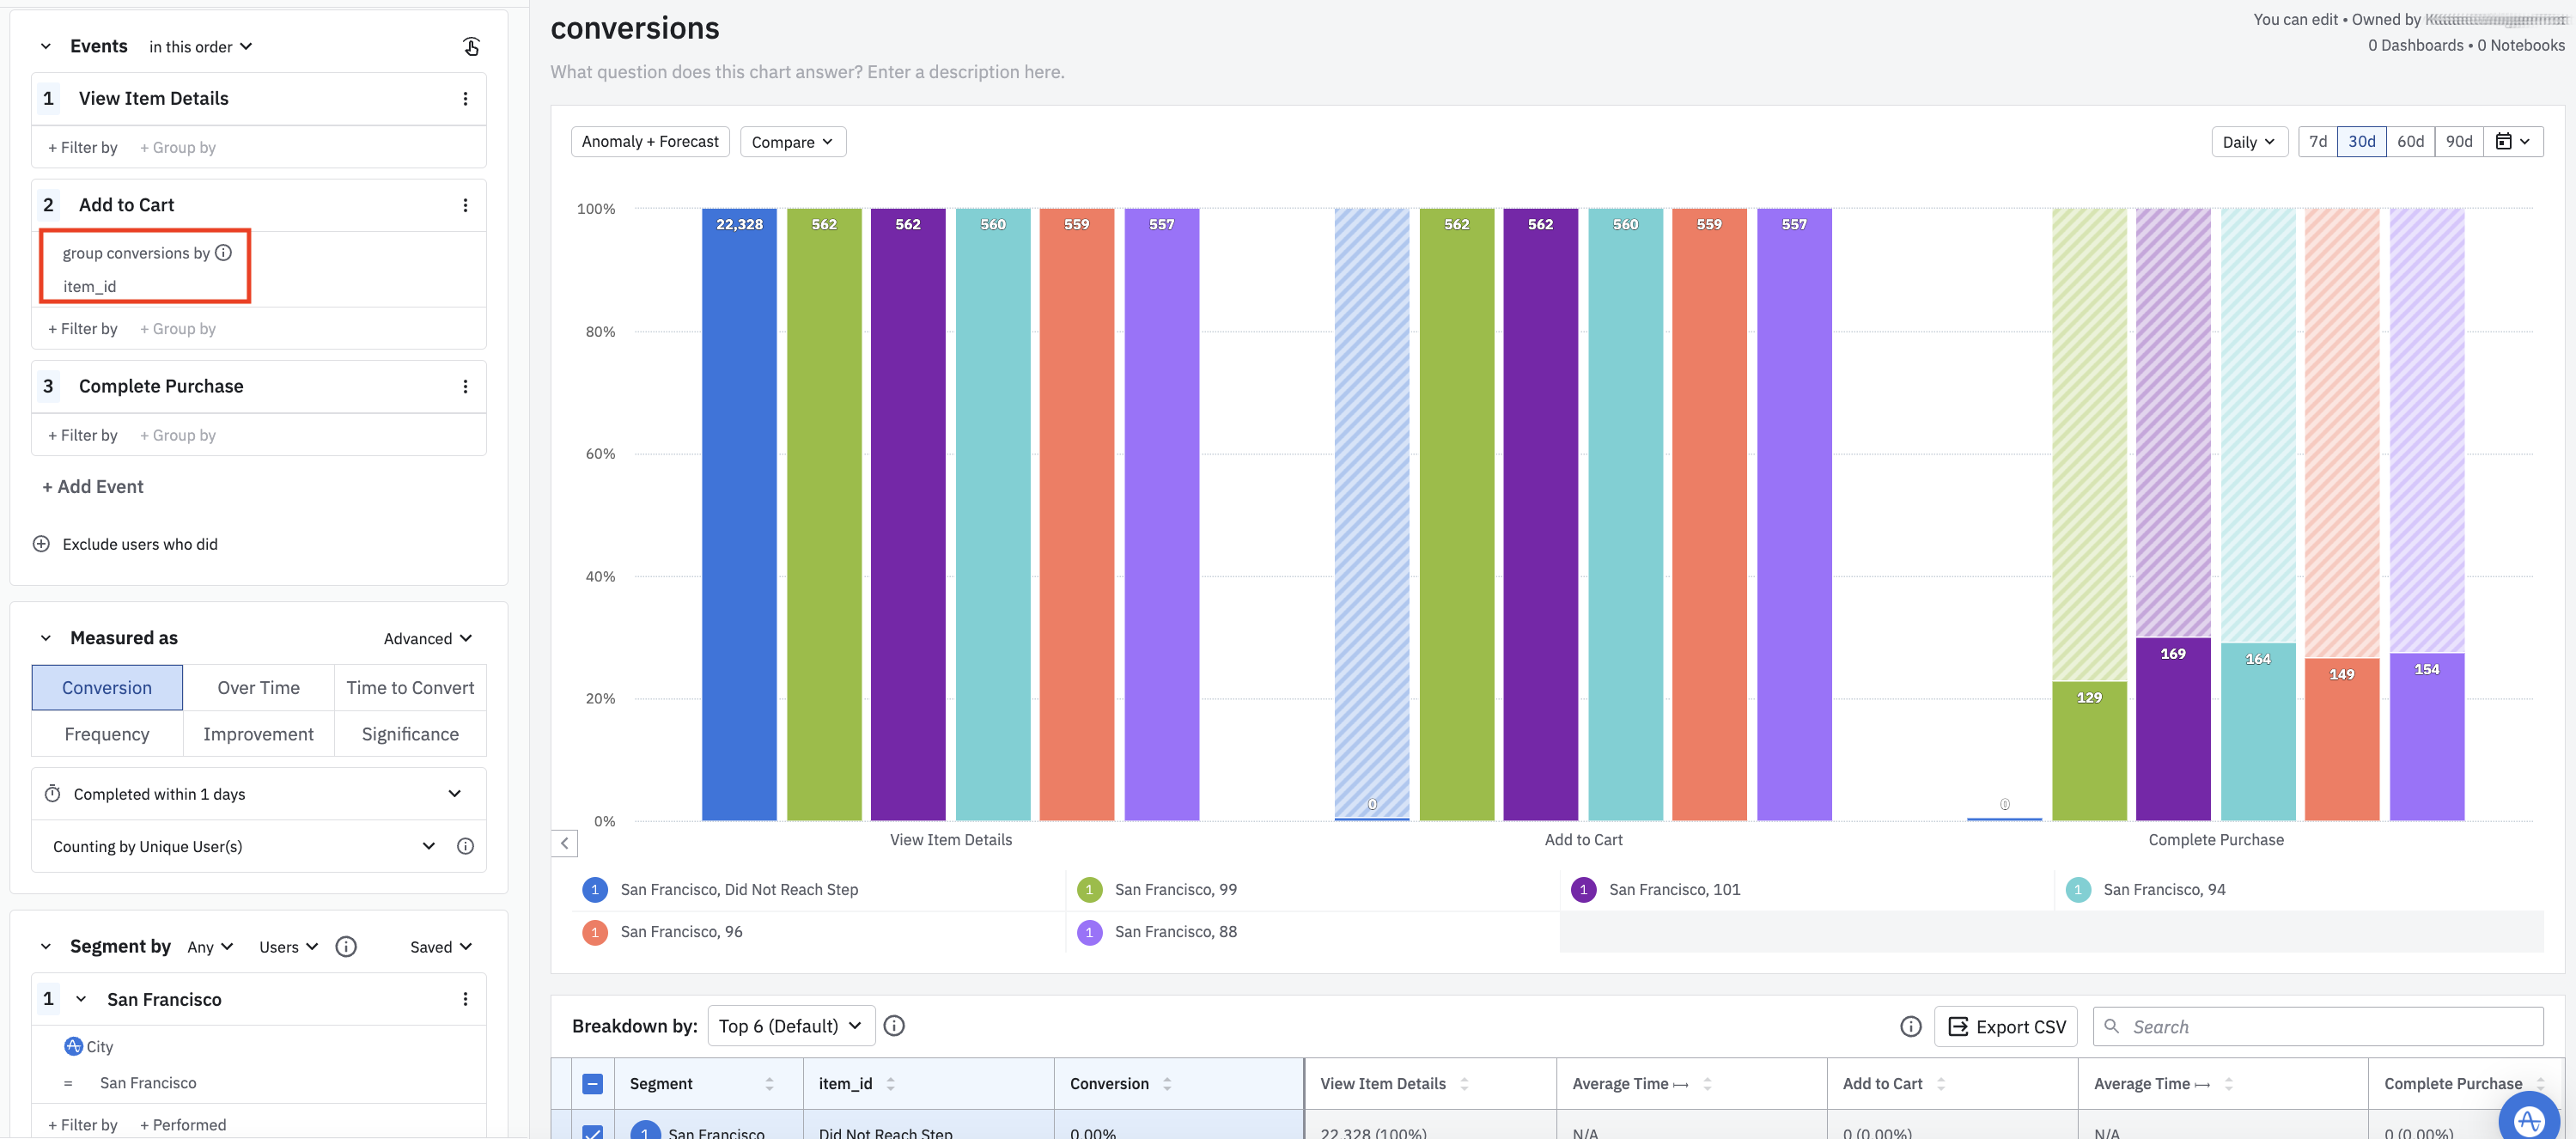
The graph shows the conversion distribution of users who triggered the Step 2 (Add to Cart) event, broken out by each item_id value.
If you choose to group by a step other than the first, Amplitude shows a segment of users who didn't reach that segmented step (the blue-shaded segment for did not reach step in this example).
Was this helpful?