Engagement Matrix: see how users feel about your product
This article helps you:
Assess the overall level of engagement of features in your product
Set up an Engagement Matrix chart and choose the right metrics for your analysis
AMPLITUDE ACADEMY
Identify Your Most Popular Features with Engagement Matrix
Get a high-level view of how users engage with key actions in your product.
Learn Engagement MatrixWith Amplitude's Engagement Matrix chart, you can develop a better understanding of the high-level pattern of feature engagement in your product, by breadth and frequency. By breaking out the top and bottom events for engagement into a four-quadrant matrix view, the Engagement Matrix will enable you to identify features that aren't performing well, so you can either refactor or deprecate them, and the features that are performing best, so you can find ways to extend that engagement to other areas of your product.

Before you begin
First and foremost, events will not appear in any Amplitude charts until instrumentation is complete, so make sure you've got that done. You'll definitely want to read our article on building charts in Amplitude.
Set up an Engagement Matrix chart
The Engagement Matrix can be used to compare up to 100 events based on breadth and frequency of usage. Breadth is based on adoption metrics, such as % Monthly Active Users who have performed a particular event, while Frequency is based on the number of times or days an event has been performed.
Build your chart
To build an Engagement Matrix, follow these steps:
-
In the Events Module, choose the events you'd like to include in your chart. You can select up to 20 individual event types; however, many Amplitude users find more exploratory value in using one of the default, out-of-the-box options:
- [Amplitude] Top Events: Shows the top 50 active events (by event totals) in your project
- [Amplitude] Bottom Events: Shows the lowest 50 active events (by event totals) in your project
- [Amplitude] Top and Bottom Events: Shows the combined top 50 and lowest 50 active events (by event totals) in your project, giving you a matrix view comparing frequent and infrequent feature usage
-
If you've selected your events individually, you can add properties to them by clicking + Filter by, selecting the property name, and specifying the property value you’re interested in. You can also break out your results by property values, by clicking + Group-by and selecting the properties and values you're interested in. These options are not available for any of the default Amplitude event groups.
-
In the Segment By Module, identify the user segment you want to include in this analysis. You can import a previously-saved segment by clicking Saved and selecting the one you want from the list. Otherwise, Amplitude begins from the assumption that your analysis will target all users.
Note
-
If you do not want to import a previously-saved user segment, you can start building your own by adding properties. To do so, click + Filter by, choose the property you want to include, and specify the property value you’re interested in.
-
You can narrow your focus even further by telling Amplitude you only want to include users who have already performed certain actions. To do so, click + Performed, then choose the event you’re interested in.
Note
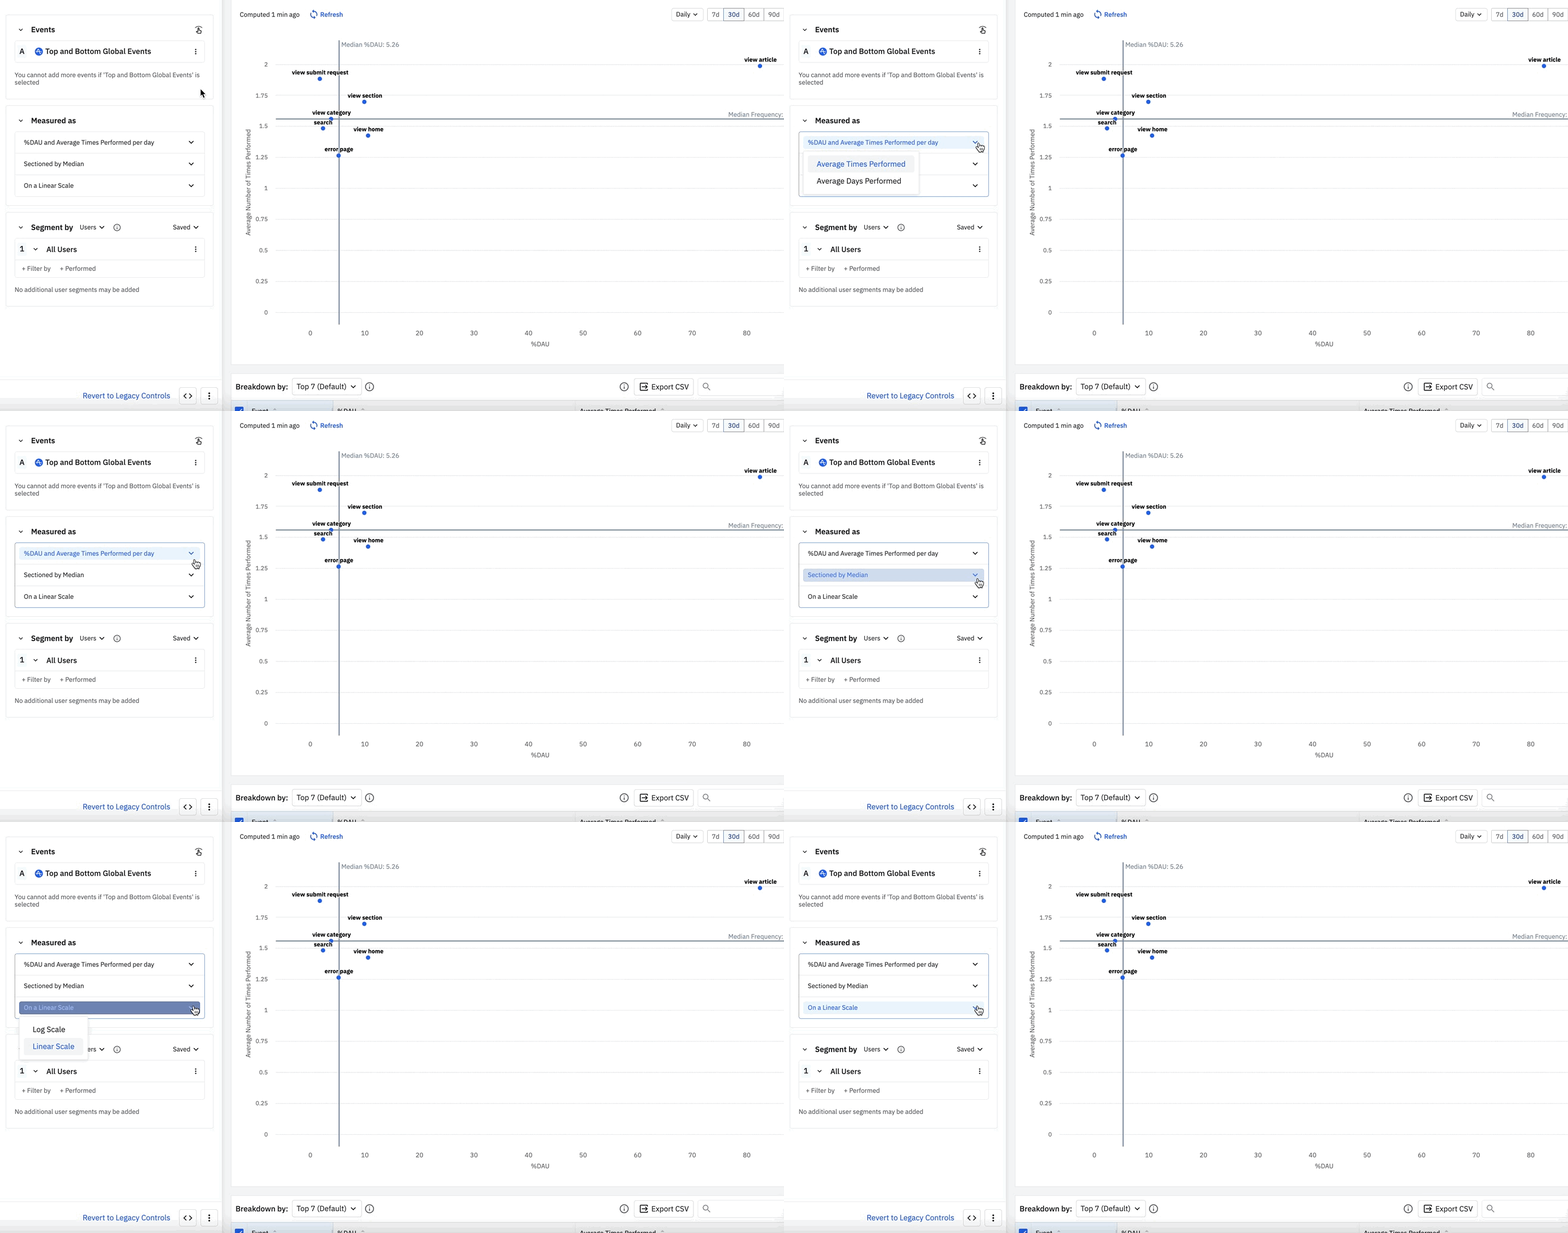
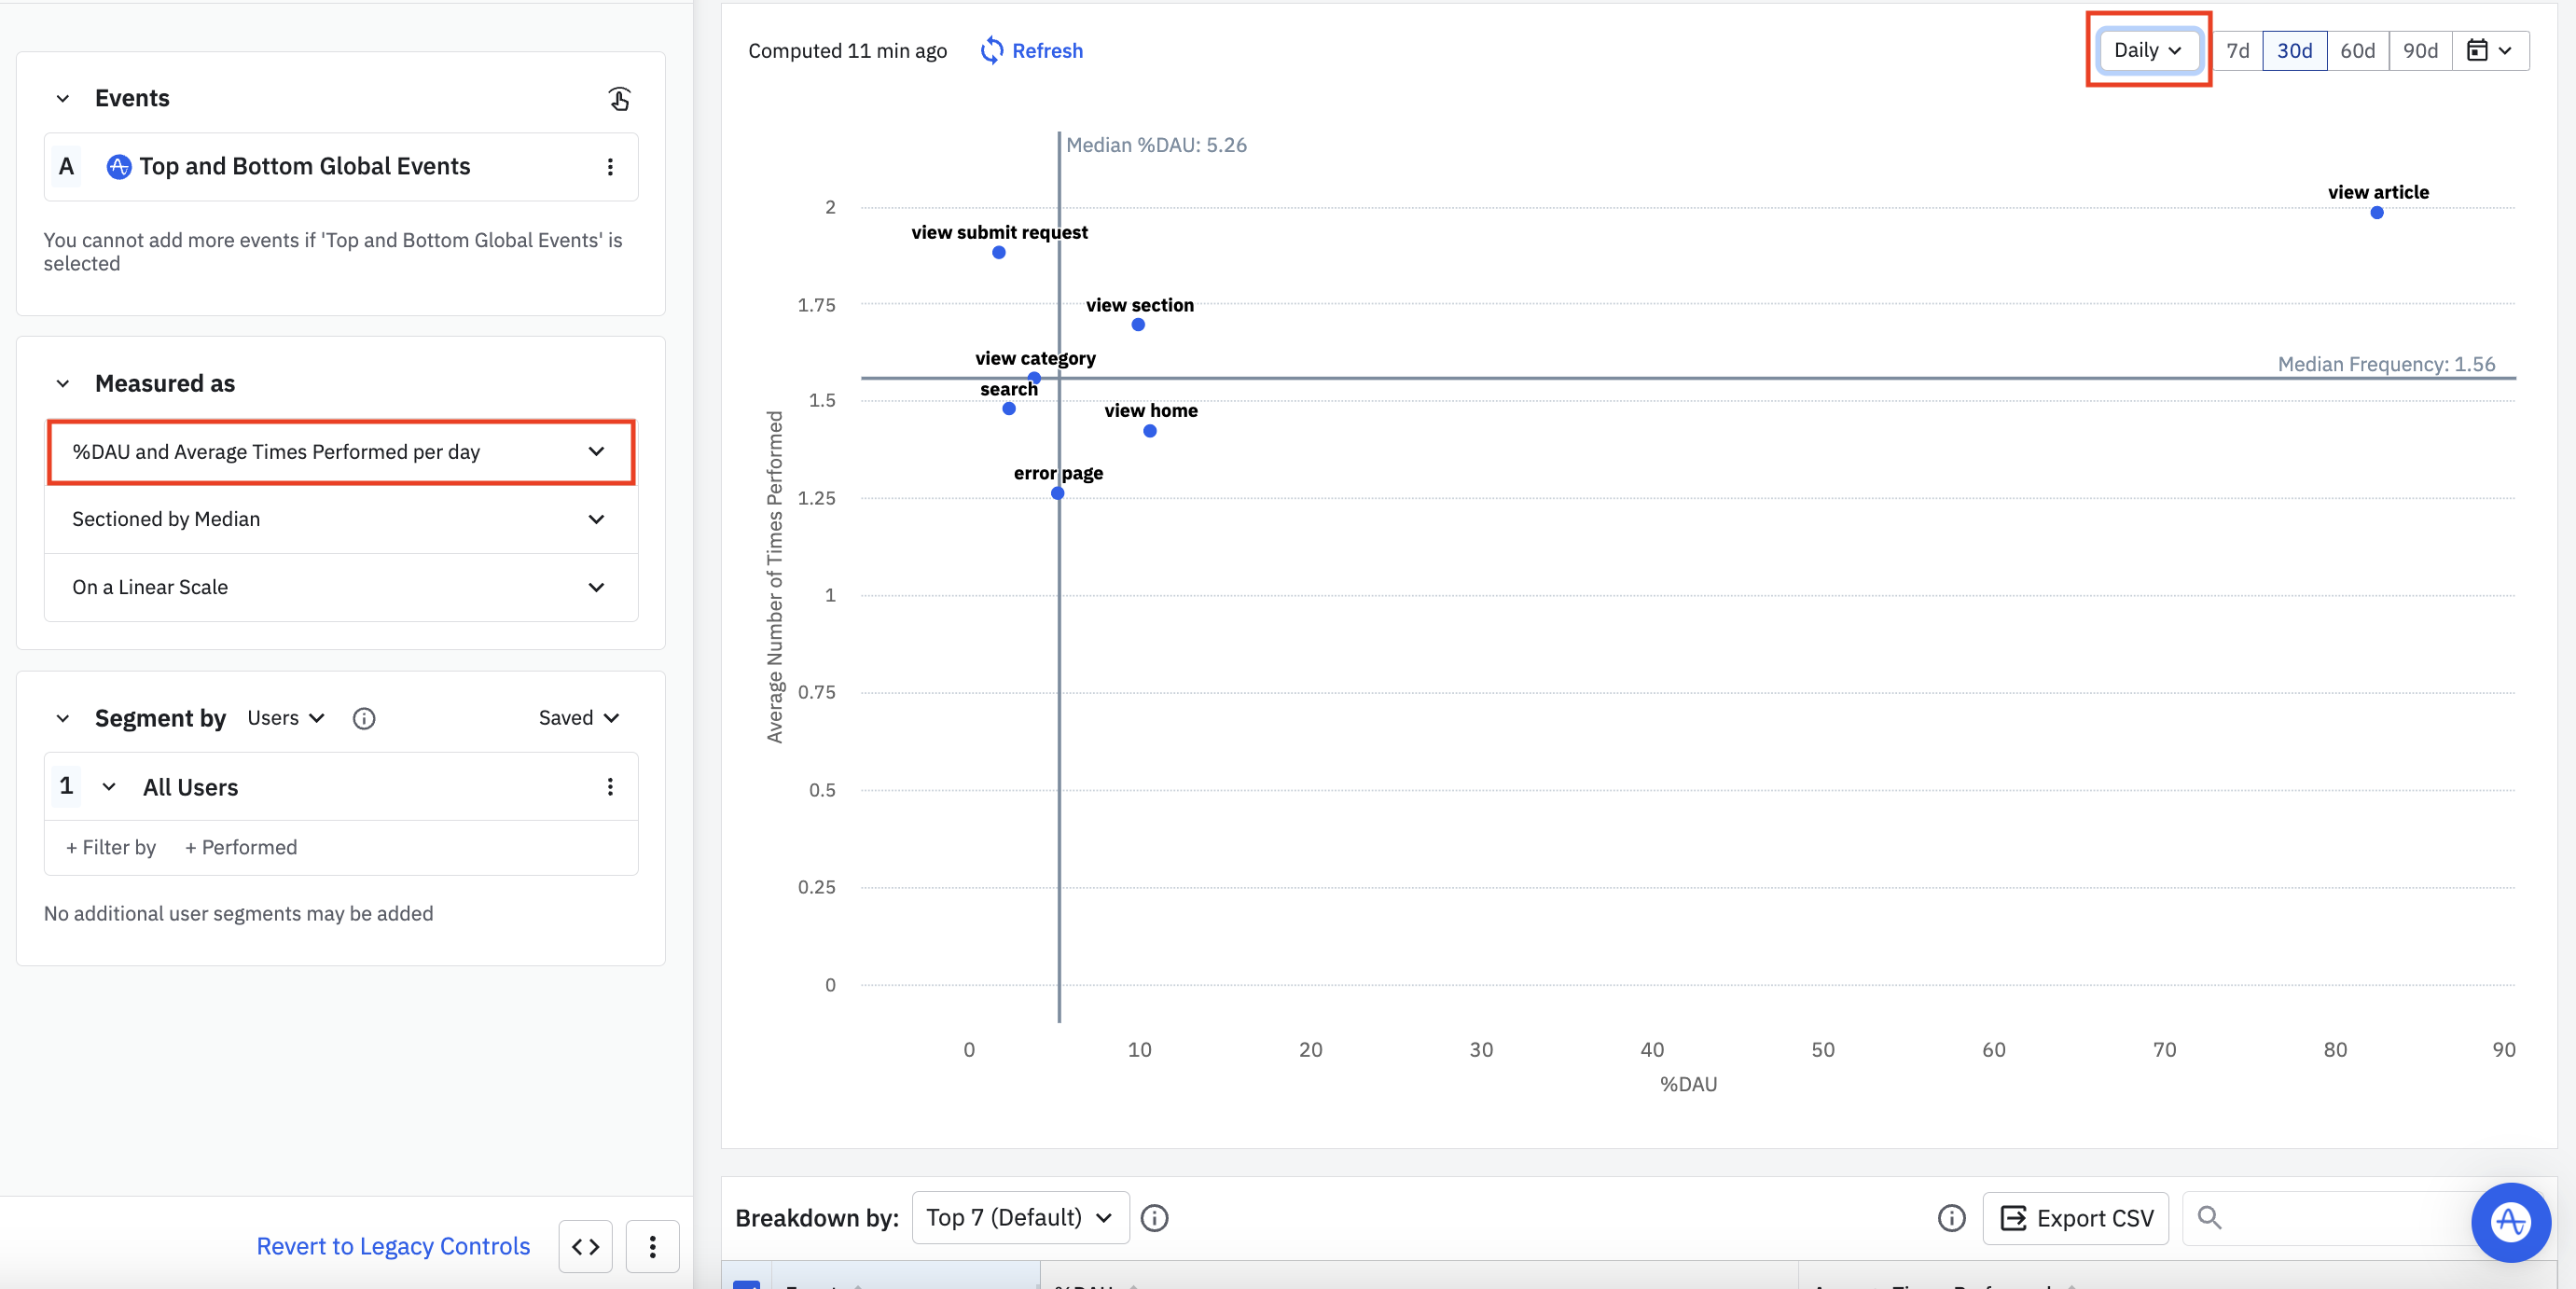
- In the Measured As Module, set the metrics you'll use from the drop-down menus (described below).
- Finally, use the date picker in the chart area to set the timezone, interval, and timeframe of your analysis.
Choose your metrics

In the Measured As Module, you'll find a range of options to customize your Engagement Matrix analysis:
- % of active users and Average Times Performed per day: First, decide whether you'd like to view your results by %DAU (percentage of your daily active users), %WAU (percentage of your weekly active users), or %MAU (percentage of your monthly active users).
To change this option, you'll have to change your interval to match—for example, if your interval is set to "Monthly," you'll only be able to see your monthly active users.
Note

Next, you can choose between Average Days Performed or Average Times Performed:
-
Average Days Performed will display on the Y axis the average number of days an event was fired per unit of your interval (i.e., day, week, or month). Keep in mind that if your interval is set to "Daily," you may see events clustered at the very top of the Y-axis.
-
Average Times Performed will display on the Y axis the average number of times an event was fired per interval unit. It is computed within the product as “number of times performed within a time unit of users that performed at least one event in the time unit”. So a value computed for each time unit then averaged for each time unit that had users - you can think of it as average of the averages.
-
Sectioned by: This option determines how the quadrants of the Engagement Matrix are defined.
If you select Median, the vertical line shows the median percentage of daily, weekly, or monthly active users (depending on your interval) that fired each event during the timeframe of your analysis. The horizontal line will show you the median frequency with which each event was fired, and it is calculated by taking the median of all the individual frequencies of each event.
If you select Average, the vertical line shows the average percentage of daily, weekly, or monthly active users (depending on your interval) that fired each event during the timeframe of your analysis. The horizontal line will show you the average frequency with which each event was fired, and is calculated by taking the average of all the individual frequencies of each event.
Note
Both of these options will stay consistent when switching between a linear and a log scale. -
Log or Linear Scale: Finally, you can specify if you would like to see the chart on a log or a linear scale, depending on which method better suits your Engagement Matrix analysis.
Next, read the Help Center article on interpreting your Engagement Matrix.
October 16th, 2025
Need help? Contact Support
Visit Amplitude.com
Have a look at the Amplitude Blog
Learn more at Amplitude Academy
© 2026 Amplitude, Inc. All rights reserved. Amplitude is a registered trademark of Amplitude, Inc.