How the Retention Analysis chart calculates retention
This article helps you:
Understand the differences between retention types
Understand how Amplitude calculates retention for different cohorts
AMPLITUDE ACADEMY
What is Retention Analysis?
Learn how the Retention chart can help drive product adoption.
Learn Retention AnalysisAmplitude's methods for calculating retention are straightforward. However, you should familiarize yourself with them, and understand the differences that do exist. This helps you develop a nuanced understanding of the Retention Analysis chart.
Return On or After
Return On or After retention is calculated a bit differently depending on if you’re looking at a specific cohort entry date for your segment or overall. Overall retention (for example, All Users) is what’s displayed in the visualization and the first row of the breakdown table below it.
Because Return On or After retention measures users that returned on the Xth day or later, the numerator will include users in all data points prior to when they triggered an event. A user who triggers the event on day two, for example, will also be included in the data point for days one and zero.
Specific cohort entry date
The calculation for a specific cohort entry date is:
{ # of users who triggered return event on X day after cohort entry date,
or any day after X day }

divided by

{# of users who triggered start event on specific cohort entry date
[constant across X days] }
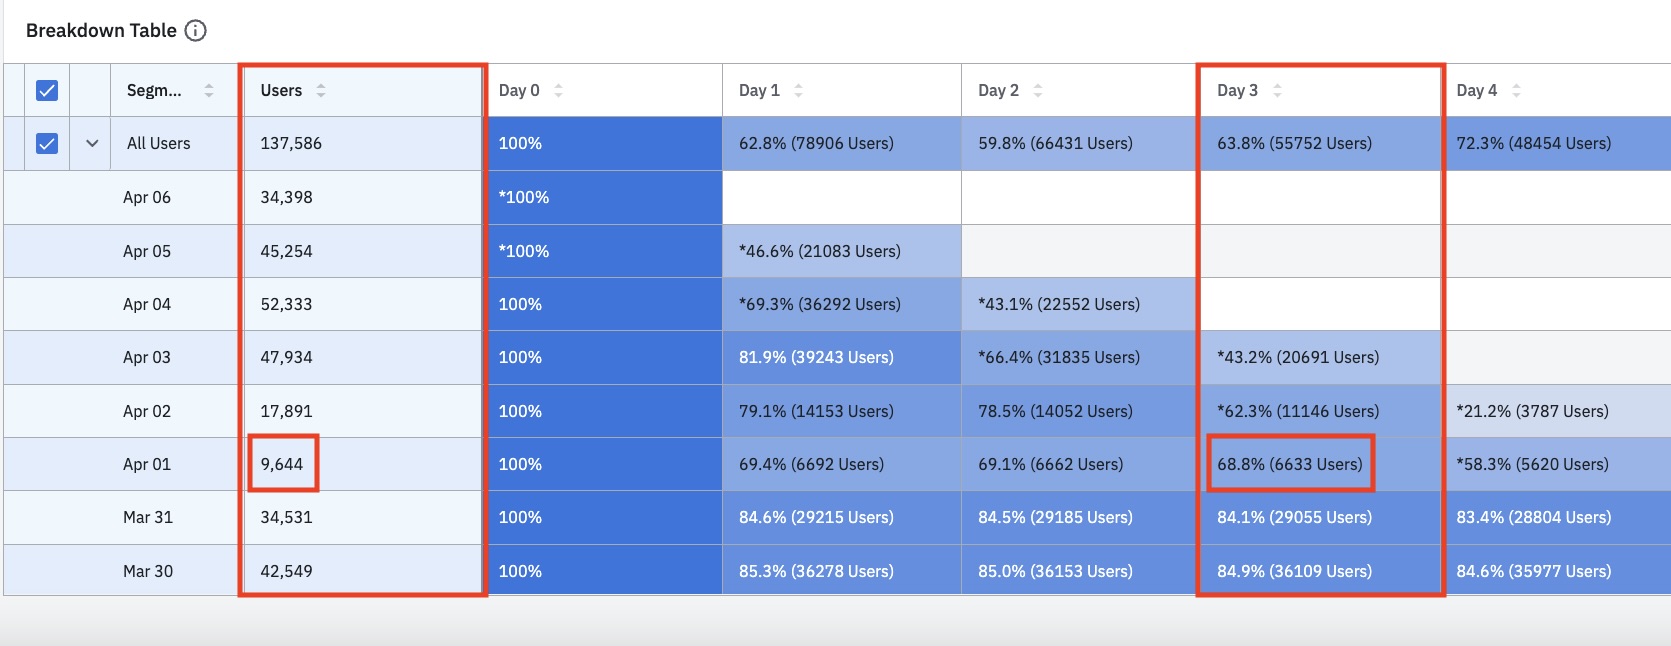
In the table below, Day 3 retention for April 1 shows that 6,633 users triggered the return event on April 4 or later. 9,644 users triggered the start event on April 1. Dividing 6,633 by 9,644 gives us an April 1 Day 3 retention of 68.8%.

The retention percentage for a specific cohort entry date will always decrease over time. This is because while the denominator remains constant, the numerator gradually goes down: the number of people who are 7 day+ retained will be less than the number of people who are 3 day+ retained.
Overall retention
The calculation for overall retention (also known as all users) is:
{ # of users who triggered return event on X day or later after cohort entry date }

divided by

{ # of users who triggered start event on cohort entry dates
that reached the retention interval }
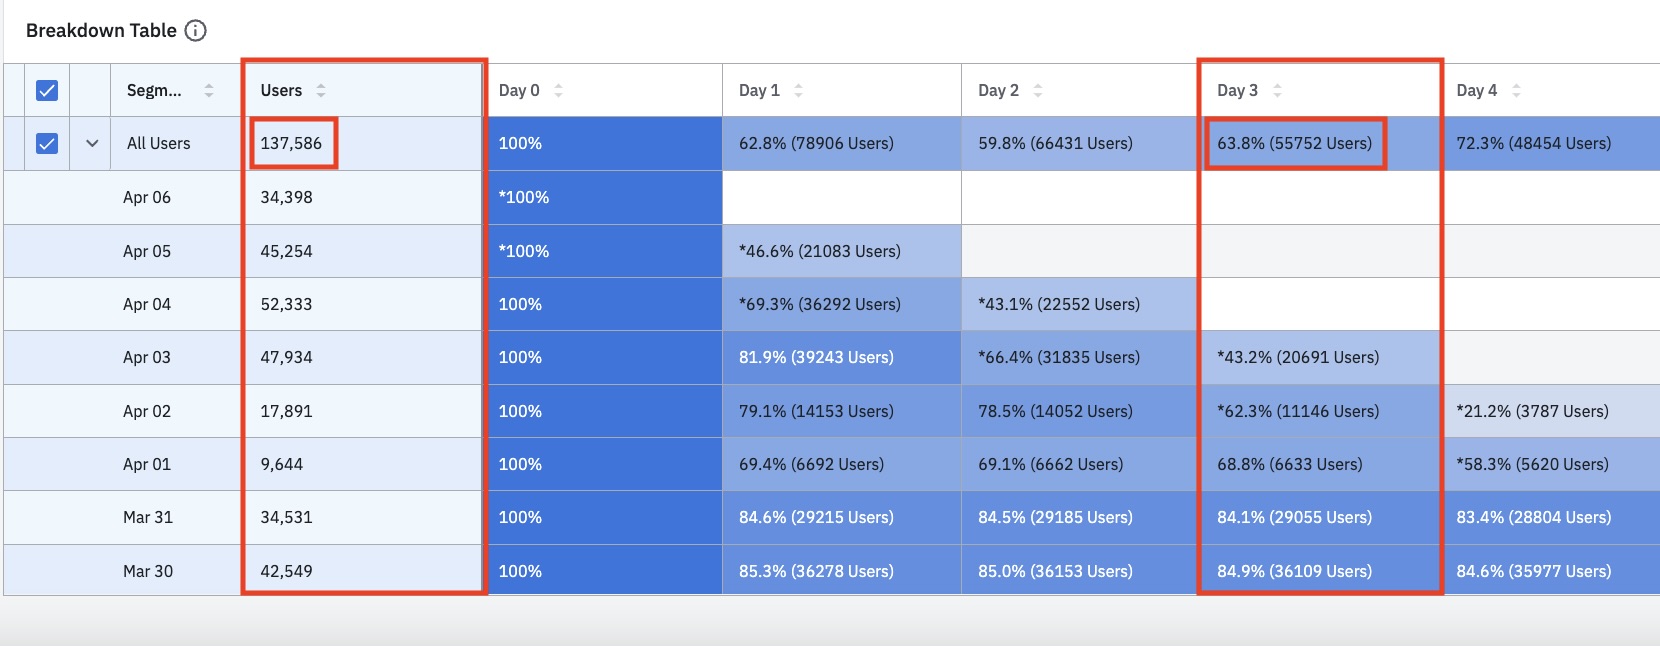
In the table below, the All Users Day 3 retention shows that 55,752 users triggered the return event on Day 3 or later, while 137,586 users triggered the start event between March 30 and April 6. Dividing 55,752 by 137,586 gives us a Day 3 retention of 40%.

In the table, the All Users row contains the daily sums of the date rows below it. Incomplete data are excluded from the All Users totals (incomplete cells are noted with an asterisk).
When the analysis time frame is complete, the graph will curve down as retention decreases over time. This happens because fewer people can be retained for longer periods of time as seen in the numerator (it's harder to retain people for seven days than for three days).
However, when the analysis is still in progress, the graph can curve up and appear to increase over time. This is because users who have not yet reached later retention intervals are excluded from the denominator. This means that not enough data has been collected, and you should give your users more time to trigger your return event. Wait until your analysis time frame is fully completed to get an accurate understanding of your retention trend.
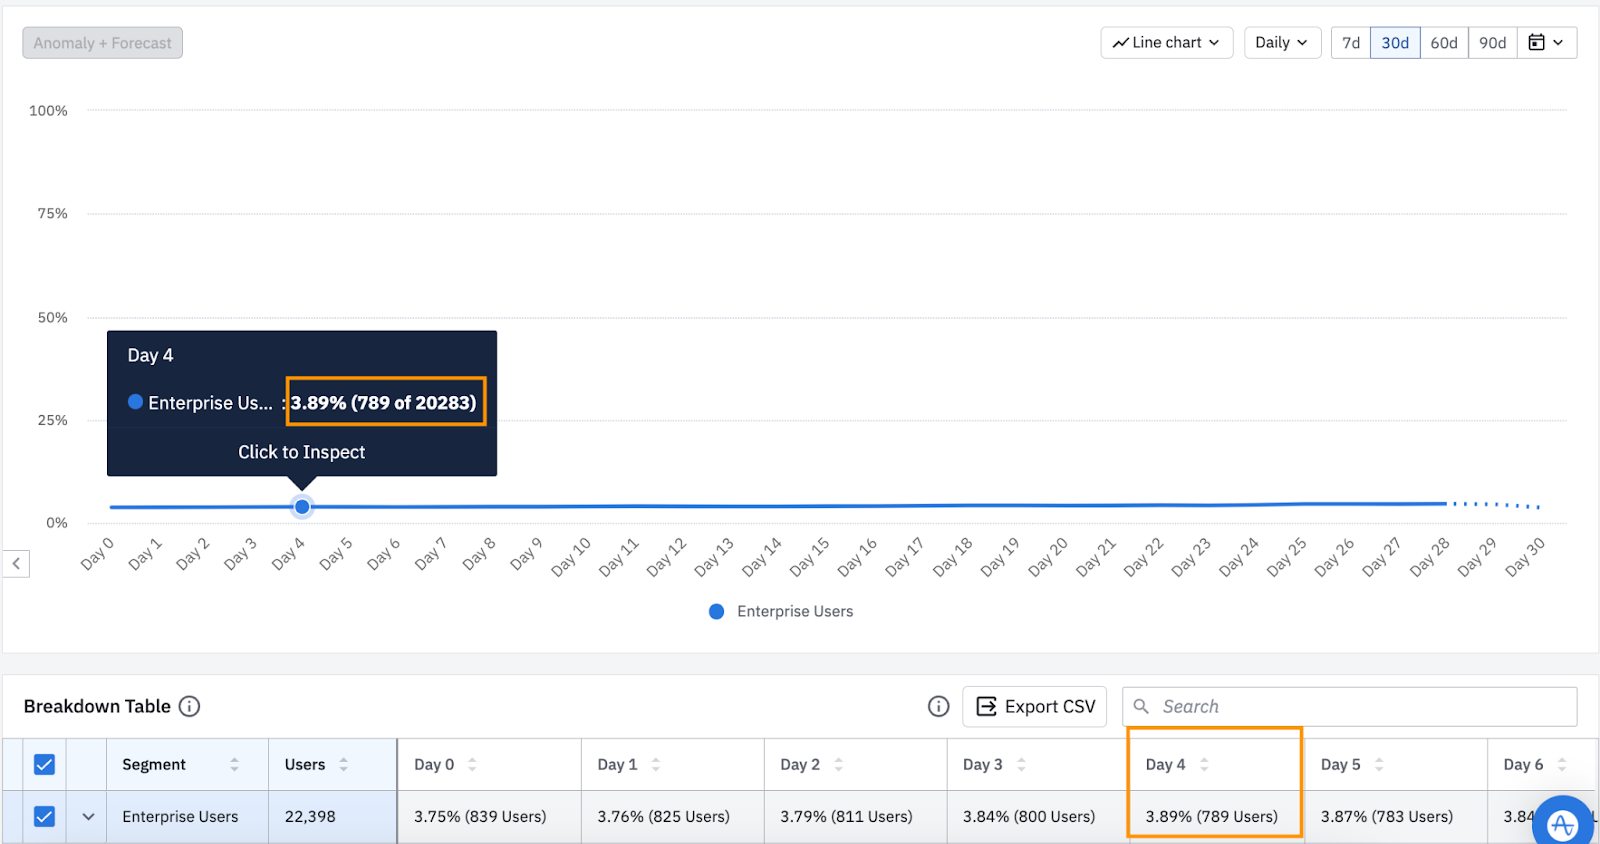
Accordingly, the denominator value in the Microscope for a single day will be the sum of the users who have completed that day’s retention interval. This value is not shown in the breakdown table.

Return On
The calculation for Return On retention is:
{ # of users who triggered return event on exactly X days after cohort entry date }

divided by

{ # of users who triggered start event on specific cohort entry date
[constant across X days] }
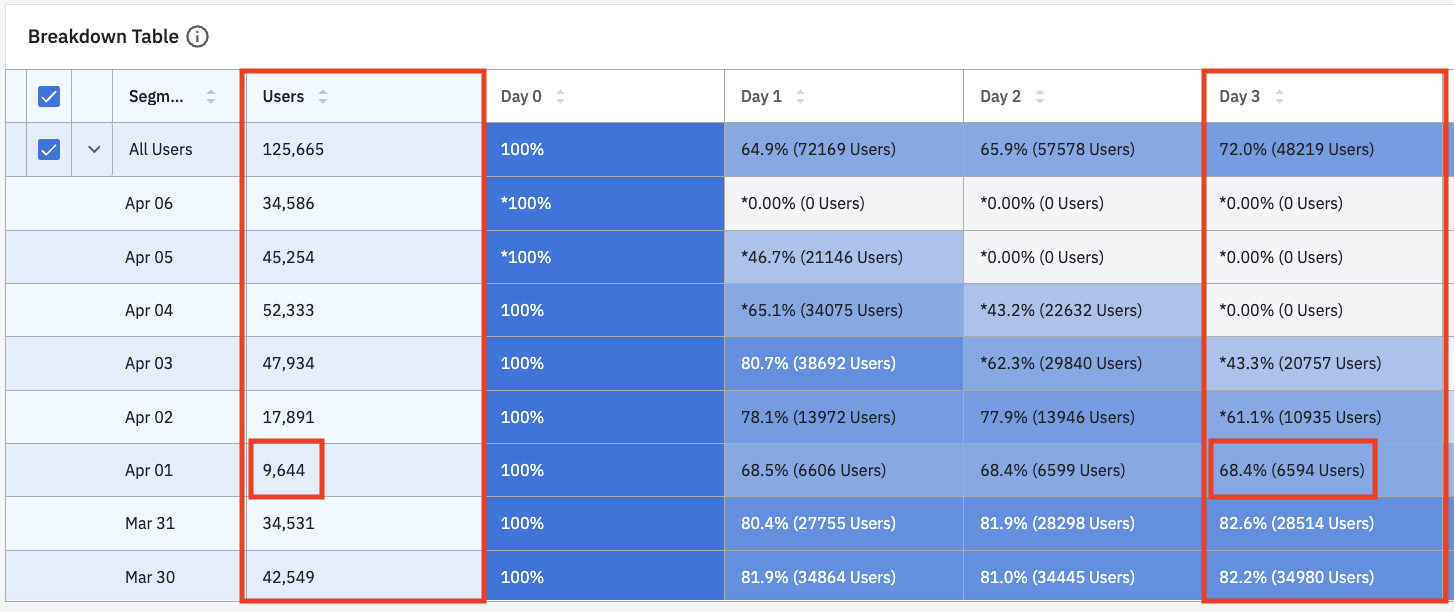
In the table below, Day 3 retention for April 1 shows that 6,594 users triggered the return event on April 4, while 9,644 users triggered the start event on April 1. Dividing 6,594 by 9,644 gives us an April 1 Day 3 retention of 68.4%.

All users' Day 3 retention shows 48,219 users triggered the return event on Day 3, while 125,665 users triggered the start event between March 30 and April 6, giving us a Day 3 retention of 72%.
A user can trigger the return event on multiple days and be counted on each day. This can drive retention percentage up over time, for a specific cohort entry date row or overall row. While the denominator is constant, the number of users that trigger a return event each X days is independent. It’s possible that more users can trigger an event on any day than the prior.
As with Return On or After retention, when the analysis time frame is complete, the denominator value in the Microscope for any day will be consistent with the total number of users for overall retention. When the analysis is still in progress, the denominator value in the Microscope for a single day will be the sum of the users who have completed that day’s retention interval. This value is not shown in the breakdown table.
Note
Additionally, the overall row represents the sum of the cohort entry date rows below it. Similar to Return On or After retention, if data is incomplete (cells noted with an *), they are excluded from the overall row's total (e.g. the sum of each row for Day 3 won't add to the overall Day 3 value).
October 16th, 2025
Need help? Contact Support
Visit Amplitude.com
Have a look at the Amplitude Blog
Learn more at Amplitude Academy
© 2026 Amplitude, Inc. All rights reserved. Amplitude is a registered trademark of Amplitude, Inc.