The Personas chart: Find your product's user personas
This article helps you:
Understand how the Personas chart varies from other Amplitude charts
Build a cluster analysis of your product's users
Amplitude's Personas chart groups your users into clusters based on the similarities of their event behavior. Users who behave the same way will be placed into the same cluster. It's similar to a behavioral cohort, except there's no explicit, pre-specified rule that defines a cluster.
The Personas chart rewards experimentation. With it, you can quickly do exploratory data mining analyses of the ways in which your user base navigates your product. It can help you surface similarities between user cohorts you may not have thought to look for. And it can guide you through the process of creating a comprehensive set of user personas for your product, which you can then use to drive engagement and retention.
Before you begin
First and foremost, events will not appear in any Amplitude charts until instrumentation is complete, so make sure you've got that done. You'll definitely want to read our article on building charts in Amplitude.
Personas differs from other Amplitude charts
If you're already familiar with Amplitude, the first thing you'll notice about the Personas chart is that it doesn't work the same way other Amplitude charts work: There's no Event Module and no Segmentation Module. There's also no Measured As Module, because the Personas chart doesn't rely on metrics the way other Amplitude charts do.

Instead, there is the Cluster Generation Module, the Cluster Count Module, and the Target Cohort Module.
Note
Set up a Personas chart
To build a Personas chart, follow these steps:
-
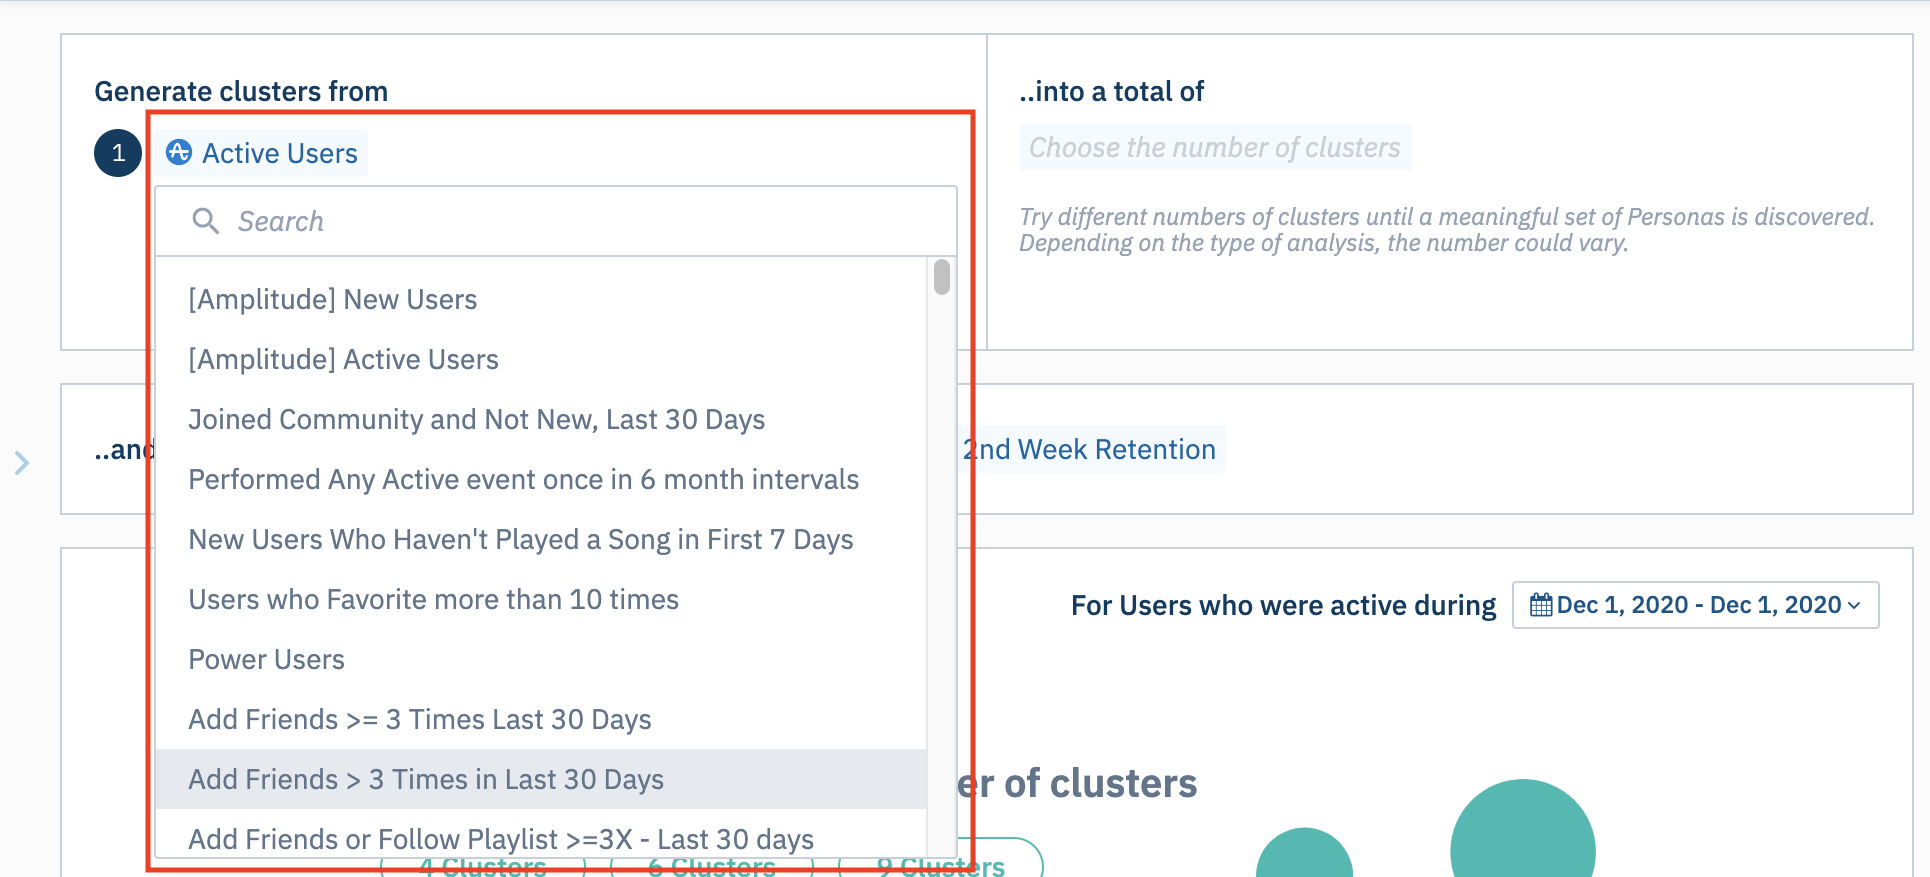
In the Cluster Generation Module, choose the user cohort you're interested in from the Generate clusters from dropdown.

Amplitude populates this dropdown list with the user cohorts you've already created. If you have not previously created any user cohorts, you will only be able to choose Active Users or New Users.
When analyzing new users, Amplitude will only consider events triggered during their first day as a new user.
-
You can limit your analysis to a segment of this cohort by filtering users based on user properties. To do so, click + where, choose the property you want to use as a filter, and specify the property value you’re interested in.
-
You can narrow your focus even further by telling Amplitude you only want to include users who have already performed certain actions. To do so, click + perform, then choose the event you’re interested in.
-
In the Cluster Count Module, choose the number of clusters you want to see from the ...into a total of dropdown.
Note
Each analysis is different, and there's no one-size-fits-all answer for how many clusters you should select. If you use too few clusters, you might find there are not enough differences between them to generate meaningful insights. If you select too many, you might find that Amplitude creates some number of invalid or spurious clusters, simply because it's unable to find 15 distinct user personas. In every analysis, you should try different cluster counts until you get a result that intuitively seems useful to you. -
In the Target Cohort Module, choose your target cohort from the dropdown. Here too, Amplitude draws from the list of cohorts you've already created. You can also select from a handful of pre-set, out-of-the-box cohorts:
- [Amplitude] 2nd Week Retention
- [Amplitude] 3rd Week Retention
- [Amplitude] 4th Week Retention
- [Amplitude] 2nd Month Retention
The definitions of these cohorts depend on whether you're looking at new users or active users (including cohorts you've created yourself). For new users, they'll be included in these cohorts if they were new during the time frame of your analysis, and if they triggered an active event in the week (or month) listed after they were new.
Active users will be included in these cohorts if they triggered an active event during the time frame of the analysis, and then another one in the specified week (or month) following that initial event.
-
Use the date picker to specify the timezone and set the timeframe for your analysis. Your analysis can span a maximum of 30 days.
Read on to learn how to interpret your Personas chart.
May 30th, 2024
Need help? Contact Support
Visit Amplitude.com
Have a look at the Amplitude Blog
Learn more at Amplitude Academy
© 2026 Amplitude, Inc. All rights reserved. Amplitude is a registered trademark of Amplitude, Inc.