Choose the right measurement
This article helps you:
Choose the most appropriate way to measure and display the results of your event segmentation analysis
AMPLITUDE ACADEMY
Understand User Behavior with the Event Segmentation Chart
Use Amplitude's Event Segmentation chart to learn what drives user behavior.
Learn Event SegmentationAmplitude offers you several different ways of looking at your event segmentation results. In this section, learn the differences between them.

Uniques
The default measure for the Event Segmentation chart, it displays the total count of unique users in your segment who triggered the event you added in the Events Module. View the exact count by simply hovering over the specific data point you’re interested in. If you want to inspect the users who make up that data point, click it to activate Microscope.
Event Totals
Like Uniques, Event Totals is a straightforward, count-based measure. The difference is that instead of counting unique users, it graphs the total count of times a specific event was fired at each data point.
Counting events and counting items
When you group by a cart property (an array property), Amplitude offers you an explicit choice between two counting methods:
- Counting Events: Counts unique events by deduplicating array property values. If a single event contains multiple items with the same property value, it counts as one event.
- Counting Items: Counts each item within the array property without deduplication. If a single event contains multiple items, each item counts toward the total.
For example, imagine a Checkout event with the cart property item_list.product_category. If a single Checkout event contains two tacos (one Crunchy Taco and one Soft Taco) under the same product category "tacos":
- Counting Events counts 1 Checkout event
- Counting Items counts 2 Checkout items
The default behavior remains "Counting Items" (item count). This option appears when you group by a cart property in the Event Totals measurement.
Active %
This measure graphs the percentage of all active users (defined as users who have triggered any active event in a specified time frame) who triggered a specific event at each data point.
Average
The Average measure shows how many times, on average, each user who triggered the event did so.
For any data point, Amplitude calculates this by taking the total number of times the event was triggered ÷ Number of users who triggered the event.
Note
Counting events vs. counting items
When you group by a cart property (an array property), Amplitude offers you an explicit choice between two counting methods for calculating the average:
- Counting Events: Calculates the average based on unique events by deduplicating array property values
- Counting Items: Calculates the average based on each item within the array property without deduplication
This option appears when you group by a cart property in the Average measurement. The default behavior remains "Counting Items" (item count).
Example
- User 1 triggers Event A 1 time
- User 2 triggers Event A 2 times
- User 3 triggers Event A 0 times (excluded from average)
$$ \text{Average} = \frac{1+2}{2 \text{ users}} = 1.5 $$
Frequency
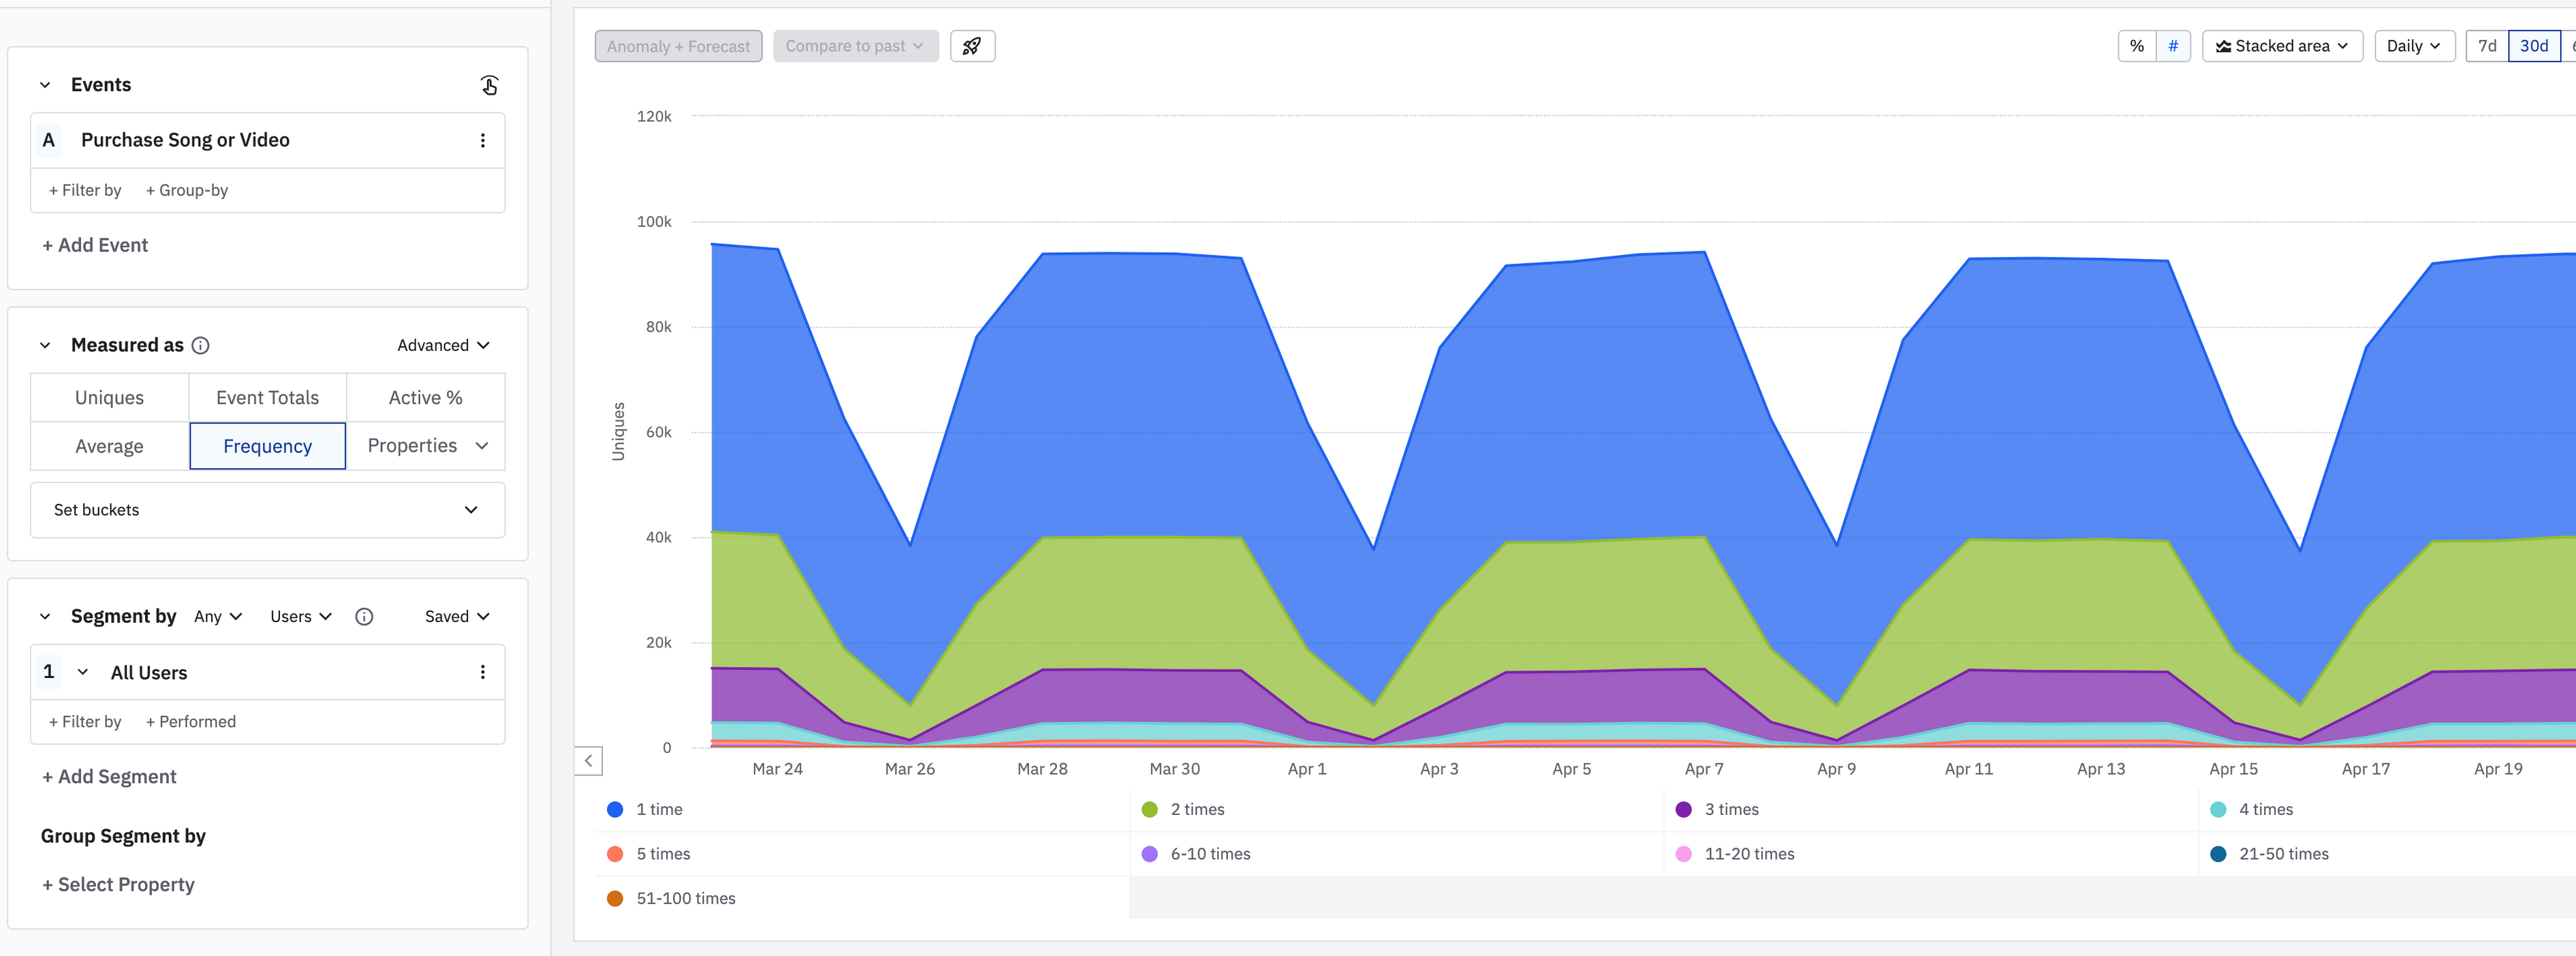
When you apply the Frequency measure, Amplitude groups the users included in your user segment into buckets defined by the number of times each has triggered an event during the time frame of your analysis.

This shows an event segmentation analysis using the Frequency measure. Each stacked area represents a "frequency bucket." For each data point, Amplitude displays the number of users contained in that bucket. As described above, if you want to learn more about the users in a particular data point, click on it.
In the screenshot above, the default buckets are represented by the colored dots. Click customize buckets to adjust the sizing of the buckets and distribution of the data, or use the Custom Buckets modal to set individual ranges for each bucket.
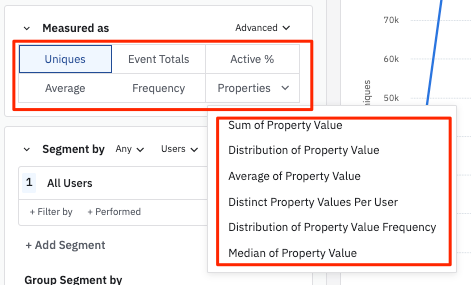
Properties
Depending on the details of your analysis, you may also be able to generate an event segmentation chart based on the values of your event or user properties.
- Sum of Property Value: Graphs the sum of property values at each data point. To use this measure, the property value must be an integer.
- Distribution of Property Value: Shows the distribution of event totals broken out by the values of the selected event property. The minimum value is inclusive, and the maximum value is exclusive.
- Average of Property Value: Graphs the average of the property values, or the sum of those values divided by the total number of events fired at each data point. To use this measure, the property value must be an integer.
- Distinct Property Values per User: Graphs the average count of different property values triggered by each user. More specifically, it's the total sum of unique user-distinct property value pairs, divided by the number of users.
- Median Property Value: Graphs the median property values for each data point. This is most useful in situations where averages might be noticeably skewed by outliers. To use this measure, the property value must be an integer.
Formula
In an Event Segmentation chart, you can write formulas for Amplitude to apply to the events you include in your analysis. To read more about each formula and view examples of use cases, review Custom Formulas.
To learn how to interpret your Event Segmentation chart, review Interpret your Event Segmentation chart.
October 16th, 2025
Need help? Contact Support
Visit Amplitude.com
Have a look at the Amplitude Blog
Learn more at Amplitude Academy
© 2026 Amplitude, Inc. All rights reserved. Amplitude is a registered trademark of Amplitude, Inc.