Attribute credit to multiple acquisition touch points
This article helps you:
Understand how specific touch points are contributing to your marketing outcomes
AMPLITUDE ACADEMY
Analyze Multiple Metrics at Once with Data Tables
Learn how to do multi-dimensional analysis with Data Tables.
Learn Data TablesIt can be challenging to attribute success of marketing activities without being able to clearly pinpoint which activities led your users to the wanted outcome. For example, let's say a user visited your website after exposure to a Google ad, then interacting with a Facebook post, and finally watching a TikTok video. There are many ways you can attribute credit to one or more of the activities that led to the user's visit to your website. Attributing success to various property values, often referred to as multi-touch attribution, can provide more context for and drive the future of your marketing plans.
Restrictions
- Starter and Plus plan users can create a single channel view.
Pre-built attribution models
Amplitude includes common, pre-built attribution models that you can configure on your metric.
Note
Overall row).
For example, the Last Touch model attributes 100% of the credit to a single property value—the last one. For this reason, it makes sense to expect the resulting attribution group totals to sum to 100%. But the Participation model attributes 100% credit to multiple property values. As a result, you should expect the resulting attribution group totals to sum to more than 100%.
Also, when measuring unique users, none of these models generate attribution group totals that sum to the count in the Overall row. This is because each unique user can appear in multiple attribution groups. Users may be attributed to multiple channels. This is because attribution applies to events, not unique users. A unique user may perform events attributed to both channel X and channel Y. In this situation, the user appears in rows for both X and Y and there is a potential to double-count the user in summing of the rows.
-
First Touch: Gives all credit for the selected metric to the first property value within the selected lookback window relative to the date the metric occurred. If using the event totals attribute, sums to 100%.
-
Last Touch: Gives all credit for the selected metric to the last property value within the selected lookback window relative to the date the metric occurred. If using the event totals attribute, sums to 100%.
-
Linear: Credit for the selected metric is equally distributed for all property values within the selected lookback window relative to the date the metric occurred. For example, with two properties each would receive 50% credit, and with three properties each would receive 33.3%.
-
Participation: Credit for the selected metric is fully allocated to all property values within the selected lookback window relative to the date the metric occurred. For example, with two properties each would receive 100% credit, and with three properties each would receive 100%. It is possible for the total rows to not sum to the overall total. This is because multiple properties from the same event can receive credit, so the sums of the rows are greater than the overall value.
-
U-Shaped: Credit for the selected metrics biases credit to the first and last values for the selected property. With two touch points, the middle 20% is equally added to the first and middle touch points (50%, 50%). With four touch points, the middle two touch points would share the 20% (40%, 10%, 10%, 40%).
-
J-Shaped: Distributes credit for the selected metrics in a way that biases credit to the more recent values from the selected property. With two touch points, the first 20% is equally added to the last and middle touch points (30%, 70%). With four touch points, the final two touch points would share the 20% (10%, 10%, 20%, 60%).
-
Inverse J-Shaped: Distributes credit for the selected metrics in a way that biases credit to the first values from the selected property. With two touch points, the last 20% is equally added to the first and middle touch points (70%, 30%). With four touch points, the last two touch points would share the 20% (60%, 20%, 10%, 10%).
-
Data Driven: With this model, Amplitude Analytics relies on a probabilistic algorithm based on first-order Markov chains. Every customer journey—defined here as a sequence of channels or touch points—is represented as a chain in a directed Markov graph, where each node is a possible state (either a channel or a touch point), and the edges represent the probability of transition between states. Next, Amplitude Analytics removes the nodes one by one and estimates the impact of removing nodes on the conversion rate. Each channel gets credit in proportion to its removal effect. In general, you should use this model with properties that don't have a large number of unique values (those with 50 or fewer work best). Learn more about the algorithm here.
About the Data Driven model
- The data driven attribution model executes in real time, and calculations may take longer than with other models.
- The data driven model doesn't count
nullvalues.
Configure an attribution model
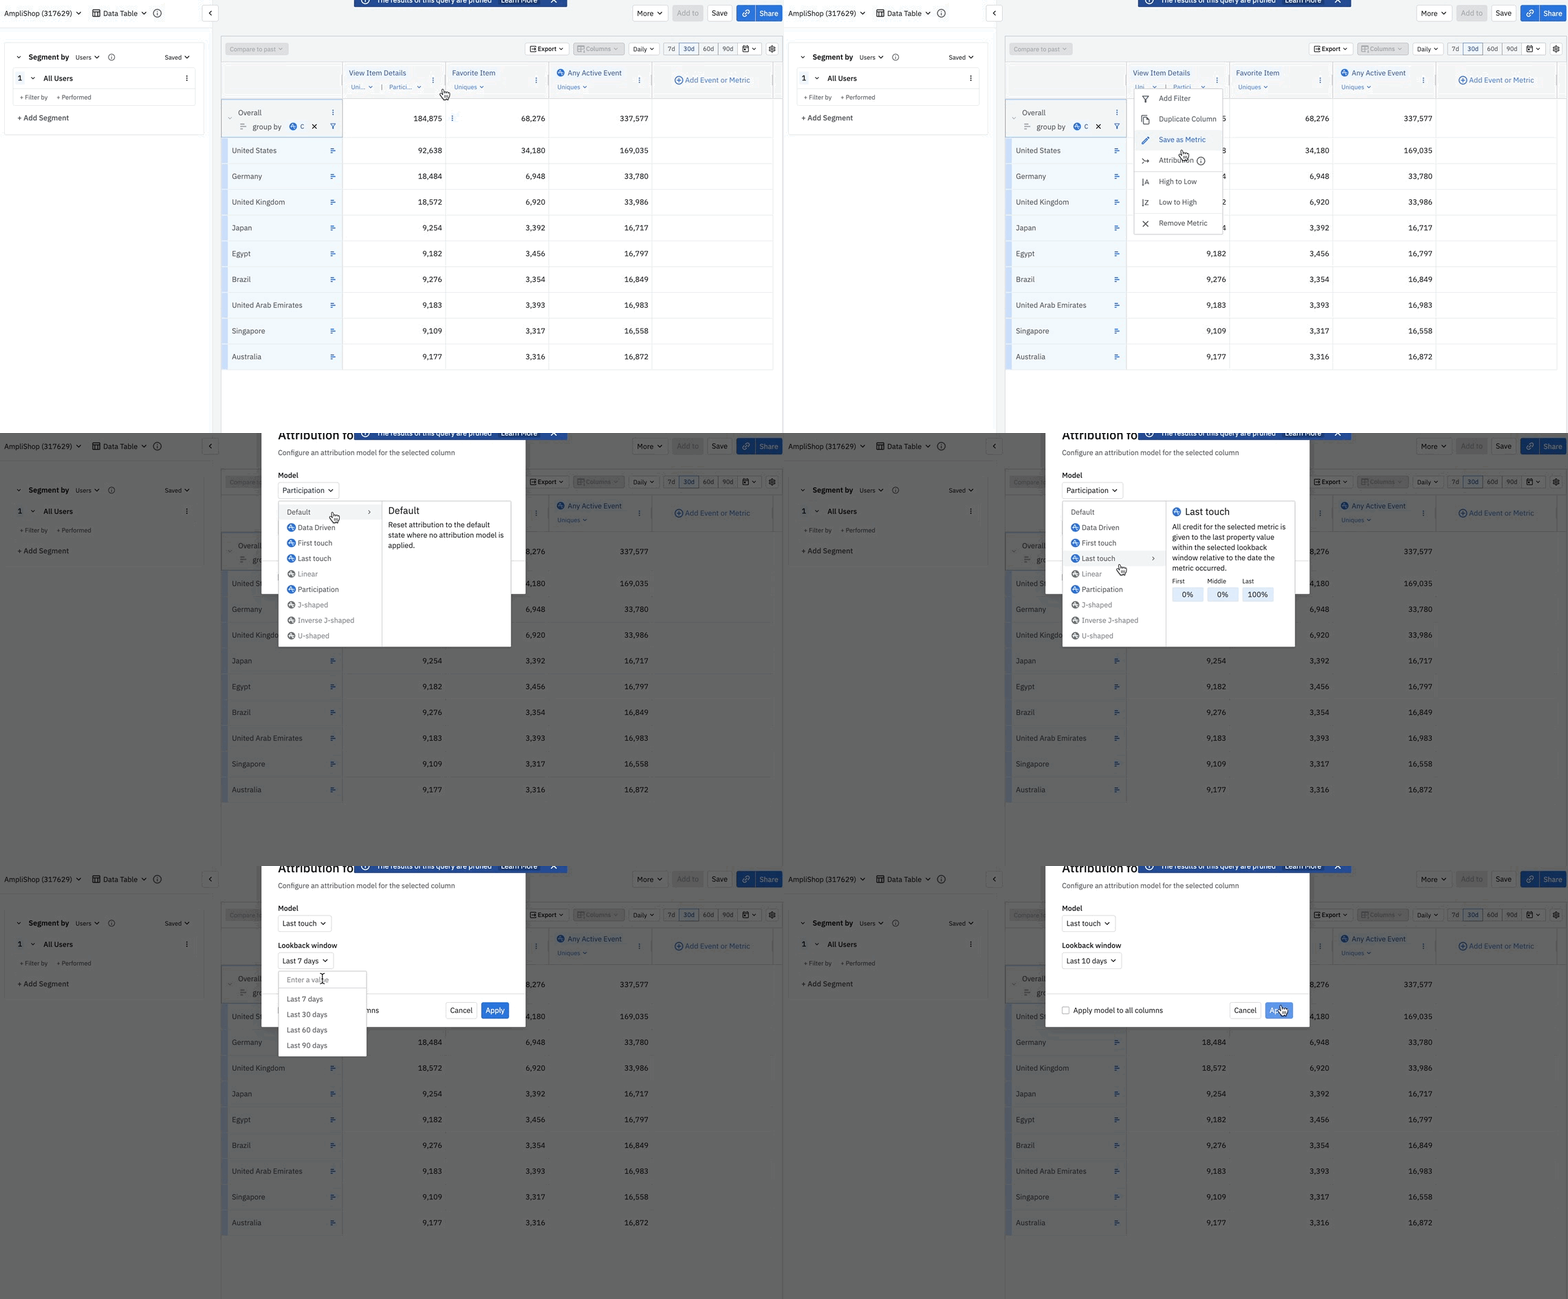
Inside a data table, you can configure an attribution model on each metric column by following these steps:
- On the column, first click … , and then Attribution.
- Select an attribution model and configure a lookback window. Optionally, you can choose to apply the attribution model to all columns in the table.
- Click Apply to confirm the change and review the table results with the attribution model applied.

Create a custom attribution model
If the pre-built attribution models don't meet your needs, you can also create a custom model. You must be an Admin or Manager to create a custom attribution model. To do so, follow these steps:
- On the column, click the … then options and click Attribution.
- Select Custom from the model dropdown, which show options for configuring your custom model.
- Set a name and description for the model so others know how to interpret it.
- Choose a custom weighting for your model.
- The first weight applies to the first touch.
- The last weight applies to the last touch.
- The middle weight distributes evenly across all touches between. If there are no touches between, the first and last touch each receive half of the middle weight.
Note
Amplitude recommends that all weights should equal 100%, although it's not required.
- Set the default lookback window for the model. Optionally, lock the window to ensure others using this model can only use that lookback window.
- Decide whether you want to share the custom model with others in your organization.
- Optionally, exclude property values from attribution. This may be useful if you don't want to assign credit to a particular value (for example, direct website visits or email).
- Click Save to confirm the change, save the model (for yourself and/or others to use in the future), and review the table results with the attribution model applied.

Use cases
- Acquisition channel credit: When analyzing the effectiveness of all organic and paid investments, you can leverage acquisition channels with a multi-touch attribution model to understand how each channel contributes to driving KPI outcomes. Depending on your business model and user behavior, you can analyze which model of attributing credit makes the most sense and make investment decisions based on the contribution of each of your channels to your target metric.
- Comparing attribution models: In longer conversion cycles with multiple session user flows, you can compare the same metric with different attribution models applied. This data supports discovering which attribution model reflects how to efficiently invest marketing dollars and what stage of the customer buying cycle a campaign impacts. For example, when attributing to advertising campaigns, you can find which campaigns tend to be the first interaction (awareness) that a customer has, the last (high intent), or somewhere between (research).
- Content: Use attribution to find not only how often users viewed content but how that content participated in driving a business KPI outcome. Knowing that content has a low bounce/exit rate or longer time spent on a page can be helpful, but you can clarify the business impact by generating a conversion rate based on different attribution models.
- Internal campaigns: Like paid off platform advertising investments, marketing teams invest their time and creative talent to generate offers and brand-building content to drive KPI outcomes. Using attribution on the impact of those marketing efforts can similarly inform your content marketing teams which types of offers and creatives are best at driving both short and long term business value.
- Paid channels with LTV: By combining your attribution model with your behavior-based LTV calculations, you can see a bigger perspective of how much value a paid channel or campaign is driving. This data can unlock potential for greater investments in channels that drive the most long term business value.
Supported attribution types by metric
Each metric type supports a specific set of attribution types:
-
Uniques
- first touch
- last touch
- participation
- markov
-
Conversion
- first touch
- last touch
- participation
-
Event totals
- first touch
- last touch
- participation
- linear
- j-shaped
- inverse j-shaped
- u-shaped
- custom
- markov
-
property sum, revenue total, and formula (clauses: uniques, total, propsum)
- first touch
- last touch
- participation
- linear
- j-shaped
- inverse j-shaped
- u-shaped
- custom
Attribution options differ between uniques and event total attribution types because a unique user is a less clear unit to split across multiple channels or campaigns. Only attributions that clearly assign a whole user to a single, or many, channels are used. Such as First, Last, or Participation.
Attribution with multiple properties
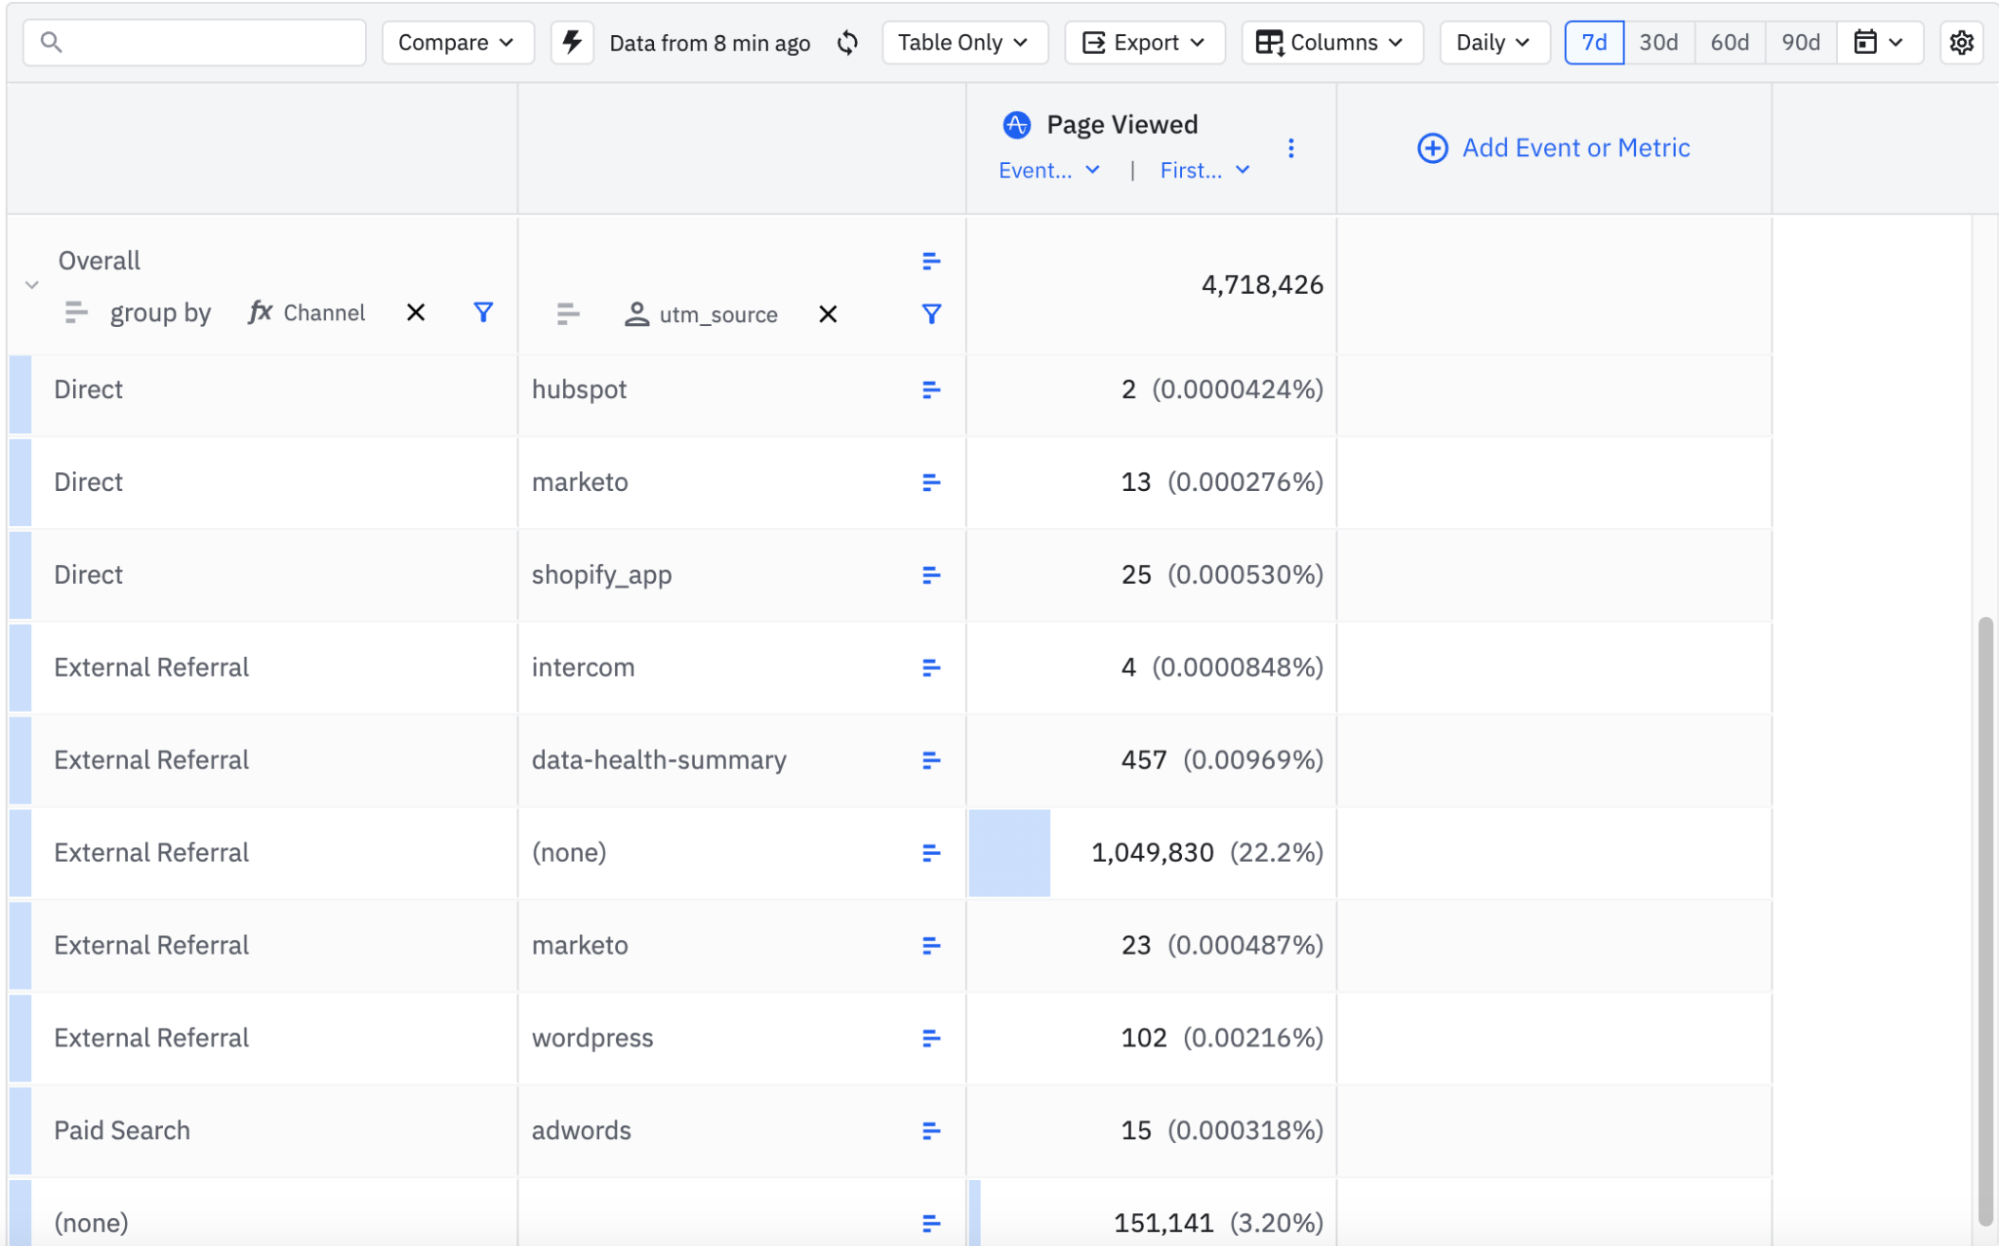
The attribution model applies only to the property in the outermost group by level. Properties in inner group by levels don't undergo attribution modeling. Instead, they inherit their values from the attributed event.

In this example, the attribution model applies only to the Channel, as its the outermost group by property.
utm_source, as an inner group by property derives its value from the attributed events, rather than applying attribution separately.
If you have further questions about how results are organized or why the sum may not match the overall value go to Group-bys: How Amplitude prune and orders chart results.
Attribution example calculation
Here is a brief example to highlight the differences between attribution models and lookback windows.
Note
Suppose a user has three touch points before the Sign Up event, each with a different UTM source:
| UTM source | Date | Event |
|---|---|---|
| 2022-05-01 | Viewed Home Page | |
| 2022-05-07 | Viewed Blog Post | |
| TikTok | 2022-05-10 | Viewed Promotion Page |
| 2022-05-10 | Sign Up |
Here are some example combinations of the attribution model and lookback window and the resulting attribution of credit to each UTM source.
| Attribution Model | Lookback Window | Credit | Explanation |
|---|---|---|---|
| First Touch | 30 Days | Google: 100% | All credit goes to the first touch within the last 30 days, which is Google on 2022-05-01. |
| First Touch | 7 Days | Facebook: 100% | All credit goes to the first touch within the last 30 days, which is Facebook on 2022-05-07. |
| Last Touch | 7 Days | TikTok: 100% | All credit goes to the last touch within the last 7 days, which is TikTok on 2022-05-10. |
| Linear | 30 Days | Google: 33% Facebook: 33% TikTok: 33% |
Divides evenly between all three touch points in the last 30 days. |
| Linear | 7 Days | Facebook: 50% TikTok: 50% |
Divides evenly between the two touch points in the last 7 days. |
| J-Shaped | 30 Days | Google: 20% Facebook: 20% TikTok: 60% |
In the last 30 days, the first touch gets 20%, middle touches 20%, and last touch 60%. |
| J-Shaped | 7 Days | Facebook: 30% TikTok: 70% |
There is no middle touch, so the 20% gets split across the first and last touches. |
| Custom 5% - 20% - 75% |
30 Days | Google: 5% Facebook: 20% TikTok: 75% |
In the last 30 days, the first touch gets 5%, middle touches 20%, and last touch 75%. |
October 16th, 2025
Need help? Contact Support
Visit Amplitude.com
Have a look at the Amplitude Blog
Learn more at Amplitude Academy
© 2026 Amplitude, Inc. All rights reserved. Amplitude is a registered trademark of Amplitude, Inc.