User Sessions: Track engagement frequency and duration
Amplitude Academy
Uncover How Long Users Spend in Your Product with User Sessions
Learn how to use the User Sessions chart to analyze the time users spend in your product.
Get startedThe User Sessions chart helps you analyze your users through session-based metrics. By showing the distribution of session lengths, average session length, and average sessions per user, it helps answer questions like:
- How frequently do users engage with your product?
- How long do they engage with your product?
- How do these metrics compare to other user segments?
See also
To analyze session metrics and event metrics together in a single chart, try Metric Explorer (Beta).Before you begin
For more information, refer to building charts in Amplitude and session IDs and how Amplitude tracks sessions.Set up a user sessions chart
Most Amplitude charts rely on the Events Module to build an analysis. The User Sessions chart works differently because it uses a Sessions Module.
A user sessions analysis breaks out your users into groups based on characteristics of their sessions in your product.
You can also use this chart to count the number of events users fire during their sessions. This lets you assess engagement during a particular period of activity, instead of during an entire day, week, or month.
Build a user sessions chart
To build your own user sessions chart, follow these steps:
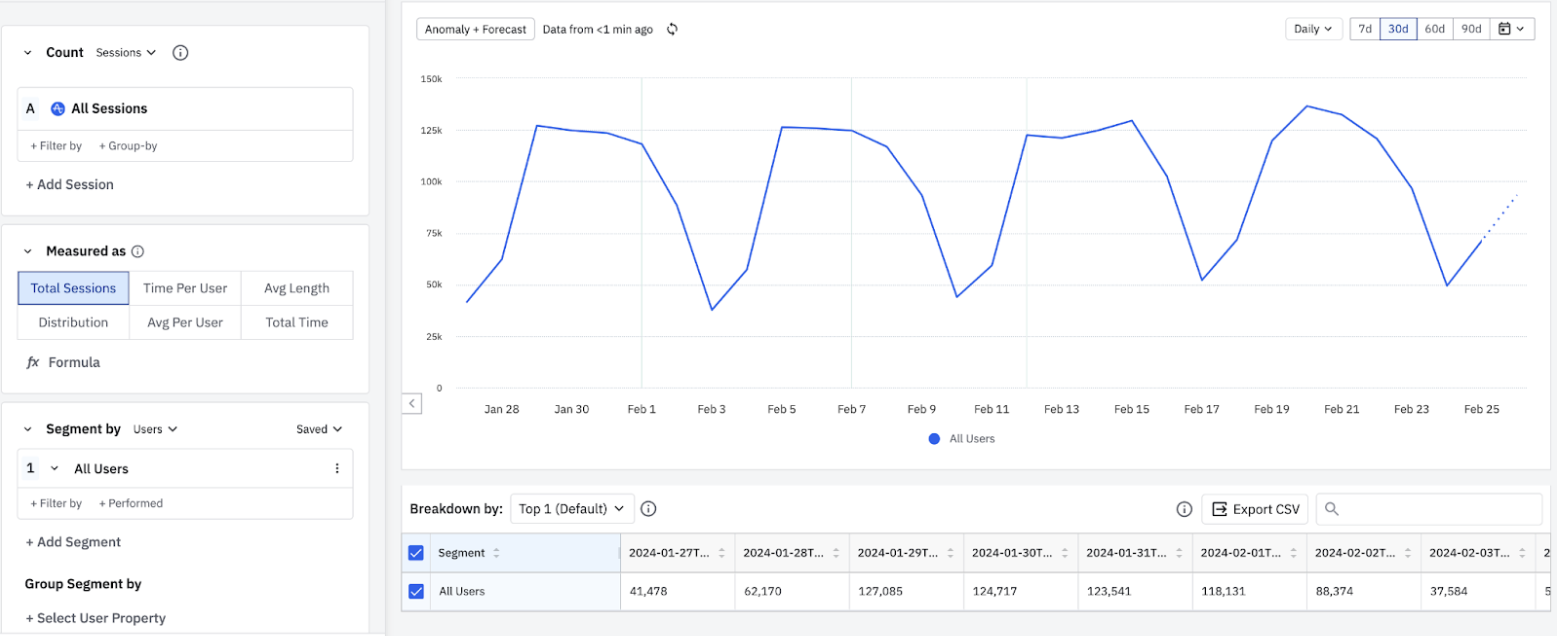
In the Sessions Module (where you'd usually find an Events Module), use the Count dropdown to specify whether your User Sessions chart measures sessions or events performed within sessions.
If you're counting events performed within sessions, specify the event to count by clicking Select Event under Event Count. If you're measuring sessions instead, skip this step.
Add properties to your starting event by clicking + Filter by and choosing one of the available properties:
Session Duration,Contains Event,First Propertyvalue, orLast Propertyvalue.Enter the session's minimum length in seconds, minutes, hours, or days for
Session Duration. Choose an event the user must trigger during each session forContains Event. Or choose a property each session must contain forFirst Propertyvalue orLast Propertyvalue.To group your sessions by a property, click + Group by and choose the property. You can apply a single group-by to each Sessions object in the Sessions module, and add multiple group-bys in the Segment By module.
If you selected Sessions in Step 1, choose from the following options in the Measured As Module:
- Total Sessions: Graphs the total number of sessions across all users. Amplitude calculates this by counting the total number of valid sessions in the interval. (When session IDs are instrumented, "valid" means a session with an ID other than 'none' or
-1.) Total Sessions doesn't count sessions containing only inactive events. - Time Spent: Graphs the total sum of all session lengths in the interval.
- Time Spent per User: Graphs the average time spent in sessions per interval. Amplitude calculates this by taking the sum of all session lengths in the interval, and dividing by the total number of active users in the interval.
- Avg Length: Graphs the average session length. Amplitude calculates this by taking the sum of all session lengths in the interval, and dividing by the total number of sessions in that interval.
- Length Distribution: Displays the distribution of session lengths in a histogram. Customize the shape of the distribution by setting the minimum and maximum session lengths. The minimum value is inclusive, and the maximum value is exclusive. The example above shows session length distribution for sessions between 1 and 30 minutes long in 5-minute intervals.
- Avg Per User: Graphs the average number of sessions per user. Amplitude calculates this by dividing the total number of valid sessions in an interval by the total number of active users in the same interval.
- Formula: With formulas, you can create your own custom metrics, such as bounce, entry, and exit rates. The following metric formulas are available in User Sessions analyses:
EVENTTOTALS,HIST,PROPSUM,SESSIONTOTALS, andUNIQUES. These metric formulas work like the definitions in the custom metric formulas Help Center article, but the syntax refers to sessions instead of events.
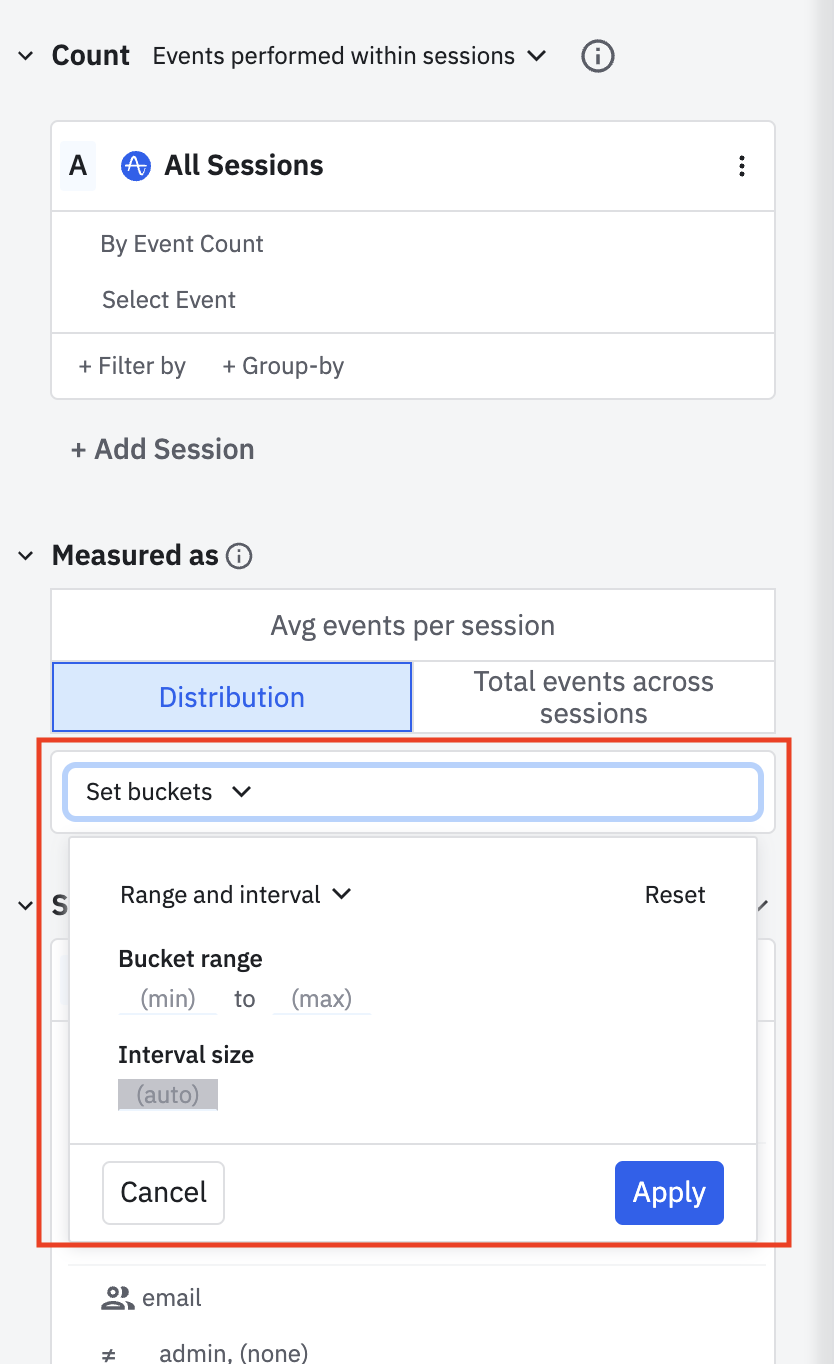
If you selected Events performed within sessions, choose from the following chart options instead:
- Average Events per Sessions: Graphs the average number of times a selected event is performed per session. The time series plots the number of times users perform the event in a session per interval (day, week, month, and so on). Use this to analyze average engagement.
- Total Events Across Sessions: Graphs the total number of times a selected event is performed in sessions. Like plotting totals in Event Segmentation, this shows the number of times users have performed a particular action across all sessions in an interval.
- Distribution: Graphs a distribution of the number of sessions that include a selected event. The x-axis shows a range of the number of times the selected event was performed, and the y-axis plots the number of sessions in the time range. This analysis shows which of your users have the highest or lowest in-session engagement. To set individual ranges for each bucket, click Set buckets:
- Total Sessions: Graphs the total number of sessions across all users. Amplitude calculates this by counting the total number of valid sessions in the interval. (When session IDs are instrumented, "valid" means a session with an ID other than 'none' or
In the Segment By module, identify the user segment to include in this analysis. To import a previously saved segment, click Saved and select the one you want from the list. Otherwise, Amplitude targets all users by default.
To build your own user segment instead, add properties. Click + Filter by, choose the property to include, and specify the property value you're interested in.
To narrow the focus further to users who already performed certain actions, click + Performed, then choose the event you're interested in.
To add another user segment, click + Add Segment and repeat steps 5 through 7.
Use the datepicker to set the timeframe of your analysis.
Amplitude excludes sessions lasting longer than a day from analyses.
Was this helpful?