Interpret your revenue analysis
This article helps you:
Identify the strengths and weaknesses of your approach to new-user monetization
It's important to keep in mind that Revenue LTV is a monetization analysis focusing on new users only. Forgetting this could easily lead to some off-base interpretations of your data.
Note
Let's assume you selected a daily frequency breakdown in step 7 of building your Revenue LTV chart. It could just as easily be hourly, weekly, monthly, or quarterly, and the underlying logic would be the same. Let's also assume you are looking at a date range beginning December 5th and ending December 20th.
When calculating each data point, the Revenue LTV chart treats all users of each segment who were new users during your chosen timeframe as a single cohort.
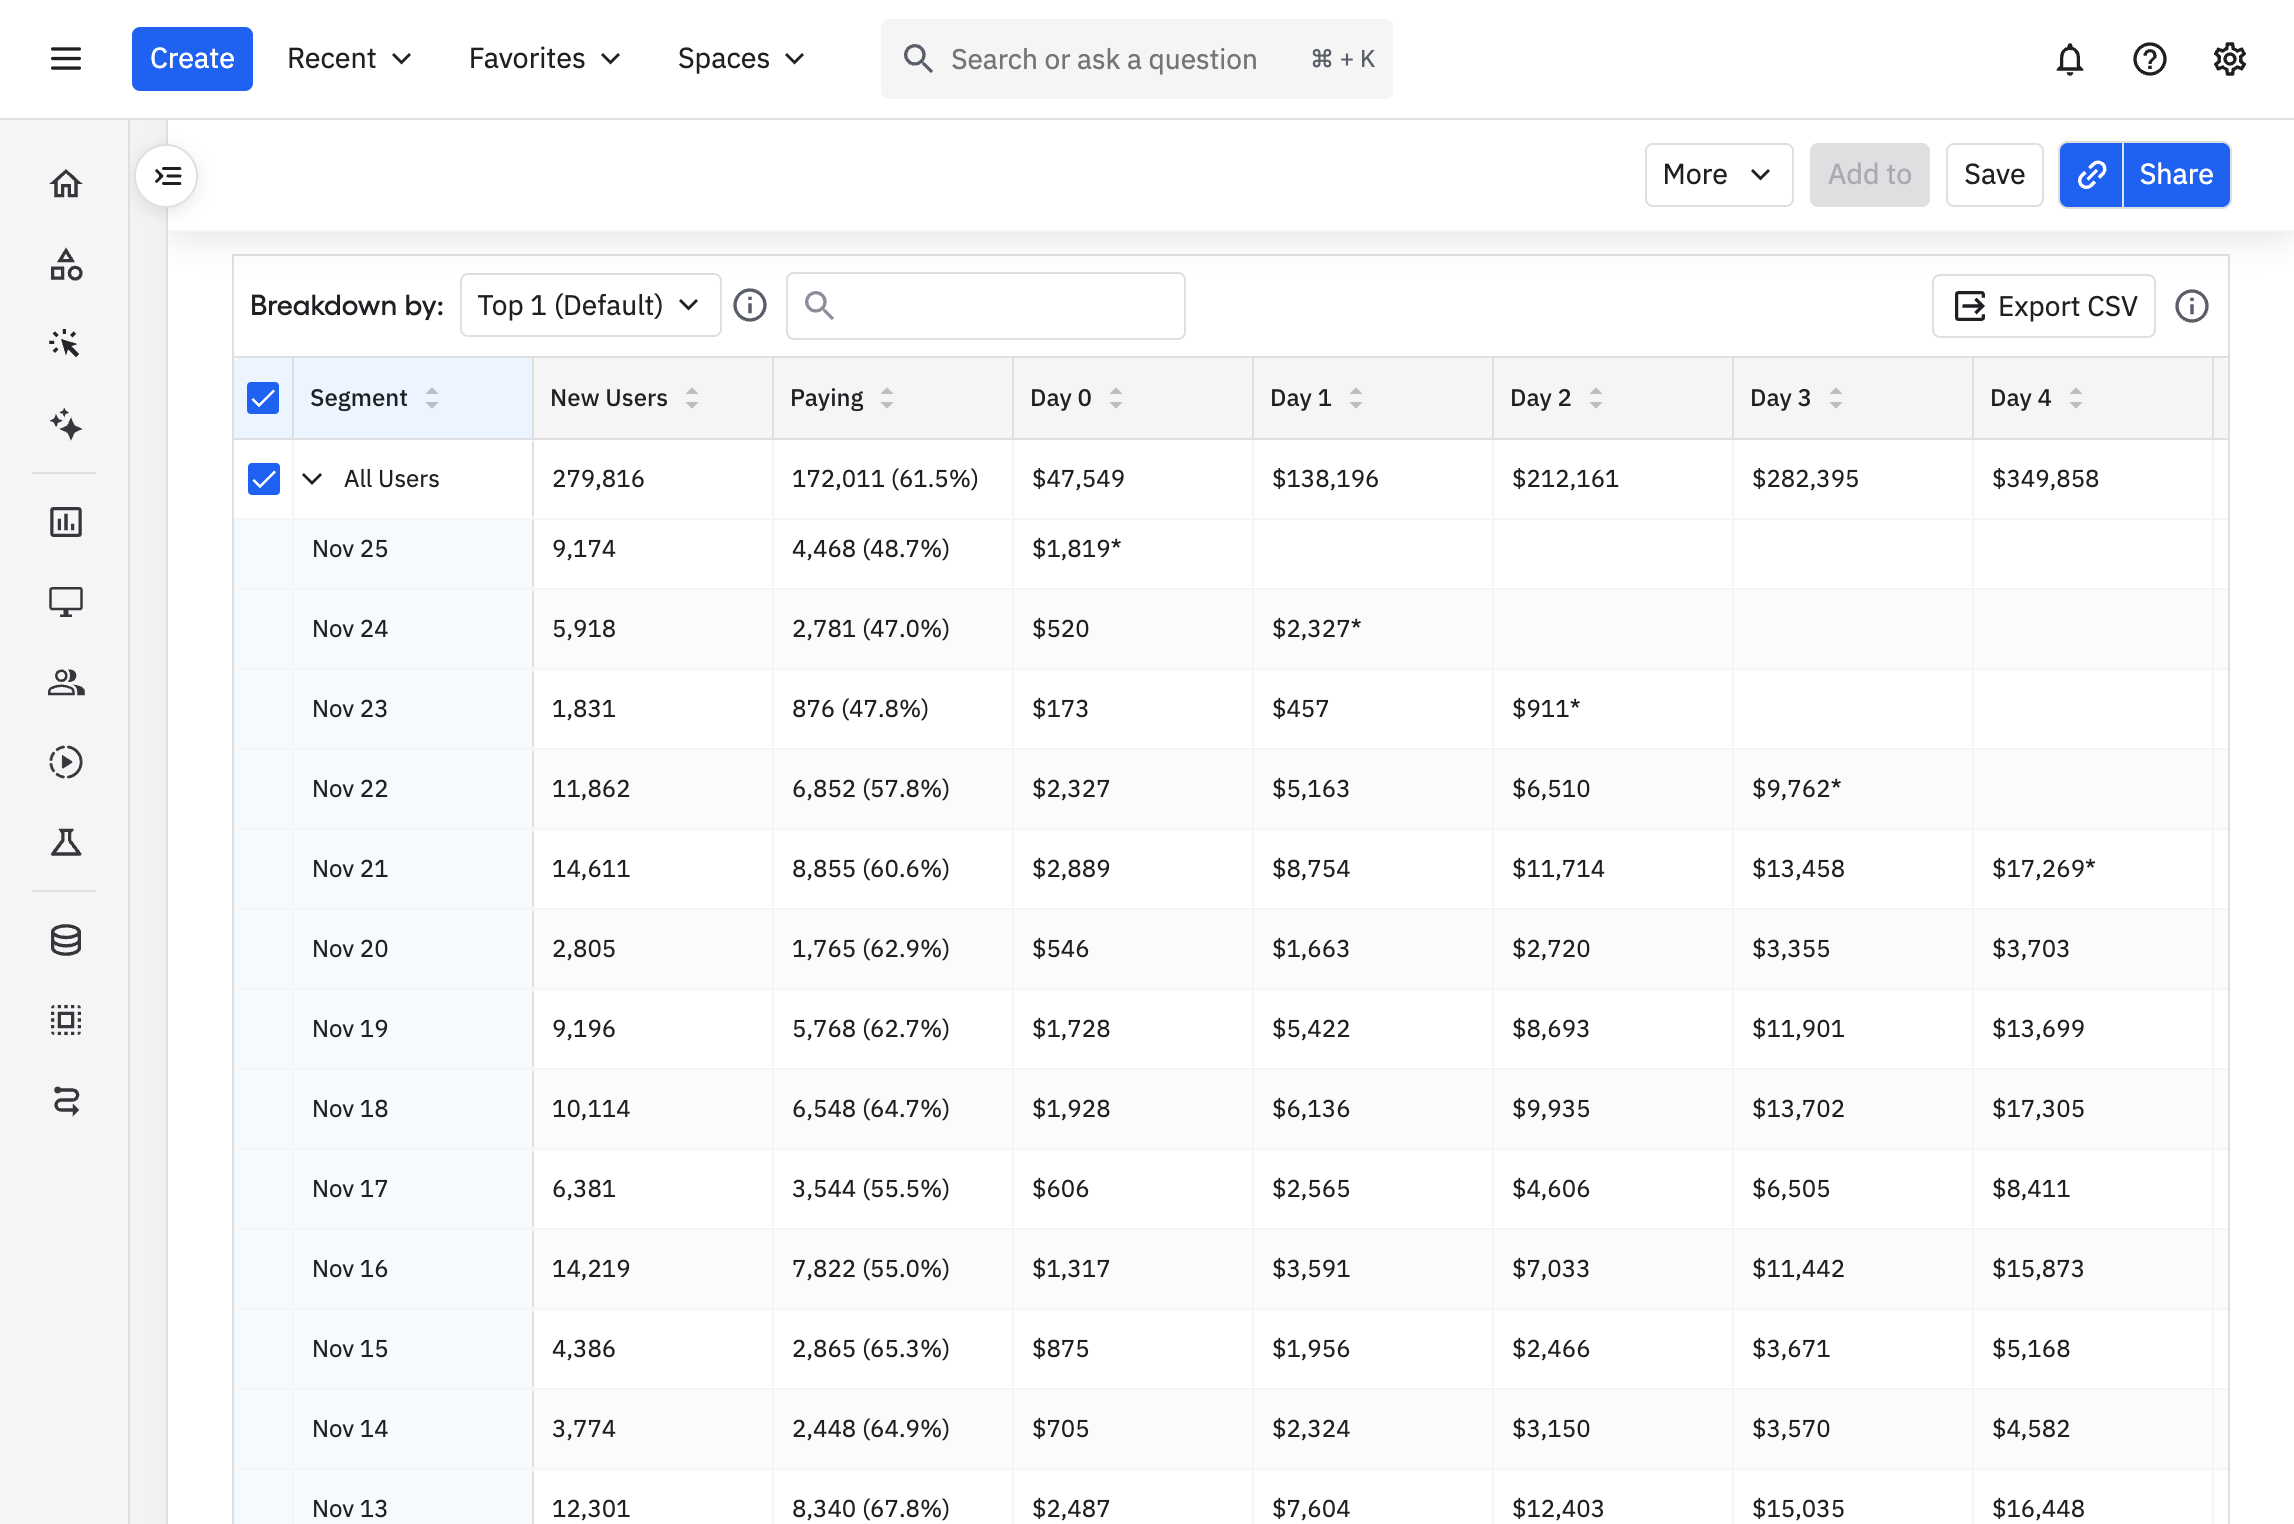
For example, the total revenue amount shown on Day 1 is the total revenue collected from users who began using your product between December 5th and December 20th, by the 48th hour after their first Amplitude event. On Day 5, that same metric shows the total revenue collected from that same cohort of users by the 144th hour after triggering their first active Amplitude event.
Note
Because all users are treated as a single cohort, a user who has paid at any time in the past is considered to be a paying user even when looking at data points before their first payment.
As a further example, imagine you are looking at Day 10. If some users started using your product fewer than ten days ago, their data will not be included in the Day 10 calculations. This can lead to drops in ARPU and ARPPU near the end of the timeframe, even though they're based on cumulative revenue.
The breakdown table below the chart can show the data broken up by cohorts of users who started on the same day. Click the triangle next to All Users to expand.

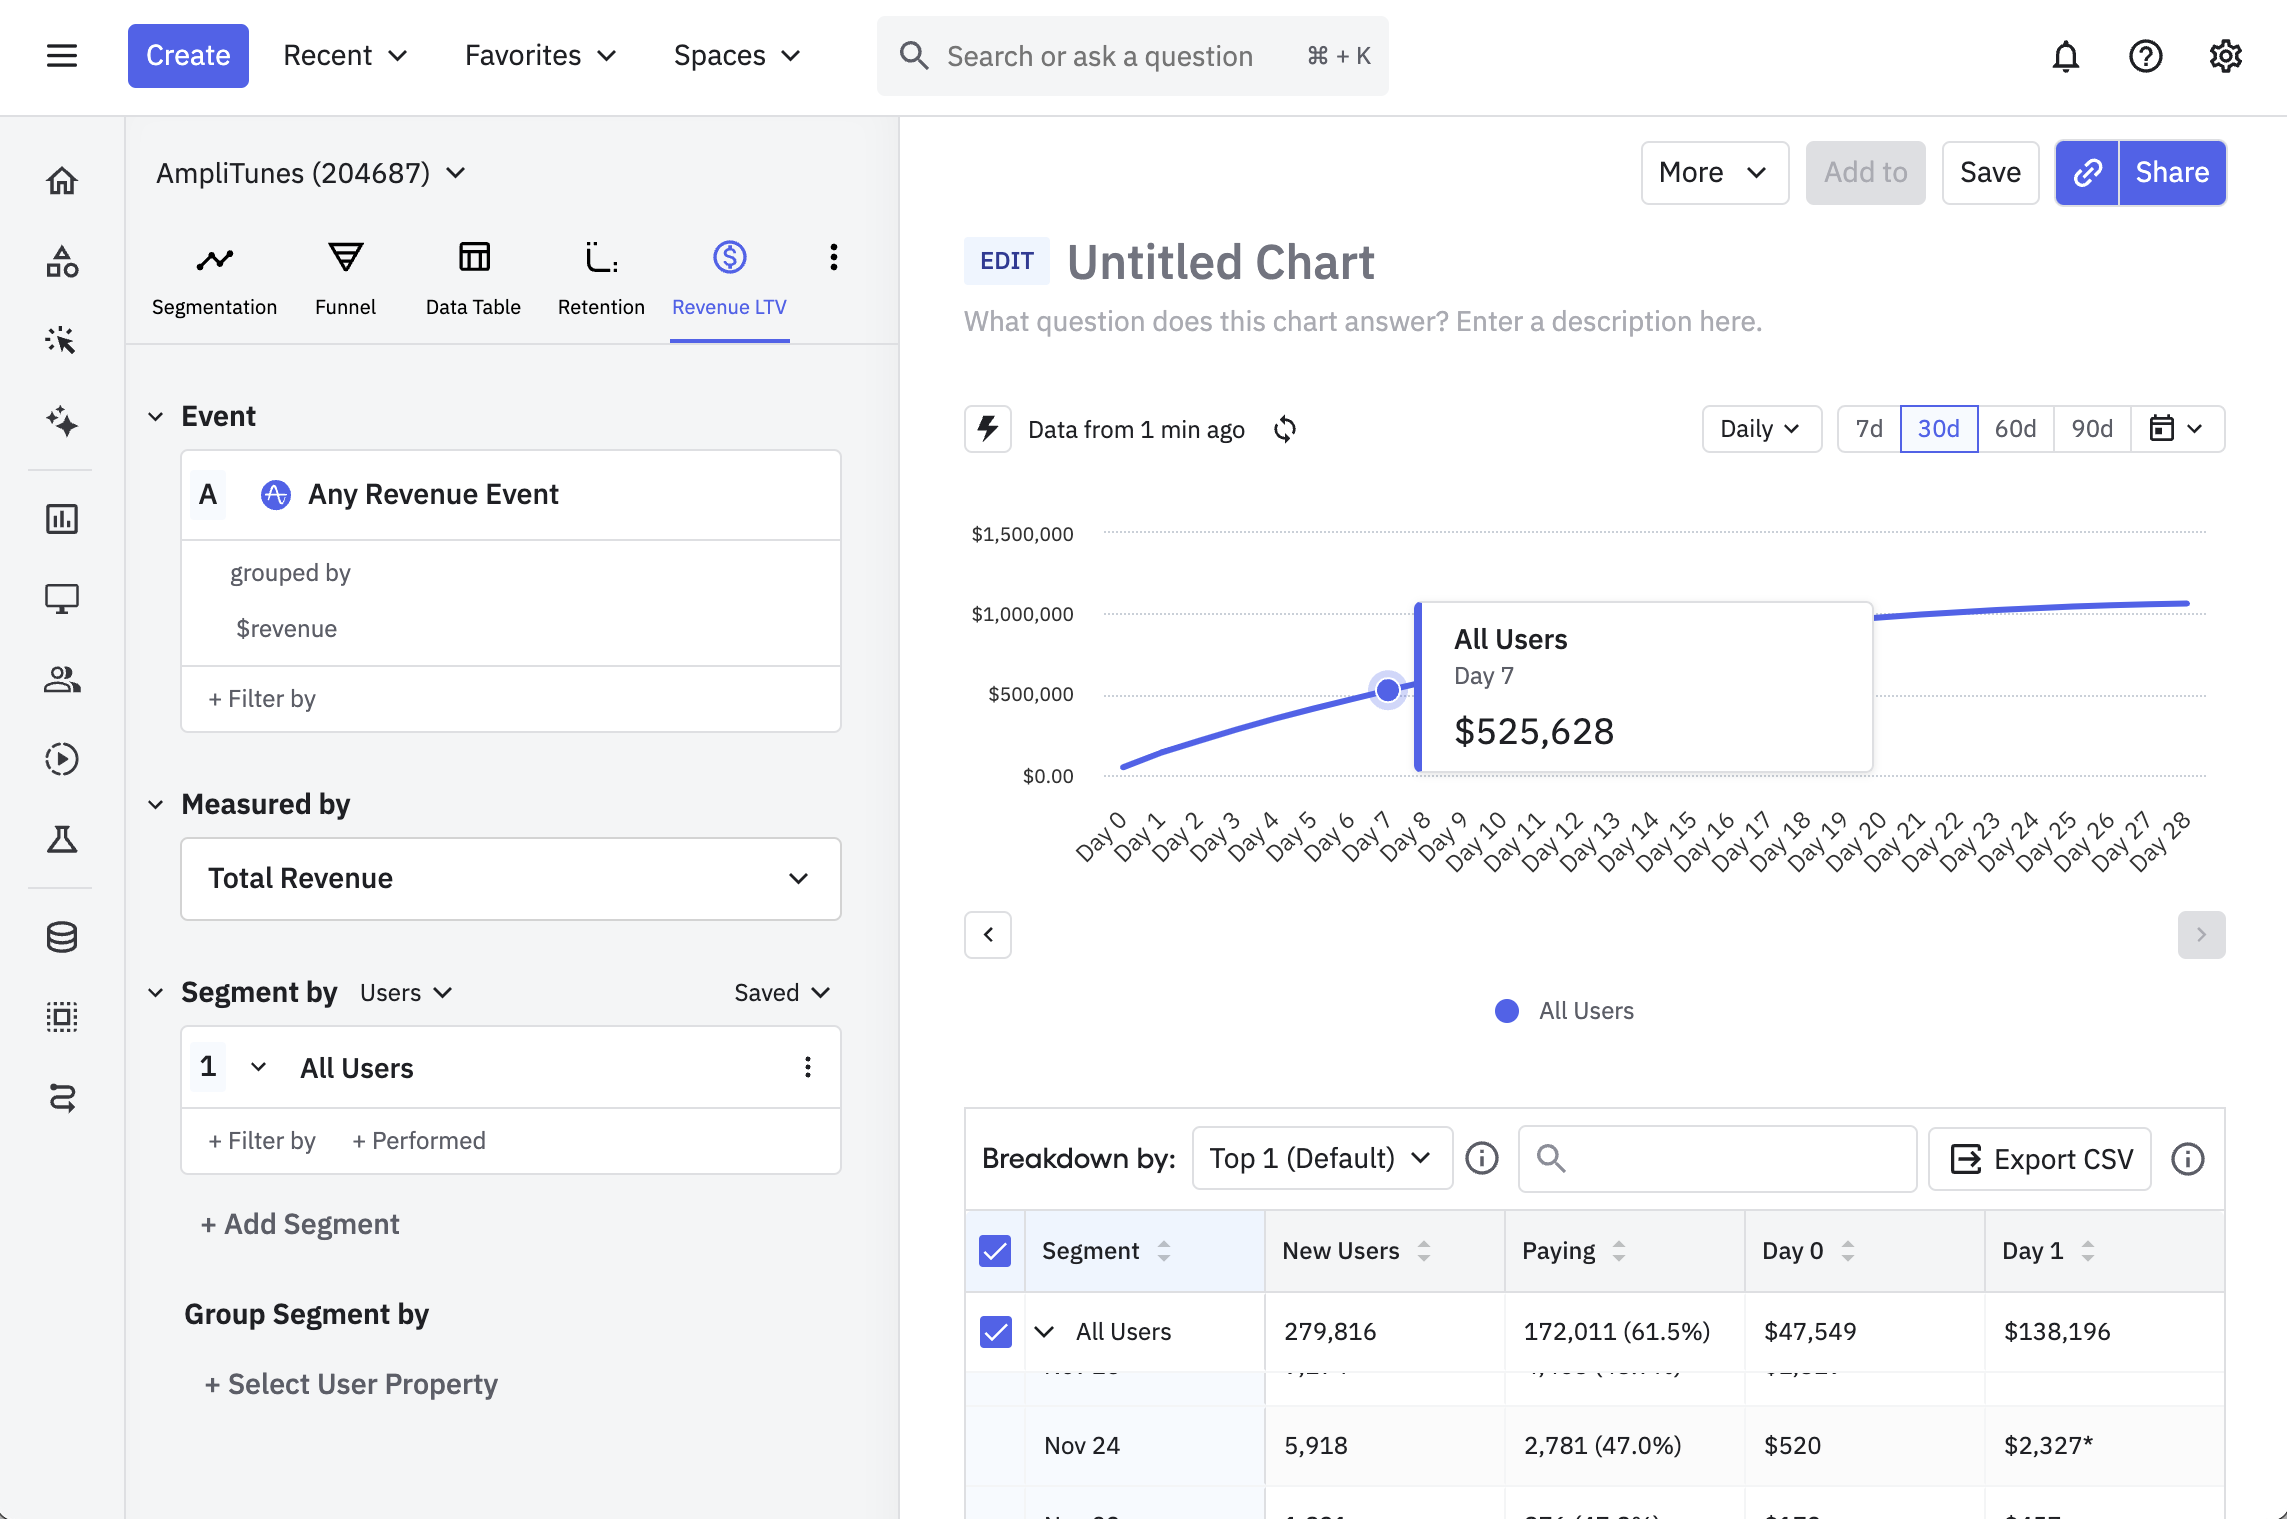
You can set up and interpret any Revenue LTV chart easily, as the user interface allows you to read the parameters like a sentence. For example, the following chart shows you a visualization of all revenue events fired by your users, measured by the average revenue per user daily in the last 30 days.

You can also hover over the individual data points to see the actual amounts.
November 25th, 2024
Need help? Contact Support
Visit Amplitude.com
Have a look at the Amplitude Blog
Learn more at Amplitude Academy
© 2026 Amplitude, Inc. All rights reserved. Amplitude is a registered trademark of Amplitude, Inc.