Using formula metrics in Experiment Results
In an Experiment Results chart, a formula metric gives you more flexibility when performing analyses. A formula metric consists of:
- At least one event.
- A mathematical operation that combines the events.
Create a formula metric
To add a formula metric to your Experiment Results chart
- In the Primary Metric module, click Add Metric and choose a formula from the Formula dropdown options.
- Click Define single-use metric, then select Formula from the Metric Type dropdown.
- Click Select event... to start selecting events to include in your formula metric. Repeat this step until you've selected all the events you need.
- In the Formula box, enter the formula for calculating your formula metric. Refer to the list of supported formulas or the formula syntax explanation.
- Add a name for this new formula metric and click Apply.
The metric appears in your Experiment Results chart.
You can also view this metric in the object management center.Supported formula functions
Experiment Results supports the formula functions listed here:
UNIQUES
Syntax: UNIQUES(event)
- Event: The event you want to analyze. This must be a letter corresponding to an event in the Events Module.
Returns the number of unique users who triggered the event.
TOTALS
Syntax: TOTALS(event)
- Event: The event you want to analyze. This must be a letter corresponding to an event in the Events Module.
Returns the total number of times users triggered the event.
PROPSUM
Syntax: PROPSUM(event)
- Event: The event you want to analyze. This must be a letter corresponding to an event in the Events Module.
This function only works when you group by a numerical property on the event. If you group by multiple properties, the formula runs the calculation with the first group-by clause.
Returns the sum of the property values that the specified event groups by.
PROPAVG
Syntax: PROPAVG(event)
- Event: The event you want to analyze. This must be a letter corresponding to an event in the Events Module.
This function only works when you group by a numerical property on the event. If you group by multiple properties, the formula runs the calculation with the first group-by clause.
Returns the average of the property values you group by. This function is the same asPROPSUM(event)/TOTALS(event). To learn more, refer to how Amplitude calculates PROPAVG and PROPSUM.PROPCOUNTAVG
Syntax: PROPCOUNTAVG(event)
- Event: The event you want to analyze. This must be a letter that corresponds to an event in the Events card. If you group by multiple properties, the formula runs the calculation with the first group-by clause.
Returns the average number of distinct values each user has for a specified property.
For example, suppose you want the average number of song genres your music app subscribers listen to. Each time a user plays a song, a Play Song or Video event triggers, and each played song captures a Genre_Type event property. Running PROPCOUNTAVG on Play Song or Video grouped by Genre_Type returns the average number of unique Genre_Type values for users who fire Play Song or Video.
PROPCOUNTAVG supports only numeric event properties in Experiment.
PROPMAX
Syntax: PROPMAX(event)
- Event: Returns the maximum value of the property you group the specified event by. The property must be numeric. If you group by multiple properties, the calculation uses the first group-by clause.
PROPMIN
Syntax: PROPMIN(event)
- Event: Returns the minimum value of the property you group the specified event by. The property must be numeric. If you group by multiple properties, the calculation uses the first group-by clause.
PROPCOUNT
Syntax: PROPCOUNT(event)
- Event: The event you want to analyze. This must be a letter that corresponds to an event in the Events card. If you group by multiple properties, the formula runs the calculation with the first group-by clause.
Returns the number of distinct property values for the property the event groups by. In this setup, the formula retrieves the number of different departments covering all the items for which users viewed details.
PROPCOUNT is an estimate of distinct property values. The estimate comes from a HyperLogLog algorithm, and its accuracy depends on the amount of data it has to work with. Expect a relative error in the range of 0.1% for less than 12,000 unique values and up to 0.5% for more than 12,000 unique property values, depending on the cardinality of the property.PROPCOUNT supports only numeric event properties in Experiment.
PROPCOUNT and specify an event property that's a number. For example, the YYYYMMDD format for a date. You might need to use a derived property to make sure you apply the PROPCOUNT to a number.REVENUETOTAL
Syntax: $:REVENUETOTAL(event)
- Event: The revenue event. This must be a letter that corresponds to an event in the Event card.
- This function only works when you group by a numerical property on the event.
Returns the aggregate sum of the property, formatted as a currency. It's the same as PROPSUM(event). The $: prefix is optional. Its presence ensures the output format is a currency.
Formula syntax
In your formulas, refer to events selected in the Events Module by their corresponding letter. The functions and parameters aren't case-sensitive. You can also perform the following arithmetic operations:
- Parenthesis ()
- Addition (+)
- Subtraction (-)
- Multiplication (*)
- Division (/)
Formula metric examples
Use these examples to create common business metrics for your experiments. Each example shows the formula syntax and what it measures.
Total engagement score
Combines multiple engagement events into a single metric.
Formula: TOTALS(A) + TOTALS(B) + TOTALS(C)
Example: If event A is "Article Read", event B is "Comment Posted", and event C is "Article Shared", this formula sums all engagement actions.
Average order value
Calculates the average value of orders or purchases.
Formula: PROPAVG(A)
Example: If event A is "Purchase Completed" grouped by a order_value property, this formula returns the average order value. This is equivalent to PROPSUM(A) / TOTALS(A).
Engagement ratio
Compares two types of engagement to understand user preferences.
Formula: TOTALS(A) / TOTALS(B)
Example: If event A is "Video Watched" and event B is "Article Read", this formula shows the ratio of video views to article reads.
How Amplitude calculates experiment data for formula metrics
Before reviewing how Amplitude calculates formula metrics with experiment data, understand the Experiment Analysis view, which provides details for your experiment.For formula metrics, Amplitude computes the results for each function independently to find the mean and variance of each one. Amplitude then applies the arithmetic operators to the results of these individual functions.
For example, suppose you define a formula metric as TOTALS(A) + TOTALS(B). Amplitude calculates the variances and means of both components of this metric, as well as the covariance.
If you set X equal to TOTALS(A) and Y equal to TOTALS(B), the following statements hold:
V[X]= Variance of XE[X]= Mean of XV[Y]= Variance of YE[Y]= Mean of YCov[X, Y]= Covariance of X and Y, assumed to be zero for all mathematical operations.Addition: Variance:
V[X + Y] = nV[X] + nV[Y]
Mean:E[X + Y] = E[X] + E[Y]Subtraction: Variance:
V[X - Y] = nV[X] + nV[Y]
Mean:E[X - Y] = E[X] - E[Y]Multiplication: Variance:
V[X * Y] = n^3 mu_y^2 sigma_x^2 + n^3 sigma_y^2 mu_x^2 + n^2 sigma_x^2 sigma_y^2
Mean:E[X * Y] = E[X] * E[Y]Division: Variance:
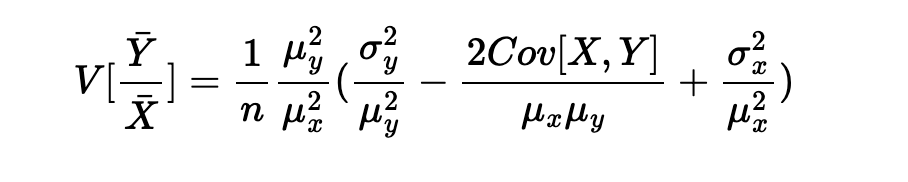 Mean:
Mean: E[X / Y] = E[X] / E[Y]
After you have the mean and variance of the formula metric, you can calculate the confidence interval chart and the p-values.
Formula / Metric: TOTALS(A) / TOTALS(B)
Was this helpful?