A/B testing in a Funnel Analysis chart
This article helps you:
View your Funnel Analysis charts in terms of either improvement over baseline or statistical significance
AMPLITUDE ACADEMY
Diagnose Conversion Issues with Funnel and Path Analyses
Analyze your users' movement throughout your product and understand how to improve conversion rates.
Learn Funnel Analysis
Note
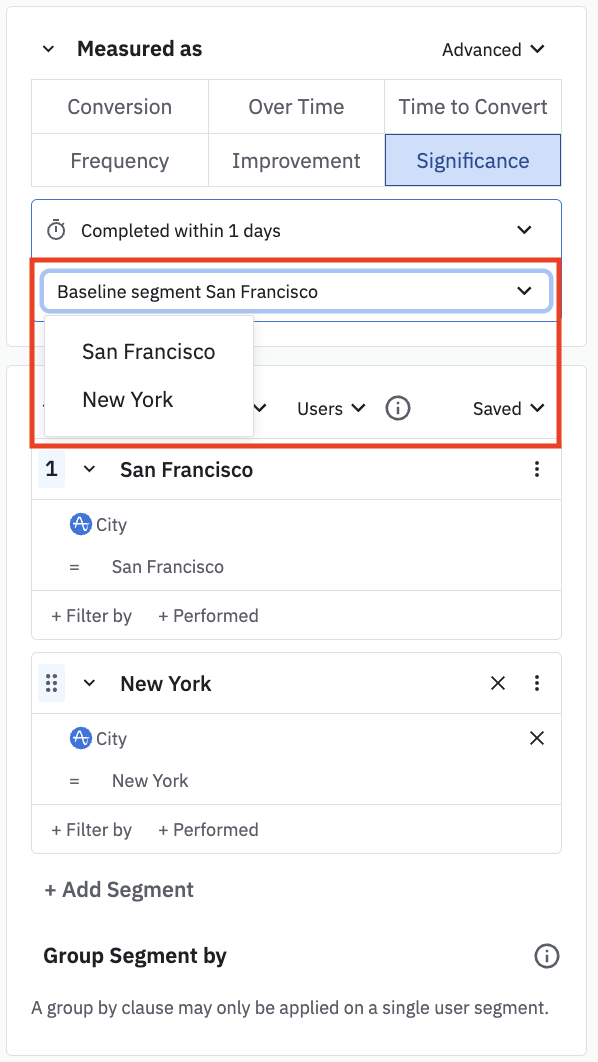
In Amplitude, A/B testing lets you compare the funnel conversion performance of two or more user segments against each other. You can view results as improvement, which describes the performance of a segment compared to the baseline—or as statistical significance, which show you the probability of observing a difference as extreme as what you saw, assuming the control and treatment have the same mean.
Note
Amplitude, by default, uses the first segment added to the funnel analysis as the baseline, but you can change this in the Baseline segment drop-down menu.

A/B Test - Improvement
This chart displays the conversion rate for each segment across all steps in your funnel. You can have more than just one variant in an A/B test, but you can only have one baseline.
A/B Test - Significance
On this chart, a high value for a variant suggests it converts better than the baseline, while a low value suggests it doesn't.
Amplitude considers the results as statistically significant if the results include:
- a sample size above 30 for both variants
- sample
size * conversion rate >= 5andsample size * (1-conversion rate) >= 5for both variants - a significance of 95% or greater
Get more details on how Amplitude calculates statistical significance.
Understand the breakdown table
The data table below the chart gives you a breakdown of the data. As with all data tables in Amplitude, you can export the data as a CSV file. Here are the columns included:
- Count: The number of users or groups that entered the funnel.
- Converted: The number of users or groups that completed all the steps in the funnel with all conditions met.
- % Conversion: The number of converted users or groups, divided by the number of users or groups that entered the funnel.
- % Improvement over Baseline: Amplitude calculates this by the equation
(% conversion for that variant - % conversion for the baseline) / (% conversion for the baseline). The percentage in the data table is green when the value is a positive number. - Significance: This is the likelihood that the performance displayed for each test variant is actually different from zero, and not due to random fluctuations in the data. The higher this value is, the more confident you can be in your results. More formally, this is
1 - p-value.
October 16th, 2025
Need help? Contact Support
Visit Amplitude.com
Have a look at the Amplitude Blog
Learn more at Amplitude Academy
© 2026 Amplitude, Inc. All rights reserved. Amplitude is a registered trademark of Amplitude, Inc.