Multi-dimensional analysis with Data Tables
This article helps you:
Build a custom analysis using multiple metrics in several different dimensions
AMPLITUDE ACADEMY
Analyze Multiple Metrics at Once with Data Tables
Learn how to do multi-dimensional analysis with Data Tables.
Learn Data TablesWhen analyzing a rich dataset, analysts often need to compare multiple metrics at once, and slice and dice that data by different dimensions to generate a custom analysis. Amplitude’s Data Tables enable multi-metric, multi-dimensional analyses in a single view.
Data Tables are useful for:
- Marketing attribution (total visits, page views, and conversion rate by UTM source)
- Market Segment analysis
- Experiment analysis
- Trend investigation
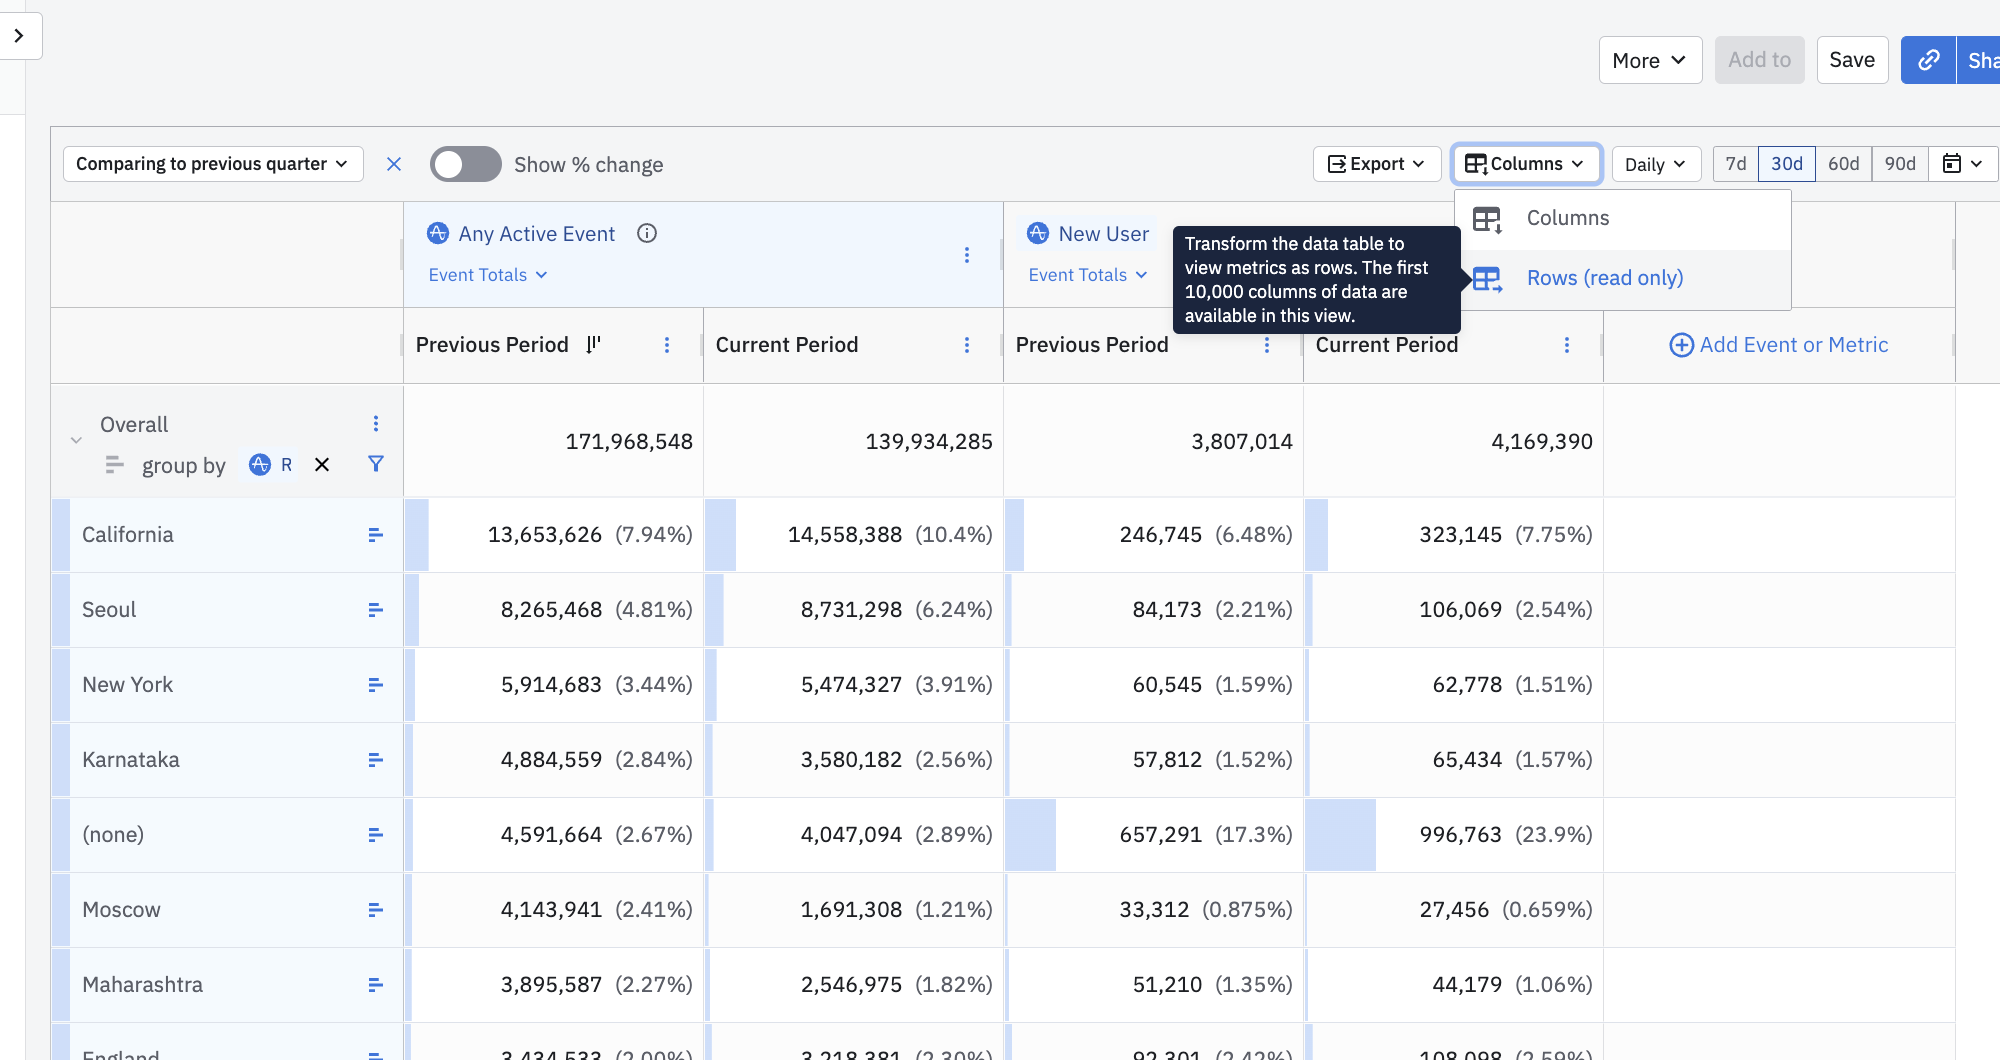
- Comparing time periods across multiple metrics (metric A, metric B, and metric C, broken down by category, compared to last quarter)
Sort columns in ascending or descending order (just click the metric header), drag or resize columns, and highlight, copy and paste any number of cells from your Data Table.
Display limits
Create a Data Table
To create and use a Data Table, follow these steps:
-
Navigate to Create > Chart > Data Table.
-
In the empty Data Table panel, click Add an event or metric and select the event or metric you’re interested in. A new Data Table opens, with your chosen event or metric in the first column. Add more by clicking + Add Event or Metric in the rightmost column in the Data Table.
You can create a new metric at this point, if you need to.
-
To break out your events and metrics by property values—country, for example, or platform, or week—click Select property… in the leftmost column of the table and choose the property you’re interested in.
This runs a group-by on your events and metrics, grouping by the property you selected. You can include up to five top-level group-bys in a single Data Table.
Note
When you do a top-level group by in a Data Table and include a Formula Metric, the results are consistent with measuring by a Formula in Event Segmentation and grouping by an Event property (as opposed to grouping by a Segment in Event Segmentation). -
After you add group-by property, you can run a secondary group-by on that row of your Data Table. For example, you can break your events and metrics out by the
Day of Weekproperty nested withinCountry.Click the Bar icon in the rightmost group-by column and select the property you’re interested in.
Note
When using a time dimension as a group-by property, the time dimension must be the last group-by you add:group by: country, thengroup by: day of week. Adding these group-bys in the reverse order doesn't generate correct results. -
Next, add user segments, if desired. Saved segments are accessible. Multiple segments show up in the table as separate columns within the same metric.
When you're done configuring the data table, there are several options you can use to manage and manipulate your data.
Within any cell, click the Options icon to:
- Open as chart, which opens a new tab with the chosen metric applied;
- Create cohort, which allows you to save the chart's data points as a cohort;
- Copy the data so you can paste elsewhere as needed or export the data as a CSV file.
Within any column header, click the Options icon to:
- Add Filter, which applies a filter to the chosen field;
- Duplicate or remove columns;
- Rename a column for clarity or consistency of your data;
Note
- Save as metric, which allows you to use the metric in other analyses;
- Attribution, which allows you to apply an attribution model to the chosen field or all fields.
- Sort values by low to high (ascending) or high to low (descending).
Using metrics in Data Tables
With Data Tables, including a "-" character in any cells included in your formula's calculation results in an error.
Sometimes, using Uniques as a metric type in combination with group-bys can generate results that appear counterintuitive at first. For example, when you add a group-by to the event in the left column, the total sum for the event (as seen on the top row) isn't a sum of each of the rows below. Because there's a group-by applied to the event, the same user can exist in multiple rows.
The same logic applies to the Session Totals metric. When you add a group-by in the left column, the total number of sessions in the top row can be fewer than the sum of the rows below. This is because the chart counts a session containing property values X and Y under both X and Y groups.
When you add conversion metrics to your data table, the conversion rate displays in the cell. When you add a group-by, the breakdown displays the conversion rate for each grouped value.
Transpose rows and columns
You can transpose columns and rows of a Data Table when:
- you've toggled on a period over period comparison,
- segments exist in your chart definition,
- you've added top-level group-bys to your data table, or
- time properties exist.
Transposing isn't possible if:
- nested group-bys exist
- if the user has unchecked the Absolute numbers
Note
To transpose a Data Table, follow these steps:
- Add events or metrics to horizontal access.
- Add top level group-bys to vertical axis.
- Change the Columns dropdown to rows to flip the axes.

Note
April 1st, 2025
Need help? Contact Support
Visit Amplitude.com
Have a look at the Amplitude Blog
Learn more at Amplitude Academy
© 2026 Amplitude, Inc. All rights reserved. Amplitude is a registered trademark of Amplitude, Inc.