Interpret your funnel analysis
This article helps you:
View and interpret funnel conversions
Track conversions over time
AMPLITUDE ACADEMY
Diagnose Conversion Issues with Funnel and Path Analyses
Analyze your users' movement throughout your product and understand how to improve conversion rates.
Learn Funnel AnalysisAmplitude’s Funnel Analysis chart helps you understand how users are navigating defined paths ("funnels") within your product, and identify potential problem areas where users tend to drop off.
This article describes how the chart area of the Funnel Analysis chart works, and how you should interpret the data it contains.
Analyzing your funnel analysis data takes place in the screen’s lower panel.
Before you begin
If you haven’t already read the overview of Amplitude’s Funnel Analysis chart, you should start with those before continuing.
Interpret your Funnel Analysis chart
Interpreting the Funnel Analysis chart is more straightforward than it may at first appear, mostly because you can read through the parameters like a sentence.
For example, the following chart shows (1) any users who (2) triggered all these events (3) in this order, (4) within one day of triggering the initial event.
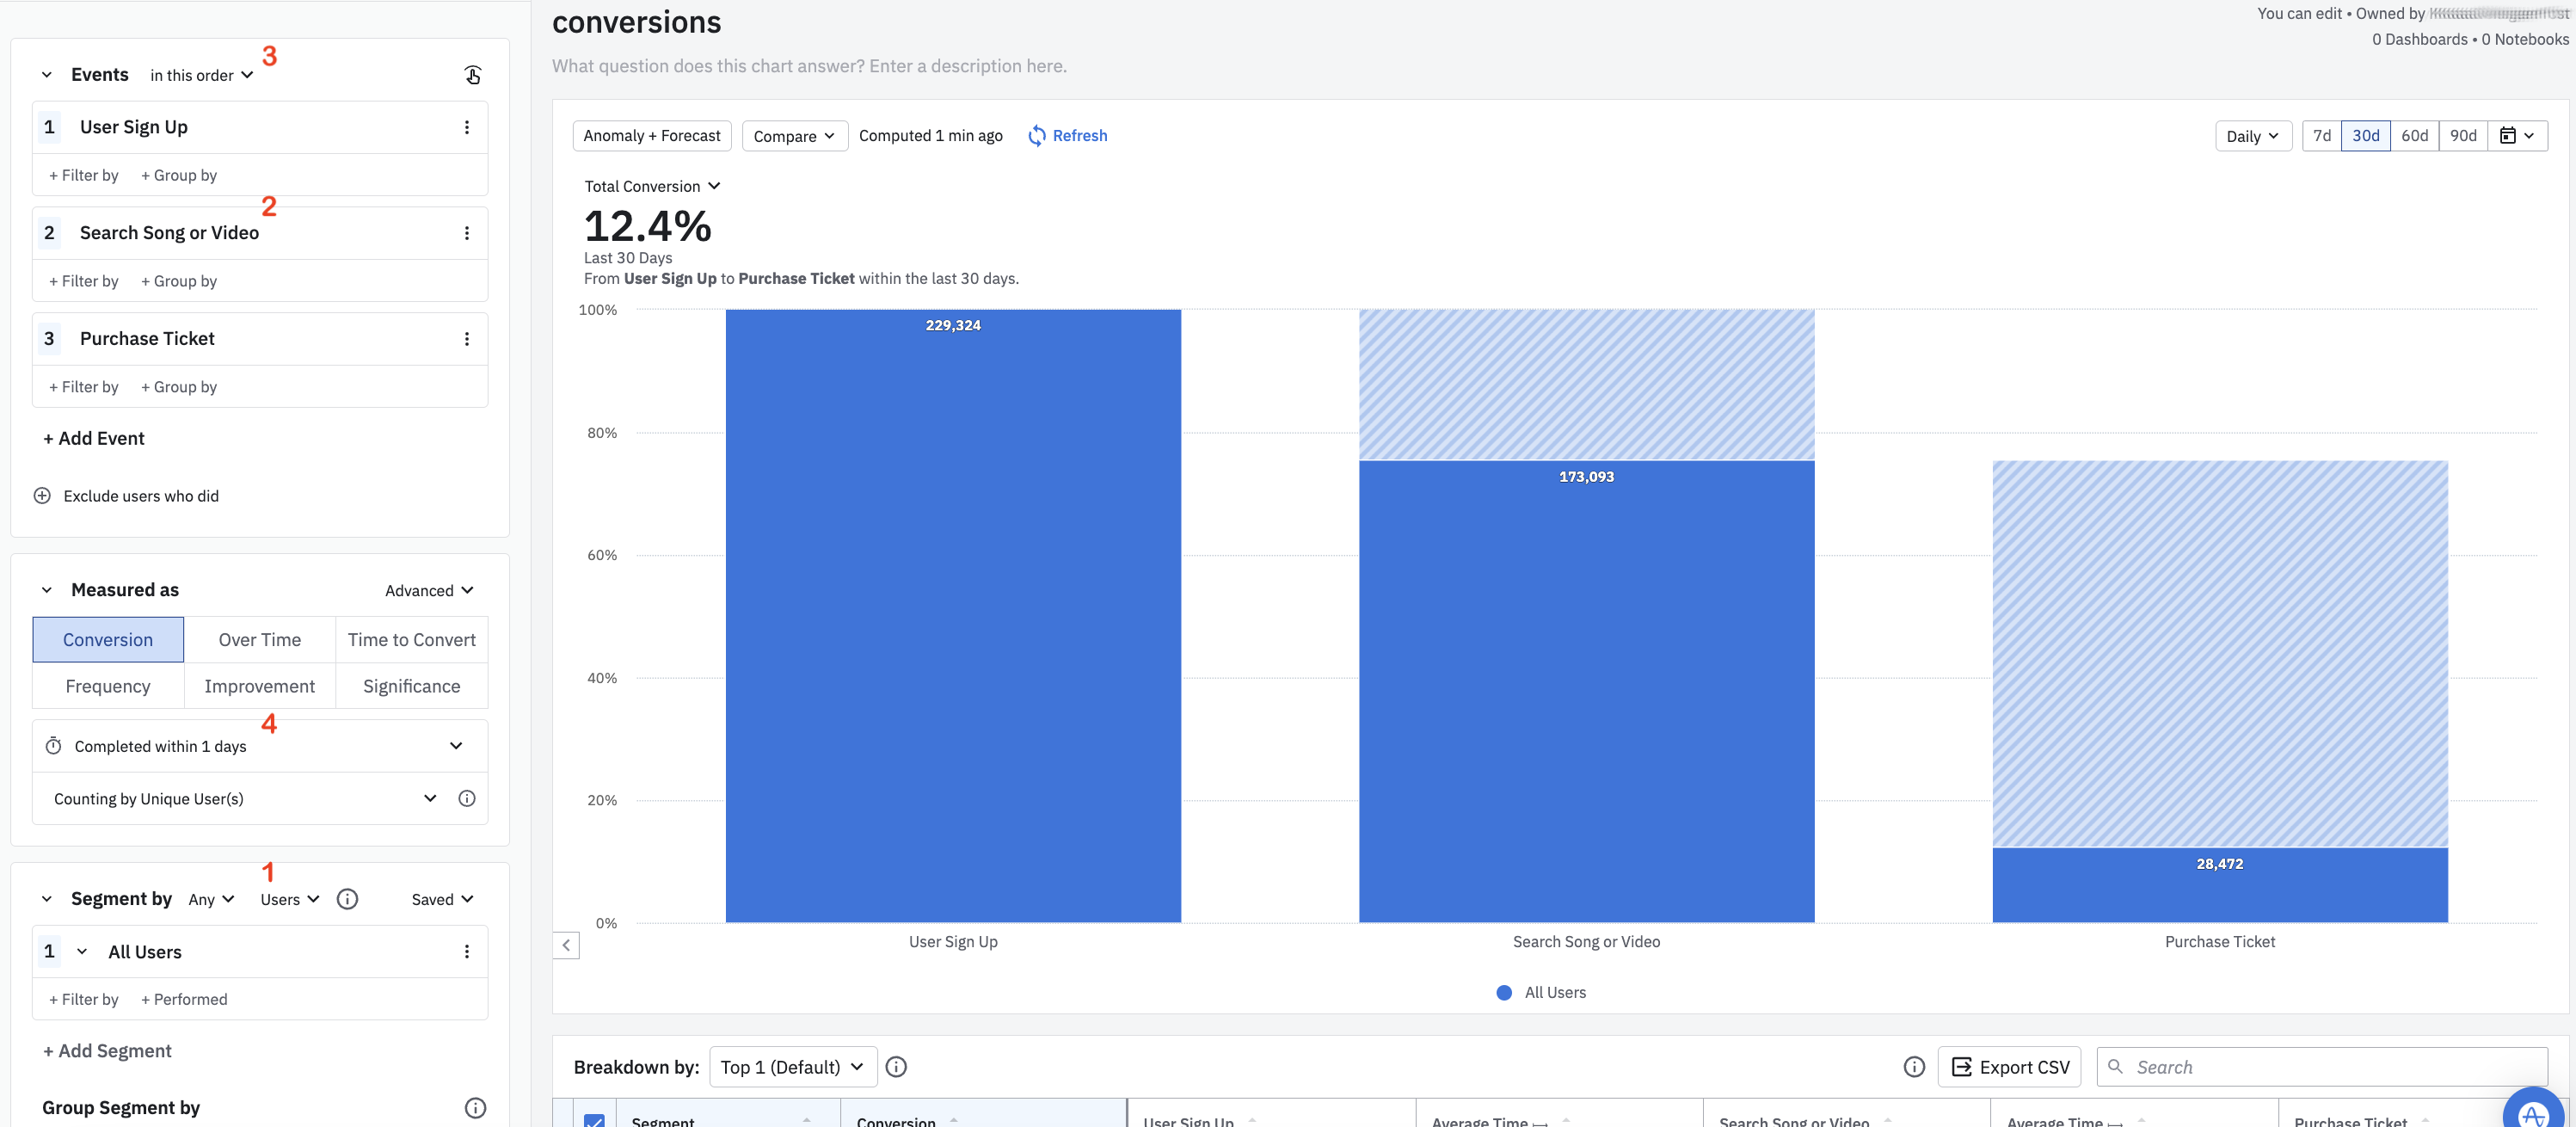
All these parameters, as well as many others, can be easily changed to reflect the needs of your analysis.
You can also specify how the chart describes results (also known as the takeaway) by selecting the appropriate option from the dropdown in the chart's upper-left corner:
- Total conversion: This is a straightforward calculation to determine your funnel's total conversion rate: (Users who triggered every event in the funnel) divided by (Users who triggered the funnel's first event)
- Largest drop-off step: This shows the step with the largest drop-off in conversion. The relevant comparison here is the absolute decrease, and not the percentage decrease.
- Slowest conversion step: This identifies the step in the funnel with the longest median time to transition to the next.
The rest of this section explains the Measured As Module as it applies to a funnel analysis, what all the parameter options mean, and how you can use them to generate the data you want.
Set your time options
Specifying the time frames of your funnel analysis is straightforward in Amplitude.
- ...completed within: This is where you set your conversion window, which is the maximum length of time allowed for a converting user to take between entering a funnel and completing it. The default conversion window is one day (in UTC). This means Amplitude counts a user as converted if they complete the funnel within one day of entering it; any longer than that, and the user isn't counted. The minimum conversion window length is one second, and the maximum is 366 days.
- any day: This applies to new user funnels only. If you select any day from the dropdown, the funnel includes new users who have performed the first step of the funnel at any point in the date range selected.
- their first day: If, in a new user funnel, you select their first day instead, this restricts the funnel to users who fire the first event (and thus enter the funnel) on the first day they appear in Amplitude (their new user date).
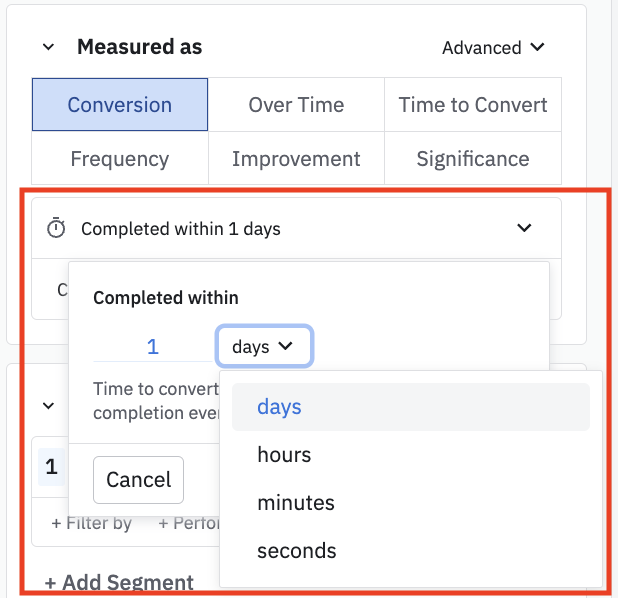
By default, Amplitude assumes events aren't triggered within one second of each other. However, in some situations—like when you have multiple events firing at the same times—you may need a more detailed level of time resolution. In these cases, Amplitude can resolve events on a per-millisecond level.
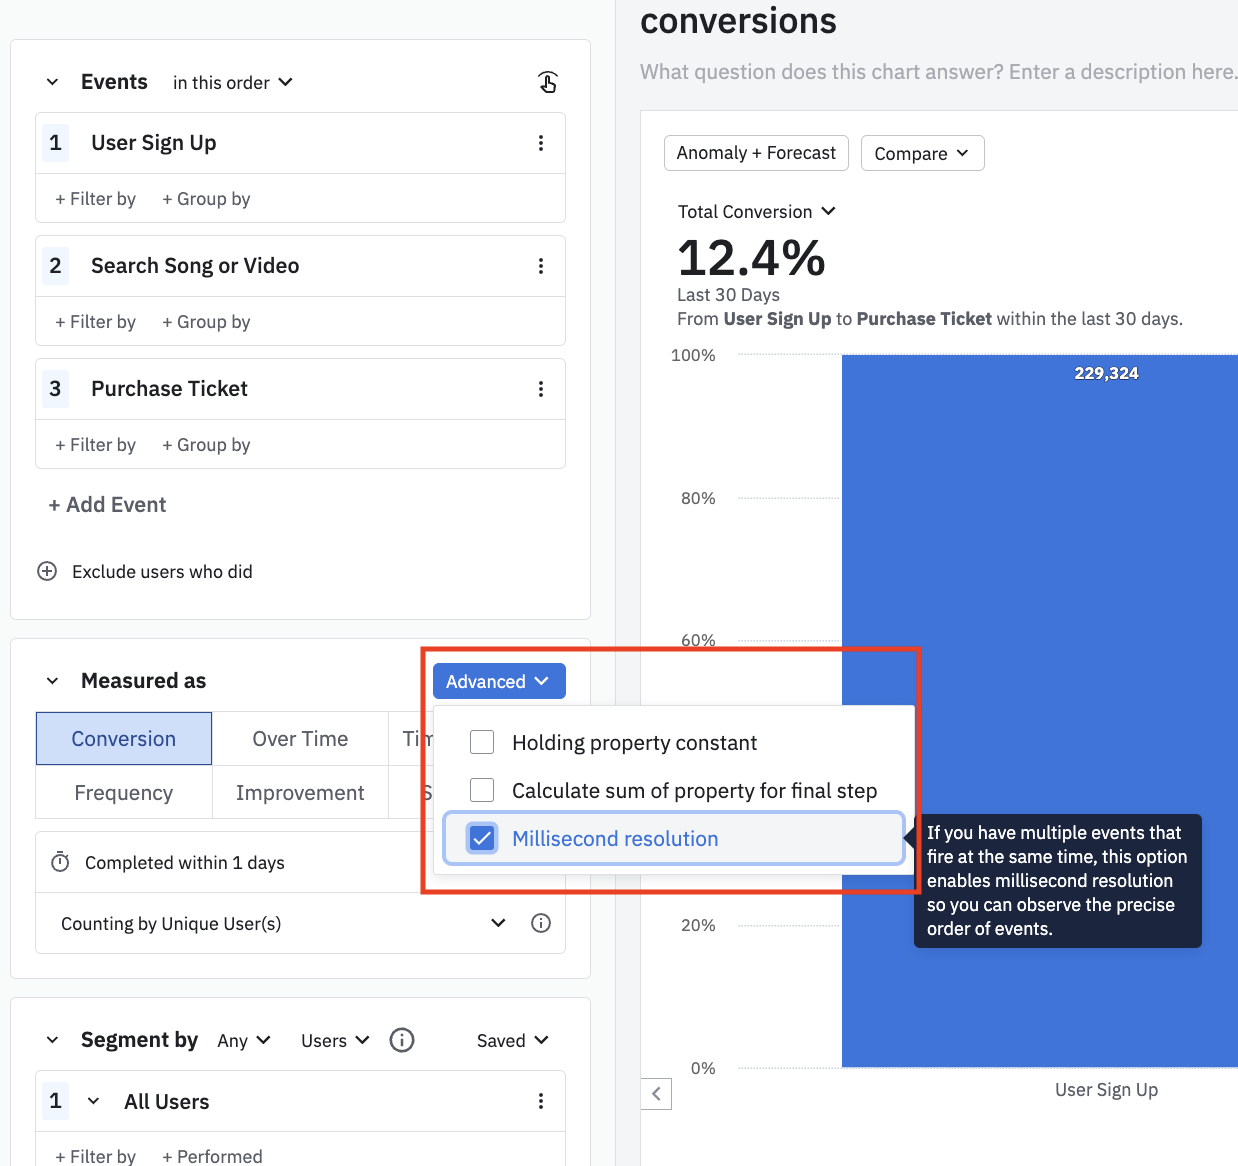
Simply check Millisecond resolution in the Advanced drop-down.
Note
Conversion
The default option for a Funnel Analysis chart, the Conversion graph is a bar graph detailing the number of users who have clicked through to each step of the funnel.
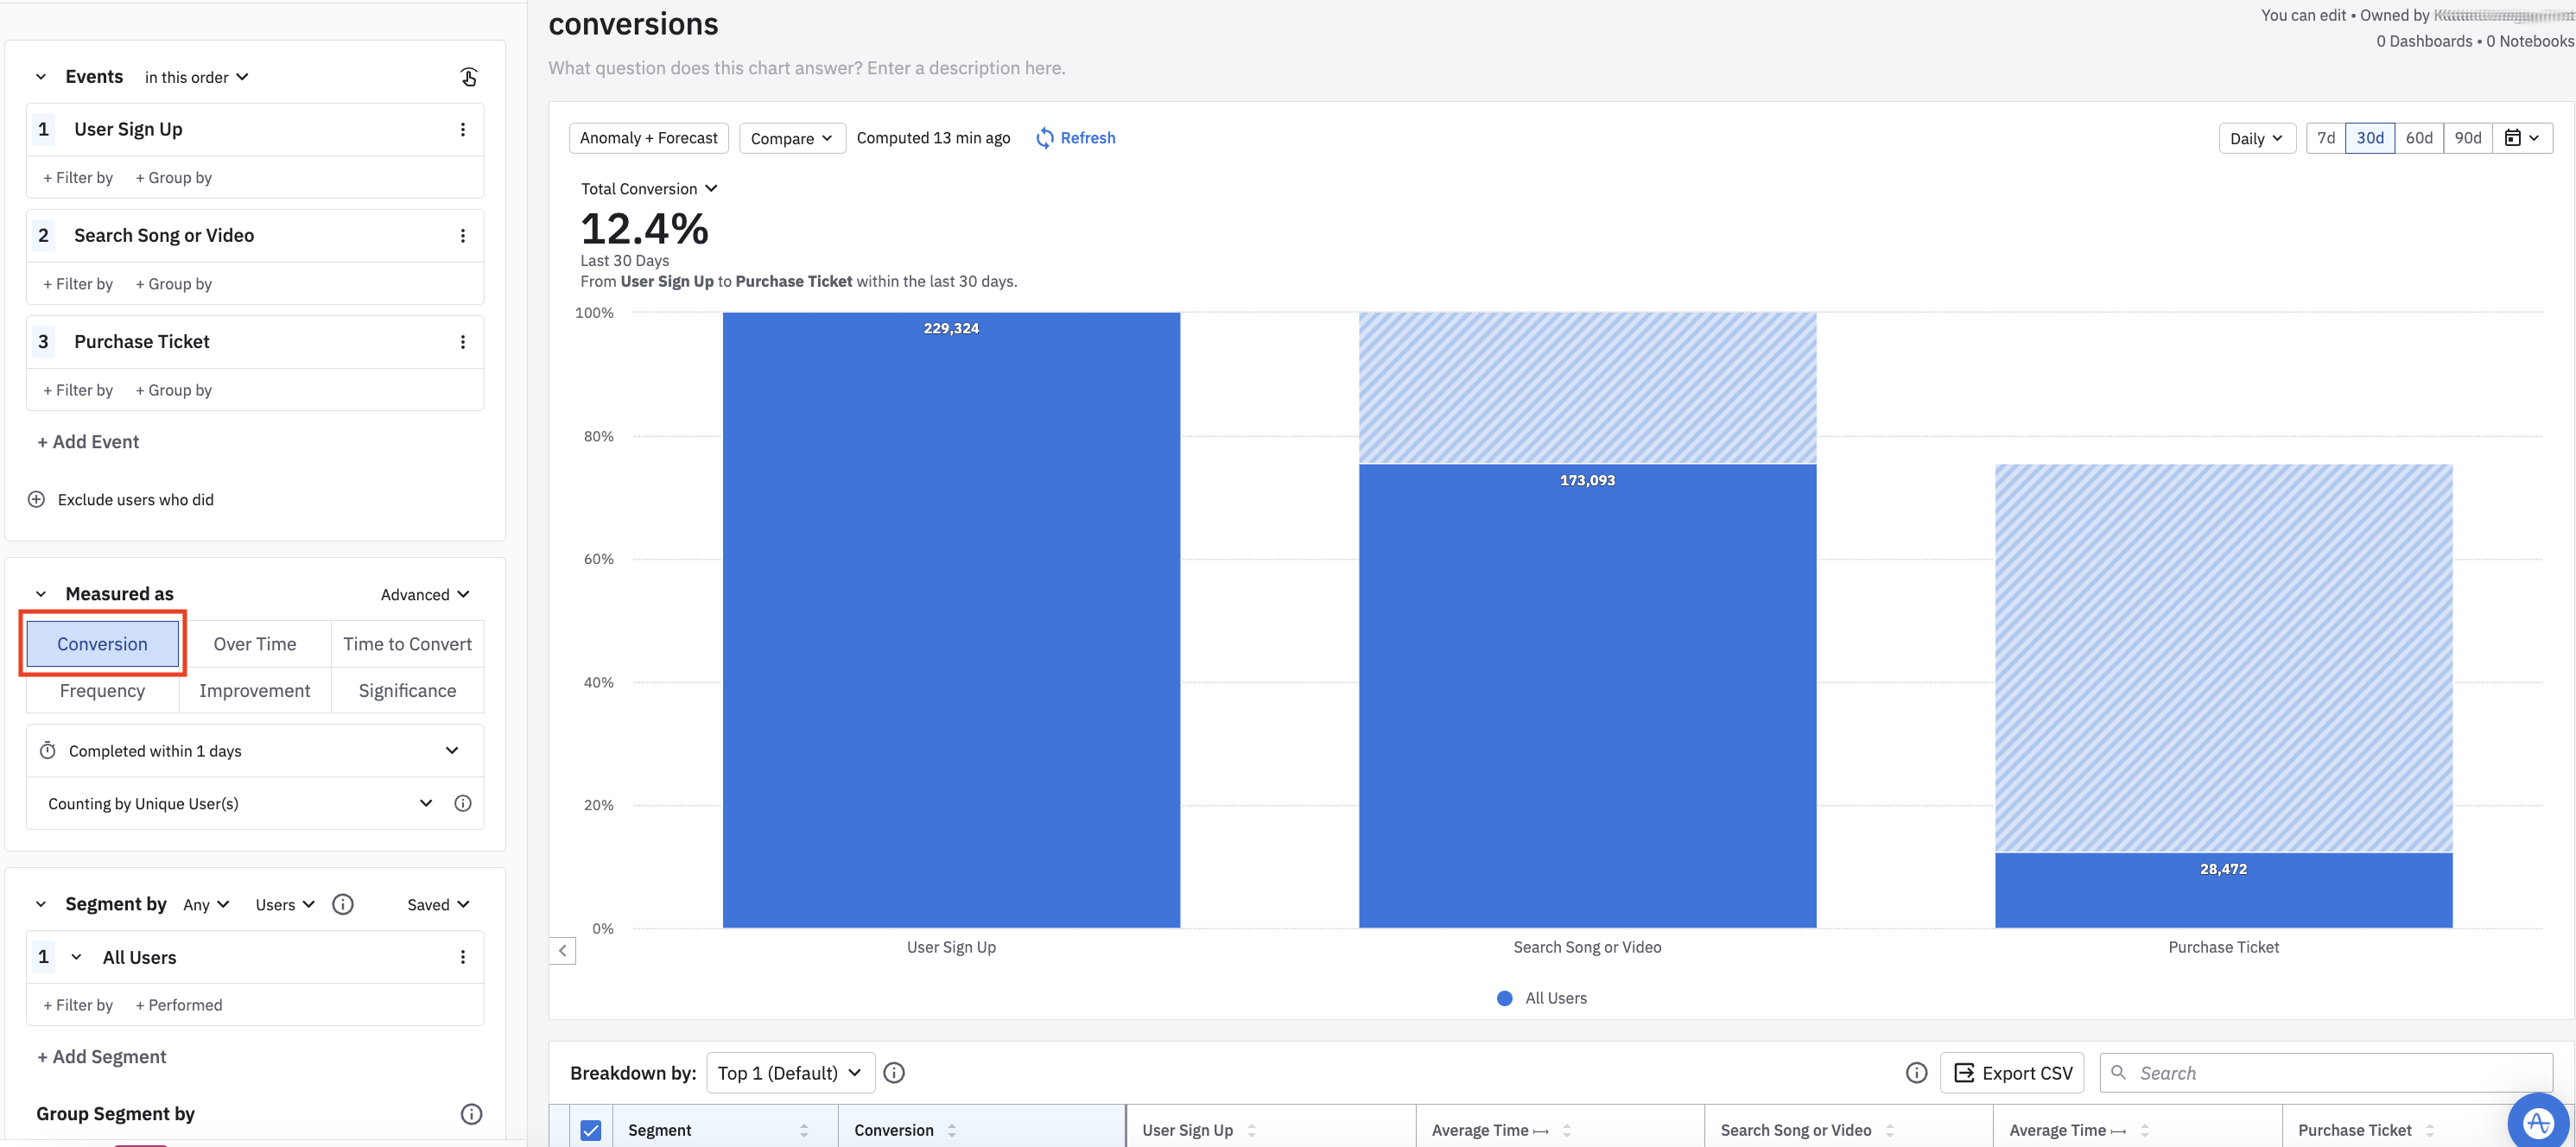
In this chart above, we see that there were 229,324 users who triggered the event User Sign Up in the last 30 days. Of these, 173,093 triggered Search Song or Video within one day of viewing an item's details. And 28,472 of the original group of users triggeredPurchase Ticket within one day of User Sign Up.
Not only does the bar graph show the number of users who converted at each step, it also shows the number of users who dropped off at a particular step of the funnel. The former are displayed by the solid regions of the bars, while the latter are represented by the striped areas on top.
The tabular view of the data, which is directly below the chart, offers some additional context:
- Conversion: The percentage of users who successfully completed the entire funnel.
- [Event name]: The number of users who complete that step in the funnel. The first step is always 100% because a funnel only includes users who triggered that first event.
- Average Time: The average time it takes users to move from one event to another event in the funnel, based on the time of users' first conversion.
Note
You can also opt to count conversions by event totals instead of unique users:
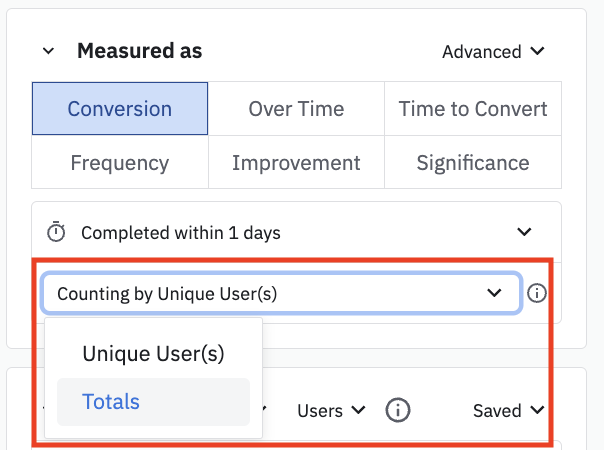
Conversion over time
The Conversion Over Time graph shows conversion rates for users who entered the funnel on a specific date. If, for example, a user enters a funnel on January 1st and then converts in the funnel on January 5th, they're counted in the bucket for January 1st, since that's when they first entered the funnel.
The percentages seen here are conversions per unique user, per day/week/month. For instance, if a user enters the funnel by firing the first step on both July 1st and July 2nd, and completes the funnel within 30 days of both dates, that user is counted in the conversion percentages for both July 1st and 2nd.
This graph can also show you the conversion rate between funnel steps. Users don't need to complete the entire funnel to be included in this analysis—instead, they need only complete all the steps up to (and including) the last step you're interested in.
For an example, consider the following chart:
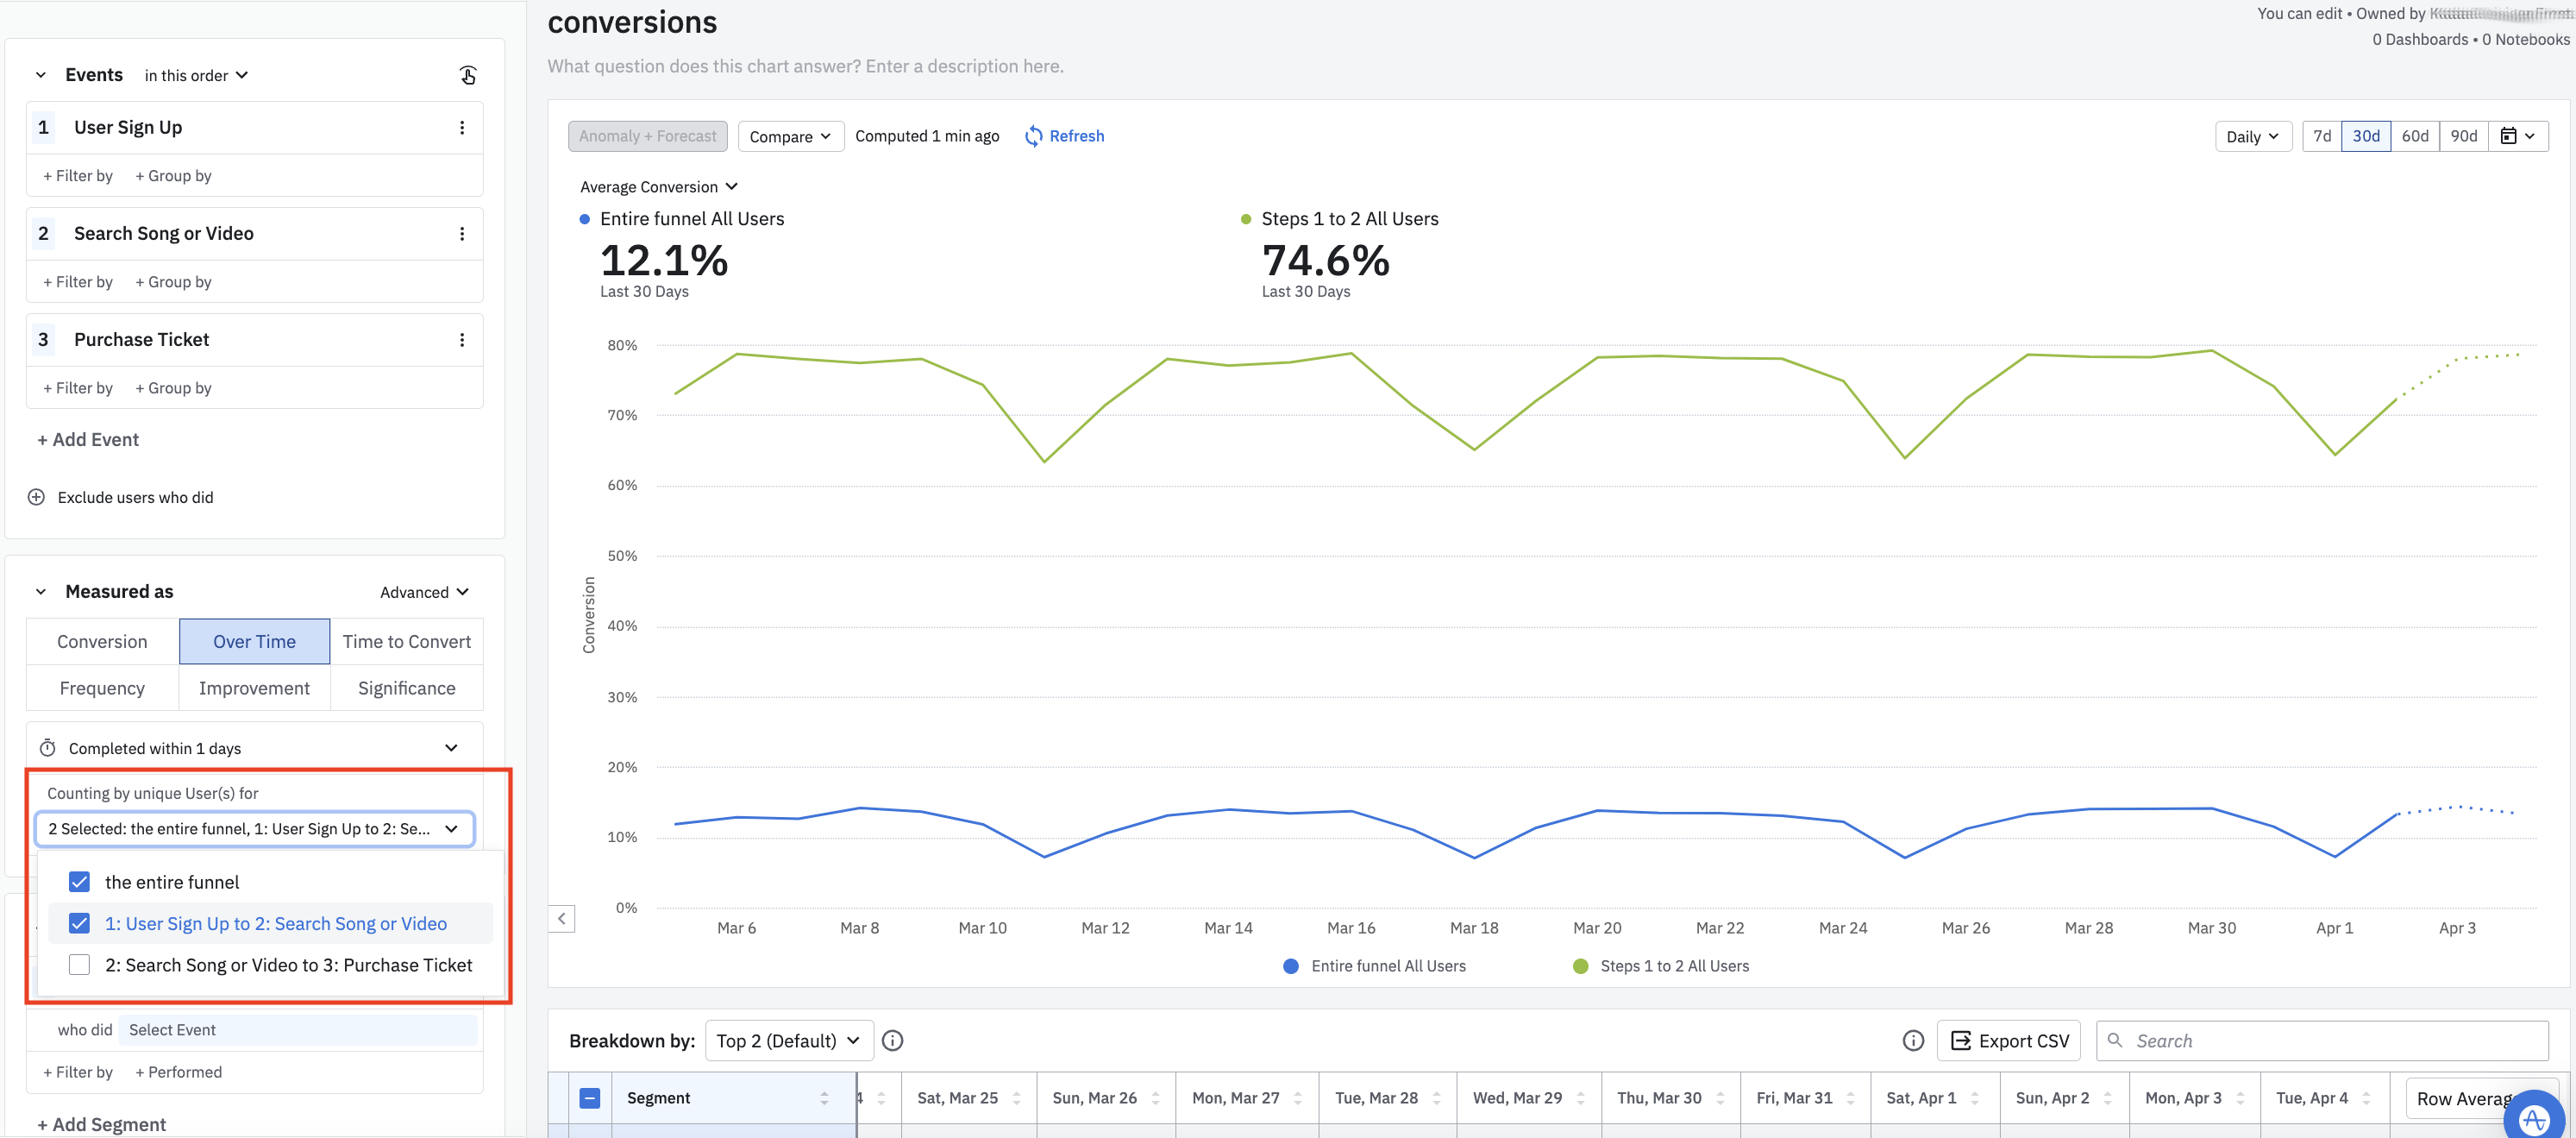
Within this three-step funnel, Amplitude lets you look at conversion rates across the entire funnel, between any two steps in the process (in this example, step 1 to step 2, or step 2 to step 3), or between two pairings of steps (step 1 to step 2, and step 2 to step 3). If you were to select 1: User Sign Up to 2: Search Song or Video , all users who completed those two steps would be included, regardless of whether or not they completed step three.
Amplitude displays conversion graphs for each selection in the Measured As Module below, as shown in the screenshot above.
If this were a four-step process, conversions from step two to step three would include all users who completed the first three steps of the process, regardless of whether they completed the fourth. Users always must enter the funnel at the first step to be included.
Note
Time to convert
Time to Convert shows you how long your users take to move from one step in your funnel to the next, displaying the data as a histogram.
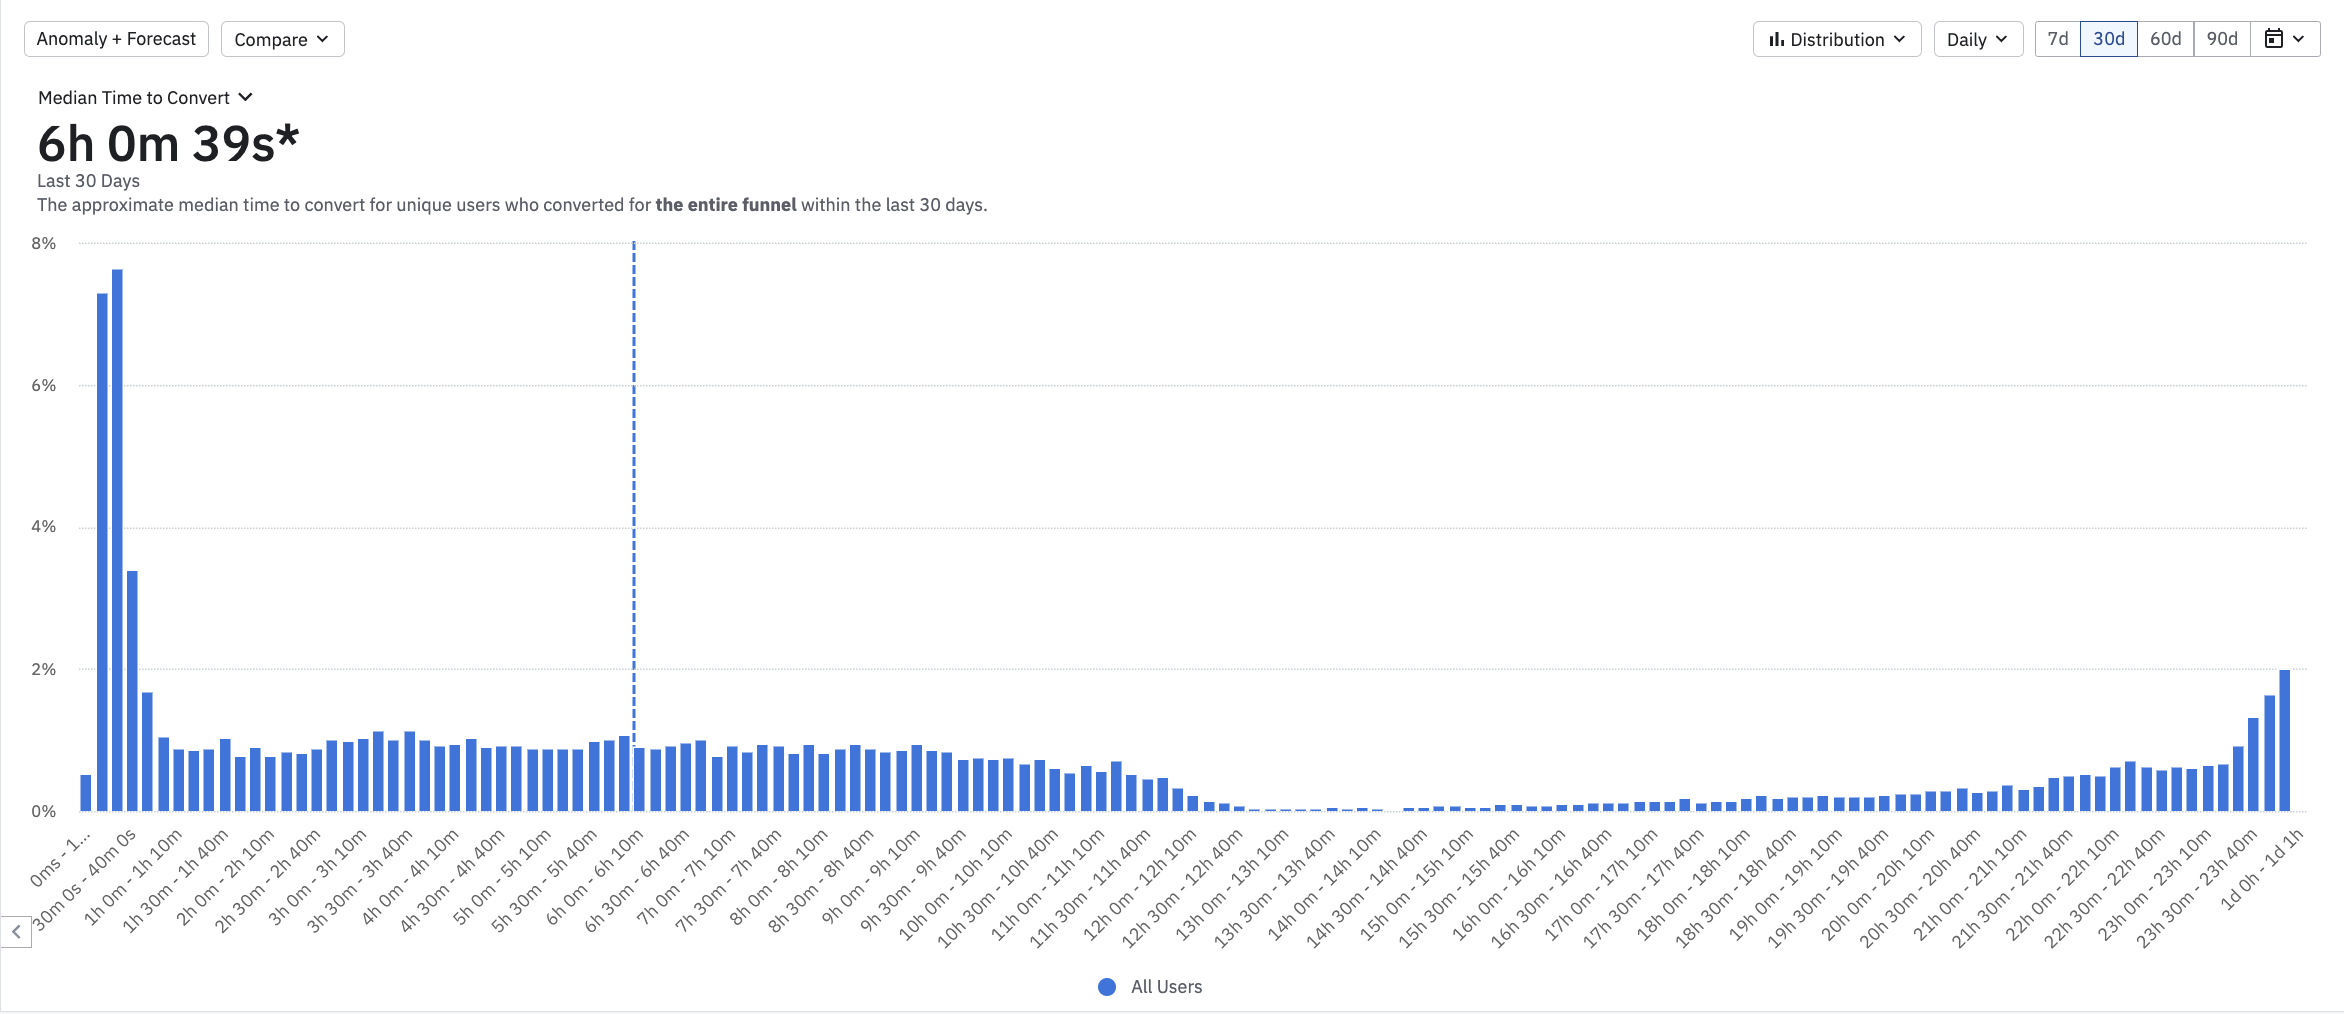
Amplitude automatically chooses a bucket size (1 second, 10 seconds, 1 minute, 10 minutes, 1 hour), depending on the conversion window and lookback window you select. The median time to convert shown is for the entire funnel.
The percentages on the vertical axis represent the ratio of users who converted within a particular interval, relative to the number of all users who converted within the selected time range.
If you need to, you can also create custom buckets:
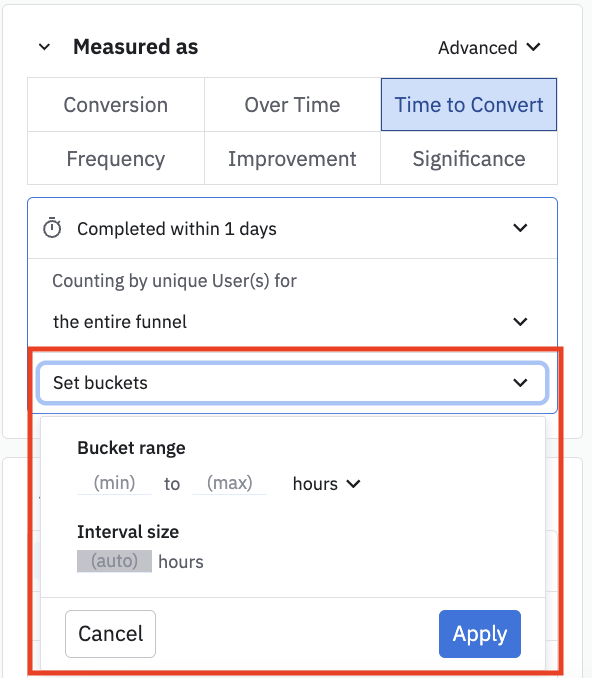
If you create custom buckets, the percentages returned are calculated using only users who fall between the min and max values for your bucket.
Note
You can also switch from a histogram view to a new time series, depicting how median time to convert changes over time. Click the Distribution drop-down and select Over Time.
While the default scope of a Time to Convert graph is the entire funnel, you can also limit it to any two consecutive steps in your funnel, as described in the previous section.
Frequency
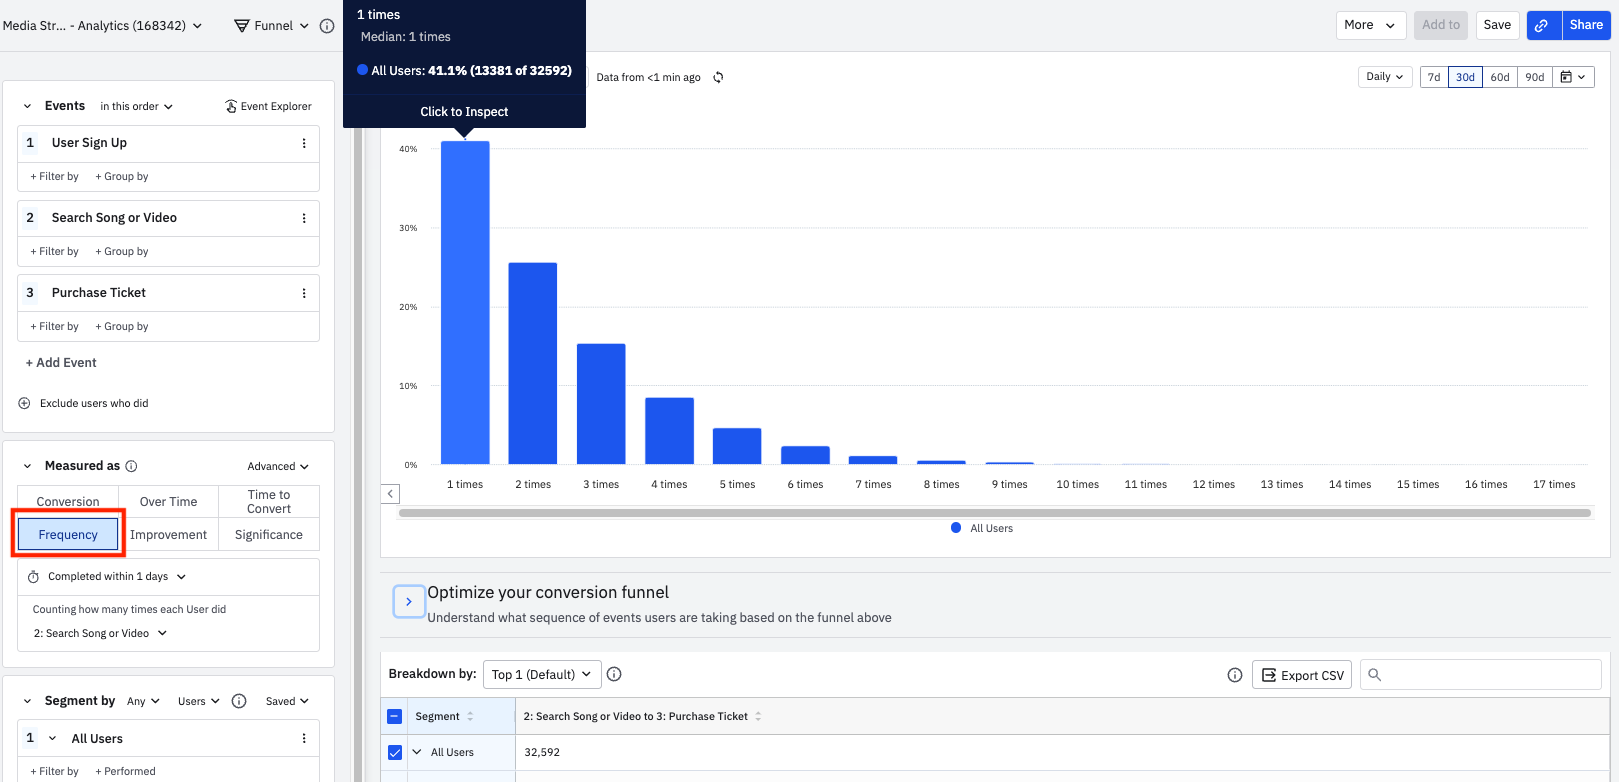
The Frequency chart helps you get a sense of of the number of times users in your funnel trigger one event before triggering another specific event for the first time. You can choose the two events you want to analyze in the Measured As Module, as shown in the screen shot below.
For example, in the below chart we see that 41.1% of all users performed the Search Song or Video event only once before purchasing a ticket within a one-day period.
April 1st, 2025
Need help? Contact Support
Visit Amplitude.com
Have a look at the Amplitude Blog
Learn more at Amplitude Academy
© 2026 Amplitude, Inc. All rights reserved. Amplitude is a registered trademark of Amplitude, Inc.