Interpret your Personas chart
This article helps you:
Interpret your cluster cards
Identify and name your personas
The Personas chart will help you identify and name user clusters, which can then be used to drive engagement and retention.
Interpret your cluster cards
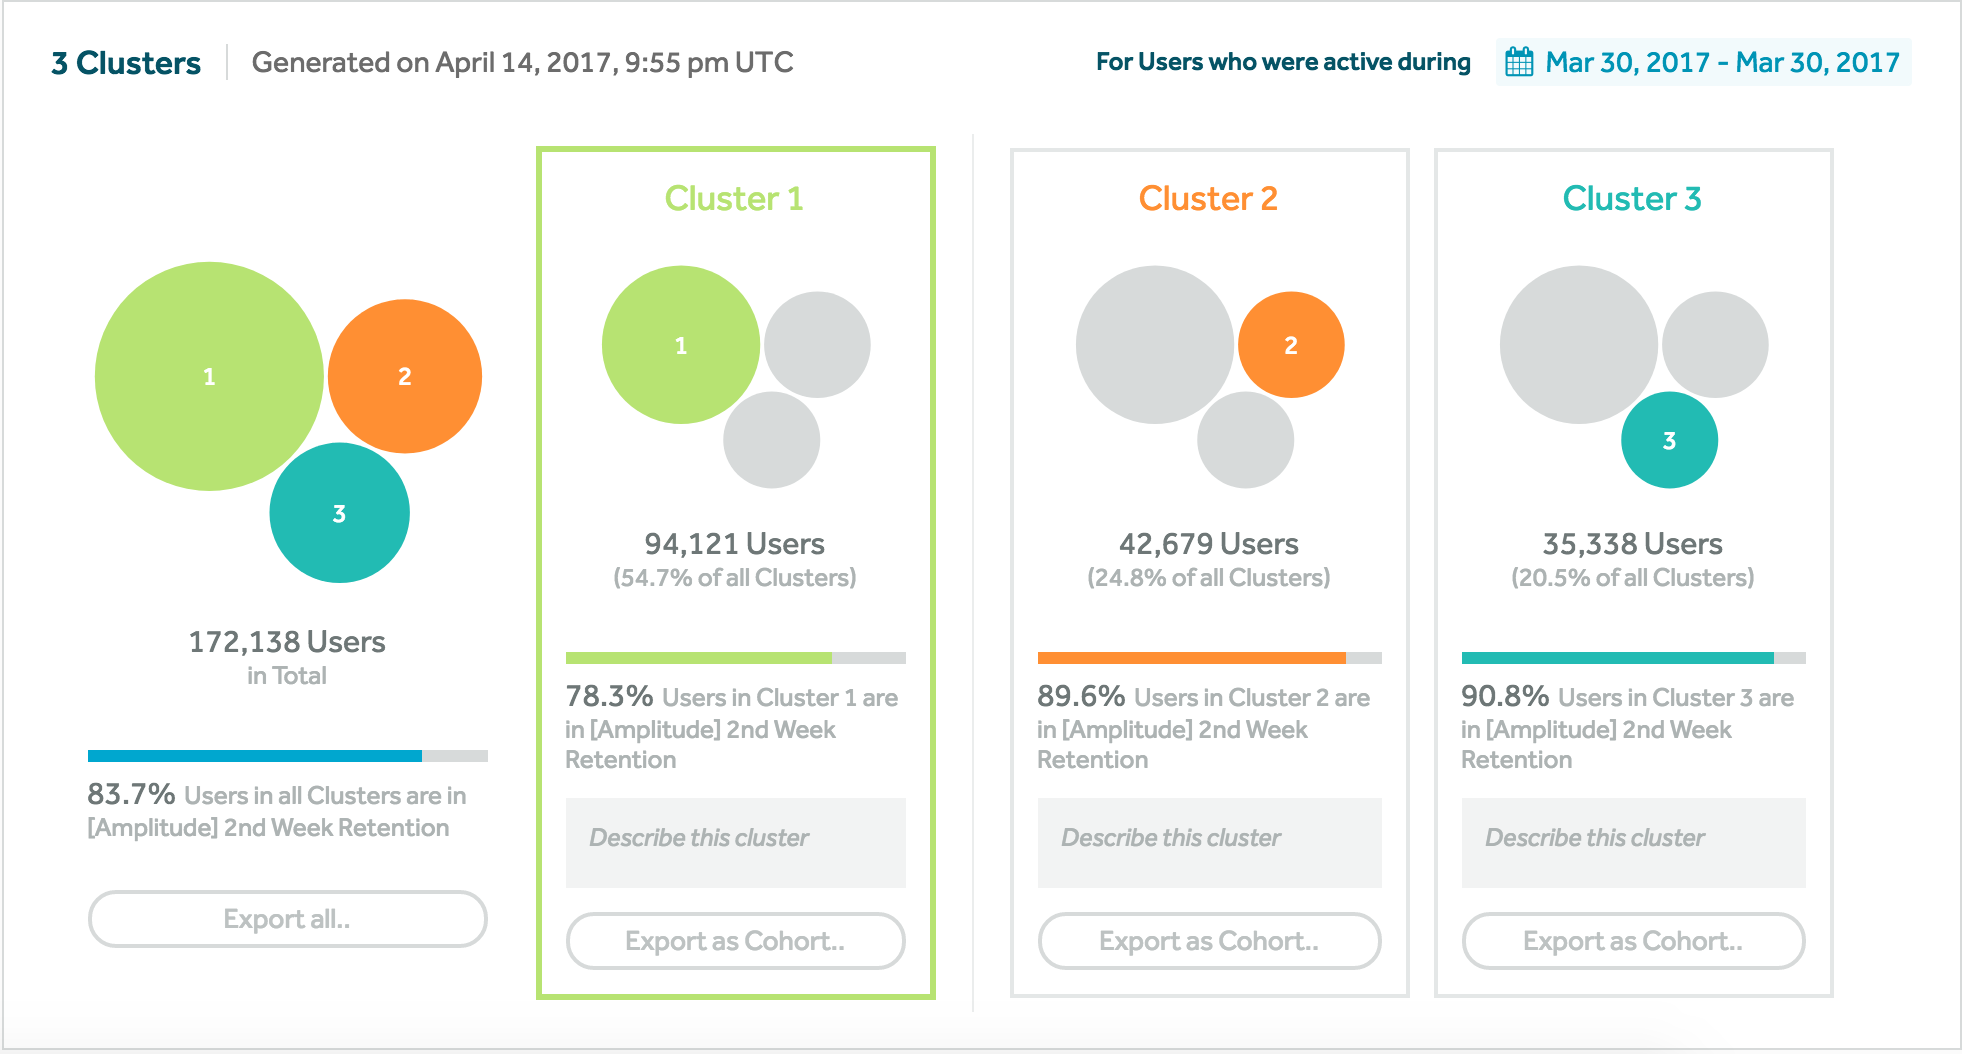
The first section of a Personas report is the cluster cards. Here, we've generated a Personas report with three clusters.

Each card consists of:
- A small bubble chart, where the size of a cluster's bubble represents the proportion of users in the specific cluster
- The count of users in the cluster, as well as the cluster's size relative to all other clusters (expressed as a percentile)
- The percentage of users in the cluster who are also in the target cohort
- An editable description field (we recommend describing your clusters)
- The option to export the cluster as a behavioral cohort
Identify and name your user personas
The cluster cards offer an excellent overview, but the real details are all found in the event table below them. This is where you'll be able to uncover the similar behaviors that hold each cluster together, and that will serve as the basis for their possible user personas.
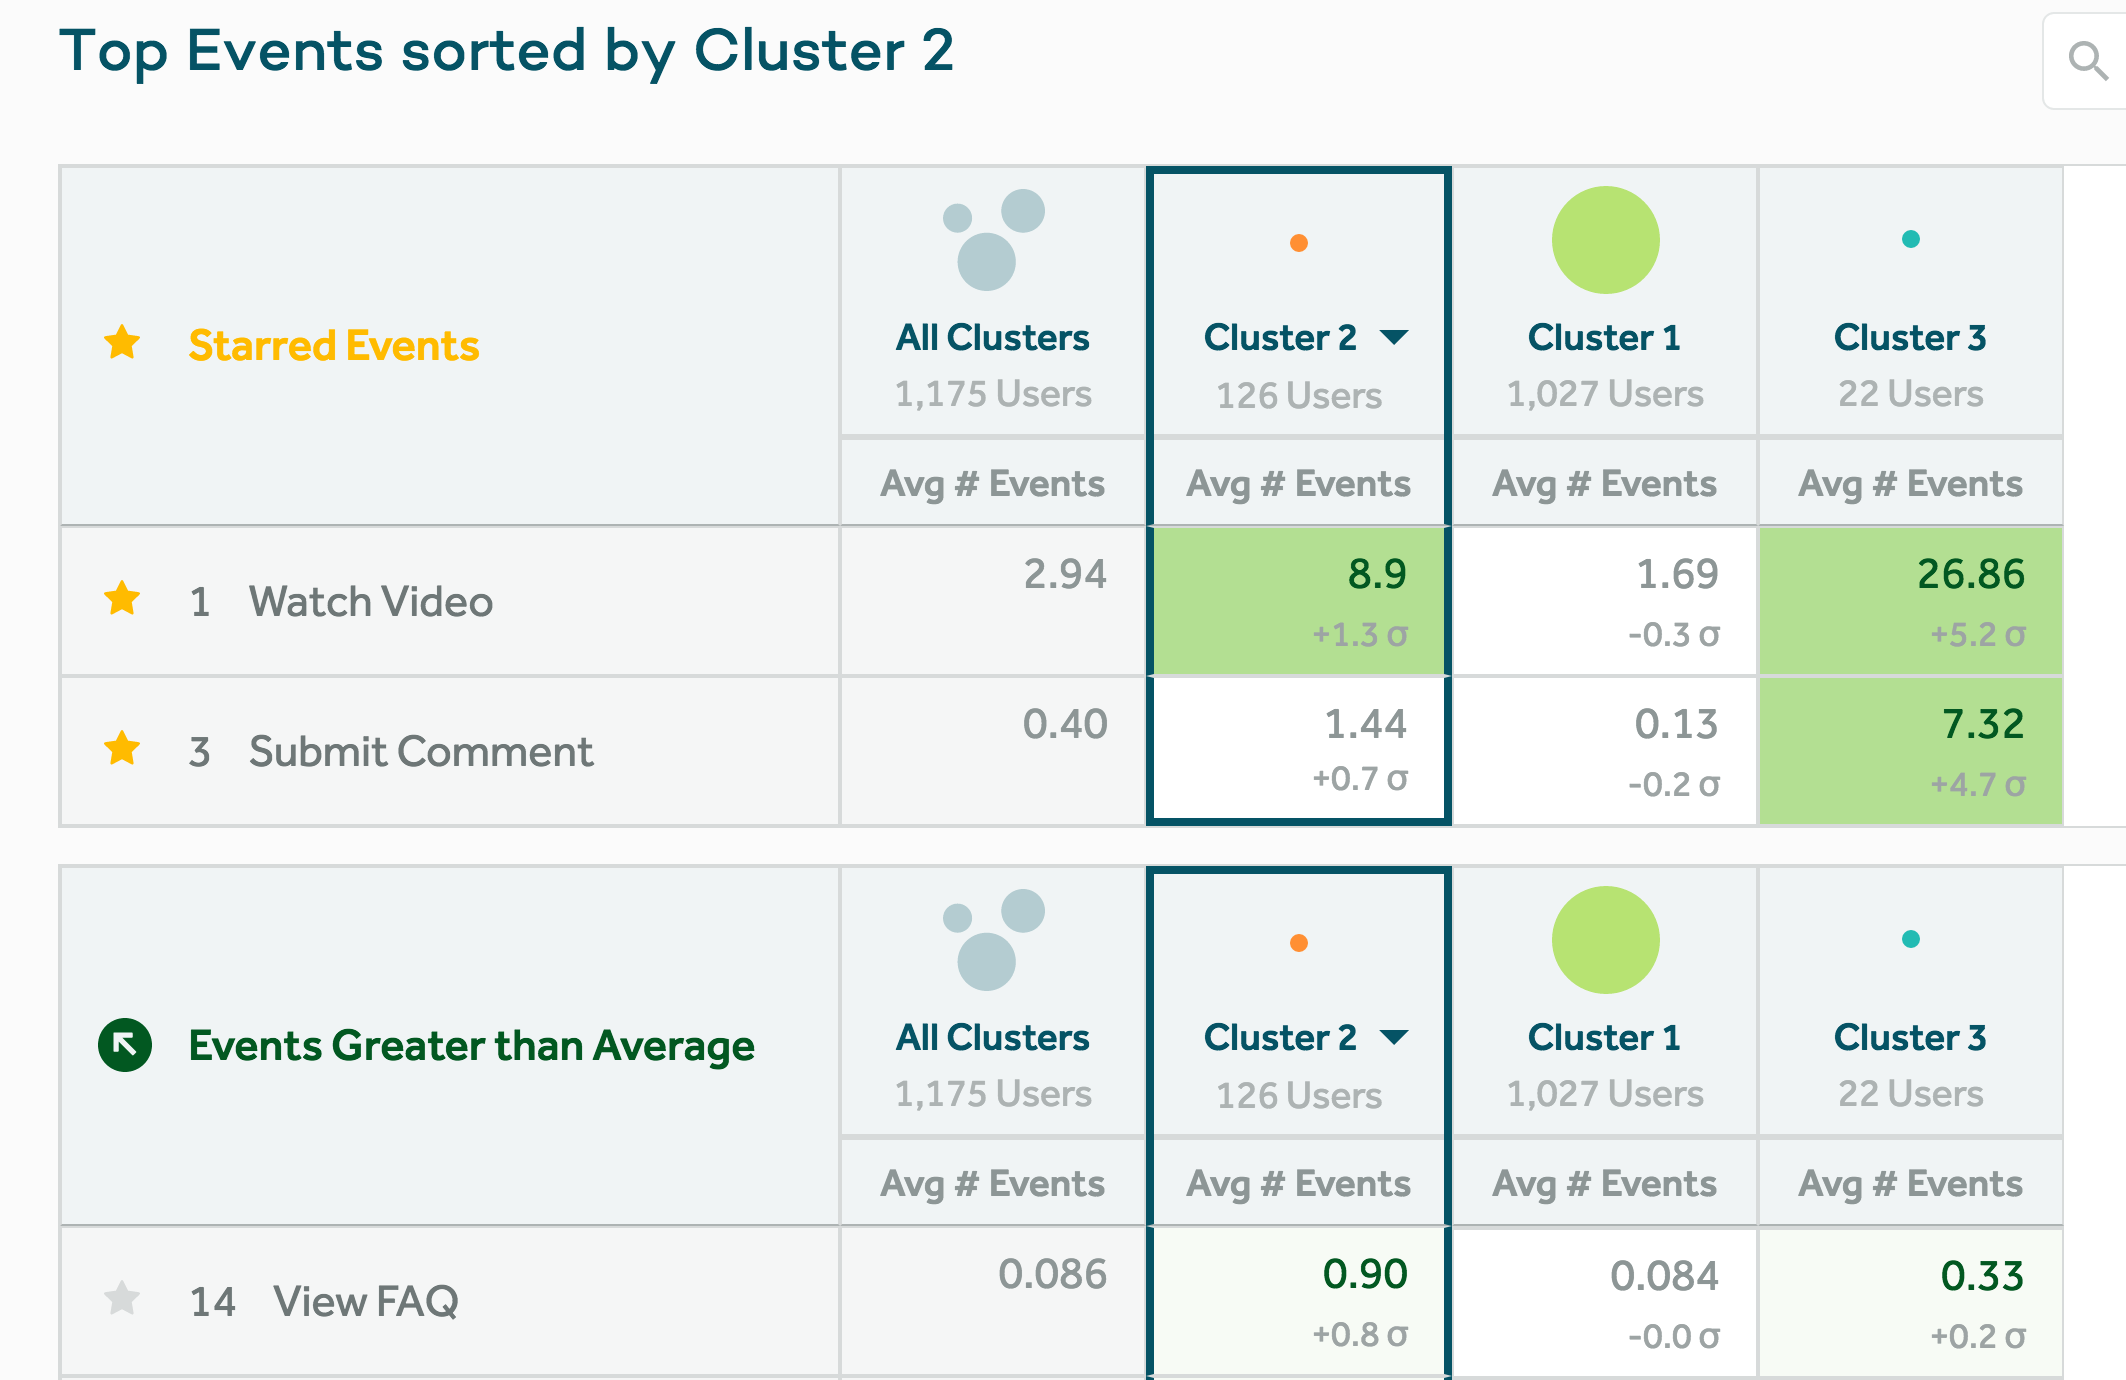
The table displays a list of events, along with two metrics for each cluster:
- Average # of Events: The average number of times a specific event is triggered by users in cluster N.
- Standard Deviation (σ): The standard deviation from the mean of the event. Standard deviation numbers are rounded to the nearest decimal point (e.g. -0.01 is rounded to -0.0).
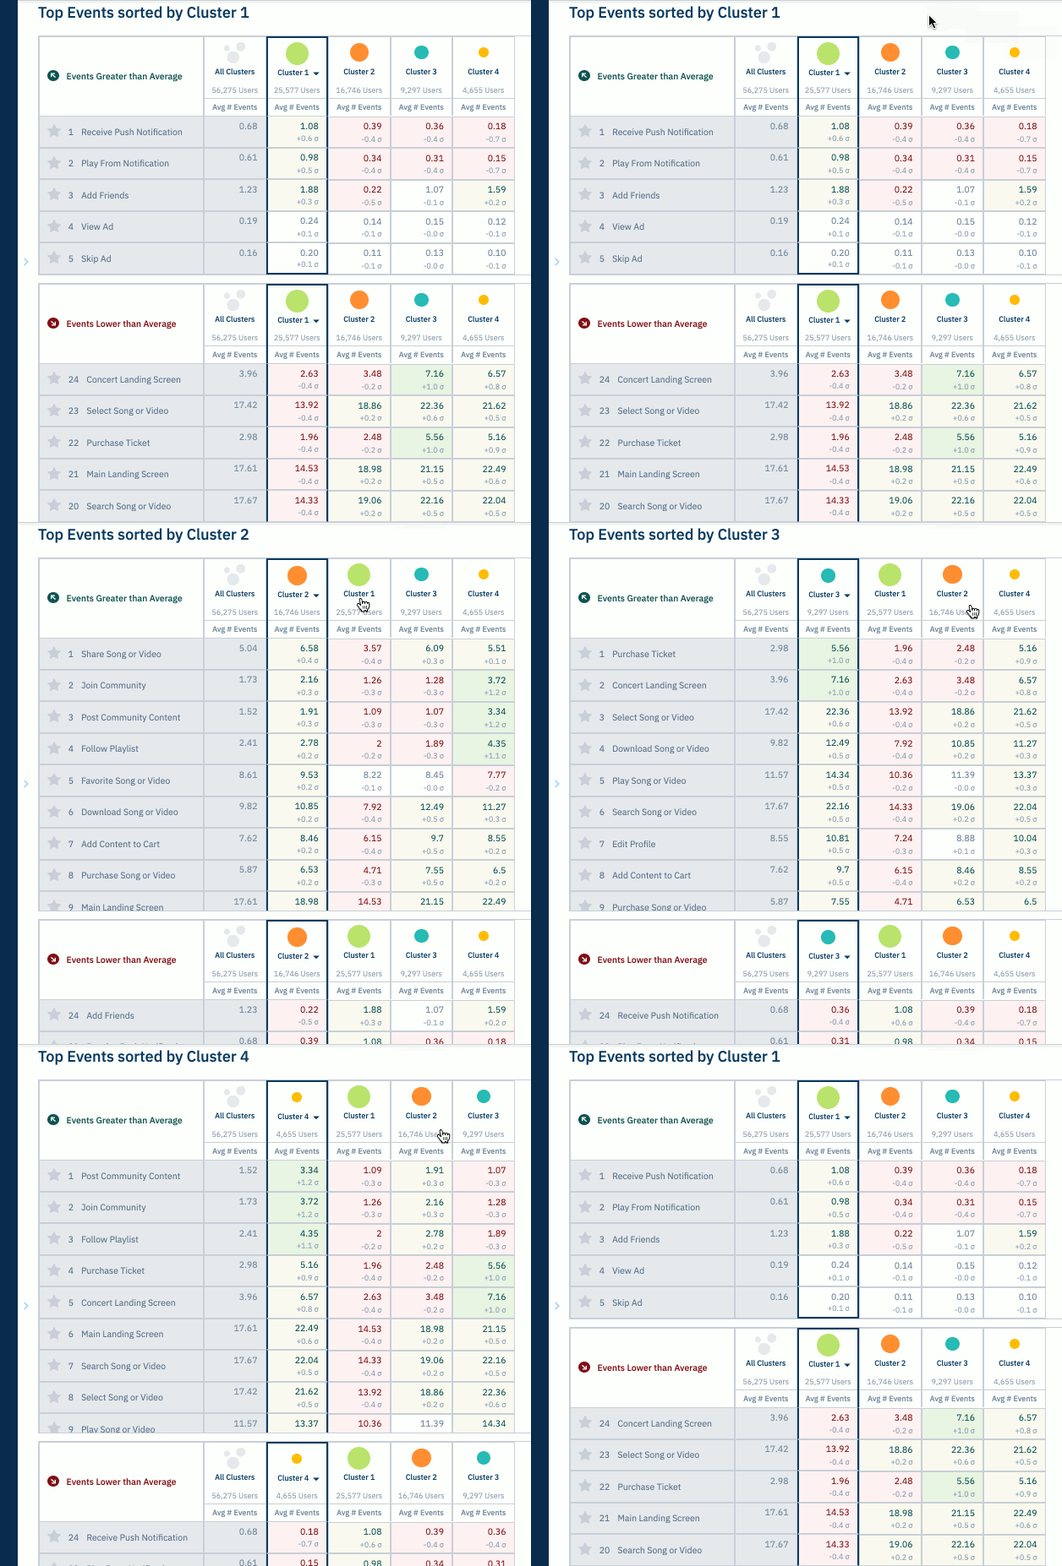
The table is actually divided into two halves. The top half contains events users in your selected cluster triggered more frequently than average, while the bottom half contains events those users triggered less frequently than average. You can sort these tables by any cluster, simply by clicking on the cluster you're interested in.

Notice that whenever you choose a new cluster to use for sorting the table, the lists of events changes as well. That's because each cluster should exhibit a different pattern of behavior within your product, which means they'll almost certainly be firing events at different rates from each other.
In the table shown below, we see that Cluster 3 is more likely to both watch a video and submit a comment than the average user.

The event table should help you answer the question: "Am I confident I selected enough clusters to do a good job of grouping my users into different personas?" If your answer is no, you should try different cluster quantities. If your answer is yes, then give your clusters appropriate descriptions and save your report.
Hide events
If there are events you still wish to track but do not want to visualize in your Personas reports, you can hide them in your tracking plan. Amplitude clusters over the top 100 events, so if you mark one of those events as hidden, it will no longer count in the calculation.
May 30th, 2024
Need help? Contact Support
Visit Amplitude.com
Have a look at the Amplitude Blog
Learn more at Amplitude Academy
© 2026 Amplitude, Inc. All rights reserved. Amplitude is a registered trademark of Amplitude, Inc.