Interpret your Compass chart, part 2: Correlation and cohorts
This article helps you:
Understand correlation and why Compass uses it
Create a cohort from your Compass chart results
This article explains correlation and how it applies to your Compass chart, and how to create a cohort from its results. See Interpret your Compass chart, part 1 for a breakdown of how to read and interpret a Compass chart.
Understanding correlation
Correlation is a measure of how two statistical variables relate to each other. Possible values range from -1 to 1, with a score of zero indicating there is no statistical relationship between the variables at all. A score of one indicates perfect positive correlation, while a score of -1 indicates perfect negative correlation.
Amplitude categorizes correlation scores like this:
- Highly Predictive:
|correlation| >= 0.4 - Moderately Predictive:
0.3 <= |correlation| < 0.4 - Slightly Predictive:
0.2 <= |correlation| < 0.3 - Not Predictive:
|correlation| < 0.2
In a Compass chart, the two variables to be correlated are:
- Did the user trigger the event in question at least a certain number of times; and
- Was the user retained in the target cohort?
You may have heard of different variations and definitions of correlation. Well-known examples include Matthews correlation, Pearson correlation, phi coefficient, and R-value. In this case, all these different methods generate equivalent results, because Compass looks at pairs of binary random variables.
Remember, correlation isn't causation, so you should still test and verify any hypotheses you form from a Compass analysis.
Note
Why is correlation a good metric to use here?
When you're looking for that one metric that captures your users' "a-ha" moment, you want one where most users above a certain threshold go on to be retained, and most users below the threshold end up not being retained. Such a metric would have a threshold with a good positive predictive value (PPV).
However, you also have to consider is how easy it will be to move users across that threshold. If you find a threshold with a very strong PPV and NPV, but discover that it's very difficult to move users across it, that metric will not be of much help in growing your user base. A tell-tale sign of this would be if few of your users have crossed the threshold, or almost all of your users have already crossed it. This isn't always the case, of course—but in the absence of more specific information, it's generally a good assumption.
That's why Compass uses correlation to locate these thresholds: correlation accounts for PPV, NPV, and the proportion above the threshold. If the PPV is higher, the NPV is higher, or the fraction of users above the threshold is closer to 50%, then the correlation will also be higher. Likewise, if the PPV is lower, the NPV is lower, or the fraction of users above the threshold is further from 50%, then the correlation will be lower.
Note
Create a cohort from your results
You can create a cohort from your results by clicking Create Cohort. Then Amplitude will automatically compare their retention to new user retention.
This comparison is based on Any Active Event, and not simply Any Event.
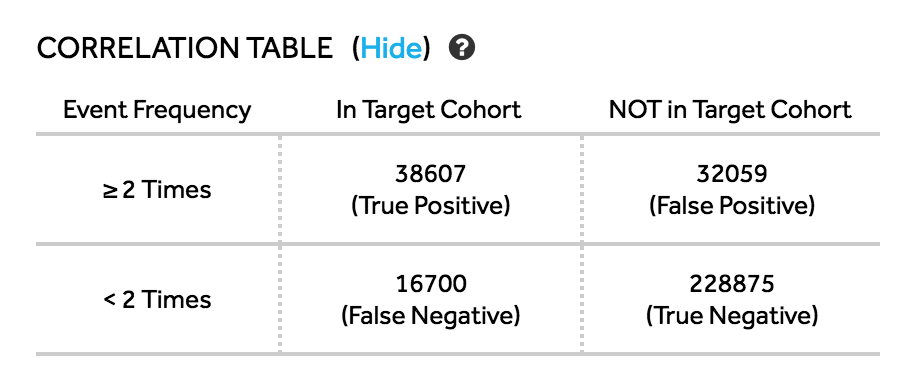
Clicking Show (next to Correlation Table) will bring up a detailed contingency table that shows the count of users in your base cohort in each of four categories: true positives, false positives, false negatives, and true negatives.

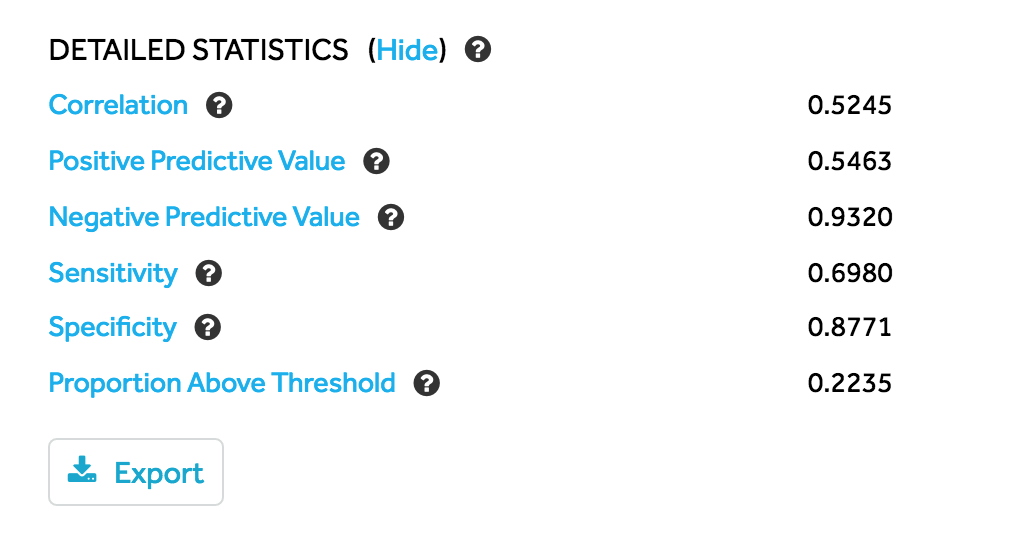
Likewise, you can see detailed statistics on your cohort by clicking Show (next to Detailed Statistics):

You can read more about these statistics here.
Next, be sure to read the Help Center article on how to use Compass to identify the moments in the user journey that are critical to driving growth.
May 30th, 2024
Need help? Contact Support
Visit Amplitude.com
Have a look at the Amplitude Blog
Learn more at Amplitude Academy
© 2026 Amplitude, Inc. All rights reserved. Amplitude is a registered trademark of Amplitude, Inc.