User Composition: View your users by common properties
This article helps you:
Understand the differences between a User Composition chart and other Amplitude chart types
Build a user composition analysis and interpret the results
The User Composition chart shows the breakdown of active users based on a single user property or group property. This grouped view provides insight into who your users are and what properties they share.
Before you begin
First and foremost, events don't appear in any Amplitude charts until instrumentation is complete, so make sure you've got that done. For more information, review building charts in Amplitude and the difference between user properties and event properties.
Set up a user composition analysis
Most Amplitude charts rely on the Events Module to build an analysis. The User Composition chart isn't an event-driven analysis and doesn't have an Events Module—so it works a little differently.

Instead of events, a user composition analysis relies on user properties or group properties. Select the user property or group property you're interested in. Then, define your user segments, and the User Composition chart displays a breakdown of values for that property across the user segments you've specified.
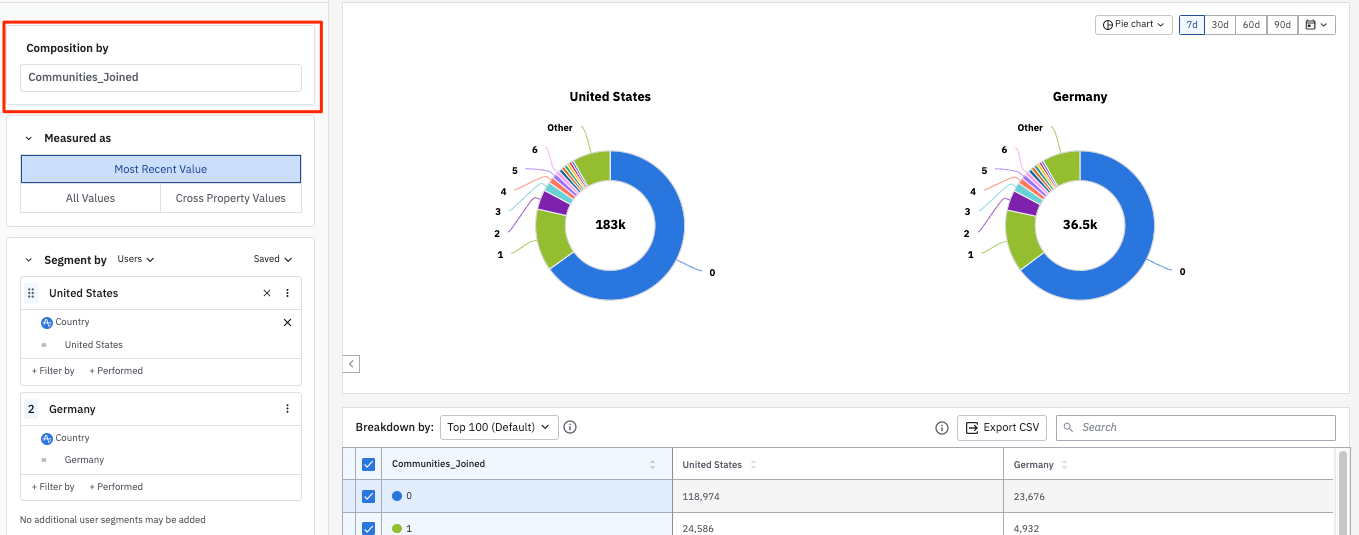
The example above shows a comparison of your product's users in the United States and Germany, broken out by the most recent value for the number of communities they've joined.
To build your own user composition analysis, follow these steps:
-
In the Composition By Module, select the user property or group property you're interested in.
-
In the Segment By Module, identify the user segment you want to include in this analysis. You can import a previously saved segment by clicking Saved and selecting the one you want from the list. Otherwise, Amplitude begins from the assumption that your analysis targets all users.
-
If you don't want to import a previously saved user segment, you can start building your own by adding properties. To do so, click + Filter by, choose the property you want to include, and specify the property value you’re interested in.
-
You can narrow your focus even further by telling Amplitude you only want to include users who have already performed certain actions. To do so, click + Performed, then choose the event you’re interested in.
-
Click + Add Segment to add another user segment, repeating steps 2 through 4.
-
In the Measured As Module, specify the property values you're most interested in seeing:
- Most Recent Value: Considers your users' most recent values of that property. Amplitude draws this value from a user's most recent active event. Users may only appear in one bucket when you select Most Recent Value.
- All Values: Includes every value your active users have had for the property in question during the time of your analysis. Remember that the User Composition chart only includes active users, so Amplitude doesn't return property values tied to inactive events.
- Cross Property Values: Shows sets of properties that active users have had within the time range selected. These buckets are mutually exclusive; users can only fall into one bucket.
-
Use the date picker to specify the timezone and set the time range of your analysis.
In all cases, Amplitude breaks out the top 13 values for your property and groups other values in the Other bucket. The value in the center of the chart is the column sum value in the breakdown data table below the chart. It includes only users in the top 100 property value groups by user count.
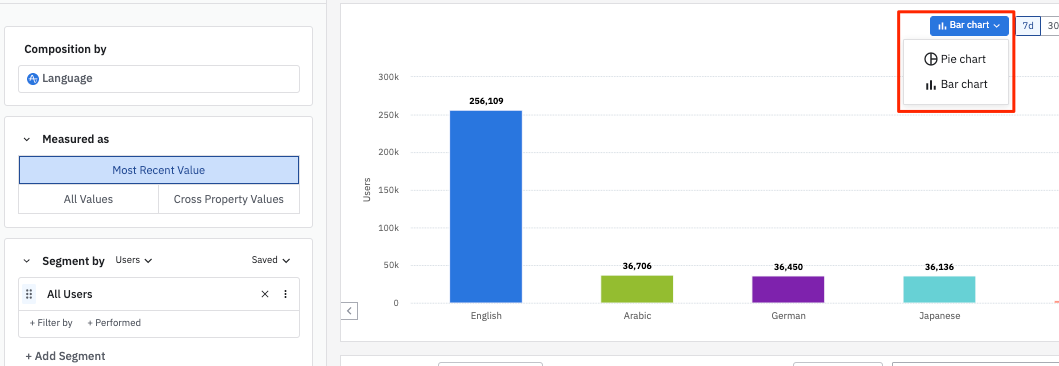
You can also view your results as a bar graph:

And of course, you can always inspect the composition of your user groups from the Microscope.
May 30th, 2024
Need help? Contact Support
Visit Amplitude.com
Have a look at the Amplitude Blog
Learn more at Amplitude Academy
© 2026 Amplitude, Inc. All rights reserved. Amplitude is a registered trademark of Amplitude, Inc.