Lifecycle: track the growth of your product's user base
This article helps you:
Understand the benefits of a lifecycle analysis
Set up a Lifecycle chart
AMPLITUDE ACADEMY
Track the Growth of Your User Base with Lifecycle
Learn to measure the change in your product’s active user base over time.
Learn Lifecycle AnalysisAmplitude's Lifecycle chart gives you a quick, easy-to-understand overview of the growth of your product's user base over time. It does this by breaking out your active users into subgroups: new, current, and resurrected (formerly inactive) users. All your total active users will fall into one of these categories. It will also show you a count of your inactive, dormant users.
Much of the power of a lifecycle analysis depends on an understanding of your product's critical event. What's the one thing your users need to do in order to get value from your product? For a food delivery app, this might be placing an order. For a healthcare app, it might be starting or booking a session. When you know that critical event, you can build a Lifecycle chart around it and see how your user base is interacting with that event over time.
You can also get a bird's-eye view of engagement and retention by building your analysis around any active event. This will keep you aware of more broad-based trends with your product's usage patterns.
The idea is to grow your current and resurrected user counts, either by keeping them engaged or by giving them a reason to become active again. You'll also want to keep an eye on your dormant users: if this category starts growing, you may have an engagement problem on your hands.
Before you begin
First and foremost, events will not appear in any Amplitude charts until instrumentation is complete, so make sure you've got that done. You'll definitely want to read our article on building charts in Amplitude.
You'll probably get more out of a lifecycle analysis if you fully understand your product's critical event, and its usage frequency. And you may want to check out our blog post on the retention lifecycle framework.
Set up your lifecycle analysis
To build a Lifecycle chart, follow these steps:
- In the Events Module, select the starting event. You can choose a specific event that is instrumented in Amplitude, or you can tell Amplitude to consider any event as the starting event for this analysis, by selecting Any Event from the list of available events.
Note
- If desired, add properties to your starting event by clicking on + where, selecting the property name, and specifying the property value you’re interested in.
- In the Segmentation Module, identify the user segment you want to include in this analysis. You can import a previously-saved segment by clicking Saved Segments and selecting the one you want from the list. Otherwise, Amplitude begins from the assumption that your analysis will target all users.
Note
- If you do not want to import a previously-saved user segment, you can start building your own by adding properties. To do so, click Users next to ..performed by to choose the type of property you'd like to segment by (i.e. Users, org ID(s), or inventory ID(s)).
- Then click Select property..., choose the property you want to include, and specify the property value you’re interested in.
- You can narrow your focus even further by telling Amplitude you only want to include users who have already performed certain actions. To do so, click Select event..., then choose the event you’re interested in.
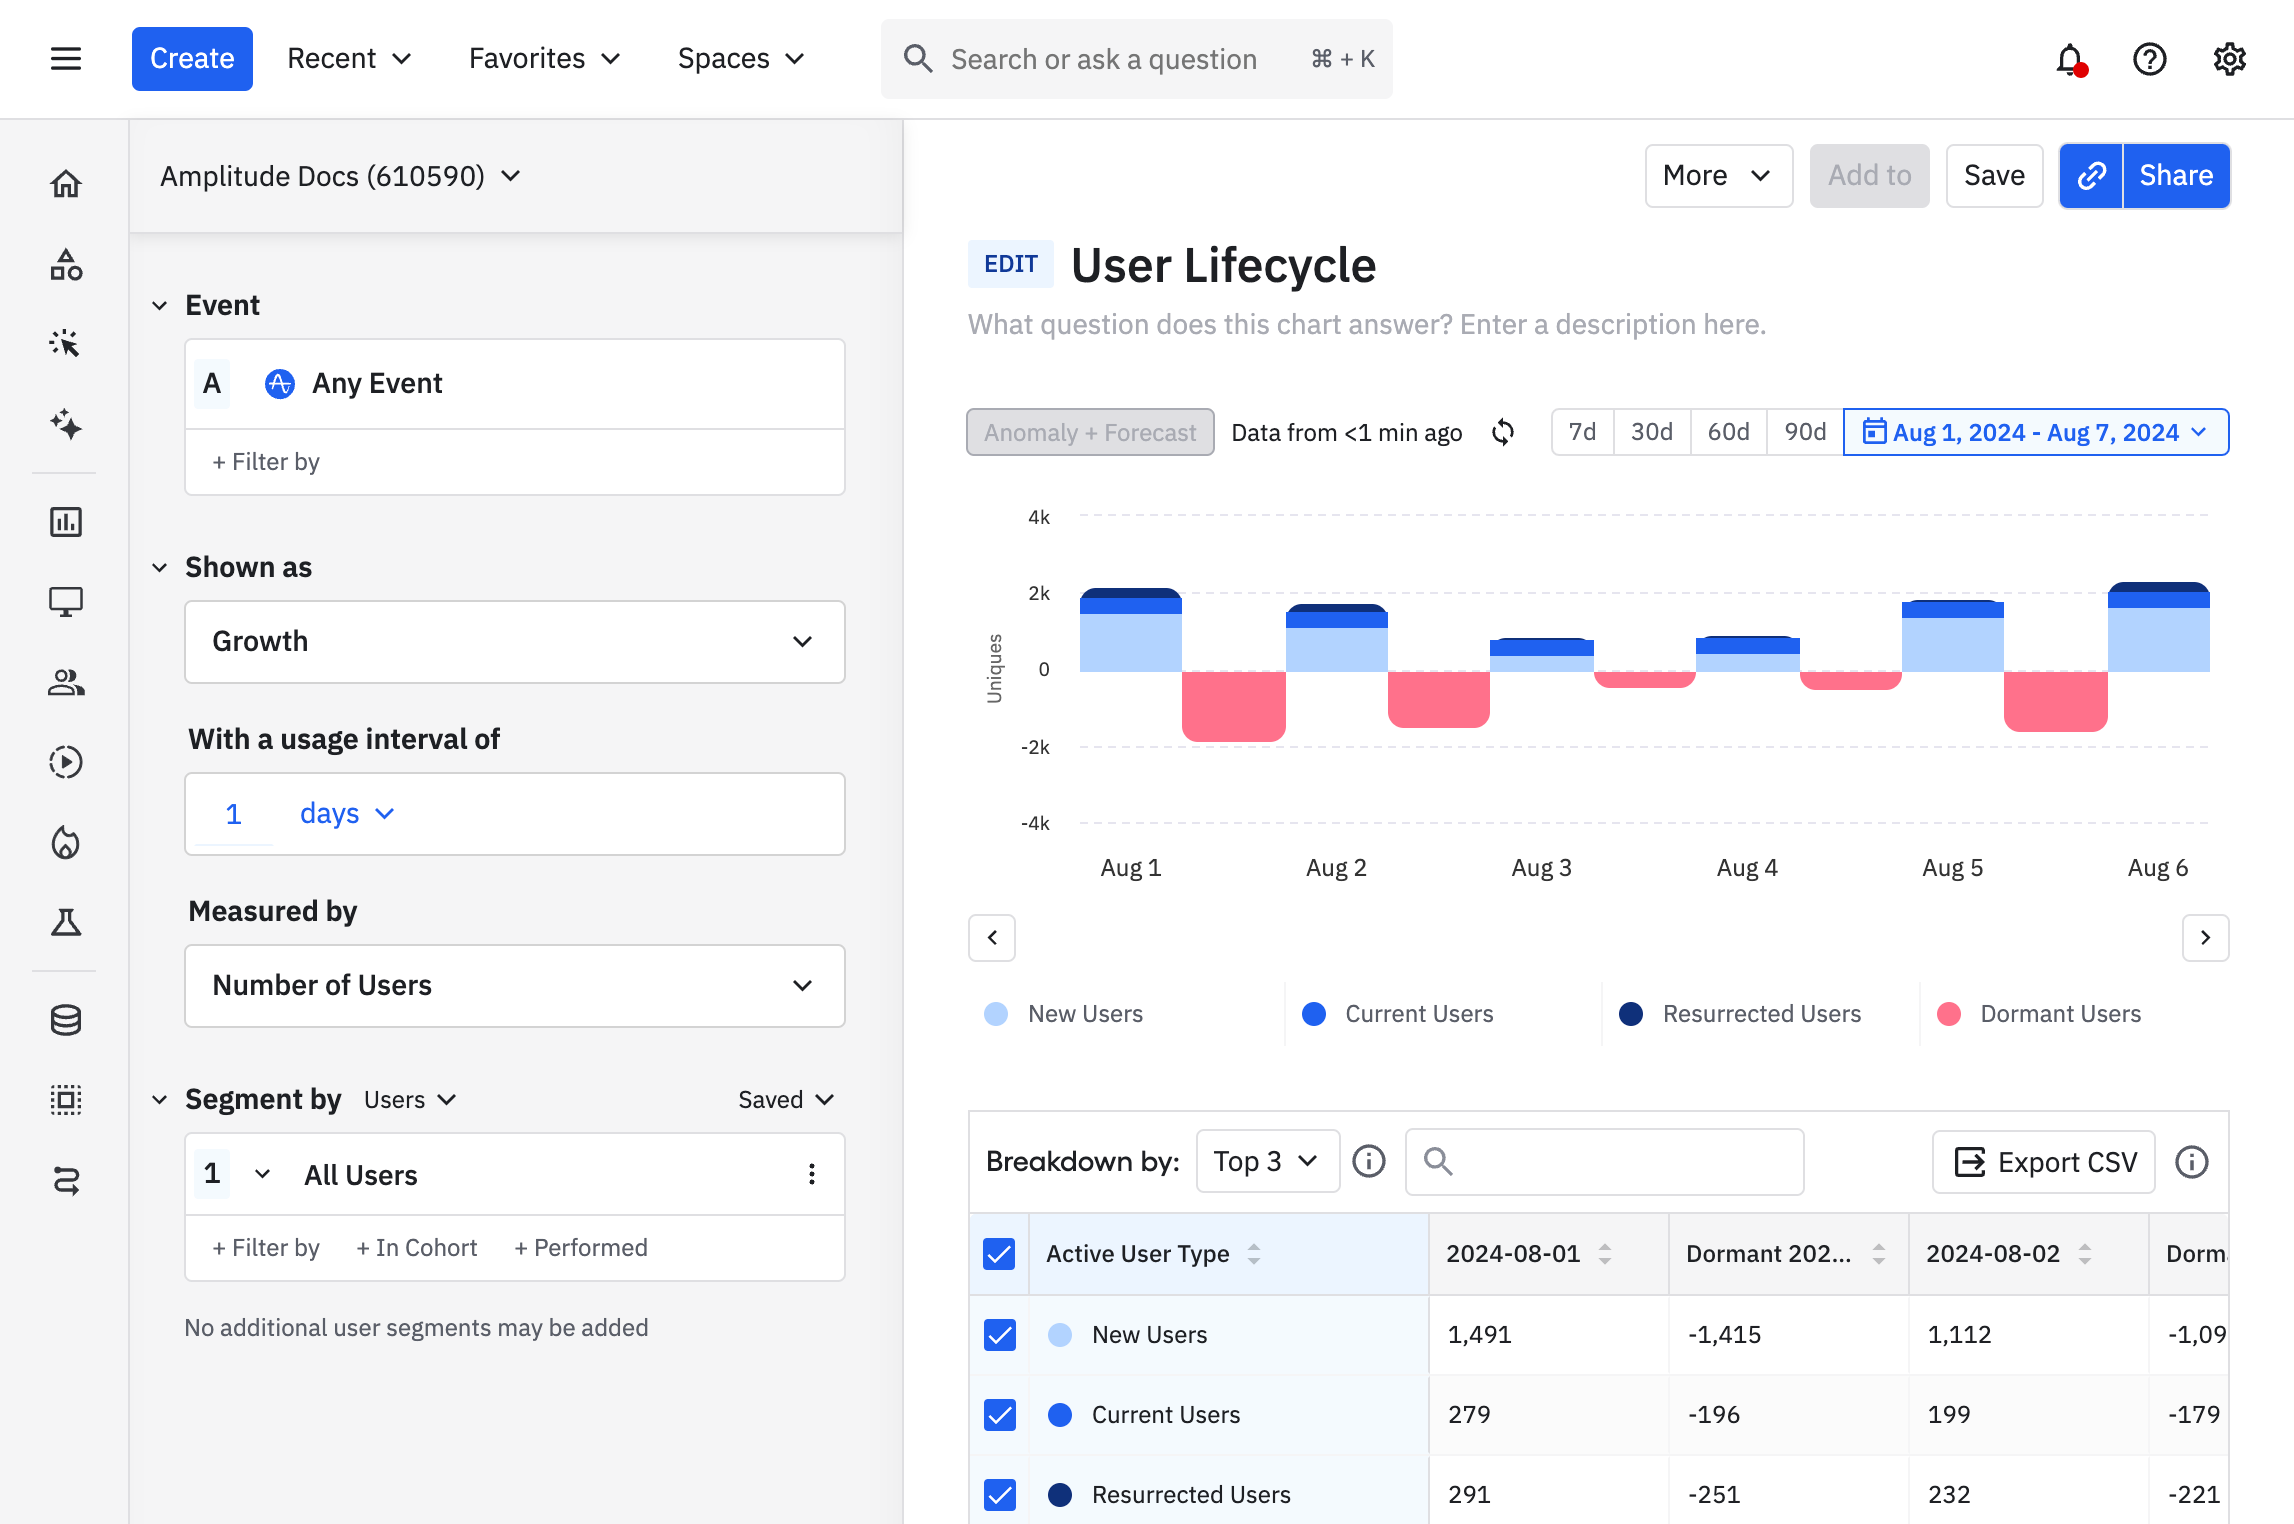
- In the Metrics Module, set your usage interval. If a user fires your selected event within the usage interval, Amplitude will consider them current; otherwise, for the purposes of this analysis, they are considered dormant. Your chart will display the results in the interval you've selected.

This example shows a daily lifecycle chart with an interval of 7 days (August 1 to August 7). Each day includes blue and red buckets defined as active users (blue) versus dormant users (red). Users cannot be in more than one bucker per interval.
Read on to learn how to interpret your Lifecycle chart.
October 16th, 2025
Need help? Contact Support
Visit Amplitude.com
Have a look at the Amplitude Blog
Learn more at Amplitude Academy
© 2026 Amplitude, Inc. All rights reserved. Amplitude is a registered trademark of Amplitude, Inc.