Compare group-by values in your Funnel Analysis chart to each other
This article helps you:
Quickly compare a group-by value to that of a baseline property
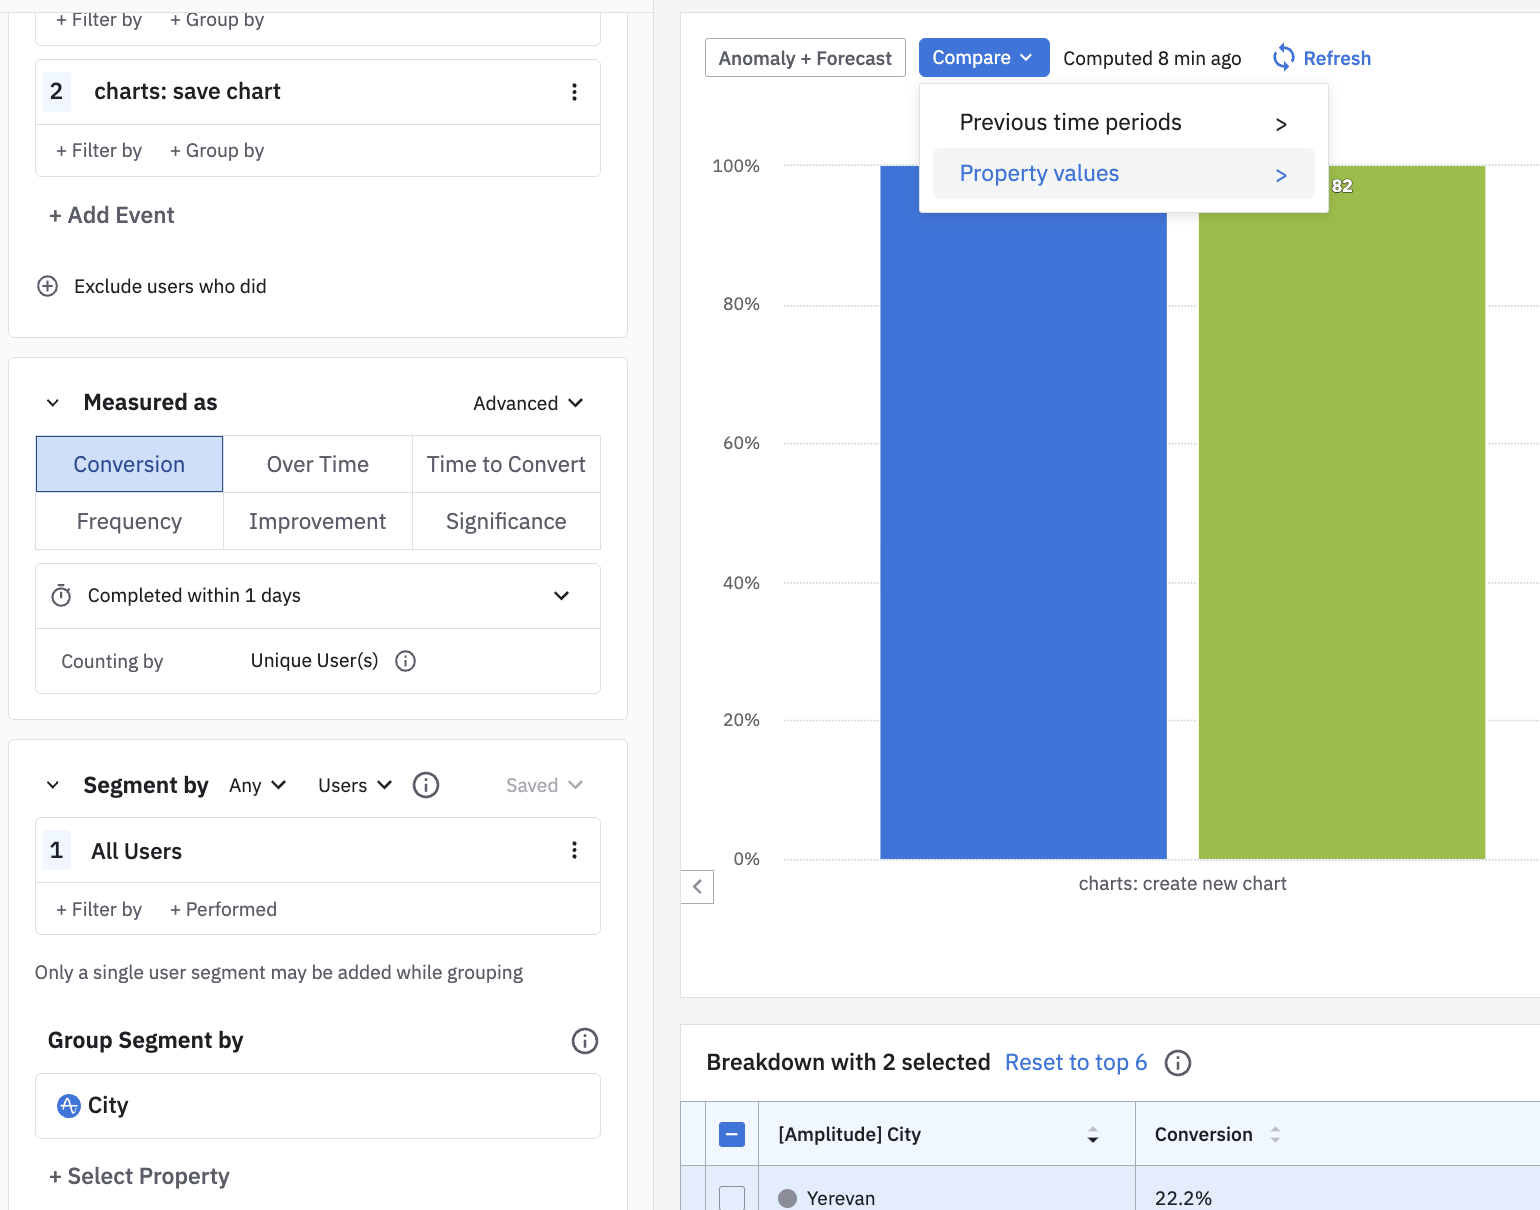
Funnel charts allow you to compare a group-by property to another baseline property. Once your Funnel chart has a Segment property group-by, click the Compare dropdown to choose a value for comparison.

With that value selected, the conversion percentage difference will be seen on the microscope when hovering over a value in the visual, and the breakdown table. For a particular step in the breakdown table, you’ll see both the absolute percent difference and the conversion percent difference.
There are some limitations to Segment property group-by comparisons:
- They are only available for Conversion and Conversion Over Time.
- They are applicable to Compare to Property Value or Compare to Past only.
- You are limited to a maximum of two Segment group-bys.
May 29th, 2024
Need help? Contact Support
Visit Amplitude.com
Have a look at the Amplitude Blog
Learn more at Amplitude Academy
© 2026 Amplitude, Inc. All rights reserved. Amplitude is a registered trademark of Amplitude, Inc.