Interpret your User Sessions chart
This article helps you:
Interpret the results of your User Sessions chart
Learn the ways Amplitude records sessions
Understand how filtering works in the User Sessions chart
AMPLITUDE ACADEMY
Uncover How Long Users Spend in Your Product with User Sessions
Learn how to use the User Sessions chart to analyze the time users spend in your product.
Learn Session AnalysisThe User Sessions chart can help answer questions about your product's users: such as, user frequency, user engagement length, and the differences of those metrics based on user segments.
Interpret your User Sessions chart
The results in User Sessions will depend on what metrics you chose while building your chart, such as a count of sessions versus a count of events.
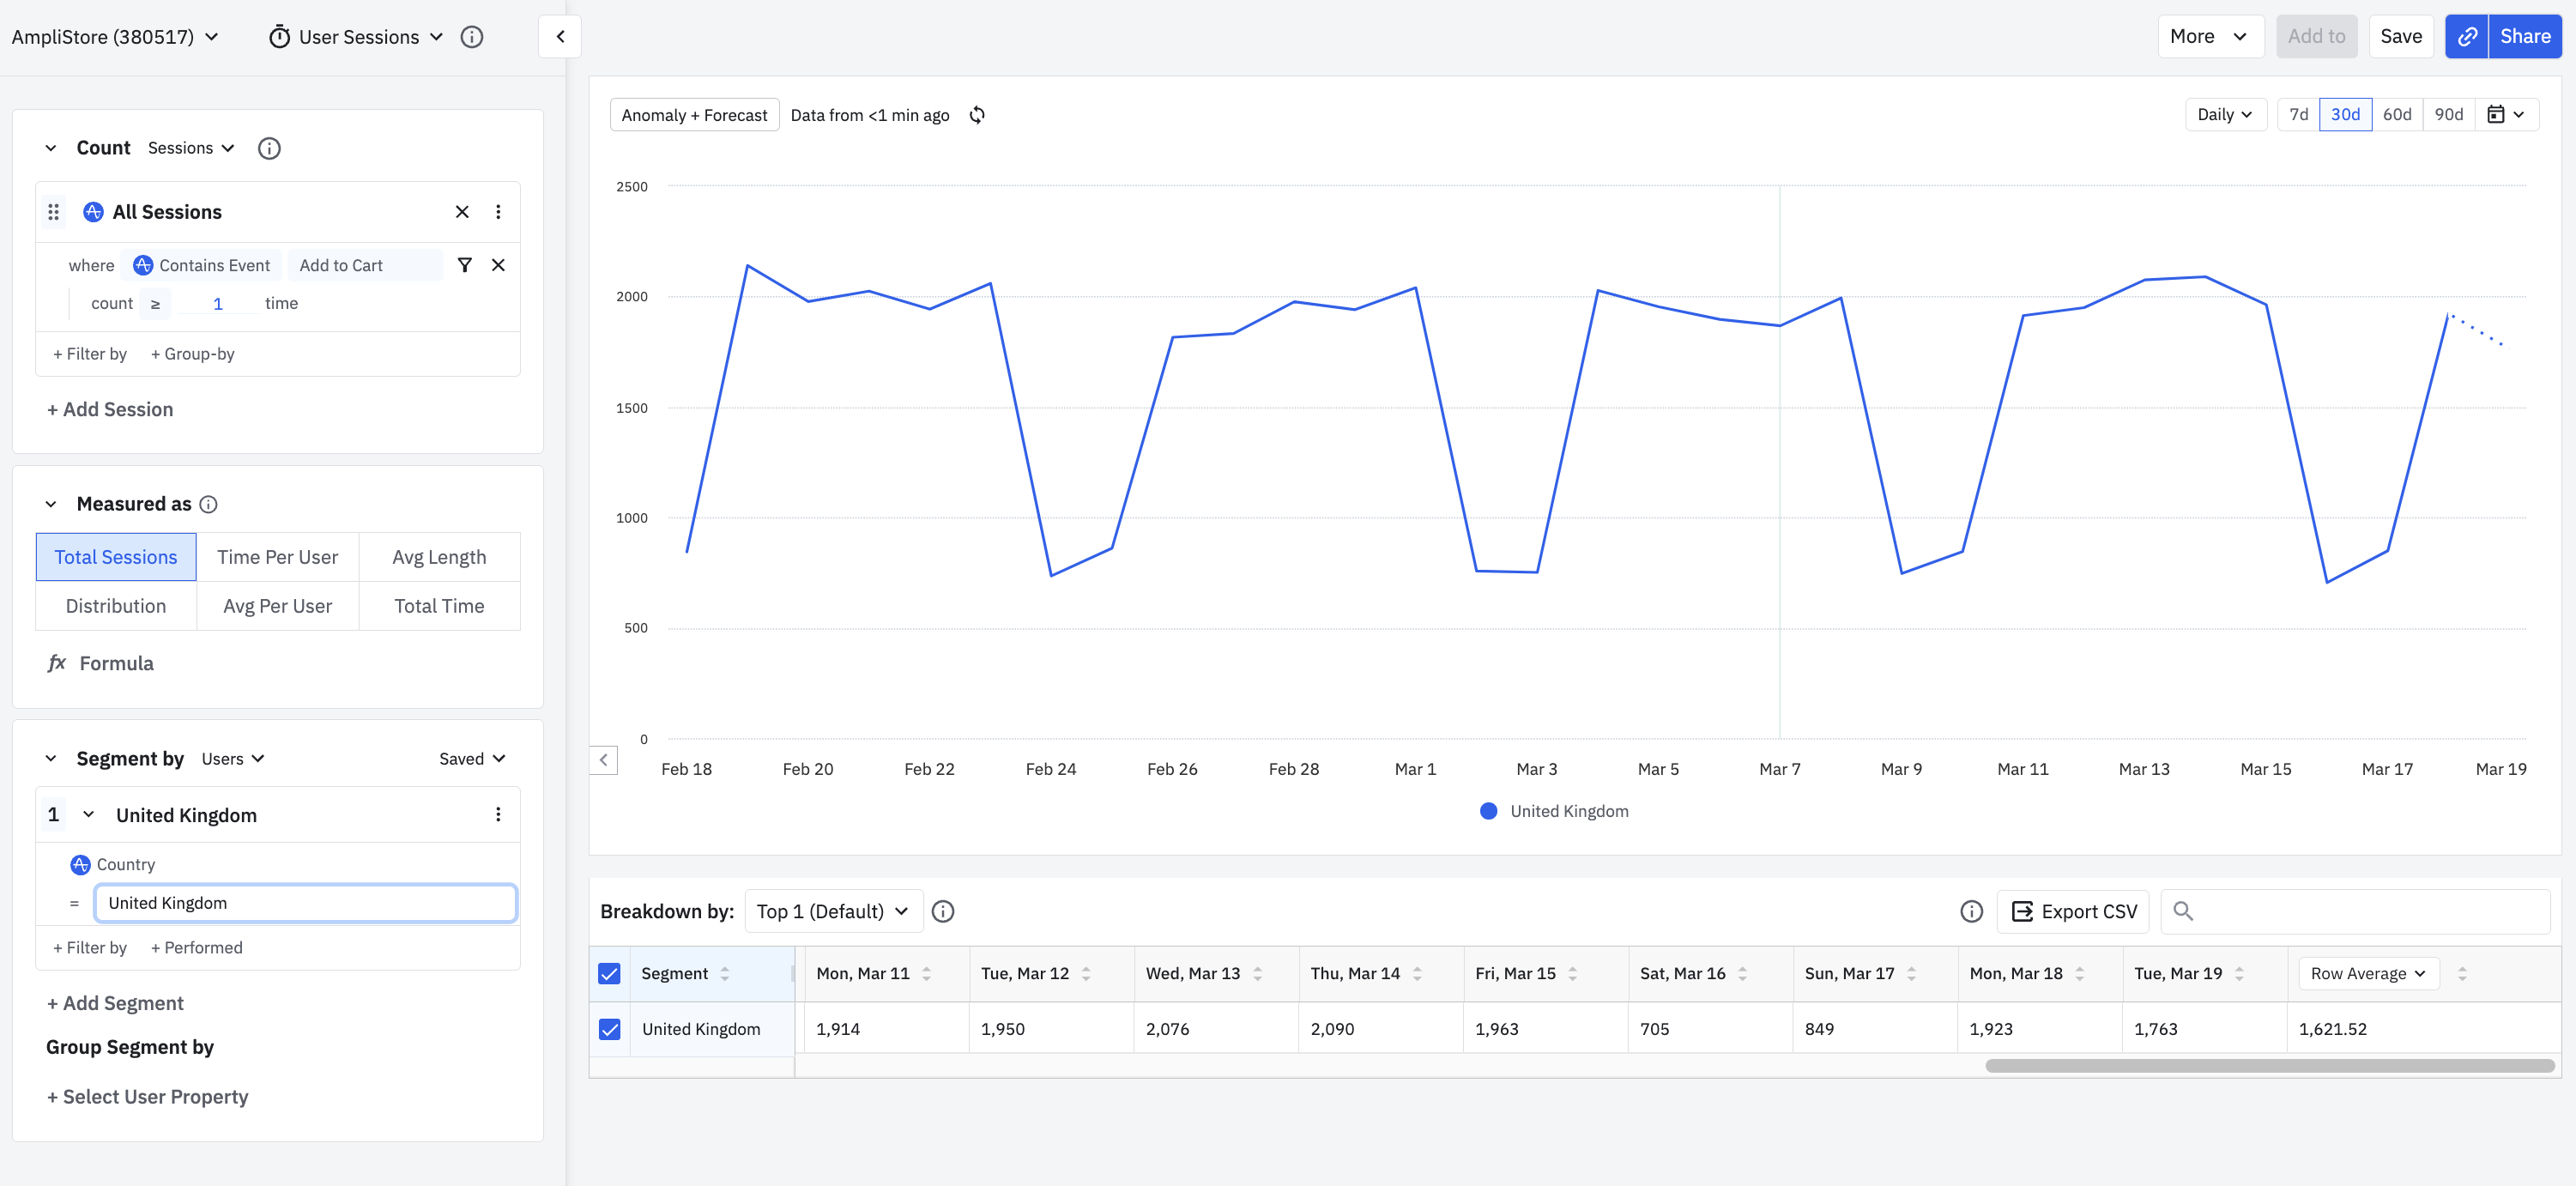
Here is an example that displays a daily count of sessions with at least one Add to Cart event for all users over the last 30 days. The chart also filters users by Country (United Kingdom).

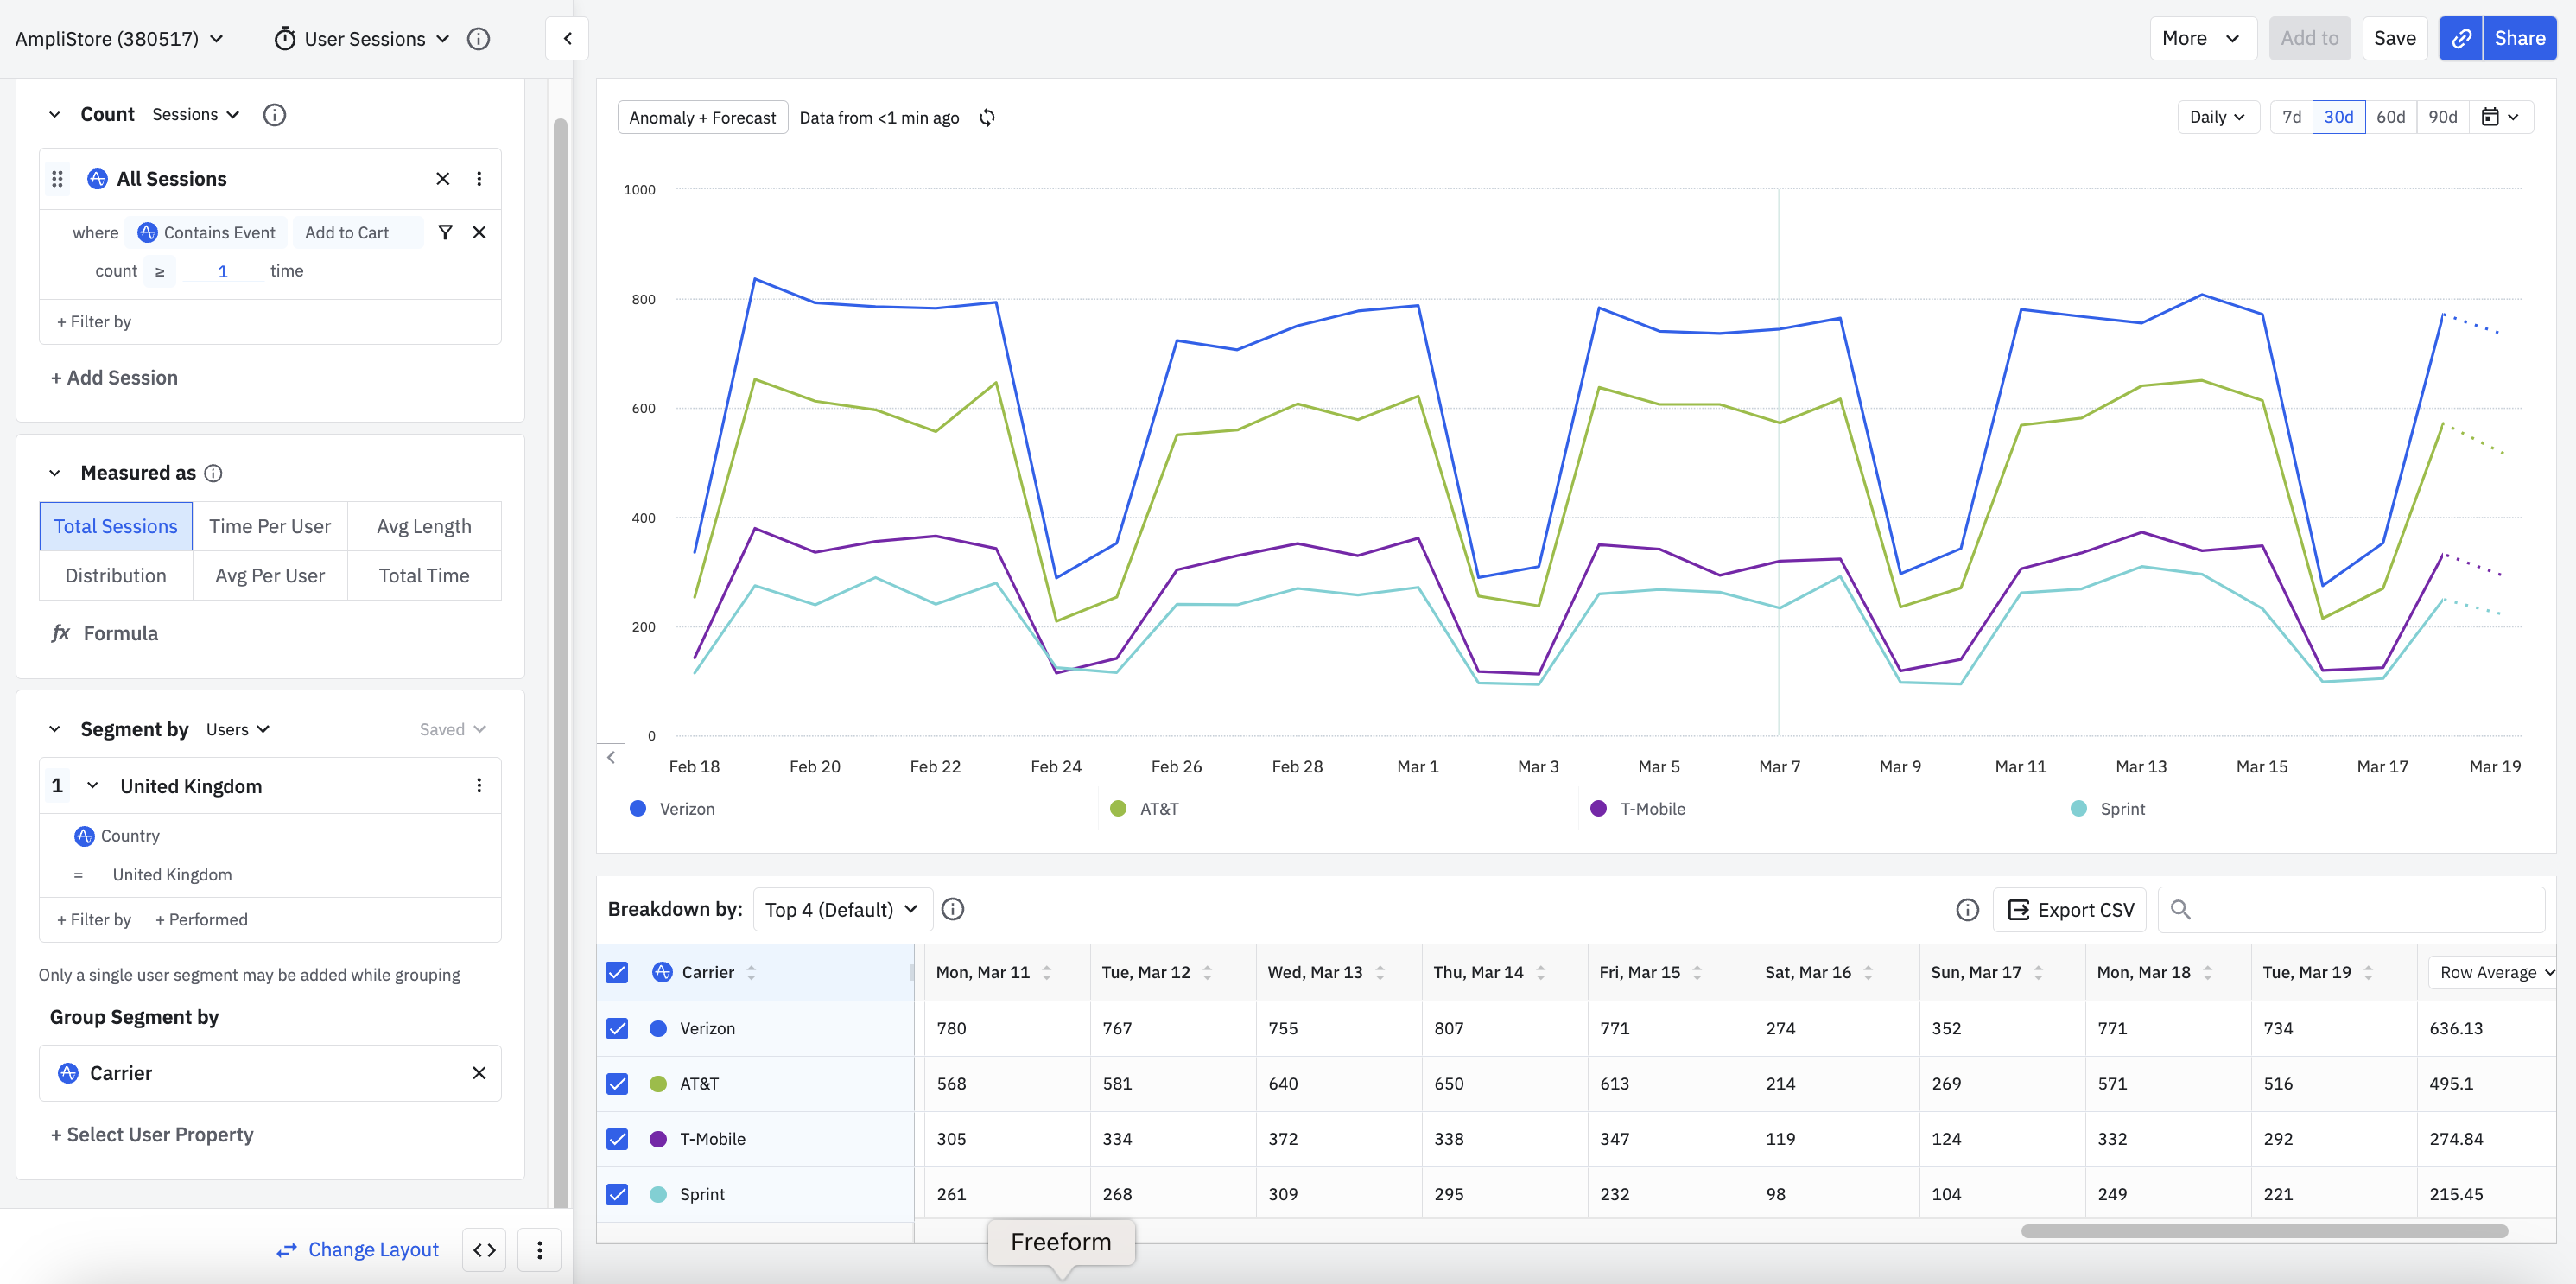
We see that same chart with the added group segment by Carrier. The chart shows the segmented carriers as different colored lines.

The data table
Underneath the chart is a table of session or event data. You can specify which segments you see in the graph by clicking on a segment name in the breakdown table. You can also download the table by clicking Export CSV.
Using the example from above, the breakdown table's results have been segmented by Carrier.

Note
(none) if the segmented property values are not available at the time the events are triggered. Read more about (none) or unexpected values in this FAQ article. The three ways Amplitude records sessions
Amplitude records sessions on either the server side or the client side. Additionally, client side sessions can be either mobile or web.
- Server side: You can use the HTTP API v2 to track sessions on the server side by including a value in the session_id field. The session_id value will be the number of milliseconds since epoch, counting from the start of the session.
- Client side (mobile): When using Amplitude's mobile SDKs, events triggered within 5 minutes of each other are, by default, counted towards the current session. The time of the first event marks the start time of a session, and the last event triggered marks the end time of a session. For example, the first event could be marked by an 'Open App' event. In addition, Amplitude will count events sent within five minutes of each other towards the current session.
- Client side (web): When using Amplitude's JavaScript SDK, events triggered within 30 minutes of each other are, by default, counted towards the current session. The time of the first event marks the start time of a session, and the last event triggered marks the end time of a session.
Additionally, you can define a session without instrumenting your events first, by setting a custom session property.
Note
session_id with your events.How filtering works in the User Sessions chart
Filtering events for the User Sessions chart is a multi-step process. The order of those steps is important to understand.
First, Amplitude will filter for events that match the property filters. Once those are returned, Amplitude takes those events and groups them into sessions, enabling Amplitude to calculate session length and count events performed each session.
Another way to phrase this is, property filters occur before session filters. So Amplitude filters on raw events first, then on the filtered events.
Only events with property filters are considered when computing session length.
April 1st, 2025
Need help? Contact Support
Visit Amplitude.com
Have a look at the Amplitude Blog
Learn more at Amplitude Academy
© 2026 Amplitude, Inc. All rights reserved. Amplitude is a registered trademark of Amplitude, Inc.