Interpret your Retention Analysis chart: Usage interval
Amplitude Academy
Drive Product Adoption with Retention Analysis
Learn how the Retention chart can help drive product adoption.
Get startedIn a retention analysis, the usage interval shows the percentage of active users who triggered the selected events with a specified daily, weekly, or monthly median frequency. Amplitude includes users only if they triggered these events on at least two different days.
Your usage interval is important for drawing accurate conclusions about your retention numbers. Some products are built for daily use, while others might serve much less frequent use. Knowing how often users actually use your product helps you gauge the health of your product when looking at Retention Analysis and Lifecycle charts.To view the usage interval, click Usage Interval in the Measured As module.
Suppose your product's critical event is Purchase Song or Video. Select this event and use the usage interval view to find the usage interval for that event. To calculate this, Amplitude plots the distribution of each user's median return period: for each user, Amplitude looks at all Purchase Song or Video events they triggered in the last 15 days, and then determines the median length of time between each of these events.
Purchase Song or Video event. Interpret this inflection point as your usage interval. Use this usage interval to create a Return On (Custom) chart or a Lifecycle chart. In this case, four days is the expected usage interval for active users with the critical event of Purchase Song or Video.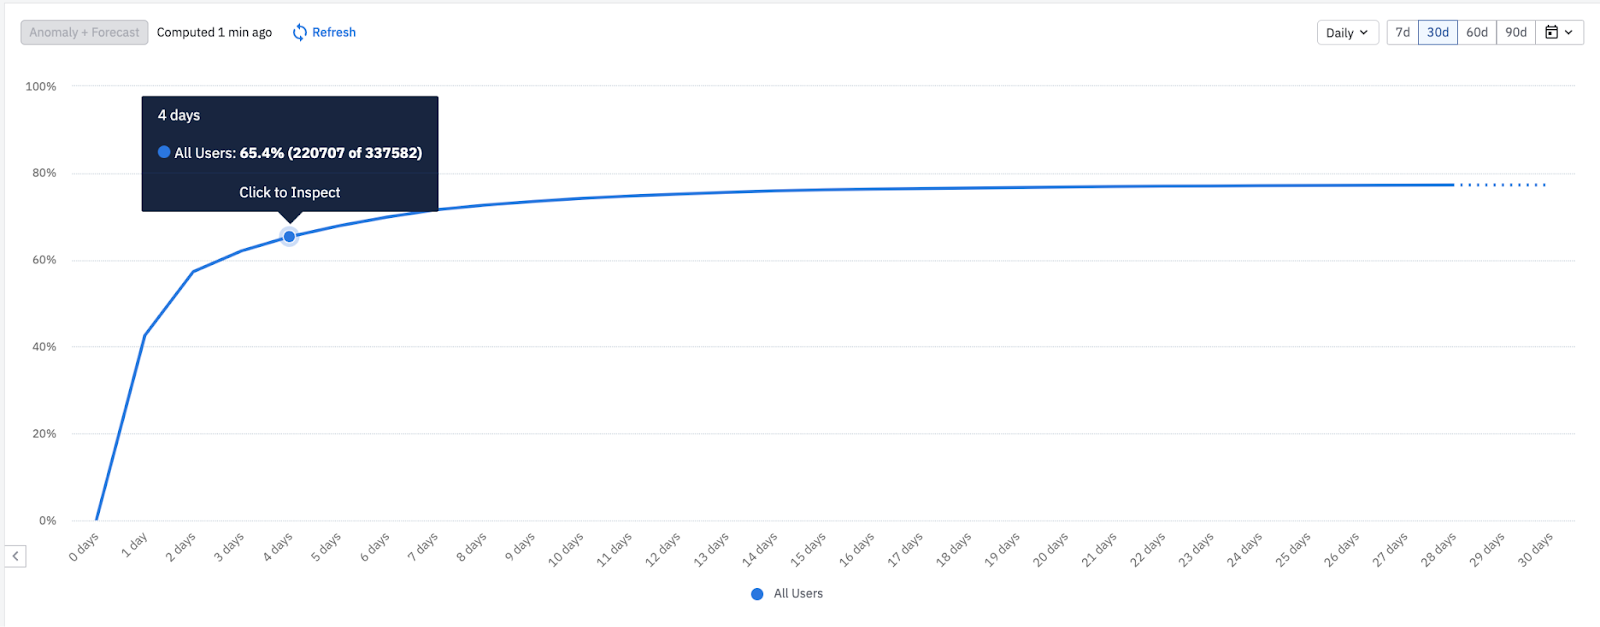
You can see how the median frequency between events changes over time by selecting the Usage Interval Over Time view. Amplitude doesn't plot averages in this view; instead, it shows the actual percentages.
For example, the following data point shows that of the users who triggered Purchase Song or Video on March 10th, 89.1% of them fired it again within seven days.
Was this helpful?