Hold properties constant in a Funnel Analysis chart
This article helps you:
Set up your Funnel Analysis charts to display the unique count of user and property pairs that have completed the funnel, instead of just the unique count of users who have completed it at least once
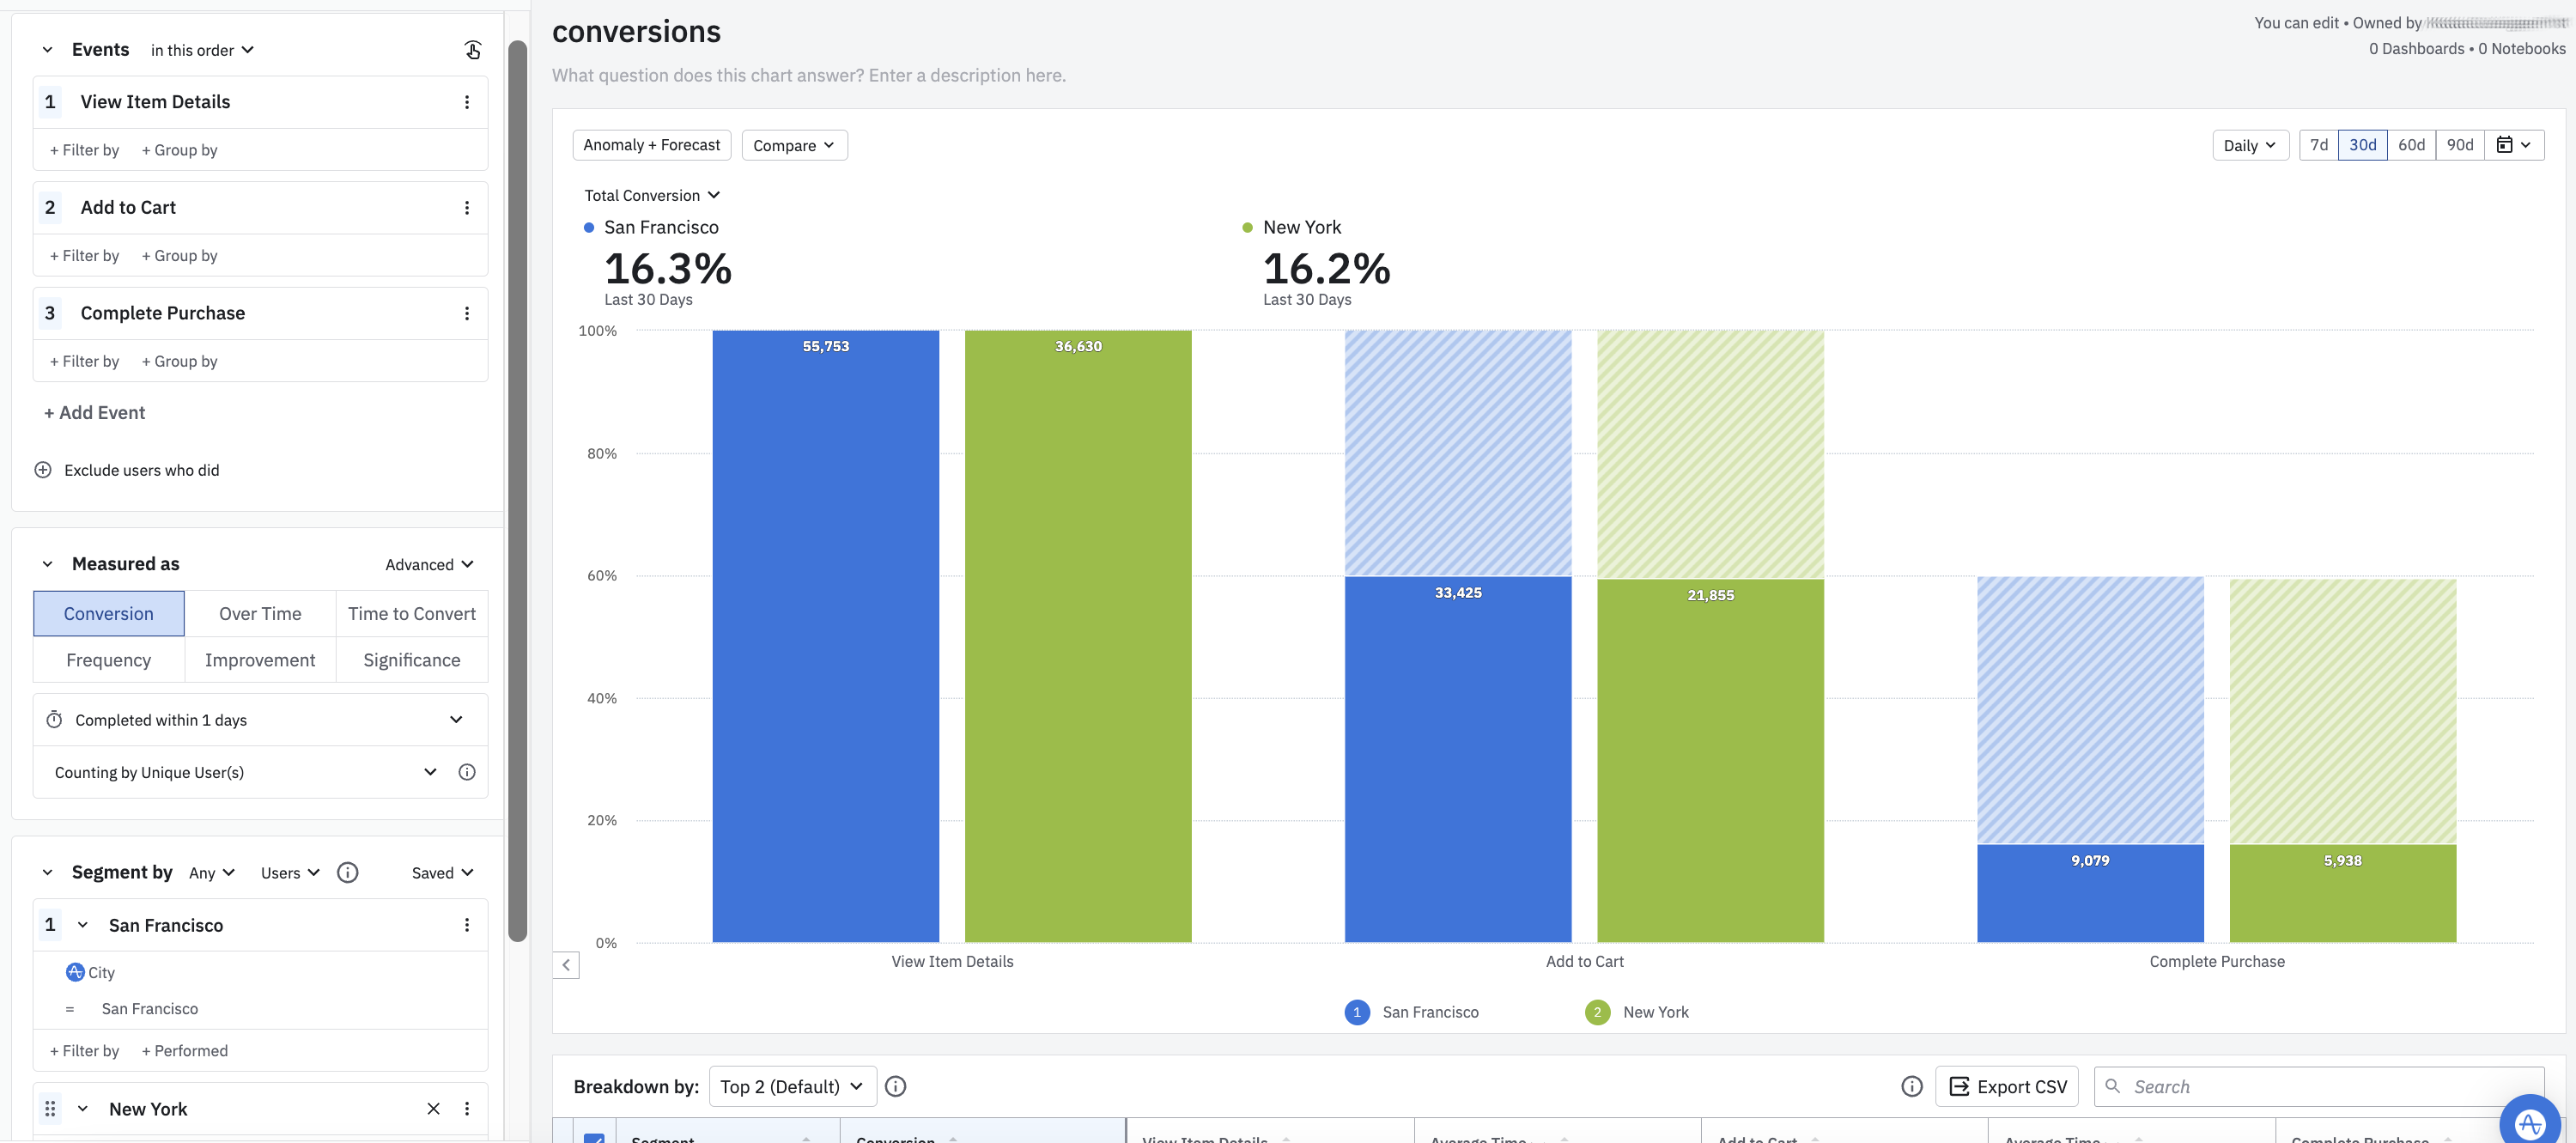
By default, Amplitude doesn't hold properties constant in a funnel analysis. This means the funnel chart displays the unique count of users who have gone through the funnel once or more if, for example, the user goes through the entire funnel multiple times, they're only counted once.
For the following chart, if a user were to convert this funnel (View Item -> Add to Cart -> Complete Purchase) ten times over the last day, they would only show up once.

If, however, you opt to hold properties constant, the funnel chart displays the unique count of user and user/event property pairs that have completed the funnel. If a user goes through the entire funnel X times with Y distinct event property values, the user counts Y times.
For example, if a user converts View Item Details -> Add Item to Cart -> Complete Purchase with ten different Item_ID property values, they show up ten times in the chart. Here, Item_ID is an event property that's been sent for all three events in the funnel. An event property can only hold constant if you instrumented it for every event in the funnel.
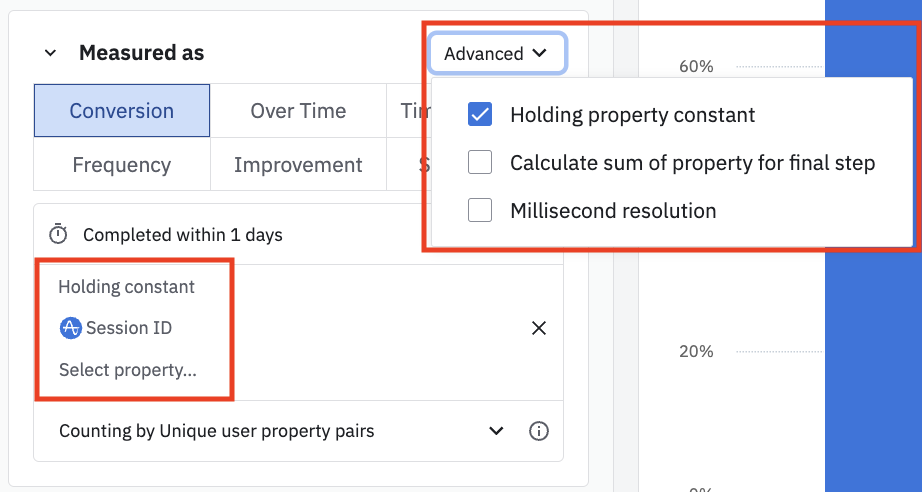
You can use this method to build session-based funnels. To do this, hold constant [Amplitude]Session ID, as shown here:

A user must complete each step in the funnel with the same session ID to be converted. A Funnel Analysis chart with this setup doesn't show unique users, since users can complete the funnel multiple times in different sessions.
May 29th, 2024
Need help? Contact Support
Visit Amplitude.com
Have a look at the Amplitude Blog
Learn more at Amplitude Academy
© 2026 Amplitude, Inc. All rights reserved. Amplitude is a registered trademark of Amplitude, Inc.