Impact Analysis: How engagement changes user behavior
This article helps you:
Understand the benefits of an Impact Analysis chart to uncover feature affects on user behavior
Set up an Impact Analysis chart
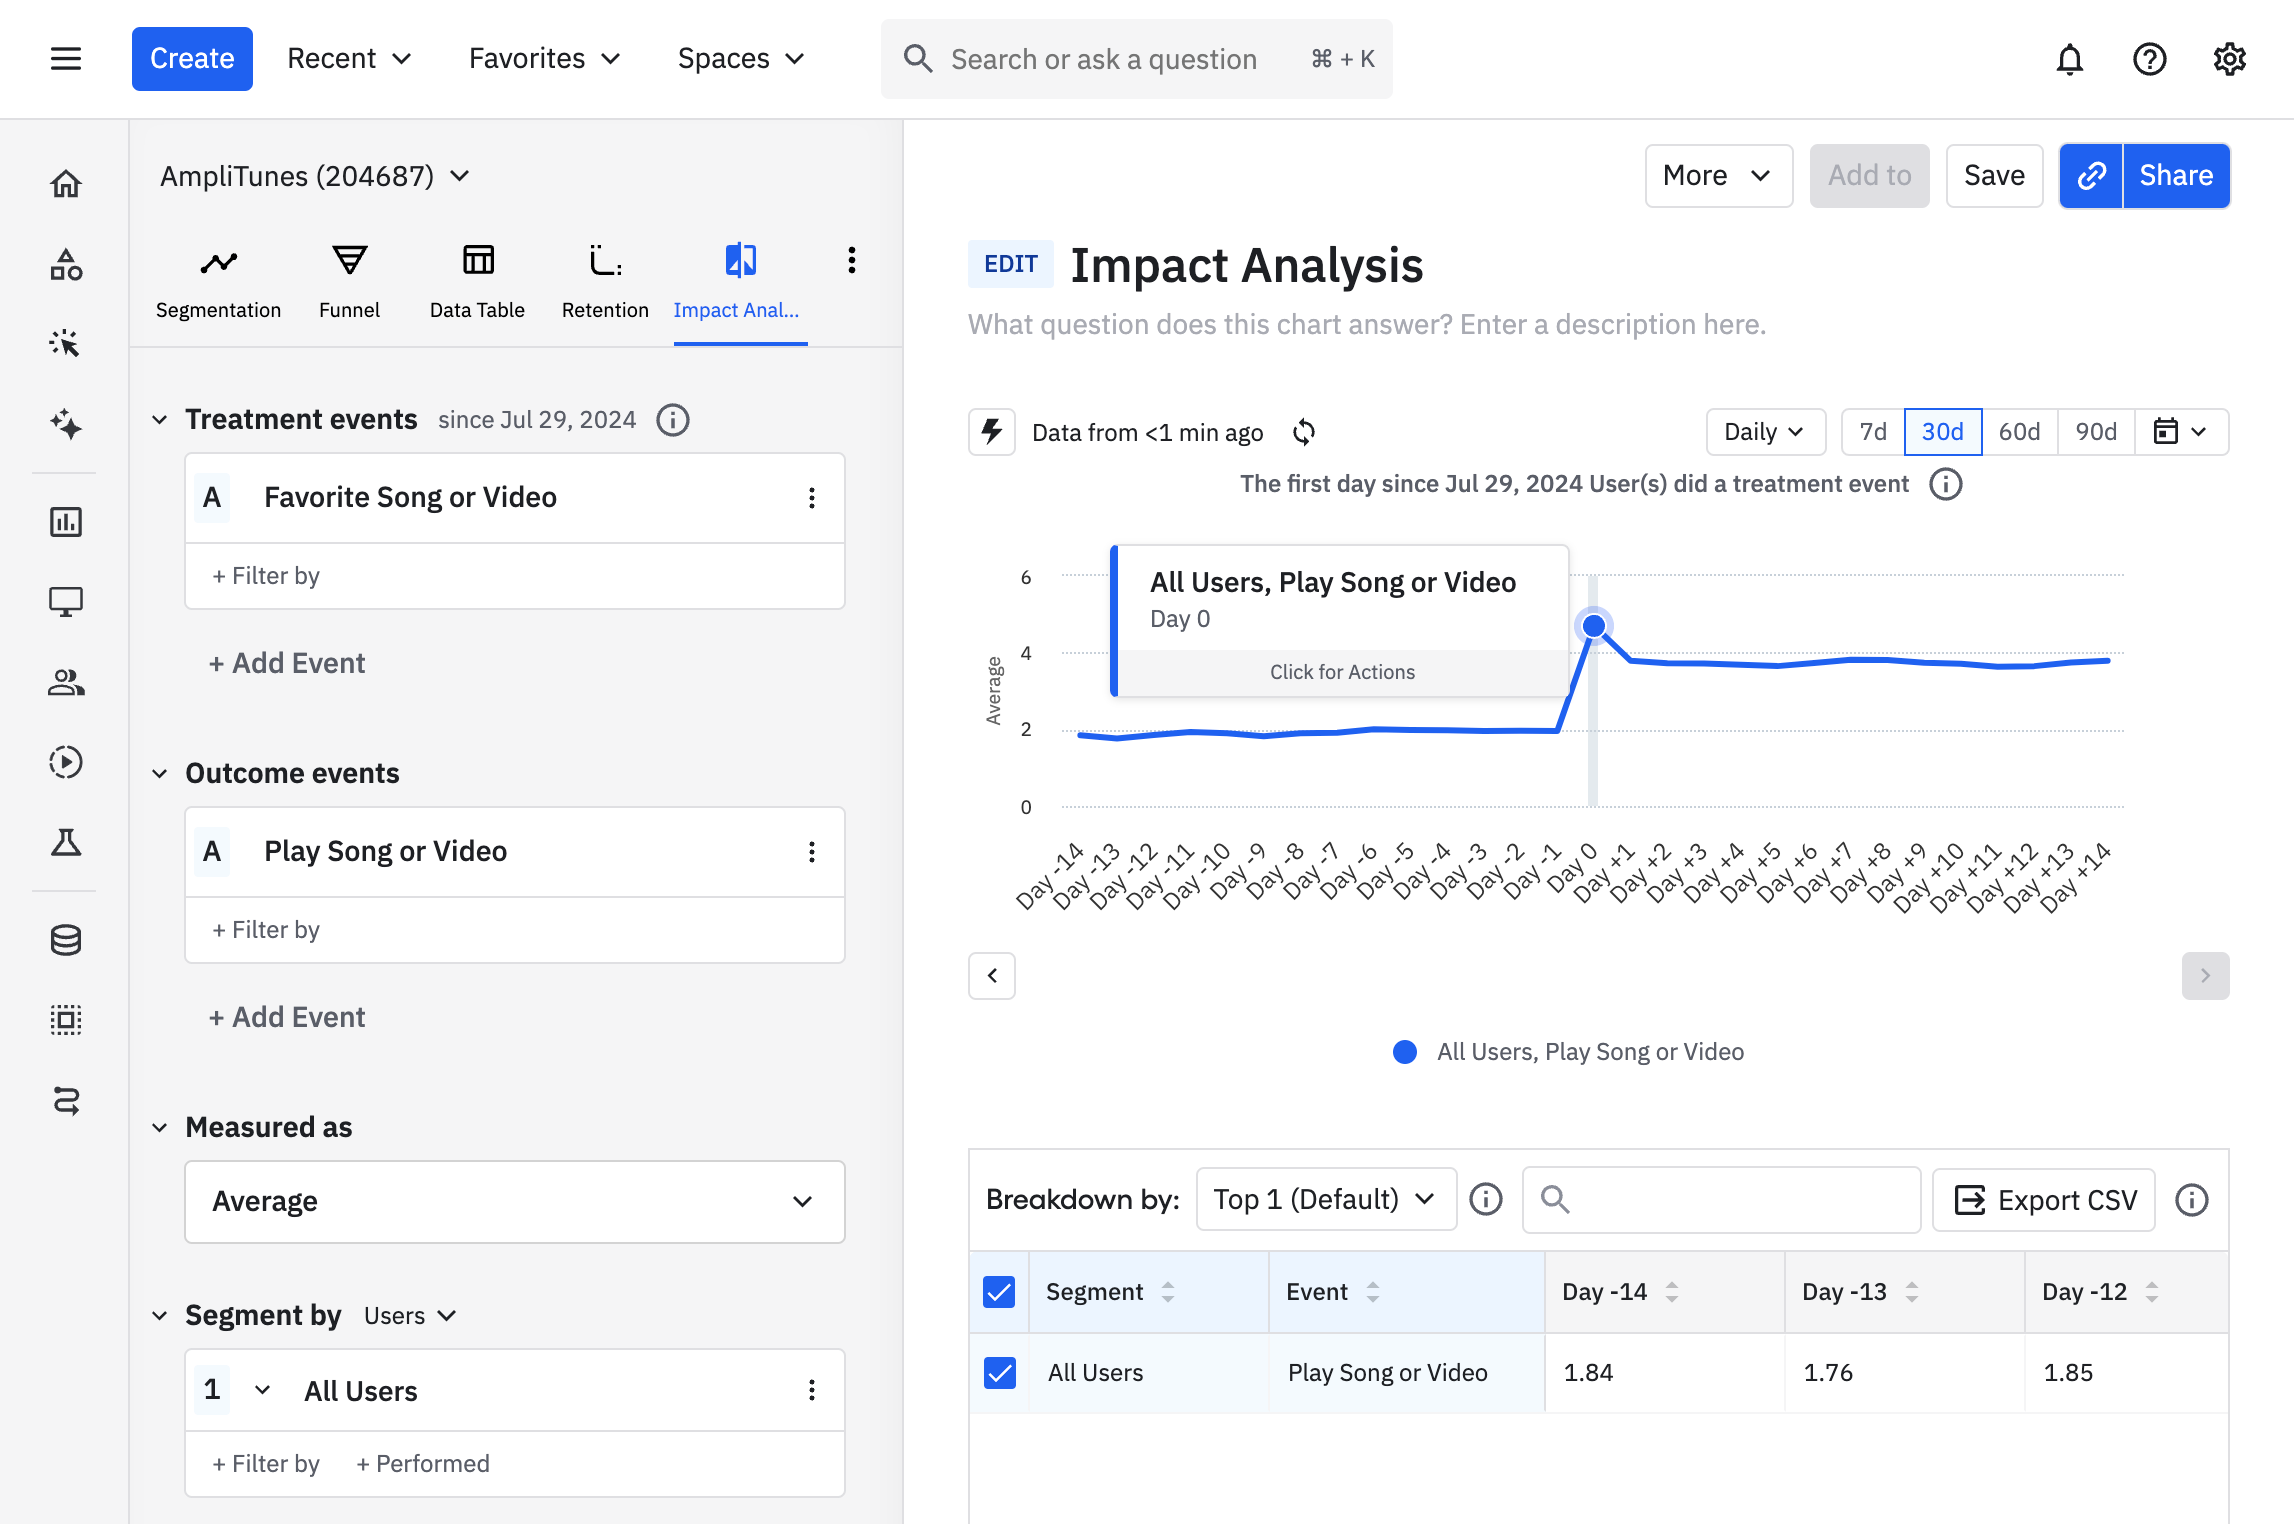
With Amplitude's Impact Analysis chart, you can discover how first-time engagement with one feature affects the rate of another behavior.
For example, a product manager of a music app can use Impact Analysis to see changes in the average number of times users play a song after they first discover the ability to 'favorite' songs:

Use the Impact Analysis chart to:
- Learn whether discovering a feature for the first time changes how often users take another, specific action
- Determine if users who interacted with a new or changed feature are taking certain actions more frequently, relative to the time before they first used the new feature
Before you begin
First and foremost, events will not appear in any Amplitude charts until instrumentation is complete, so make sure you've got that done. You'll definitely want to read our article on building charts in Amplitude.
Finally, when working with an Impact Analysis chart, always keep in mind that correlation does not imply causation.
Note
Set up an Impact Analysis chart
To build an Impact Analysis chart, follow these steps:
- In the Events Module, select a treatment event. This is a user action that you believe may affect your users' propensity to take some key action within your product. You can select up to three treatment events.
- Next, select the outcome event. This is the behavior you think may have changed after users triggered the treatment event for the first time. You can select up to three outcome events.
- If desired, add properties to your events by clicking on + where, selecting the property name, and specifying the property value you’re interested in.
- In the Segmentation Module, identify the user segment you want to include in this analysis. You can import a previously-saved segment by clicking Saved Segments and selecting the one you want from the list. Otherwise, Amplitude begins from the assumption that your analysis will target all users.
- If you do not want to import a previously-saved user segment, you can start building your own by adding properties. To do so, click + where, choose the property you want to include, and specify the property value you’re interested in.
- You can narrow your focus even further by telling Amplitude you only want to include users who have already performed certain actions. To do so, click + perform, then choose the event you’re interested in.
- Use the date picker to specify the timezone, and to set the interval and timeframe for your analysis. This will specify the window of time during which Amplitude will find all users who triggered the treatment event for the first time.
Here, "first time" is defined as the first time the user has triggered the treatment event in the number of calendar days before the beginning of the selected date range. This number will depend on the time interval you've chosen:
- Daily: 90 calendar days
- Weekly: 91 calendar days (or 13 weeks)
- Monthly: 120 calendar days (or 4 months)
- Quarterly: 360 calendar days (or 4 quarters)
For example, if you set the timeframe to be between 10/15/2022 and 11/18/2022, with a weekly interval, the users included in the results would be all of those who triggered the treatment event within that time who had NOT previously done so at any point between 7/17/2022 and 10/15/2022 (91 calendar days before the beginning of the selected time window).
Read on to learn how to interpret your Impact Analysis chart.
November 25th, 2024
Need help? Contact Support
Visit Amplitude.com
Have a look at the Amplitude Blog
Learn more at Amplitude Academy
© 2026 Amplitude, Inc. All rights reserved. Amplitude is a registered trademark of Amplitude, Inc.