Identify conversion drivers in your funnel analyses
This article helps you:
Identify behaviors that lead users to sign up or drop off
Uncover friction points in onboarding and critical conversion funnels
Discover common experiences that lead to repeat consumers
Knowing which events lead to conversions and which events don’t is a crucial part of any analytics program. With Amplitude, you also have the ability to conduct deeper analyses and learn why users convert or churn after a specific event, with conversion drivers.
Use this feature to understand which behaviors are driving key outcomes in your customer journey. To help you do that, Amplitude provides several relevant metrics in each conversion driver analysis:
- A correlation score
- Behavior frequency
- Percentage of users engaging in that behavior
- Overall time to convert when a user engages in that behavior
These metrics should help clarify the frequency of different user actions, and whether they help or impede conversion.
Before you begin
- If you haven’t already, familiarize yourself with the Funnel Analysis chart.
- Always keep in mind that correlation does not equal causation.
- This feature will only work for funnel charts that are set up for the conversion metric, and the order of the events is set to “this order.”
See this article for a more advanced look at funnels analysis.
Analyze events performed between funnel steps
A conversion drivers analysis begins with a simple, two-step funnel. Step one should be the starting event—for example, Search Song or Video in a music app—while step two should be the conversion event you’re interested in, like Purchase Song or Video. Amplitude will then automatically sort through, aggregate, and analyze all events that occur for each user between these two steps, in order to identify which user actions are most strongly correlated with that outcome.
To start a conversion drivers analysis, follow these steps:
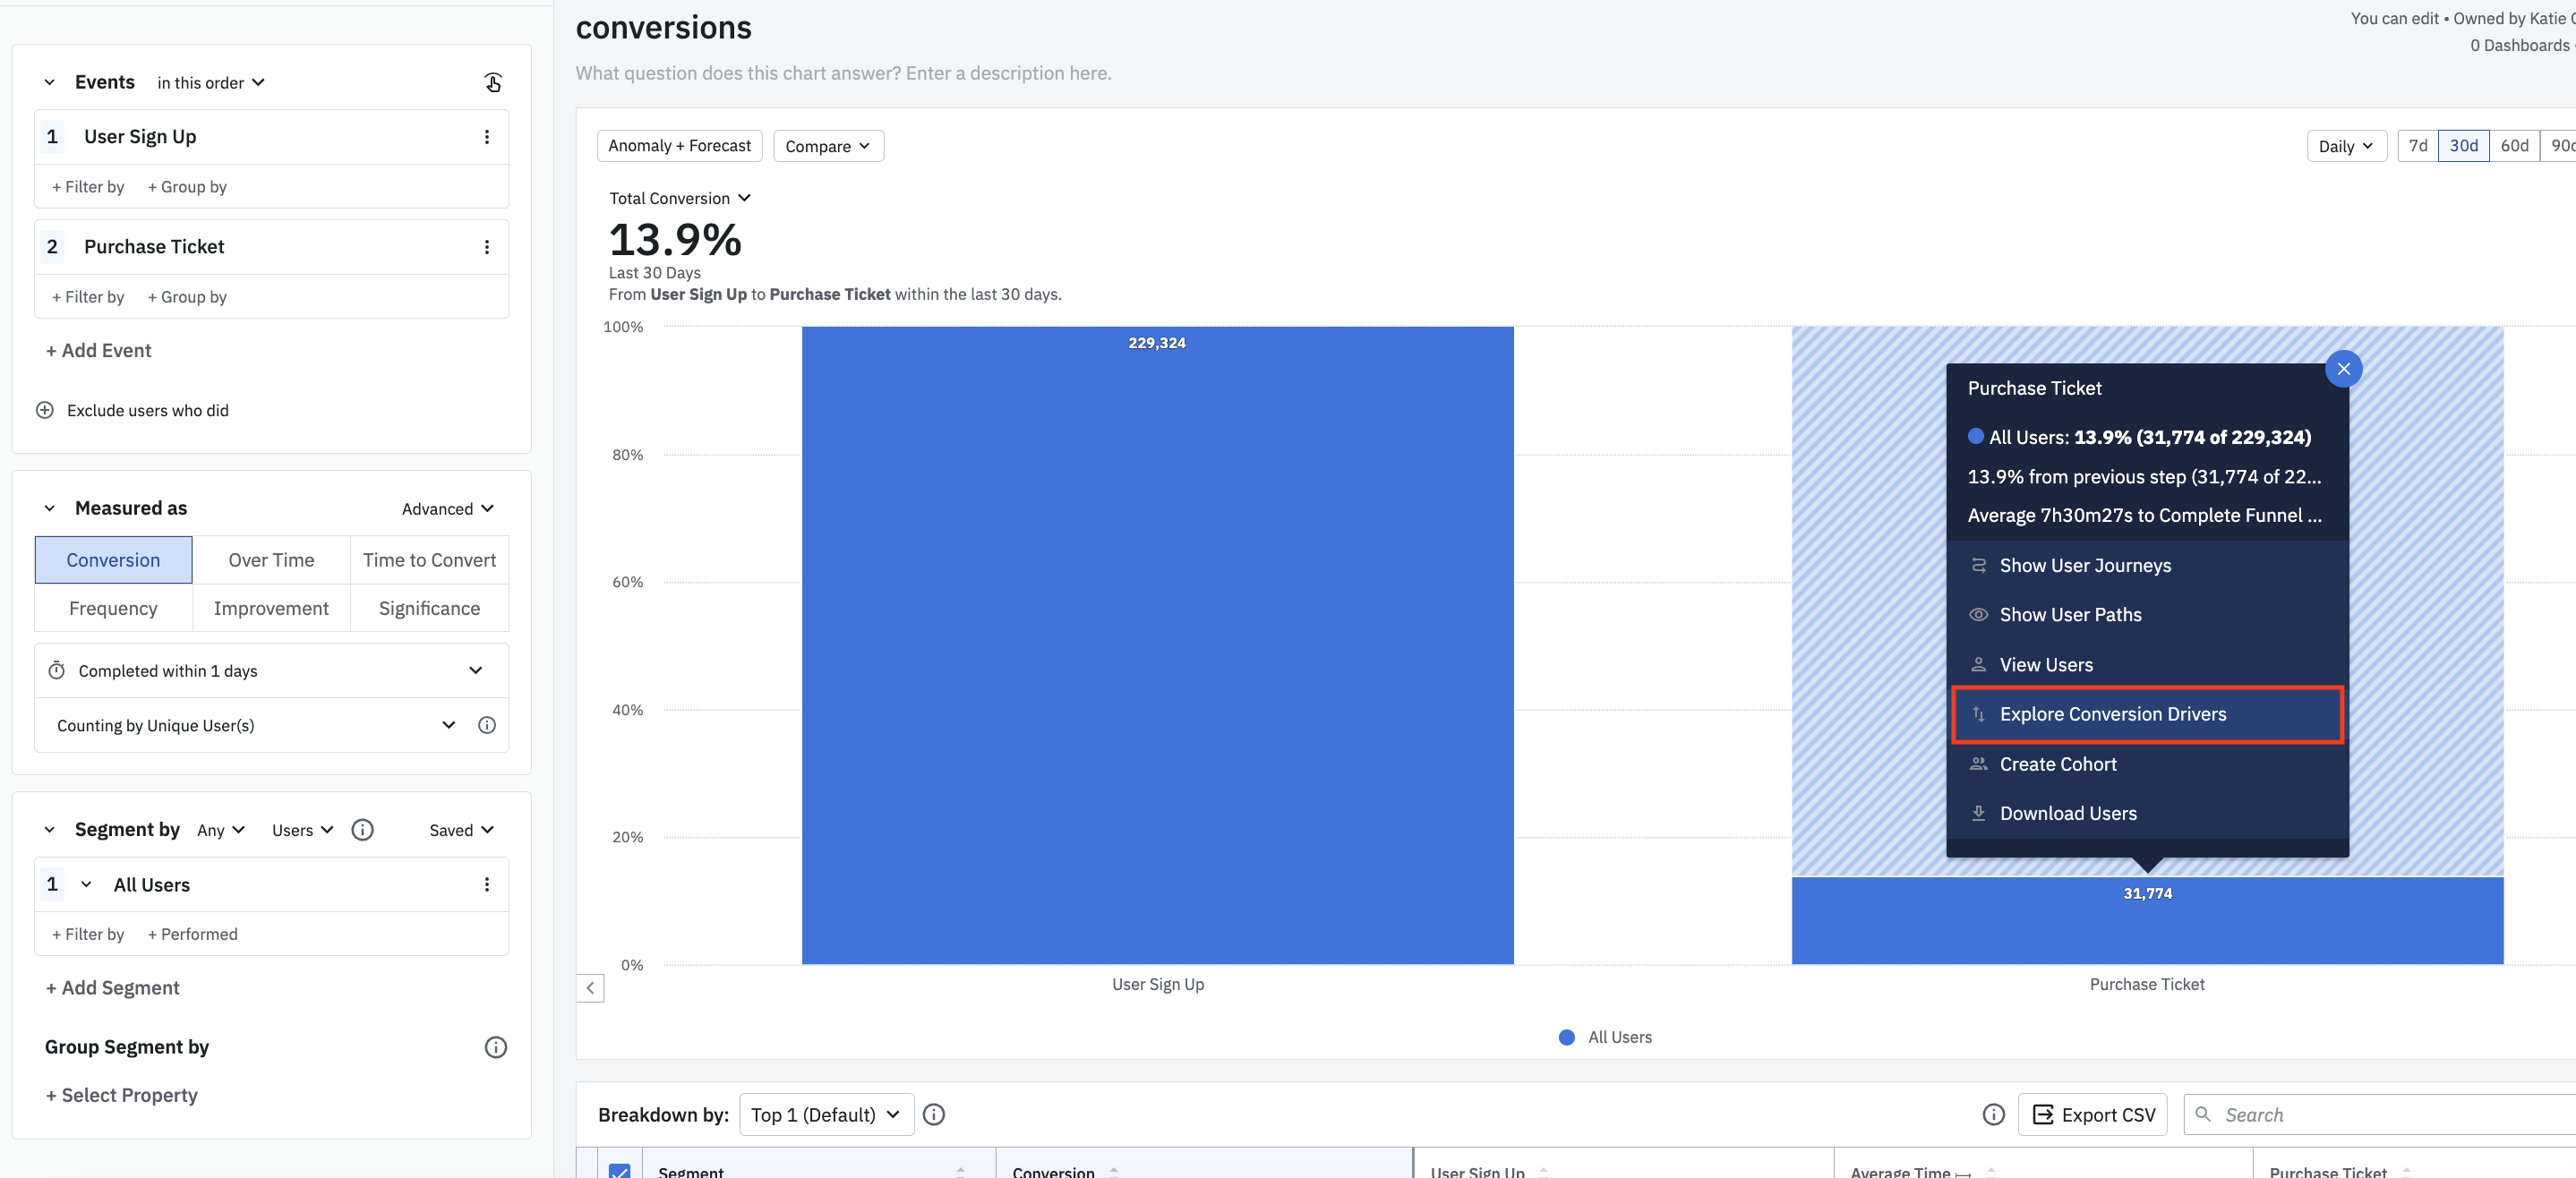
- From within a funnel analysis chart, find the step you’re interested in examining as a conversion event. It can be any step after the initial event in the funnel. Doing this will open the Microscope.

- From the Microscope, click Explore Conversion Drivers. This will open the conversion drivers panel.
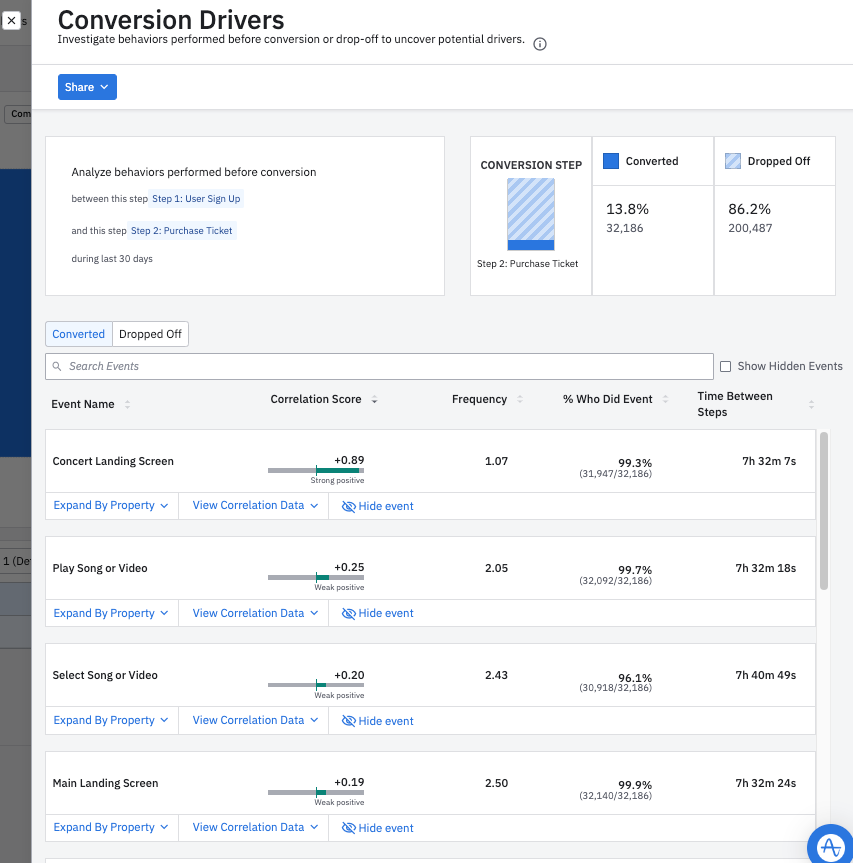
The conversion drivers panel has two sections. The step controller gives you the option to choose the beginning and ending steps for your conversion driver analysis. You can change these by clicking on them and selecting the events you’re most interested in.
This section also displays the conversion and drop-off numbers for the steps you’ve selected, in terms of both unique users and a percentage of users.

Below the step controller is the events table. This lists all the events users have performed between the two selected steps. At the top of the table, you can choose to look at the event list either for users who converted, or for users who dropped off.

The events table shows four relevant metrics for each event listed:
- Correlation Score: Correlation means there's a relationship between two things. In this context, the correlation column quantifies the relationship between the event in question and conversion (or drop-off), depending on which tab you selected (Converted or Dropped Off). The higher the score, the stronger the relationship.
- Frequency: The average number of times users fired a given event between the two selected funnel steps.
- % Who Did Event: The percentage (and absolute numbers) of users in the selected cohort who fired a given event.
- Time Between Steps: How long it took users who fired a given event to convert between the two selected funnel steps.
How Amplitude identifies events to include in a conversion drivers analysis
For users who convert, Amplitude looks at the events performed between the timestamps of the two selected funnel steps. For users who churn, Amplitude looks at the timestamps of the first selected funnel step, and their entry into the funnel plus the conversion window.
Imagine a funnel defined as A --> B --> C, and you wanted to investigate drivers of conversion at step C. The time periods analyzed for each set of users is shown below, where t() represents the timestamp of the event performed:
| Converted | Dropped-off |
| t(b), t(c) | t(b), t(a)+ conversion window |
Understand the correlation score
Correlation is a measure (ranging from -1 to 1) of how two variables relate to each other. In a conversion drivers analysis, the variables for each user are:
- whether the user performed the selected event; and
- whether the user was in the cohort you selected (converted or dropped off).
Click View Correlation data for a detailed confusion matrix (aka, prediction summary). This matrix shows the count and percentage of users in your base cohort who constitute:
- True Positives (TP, top left of matrix): Converted users predicted to perform the event
- False Positives (FP, top right): Dropped-off users predicted to perform the event
- False Negatives (FN, bottom left): Converted users predicted not to perform the event
- True Negatives (TN, bottom right): Dropped-off users predicted not to perform the event

You may have heard of different variations and definitions of correlation, including Matthews correlation, Pearson correlation, phi coefficient, and R-value. In this case, all these definitions are equivalent because a conversion drivers analysis looks at pairs of binary random variables.
Remember, correlation is not causation, so hypotheses generated by a conversion drivers analysis still must be tested and verified in the real world.
Note
Event properties and conversion drivers
When you look at combinations of attributes on an event, you get a more accurate picture of what a user is actually doing in your product, which leads to a more layered and nuanced analysis.
To use this feature, open a funnel chart and follow these steps:
- On the chart, find the event you’re interested in analyzing. Open the Microscope by clicking on either the top section (for churn) or the bottom section (for conversions). Then click on Explore Conversion Drivers. This will open the conversion drivers tab.

The conversion drivers tab lists every event included in your project, along with each event’s correlation with either conversion or churn. In this example, the Add Content to Cart event is very highly correlated (+0.97) with conversion on the Purchase Song or Video event.
Note
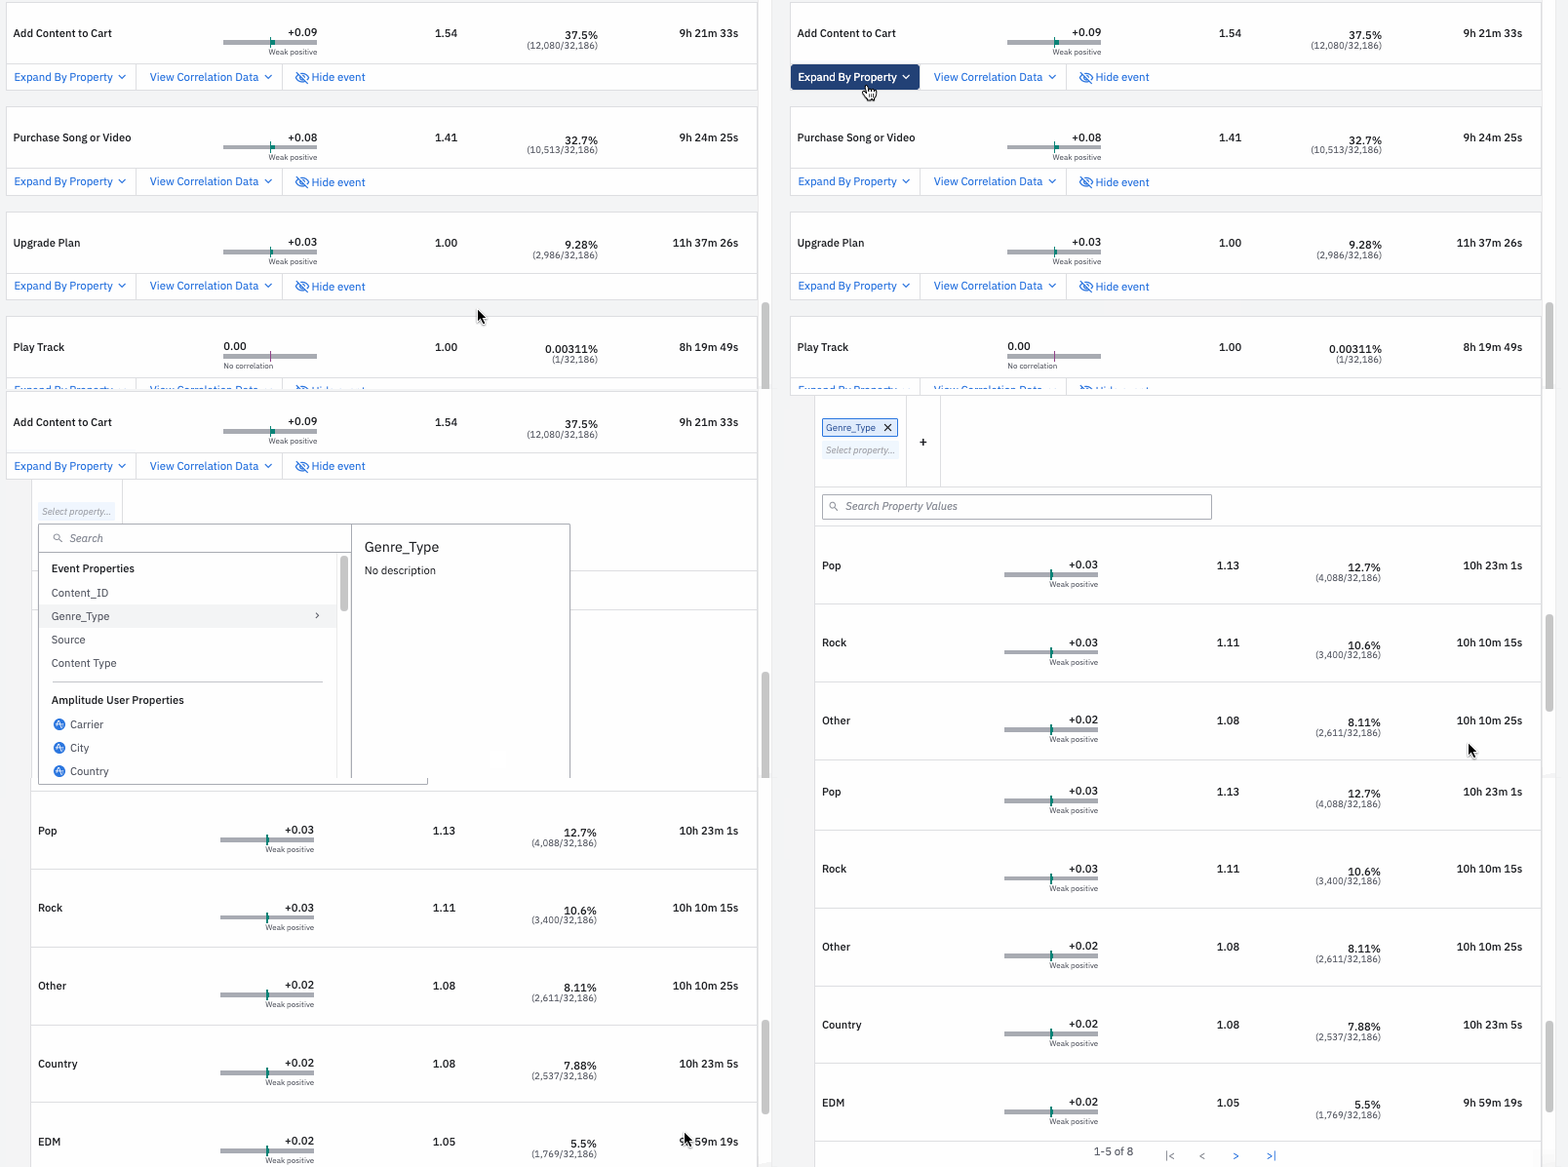
- Locate the event you’re interested in. Below the event name, click Expand by Property.
- Click the Select property … button and click the property you’re interested in analyzing.

In this example, we’re interested in finding out which genres are most frequently added to customers’ carts and then purchased—remember, we are looking at users who converted on Purchase Song or Video. Here, we see pop is the most popular genre, with a correlation of +0.41.
Note
Share the report
When you find a valuable insight using conversion drivers, you can easily share it with a teammate:
- Click Share.
- Click Copy Chart Link to copy the chart’s unique URL to your clipboard, from which you can send your analysis to others.
May 29th, 2024
Need help? Contact Support
Visit Amplitude.com
Have a look at the Amplitude Blog
Learn more at Amplitude Academy
© 2026 Amplitude, Inc. All rights reserved. Amplitude is a registered trademark of Amplitude, Inc.